BTC/USDT
Bitcoin dejó atrás una semana histórica. Las miradas estaban puestas en las elecciones de EE. UU. en la semana de desarrollos que afectaron considerablemente al mercado. D.Trump, quien llegó a la agenda con sus promesas sobre Bitcoin y el mercado cripto durante su campaña electoral, se convirtió en el 47º Presidente de los EE. UU. Inmediatamente después de este desarrollo, la reducción de 25 puntos básicos en la tasa de interés de la FED trajo nuevos niveles ATH en Bitcoin. En este proceso, el interés de los inversores institucionales, especialmente BlackRock y Microstrategy, destacó. En la perspectiva técnica diaria de BTC, se probó el anterior máximo histórico (ATH) de 73,750, ya que se rompió el nivel de Fibonacci 1 (71,497) que destacamos en el análisis anterior. El impulso alcista impulsado por fundamentos optimistas llevó el precio de BTC a un nuevo máximo histórico de 82,371. Al observar los osciladores técnicos, a diferencia de los gráficos horarios, se mueve en la zona de sobrecompra manteniendo la señal de compra en el gráfico diario. En la continuación del movimiento ascendente, puede aparecer el nivel de Fibonacci 1.618 (87,185). Aunque los desarrollos optimistas continúan manteniendo el precio en su pico, podríamos ser testigos de retrocesos con movimientos de corrección ocasionales.Soportes75,800 - 73,750 - 71,497Resistencias81,858 - 83,000 - 85,000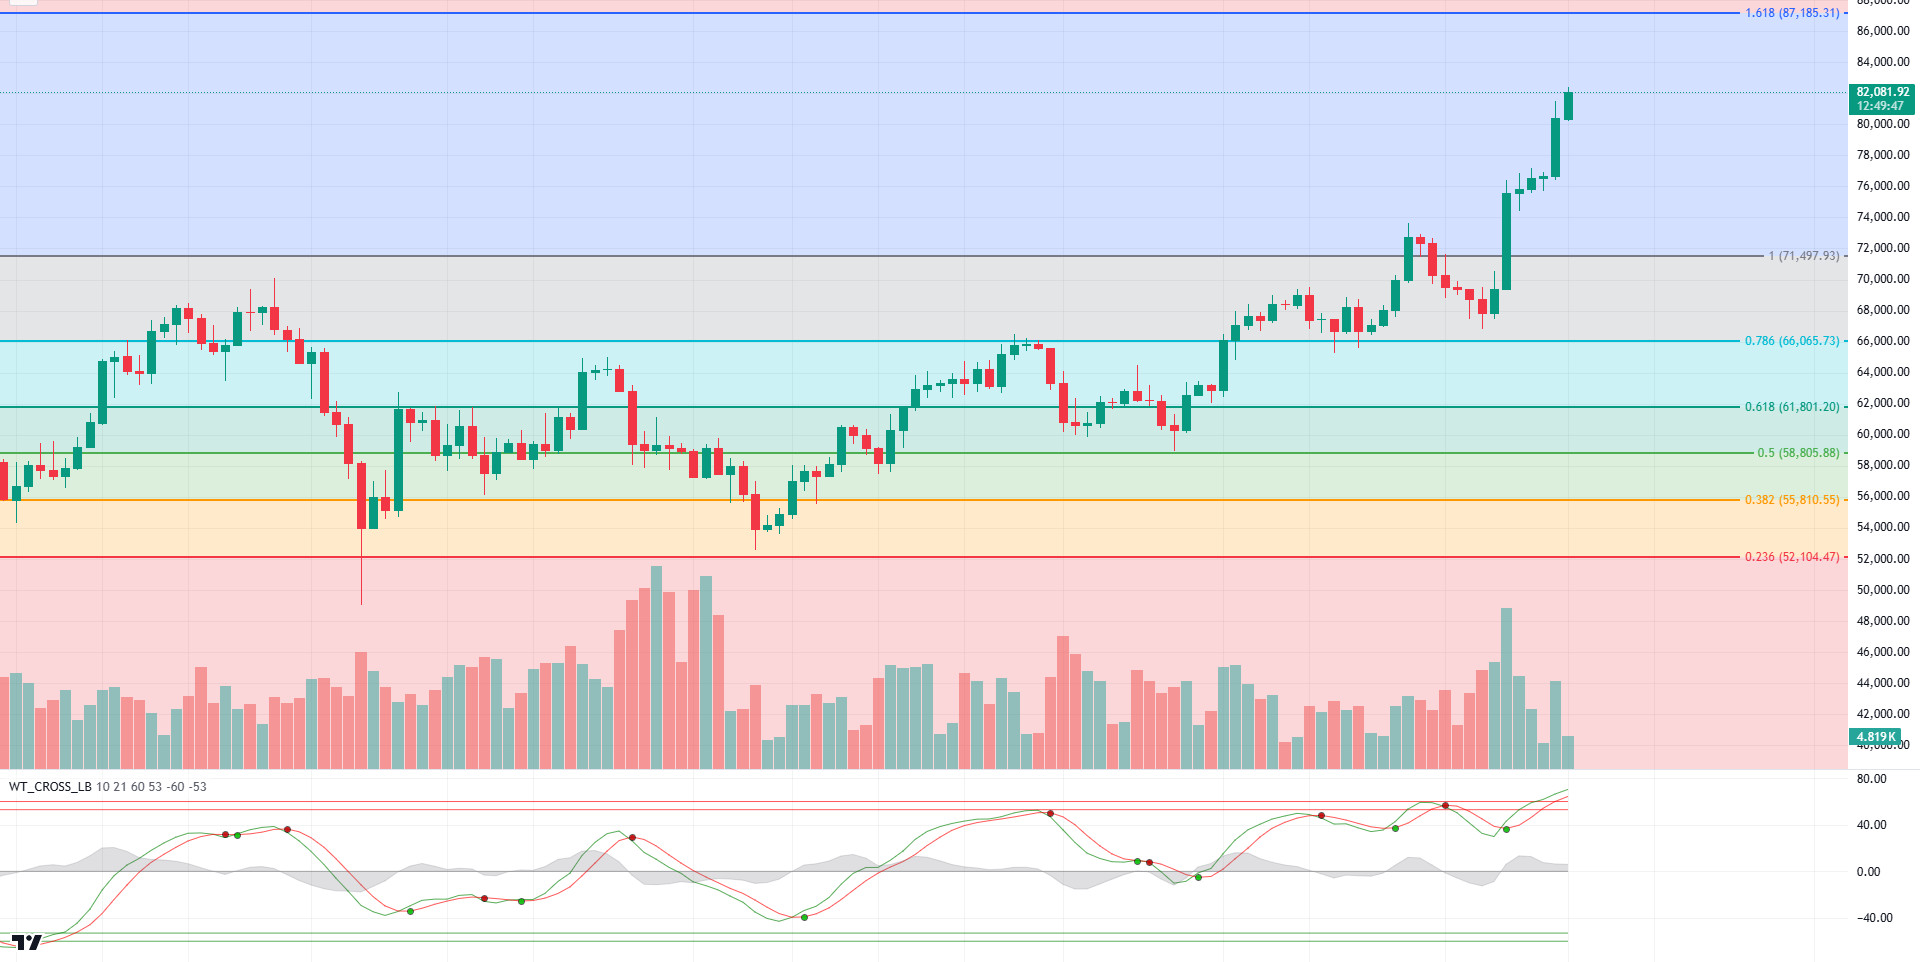
ETH/USDT
Con la victoria de Donald Trump en las elecciones presidenciales de EE. UU., el aumento en todos los mercados de riesgo ha afectado positivamente a ETH, permitiéndole superar niveles de resistencia importantes. Con este aumento, el incremento en el valor de MVRV puede ser uno de los puntos más importantes a tener en cuenta. Al observar los ciclos pasados de Ethereum, se ve que el valor de MVRV ha entrado en ciclos alcistas a largo plazo con el valor de MVRV superando los niveles de 1.25. Con este aumento, el valor de MVRV, que superó este nivel y subió a 1.65, muestra que los aumentos pueden continuar hasta los niveles de 2.2. Por otro lado, al analizar el gráfico de ETH/BTC, la pérdida del nivel de 0.04010 muestra que Bitcoin puede experimentar precios más altos y aumentos contra Ethereum por un tiempo. La recuperación del nivel especificado y la caída de la dominancia de Bitcoin por debajo del importante nivel de soporte del 58% pueden llevar a un aumento en la demanda del mercado de altcoins liderado por Ethereum. Si analizamos ETH técnicamente, uno de los primeros detalles que llama la atención es el valor del Chaikin Money Flow (CMF), que subió a +0.25. Considerando que ETH está mayormente respaldado por el lado spot en el Cumulative Volume Delta (CVD), se puede decir que hay un ciclo positivo para el mediano a largo plazo. Por otro lado, tanto la dominancia de BTC como el valor del Índice de Fuerza Relativa (RSI), que está en la zona de sobrecompra, pueden hacer que ETH se mueva lateralmente en el corto plazo o que corrija a niveles de 3.016. Superar la zona de 3.255 - 3.373 puede acelerar la tendencia alcista.Soportes3,016 - 2,952 - 2,780Resistencias3,255-3,373 - 3,558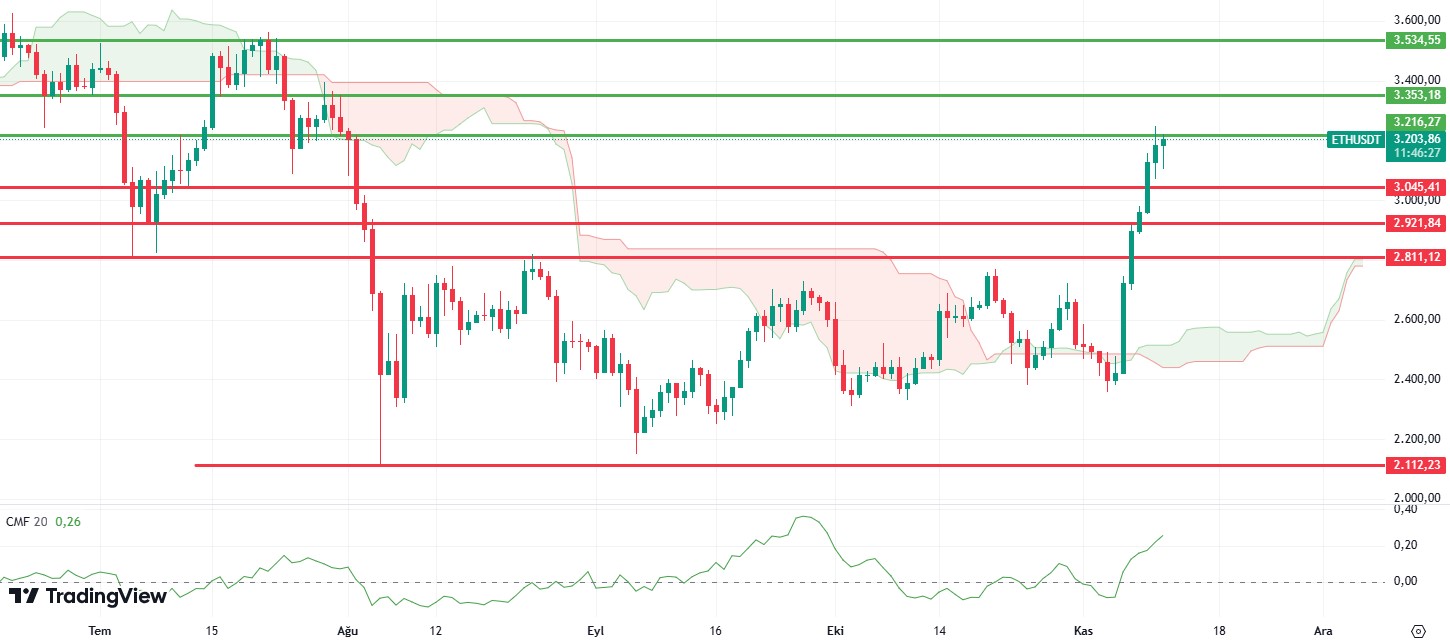
XRP/USDT
Ripple rompió la resistencia de 0.5276 con el reciente aumento y experimentó un ligero retroceso al venderse a 0.6188. Para XRP, donde se experimentan los efectos del doble pico y la divergencia negativa en el Índice de Fuerza Relativa (RSI) en el intervalo de tiempo diario, se puede esperar una nueva prueba al nivel de 0.5276 o una continuación del movimiento horizontal a corto plazo. Con cierres por encima de 0.6526, podemos ver la continuación de los aumentos. Estructuras positivas en el Chaikin Money Flow (CMF) y el momentum indican que el aumento puede continuar incluso después de la posibilidad de una nueva prueba.Soportes0.5276 - 0.4647 - 0.4087Resistencias0.6526 - 0.7405 - 0.7990
SOL/USDT
En las elecciones de EE. UU. de la semana pasada, Trump superó los 270 delegados y se convirtió en presidente según resultados no oficiales. Después de estos resultados, el mercado de criptomonedas comenzó a subir. Las promesas pro-crypto fueron el centro de la campaña de Donald Trump para 2024, pero queda por ver qué cambios enfrentará la comunidad cripto ahora que Trump está de vuelta en el cargo. Vale la pena recordar que en 2021, Trump expresó una opinión despectiva sobre Bitcoin, diciendo a Fox Business que la primera criptomoneda del mundo "parece un fraude". Después de estos resultados, el mercado de criptomonedas reaccionó de manera muy positiva, aumentando un 22.81% la semana pasada para alcanzar una capitalización de mercado de 2.74 billones. La FED recortó las tasas de interés en 25 puntos básicos a 4.50-4.75%. Powell dijo que los riesgos para los objetivos siguen "aproximadamente equilibrados" y que deben ser cautelosos ante las presiones inflacionarias y harán todo lo posible por no desviarse del objetivo del 2%. Otro desarrollo importante fue que las solicitudes de desempleo en EE. UU., que se anunciaron como 218,000, mostraron un aumento moderado, llegando a 221,000. La próxima semana, los datos de inflación de EE. UU. serán importantes. En el ecosistema de Solana, experimentó un aumento significativo en el volumen de transferencias on-chain, alcanzando un pico de aproximadamente $224 mil millones en solo un día. Por otro lado, NFT superó a Ethereum en el mercado de regalías, ganando una participación del 51%. Más allá de la dominancia del mercado, el éxito de Solana en el sector NFT aumentará la demanda de SOL y fortalecerá la confianza de los inversores. El TVL de la cadena aumentó en más de $7.48 mil millones. La relación de Open Interest (OI) también ha aumentado significativamente. Actualmente, OI ha alcanzado su nivel más alto desde el 1 de abril en $4.44 mil millones. El mercado de memecoins en Solana ha alcanzado un hito sorprendente, con la capitalización de mercado total saltando un 30% la semana pasada a un máximo histórico de $12 mil millones. Lanzada en enero de 2024, la plataforma Pump.fun se convirtió rápidamente en un trampolín para memecoins en la blockchain. Desde su creación, la plataforma ha atraído mucha atención y la capitalización de mercado total de las monedas creadas en el ecosistema Pump.fun alcanzó recientemente los $3 mil millones, un máximo histórico para el ecosistema. Hasta ahora, se han lanzado casi 3 millones de proyectos en la plataforma. Esto explica el aumento en el volumen del ecosistema. La próxima semana, los datos de inflación de EE. UU. serán importantes. Técnicamente, SOL está valorado en 215.45, un aumento del 5.06% en las últimas 24 horas. En nuestro gráfico diario, el 50 EMA (Línea Azul) continúa acelerándose hacia arriba desde el 200 EMA (Línea Negra). Esto muestra que la tendencia es alcista. El nivel de 185.60, que es una fuerte resistencia, está funcionando como soporte después de haber sido roto por una vela volumétrica la semana pasada. Este es un nivel de soporte importante para la continuación de la tendencia alcista. Al mismo tiempo, el Índice de Fuerza Relativa (RSI) está en niveles de sobrecompra de 14. Esto aumenta la posibilidad de un retroceso en el precio. Sin embargo, al analizar el indicador Chaikin Money Flow (CMF)20, los flujos son positivos y los ingresos continúan aumentando. Si los resultados positivos en los datos macroeconómicos y los desarrollos positivos en el ecosistema continúan, puede probar el primer nivel de resistencia importante de 228.35. En caso de caídas debido a desarrollos políticos o noticias negativas en el ecosistema de Solana, se puede seguir el nivel de 185.60 y determinar un punto de compra.Soportes209.39 - 185.60 - 180.45Resistencias228.35 - 241.14 - 257.97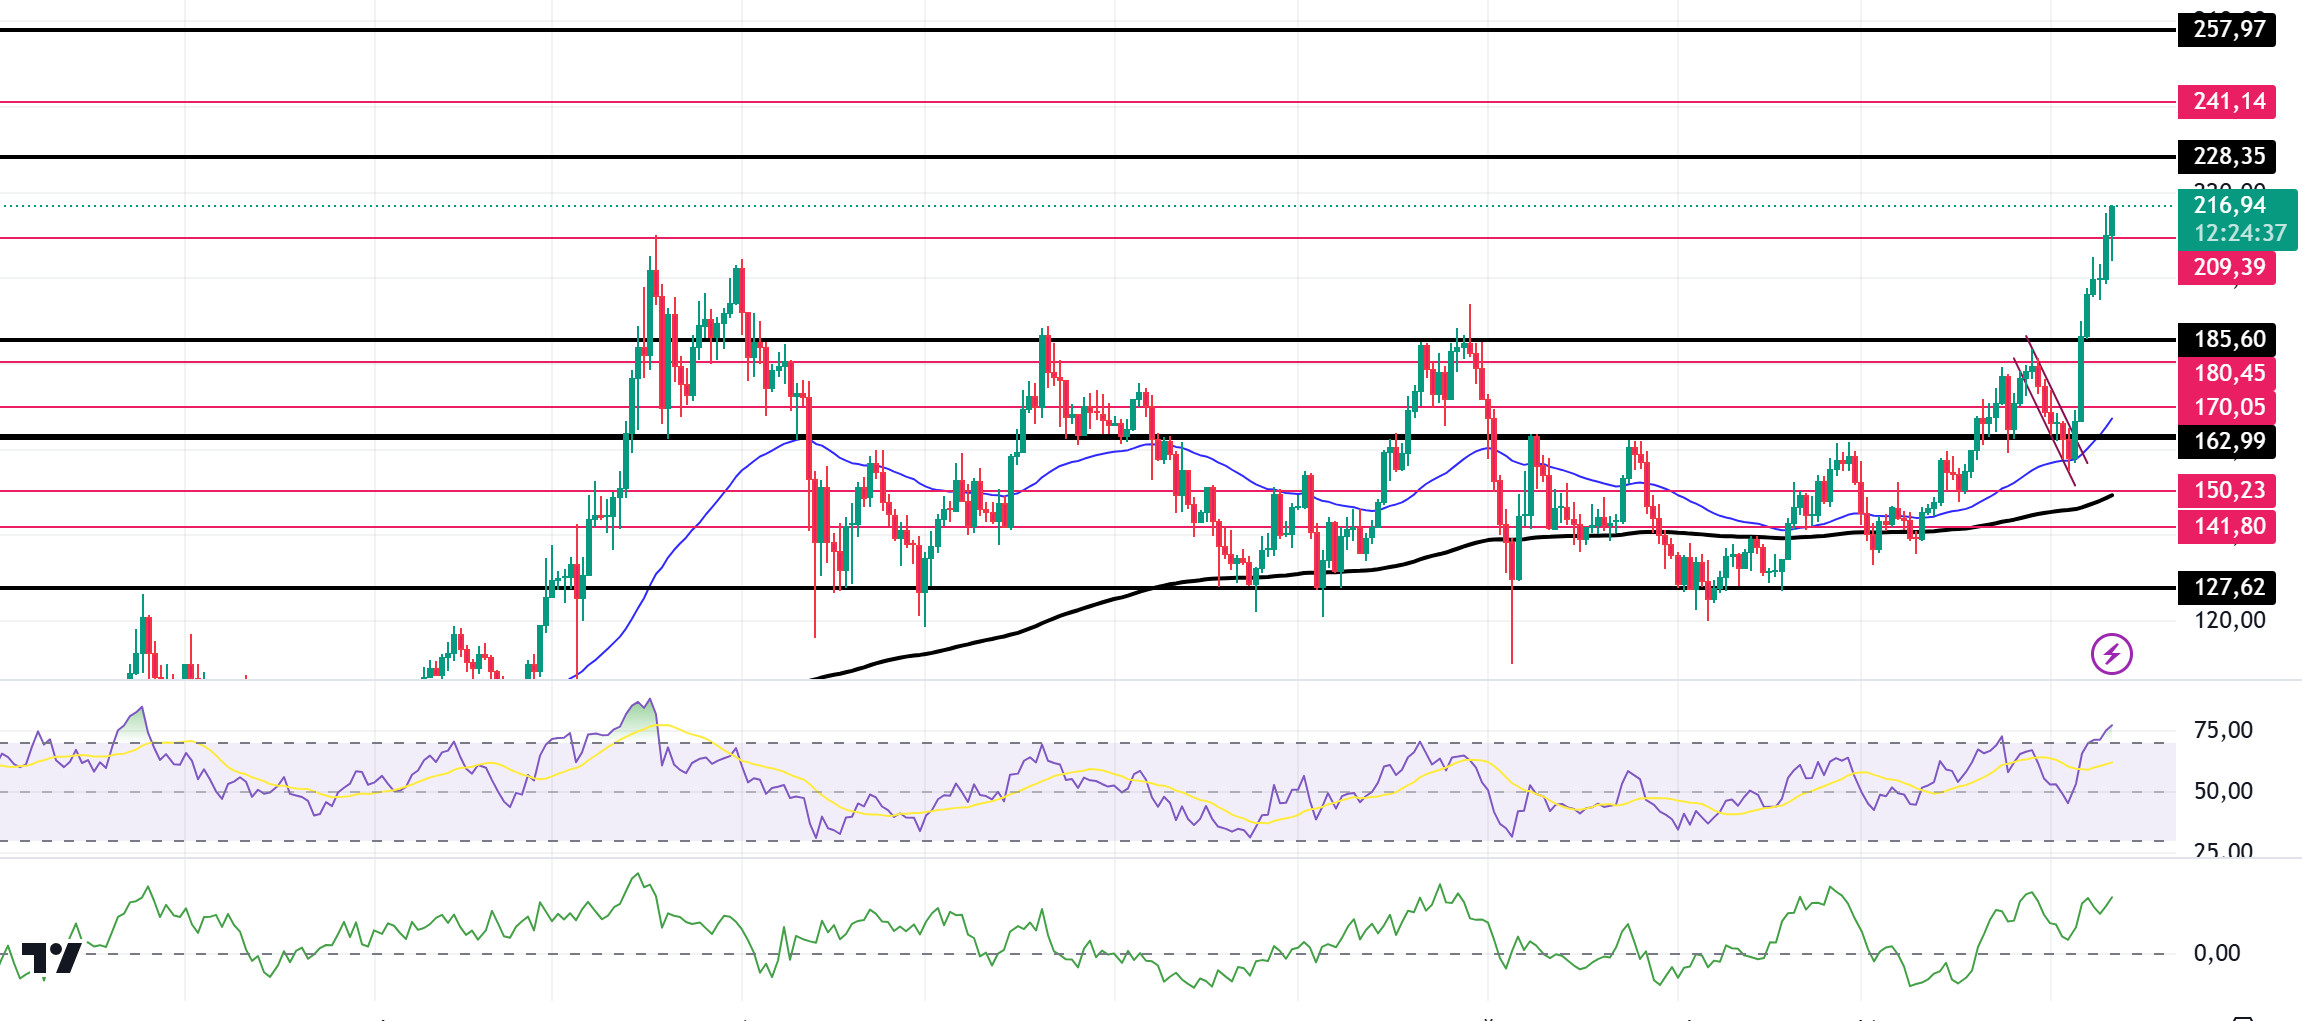
ADA/USDT
En las elecciones de EE. UU. de la semana pasada, Trump superó los 270 delegados y se convirtió en presidente según resultados no oficiales. Después de estos resultados, el mercado de criptomonedas comenzó a subir. Las promesas a favor de las criptomonedas fueron el centro de la campaña de Donald Trump para 2024, pero queda por ver qué cambios enfrentará la comunidad cripto ahora que Trump está de vuelta en el cargo. Vale la pena recordar que en 2021, Trump expresó una opinión despectiva sobre Bitcoin, diciendo a Fox Business que la primera criptomoneda del mundo "parece una estafa". Después de estos resultados, el mercado de criptomonedas reaccionó de manera muy positiva, aumentando un 22.81% la semana pasada para alcanzar una capitalización de mercado de 2.74 billones. La FED recortó las tasas de interés en 25 puntos básicos a 4.50-4.75%. Powell dijo que los riesgos para los objetivos siguen "aproximadamente equilibrados" y que deben ser cautelosos ante las presiones inflacionarias y harán todo lo posible por no desviarse del objetivo del 2%. Otro desarrollo importante fue que las solicitudes de desempleo en EE. UU., que se anunciaron como 218,000, mostraron un aumento moderado, llegando a 221,000. La próxima semana, los datos de inflación de EE. UU. serán importantes. En el ecosistema de Cardano, la Fundación planea vender $500 millones de ADA. La comunidad está pidiendo un presupuesto equilibrado para la estabilidad en medio de los cambios del mercado. También está dividida sobre Charles Hoskinson en medio de acusaciones de 'cáncer de Cardano'. En un video informativo compartido por Plutus Staking, Hoskinson enfatizó su "compromiso financiero significativo con el desarrollo de ADA. Invirtió recursos significativos desde el principio para financiar contratos de desarrollo. Declaró que su inversión personal total en Cardano es ahora de $450 millones. Esta inversión ha sido crucial para el crecimiento de la blockchain desde su inicio." Las tasas de financiación también han aumentado significativamente en la cadena. En el momento de escribir, esta tasa es ahora del 0.0217%. Esto muestra que los traders de derivados están abriendo cada vez más nuevas posiciones largas en Cardano. El 6 de noviembre, se desbloquearon 18.53 millones de tokens en ADA. Mientras tanto, continúa preparándose para la segunda fase de Chang, una actualización crucial diseñada para implementar las últimas características de gobernanza en cadena mínima viable. El aumento comenzó con el lanzamiento de Node 10.1, una actualización importante que introduce nuevas capacidades de gobernanza y prepara la red para el próximo hard fork Chang 2. Node 10.1.1 es el primer nodo de mainnet que soporta el hard fork cruzado Chang 2, un paso crucial en la evolución de la gobernanza de Cardano. El lanzamiento también introduce opciones de autorización avanzadas, permitiendo a los operadores de pools de participación (SPOs) autorizar opciones de votación predefinidas. Estos desarrollos han elevado el optimismo de que el precio de Cardano podría aumentar en las próximas semanas a medida que la red consolida su infraestructura y se prepara para nuevas funcionalidades. Mientras tanto, los scripts de Plutus aumentaron en 3,358, alcanzando un total de 91,698. El número total de transacciones aumentó en 0.98 millones en comparación con el mes pasado, alcanzando un total de 97.92 millones. En el ecosistema de Cardano, los datos de Open Interest de ADA muestran que subió de $217.71 millones el miércoles a $329.01 millones el viernes, el nivel más alto desde mediados de abril. Este aumento constante en la actividad de direcciones y transacciones de ballenas sugiere que la confianza del mercado está creciendo, con un posible FOMO (miedo a perderse algo) acumulándose entre los inversores. A medida que Cardano navega en esta ola alcista, la comunidad está observando de cerca para ver si el impulso continuará. Según el proveedor de datos en cadena, el número de transacciones de ADA que superan los $100,000 por día se ha disparado. El jueves, se realizaron 697 de estas transacciones. Todos estos datos explicaron el aumento. Técnicamente, ADA tiene un precio de 0.5917, subiendo un 1.70% en las últimas 24 horas. Al observar el gráfico diario, el 50 EMA (Línea Azul) se mantiene por debajo del 200 EMA (Línea Negra), pero la diferencia entre los dos promedios se ha estrechado mucho. Esto señala que podría moverse de un mercado bajista a un mercado alcista. Cuando miramos las zonas de liquidez de ADA, hay un lugar de liquidez importante en $0.6460. Al observar el indicador Chaikin Money Flow (CMF)20, los flujos de dinero comenzaron a disminuir, aunque de manera positiva. El Índice de Fuerza Relativa (RSI)14 está en la zona de sobrecompra. Al mismo tiempo, la divergencia llama la atención. Esto podría traer ventas de ganancias. En caso de posibles condiciones macroeconómicas y desarrollos negativos en el ecosistema de Cardano y la continuación de la tendencia bajista, se puede seguir 0.4893 como un fuerte soporte. En caso de una continuación de la tendencia alcista, se debe seguir 0.7756 como una fuerte resistencia.Soportes0.5799 - 0.4893 - 0.4292Resistencias:0.6148 - 0.6495 - 0.6829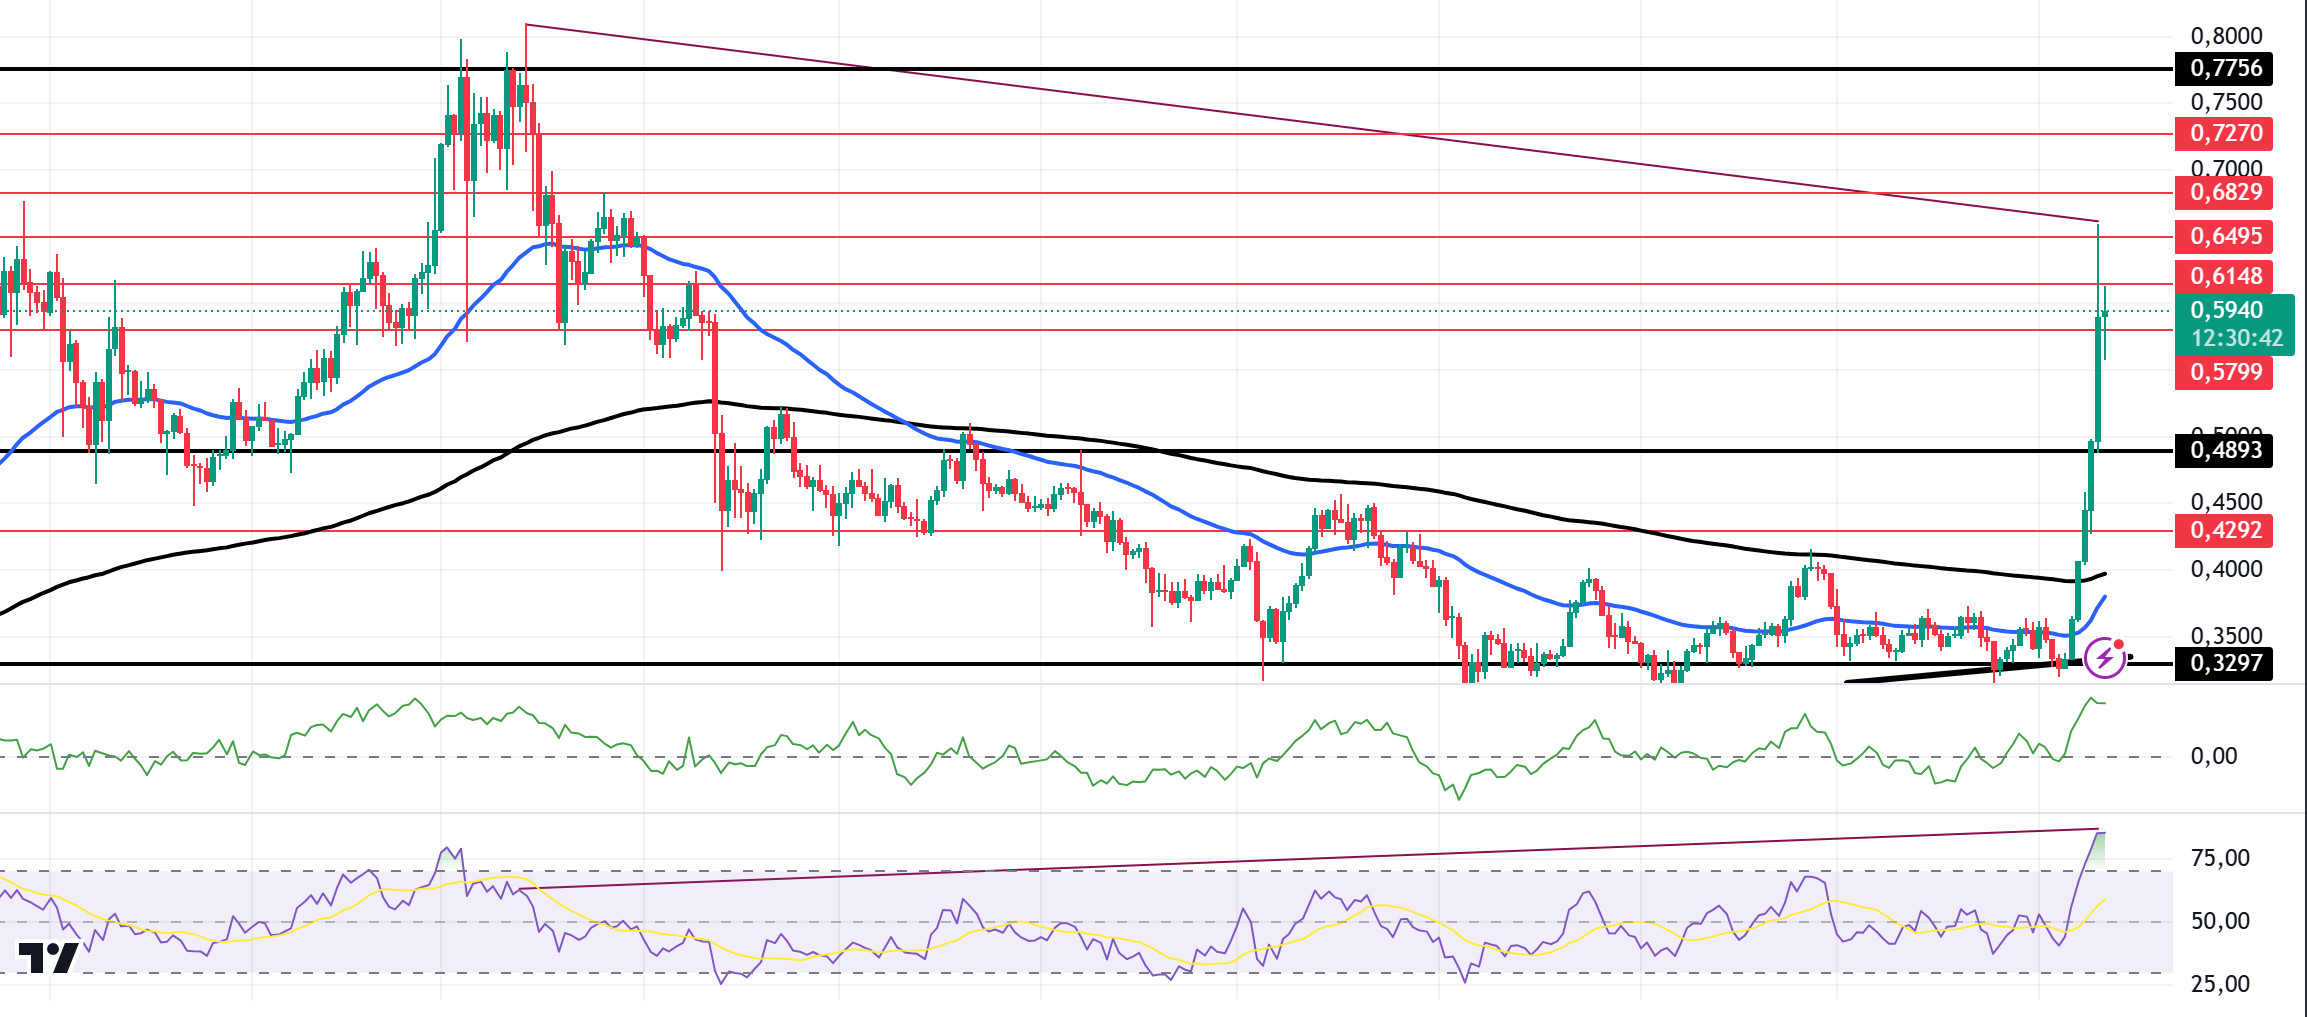
DOT/USDT
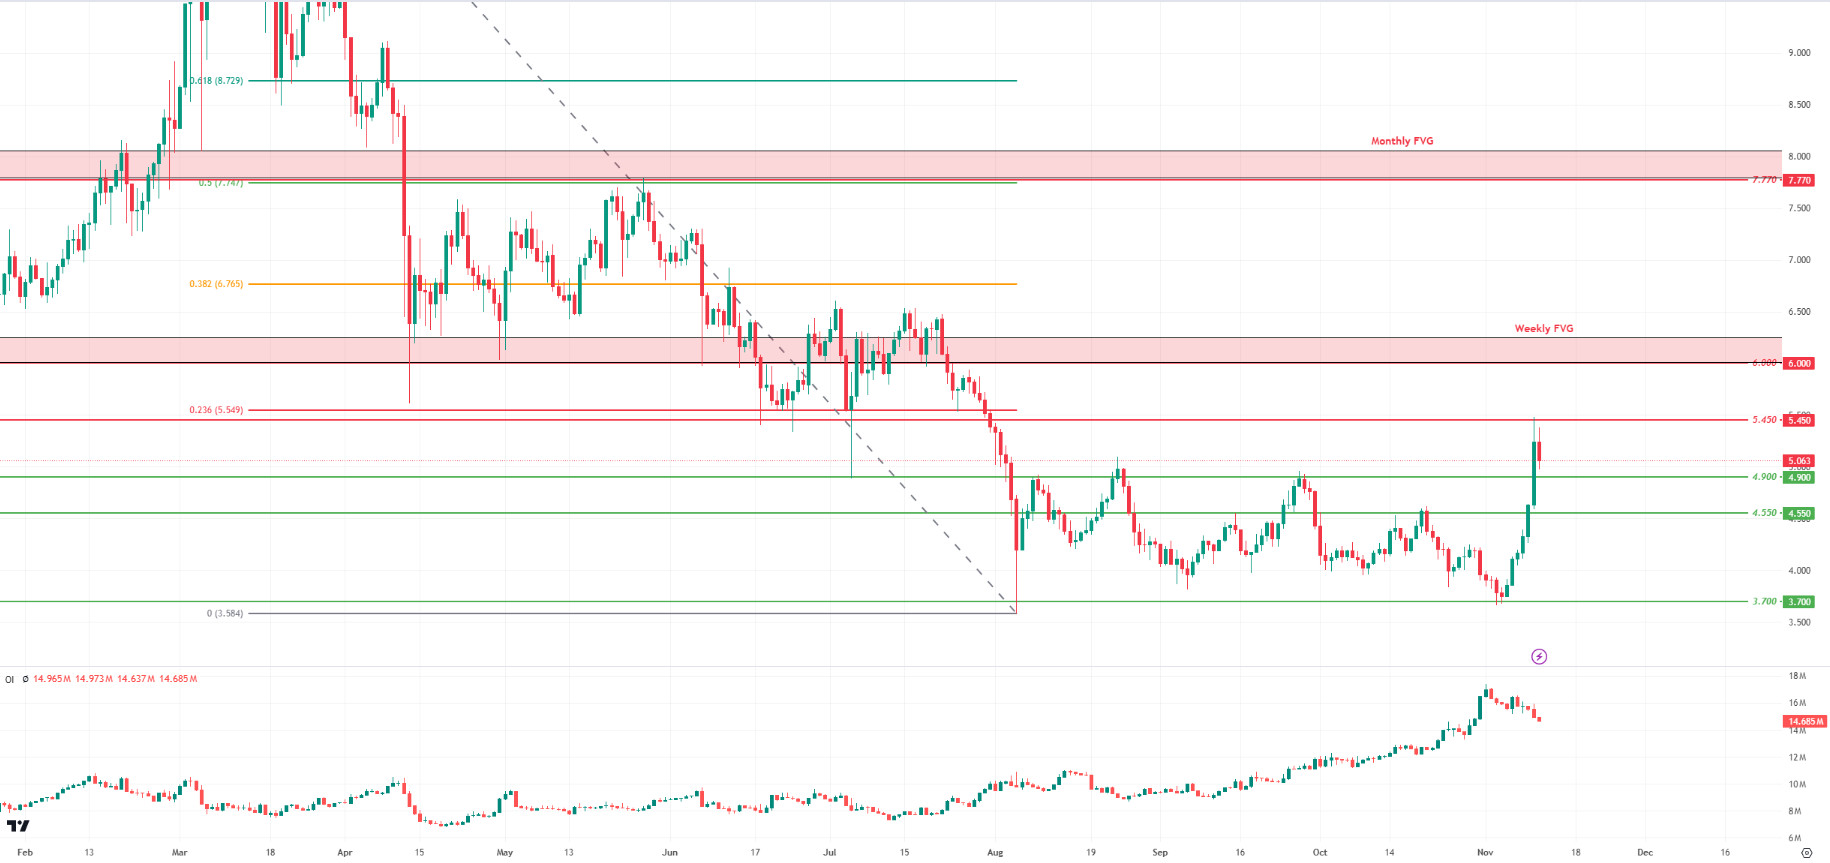
La Academia de Blockchain de Polkadot tiene como objetivo dar un nuevo impulso a la educación en Web3 con el programa en línea PBA-X que comenzará en 2025. Con el lanzamiento de su red principal en Polkadot, Hyperbridge ha ampliado las posibilidades de comunicación segura y escalable entre cadenas. Una asociación con SP Negócios en São Paulo apoyará la educación en blockchain y soluciones innovadoras. Además, en el evento Sub0 Reset, Gavin Wood anunció que el protocolo JAM de Polkadot dará pasos significativos en la escalabilidad de Web3. Estas iniciativas podrían reforzar el liderazgo de Polkadot en tecnología y educación, al tiempo que aumentan el interés en el ecosistema y atraen a más desarrolladores al proyecto. Al analizar técnicamente a Polkadot (DOT), logró superar el nivel de $81,900, una resistencia psicológica, mientras que Bitcoin alcanzó el nivel de $5,450. Sin embargo, se puede observar a partir del oscilador de Interés Abierto (OI) que DOT, que retrocedió del nivel de 5,450, experimentó una disminución en las posiciones abiertas en esta región. Esto sugiere que el nivel de 5,450 puede considerarse como una fuerte resistencia. Si el apetito comprador continúa y el precio rompe la presión de venta en 5,450, el siguiente objetivo probablemente será el nivel de $6. Este nivel puede constituir un punto de resistencia importante, ya que coincide con el nivel de Fibonacci 0.236 y el área de Fair Value Gap (FVG) semanal. Por otro lado, si el precio no logra superar el nivel de 5,450, podría ser posible un retroceso hacia el área de soporte en 4,900.Soportes4,900 - 4,550 - 3,700Resistencias5.450 - 6.000 - 7.770