
Active Adresses
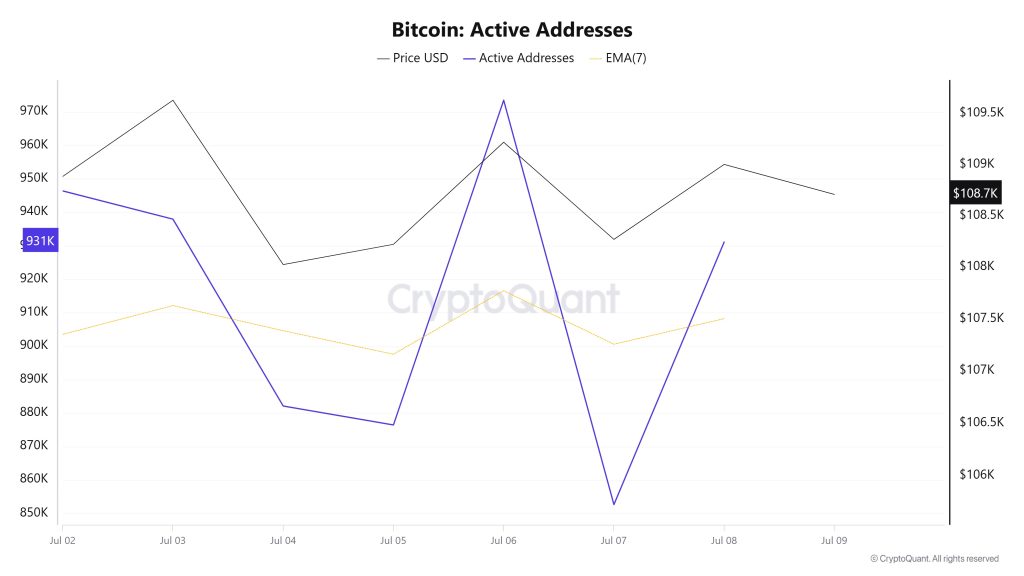
Between July 2 and July 9, 973,476 active addresses were added to the Bitcoin network. During this time, the Bitcoin price rose as high as $109,000. On July 3, there was a drop en the number of active addresses, while Bitcoin saw a rise of $109,000. When the 7-day simple moving average (SMA) is analyzed, it is observed that the price follows an upward trend el the dates when this average crosses the price. This indicates that there is pressure to buy.
Active Sending Addresses

Between July 2 and July 9, there was a sideways movement en active shipping addresses. On the day of the price high, active sending addresses rose as high as 711,222, indicating that Bitcoin active address inflows were considering the $108,000 level. As a result, the ‘Active Sending Addresses’ metric was generally flat.
Active Receiving Addresses
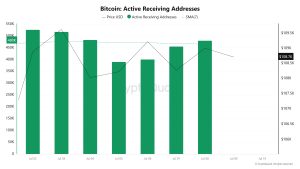
Between July 2nd and July 9th, there was a regular rise en active buying addresses with the Black Line (price line). On the day when the price reached a high level, active receiving addresses rose to 517,280 levels; It shows that buyers bought Bitcoin at $109,000 levels.
Breakdowns
MRVR
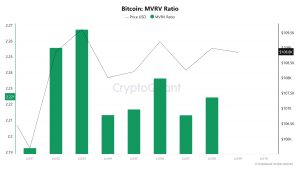
On July 2, Bitcoin price was at 108,882 while MVRV Ratio was at 2.256. As of July 8, the Bitcoin price rose 0.11% to 108,999, while the MVRV Ratio fell 1.41% to 2,224.
Realized Price
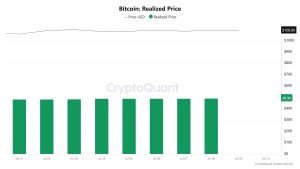
On July 2, Bitcoin price was at 108,882 while Realized Price was at 48,261. As of July 8, the Bitcoin price increased por 0.11% to 108,999, while the Realized Price increased por 1.52% to 48,996.
Spent Output Profit Ratio (SOPR)
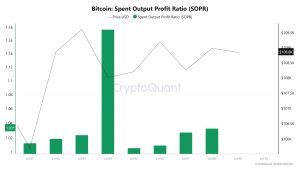
On July 2, the Bitcoin price was at 108,882 while the SOPR metric was at 1,019. As of July 8, the Bitcoin price rose to 108,999, an increase of 0.11%, while the SOPR metric rose to 1,033, an increase of 1.37%.
Derivatives
Open Interest
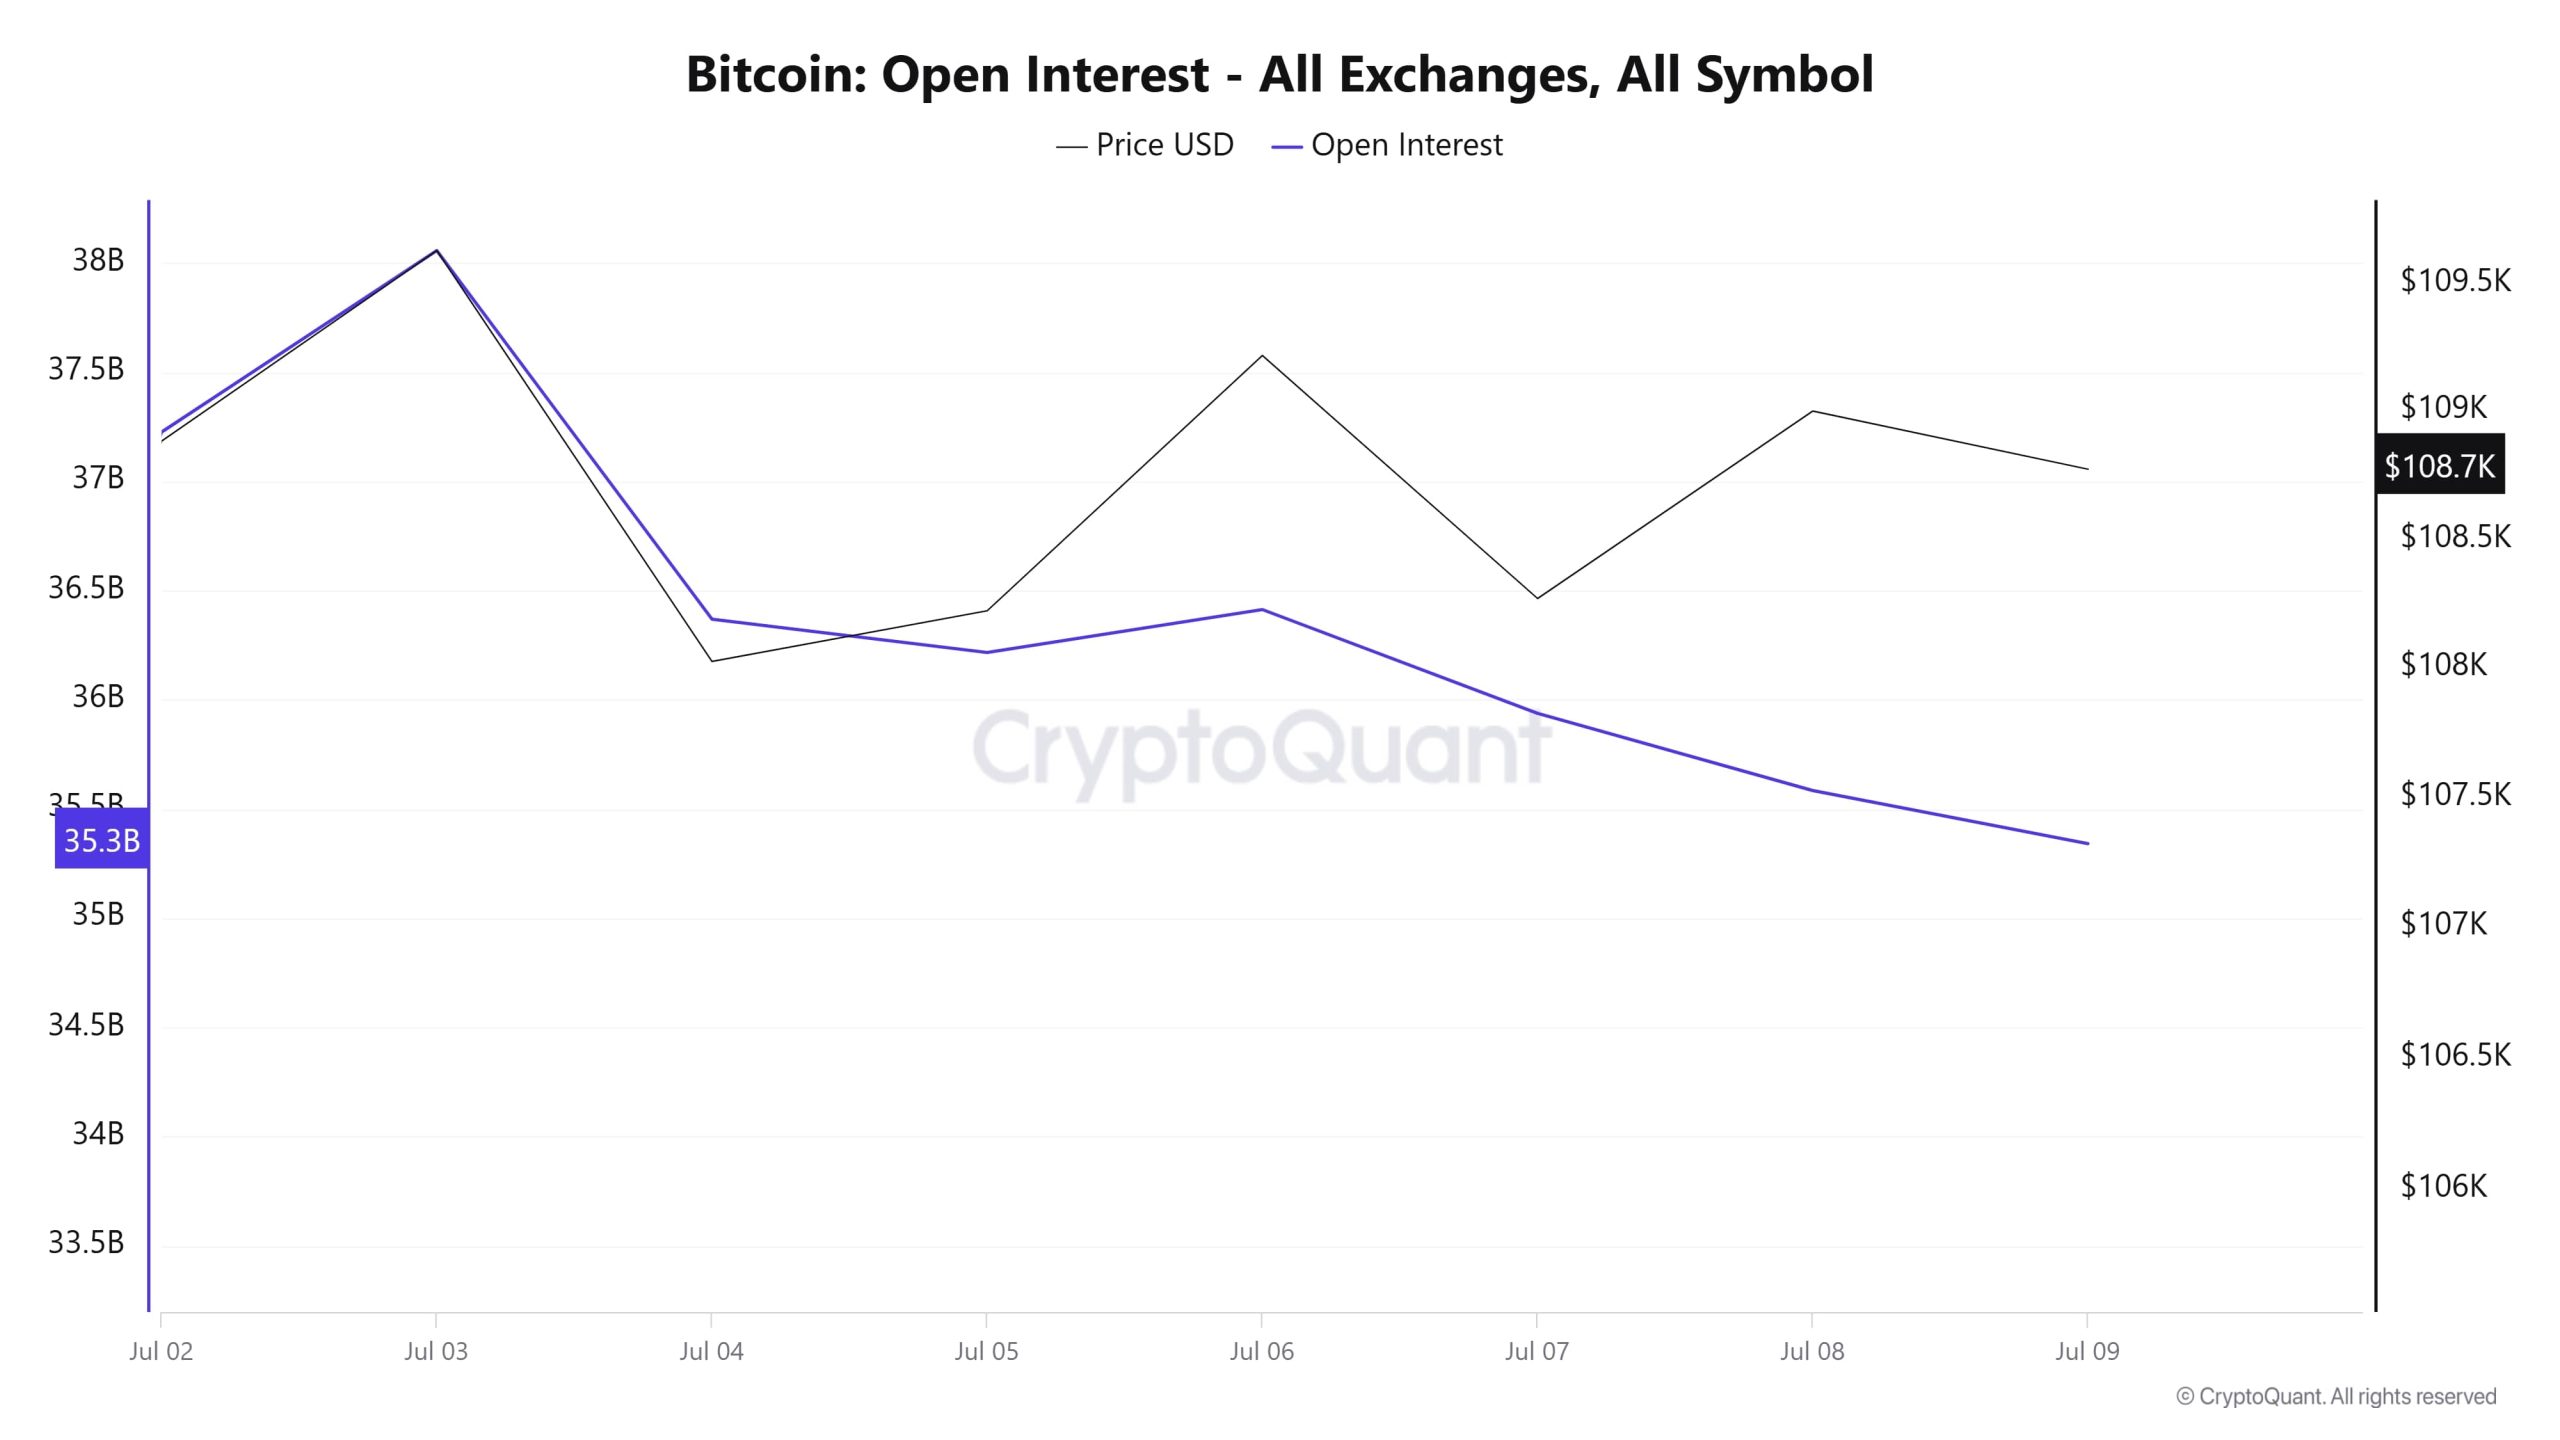
Open interest data en the Bitcoin futures markets has been showing a significant downward trend since July 2. Open positions, which initially started at $37 billion, rose sharply el July 3 to more than $38 billion. However, the sharp decline that followed this sudden increase suggests that investors are aggressively closing positions en this region or liquidations have come into play. After July 4, although the price showed a recovery trend, open interest could not regain upward momentum. While there is a fluctuating trend el the price side, the continuous decline en open interest is noteworthy. This divergence indicates that short-term speculative positions are decreasing and the market is en a cautious mode.
As of July 9, open interest has declined to 35.3 billion dollars. This value is quite low compared to the peak el July 3. While the price managed to hold around $108,700, the decline en open interest suggests that the market lacks volume support for upside moves. This structure usually generates a weak signal for price sustainability. In short, even though the market price remains flat or slightly up, there is a period of reduced appetite el the buy side and leveraged trades. This suggests that there may be an increase en volatility or sudden changes en direction en the coming days.
Funding Rate
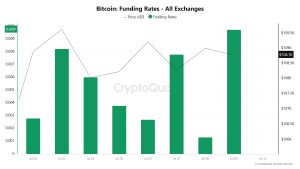
The fluctuations en Bitcoin’s funding rate data en recent days clearly reveal the ups and downs en market sentiment. Starting from low levels el July 2, the funding rate jumped significantly el July 3, showing a strong increase en positive territory. This rise indicates that the appetite for long positions has increased and the market is expecting a short-term rise. However, immediately after this increase, the price started to decline el July 4, suggesting that these long positions did not find strong enough support and the market overheated en the short term.
On July 5 and 6, funding rates fell back to low levels and prices tended to recover. This divergence suggests that investors are becoming cautious and avoiding leveraged long positions. However, el July 7, funding rates returned to strongly positive territory, indicating that short-term bullish sentiment was regaining strength. On July 8, this ratio fell sharply again, but as of today, it is el the rise again. This reflects the fact that market participants are once again heavily long and are very optimistic about a price rally. However, the fact that funding rates have risen to such high positive levels suggests that the market is overcrowded and that these positions may be liquidated quickly en a possible correction. In summary, there is a near-greedy appetite en the market again, but this structure also suggests that short-term risks have increased.
Long & Short Liquidations
With the BTC price moving between $105,000 and $110,000, $124 million worth of long and $196 million worth of short transactions were liquidated.
| Date | Long Amount (Million $) | Short Amount (Million $) |
|---|---|---|
| July 02 | 9.32 | 104.58 |
| July 03 | 16.78 | 35.54 |
| July 04 | 29.28 | 3.35 |
| July 05 | 0.39 | 1.35 |
| July 06 | 3.67 | 33.31 |
| July 07 | 60.57 | 3.56 |
| July 08 | 4.67 | 14.78 |
| Total | 124.68 | 196.47 |
Supply Distribution
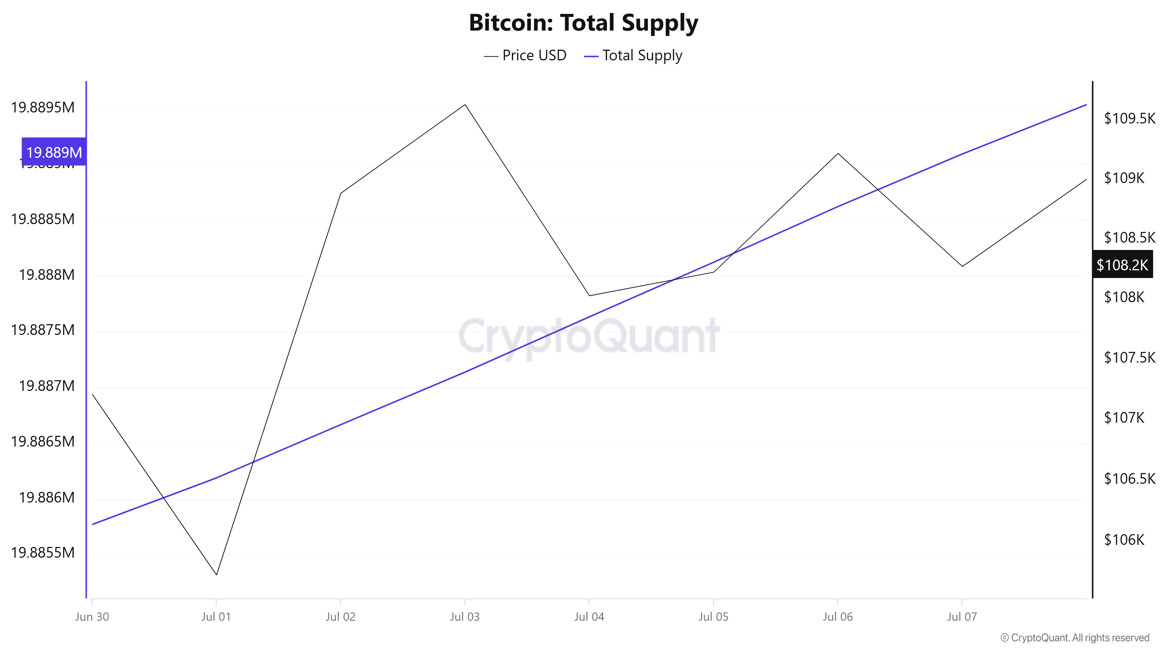
Total Supply: reached 19,889,096 units, up about 0.016% from last week.
New Supply: The amount of BTC produced this week was 3,329.
Velocity: Velocity, which was 12.79 last week, was 12.70 as of July 7.
| Wallet Categoría | 30.06.2025 | 07.07.2025 | Change (%) |
|---|---|---|---|
| < 1 BTC | 8.4707% | 8.4664% | -0.0508% |
| 1 – 10 BTC | 11.4290% | 11.4187% | -0.0901% |
| 10 – 100 BTC | 24.6580% | 24.6677% | 0.0393% |
| 100 – 1k BTC | 28.9932% | 29.0837% | 0.3121% |
| 1k – 10k BTC | 18.3194% | 18.3033% | 0.0879% |
| 10k+ BTC | 8.1292% | 8.0597% | 0.8549% |
According to the latest weekly data, there was a limited decrease of -0.05% en <1 BTC wallets, while a decrease of -0.09% was observed en the 1-10 BTC range. Slight increases of +0.04% were observed en the 10-100 BTC segment and +0.31% en the 100-1k BTC range. A limited decline of -0.09% stood out en the 1k-10k BTC group, while a more pronounced decline of -0.86% was seen en the 10k+ BTC category.
Exchange Reserve
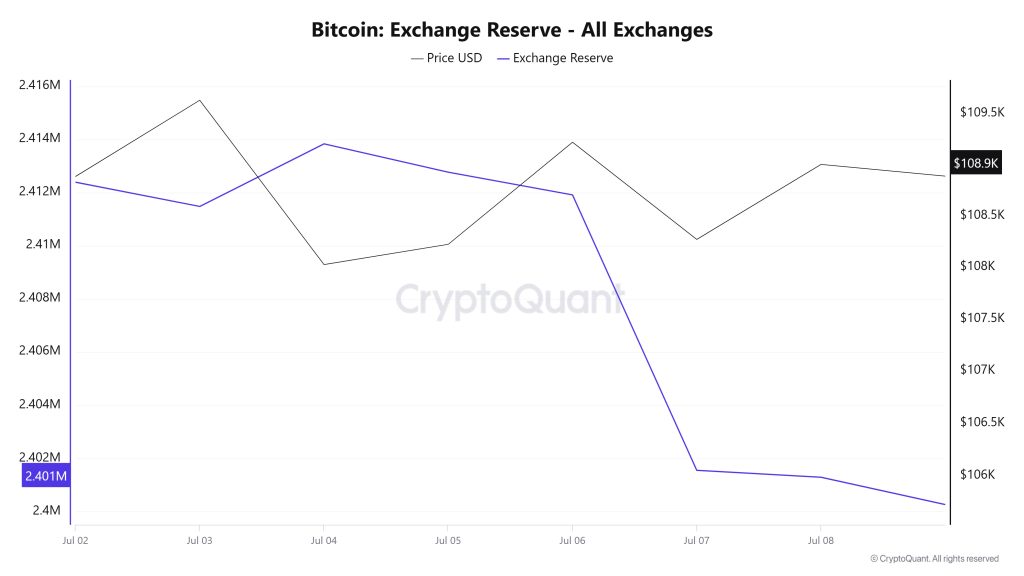
Between July 2-8, 2025, Bitcoin reserves el exchanges decreased from 2,412,385 BTC to 2,401,285 BTC. In total, there was a net outflow of 11,100 BTC during this period, reducing exchange reserves por about 0.46%. The Bitcoin price gained 0.1% during the same period, with a limited increase from $108,882 to $109,000. While the net outflow of investors from the stock exchanges continues, the stable course of prices indicates cautious optimism en the market. If this trend continues next week, the reduction en exchange reserves could have a positive impact el the Bitcoin price.
| Date | 2-Jul | 3-Jul | 4-Jul | 5-Jul | 6-Jul | 7-Jul | 8-Jul |
|---|---|---|---|---|---|---|---|
| Exchange Inflow | 32,197 | 21,402 | 23,105 | 7,280 | 9,471 | 26,377 | 19,381 |
| Exchange Outflow | 35,282 | 22,314 | 20,750 | 8,346 | 10,326 | 36,738 | 19,642 |
| Exchange Netflow | -3,084 | -912 | 2,355 | -1,066 | -855 | -10,361 | -260 |
| Exchange Reserve | 2,412,385 | 2,411,473 | 2,413,828 | 2,412,762 | 2,411,907 | 2,401,545 | 2,401,285 |
| BTC Price | 108,882 | 109,629 | 108,026 | 108,222 | 109,217 | 108,270 | 109,000 |
Fees and Revenues
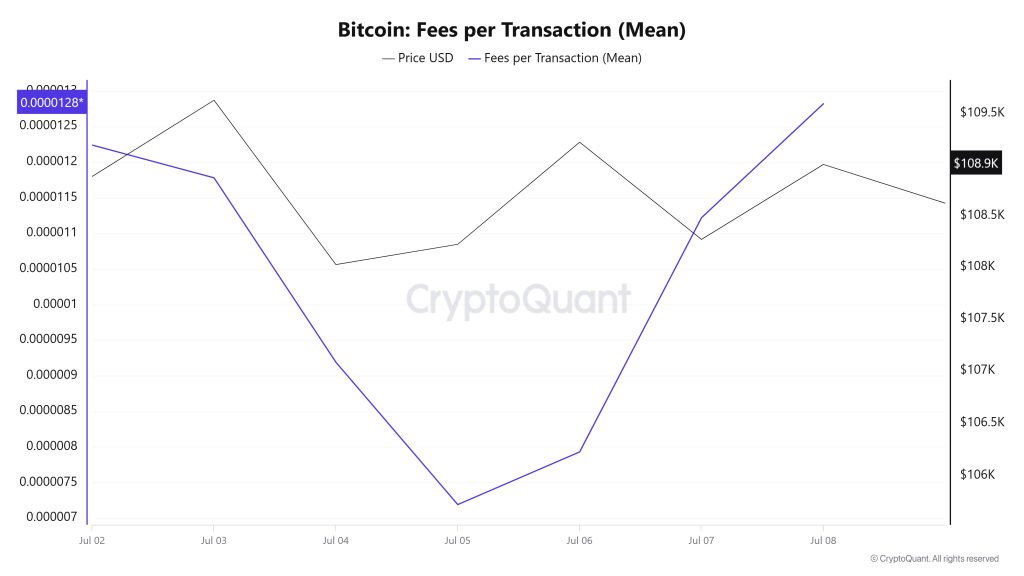
Between July 2 and July 8, Bitcoin Fees per Transaction (Mean) data shows that this indicator was at 0.00001224 el July 2, the first day of the week.
As of this date, a downward trend was observed due to the volatile movements en the Bitcoin price; As of July 5, it fell to 0.00000719, reaching the lowest level of the week.
In the following days, Bitcoin Fees per Transaction (Mean) started to rise again and closed at 0.00001282 el July 8, the last day of the week.
Bitcoin: Fees (Total)
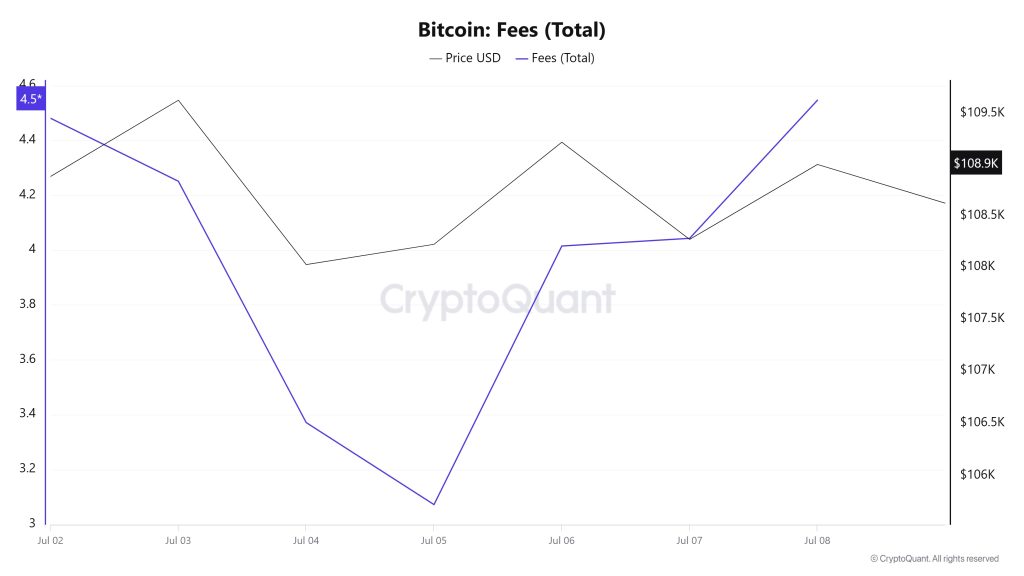
Similarly, when Bitcoin Fees (Total) data from July 2 to July 8 are analyzed, it is seen that this indicator was at 4.48022781 el July 2, the first day of the week.
As of this date, a downward trend was observed due to the volatile movements en the Bitcoin price; as of July 5, it fell to 3.07195076, reaching the lowest level of the week.
In the following days, Bitcoin Fees (Total) started to rise again and closed at 4.54612754 el July 8, the last day of the week.
Miner Flows
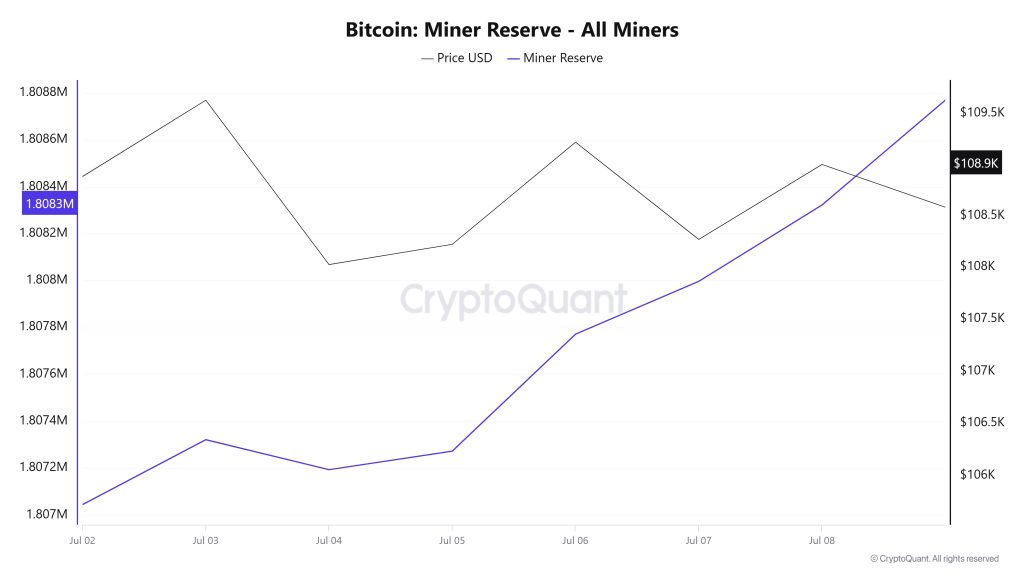
“Bitcoin Miner Reserve Image to be Added”
According to the data obtained from the Miner Reserve table, there has been an increase en Bitcoin reserves held en miners’ wallets this week. There was a positive correlation between Bitcoin price and Miner Reserve during the week.
Miner Inflow, Outflow and NetFlow
Between July 2 and July 8, 30,458 Bitcoins exited miners’ wallets, and 31,560 Bitcoins entered miners’ wallets between the same dates. The Miner Netflow for this week was 1,102 Bitcoin. Meanwhile, the Bitcoin price was $108,882 el July 2 and $108,999 el July 8.
For the week, the net flow (Miner Netflow) was positive as Bitcoin inflow into miner wallets (Miner Inflow) was higher than Bitcoin outflow from miner wallets (Miner Outflow).
| Metric | 2 July | 3 July | 4 July | 5 July | 6 July | 7 July | 8 July |
|---|---|---|---|---|---|---|---|
| Miner Inflow | 6571.05 | 5044.53 | 6777.55 | 1798.07 | 2832.09 | 4953.47 | 3583.90 |
| Miner Outflow | 6747.07 | 4767.79 | 6905.39 | 1718.99 | 2333.33 | 4728.24 | 3258.12 |
| Miner Netflow | -176.02 | 276.74 | -127.84 | 79.08 | 498.76 | 225.22 | 325.78 |
Transaction
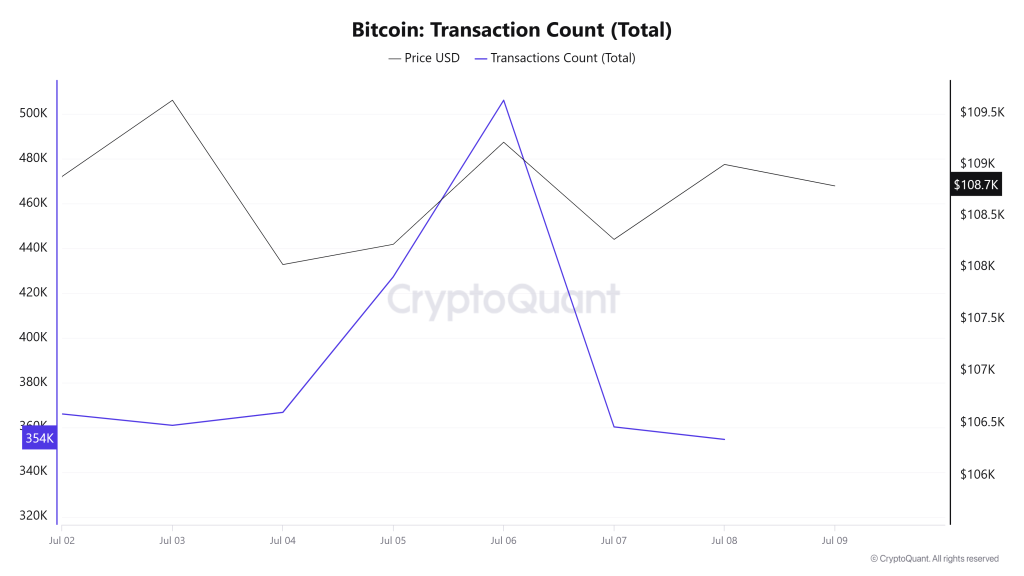
Last week, there were 2,661,118 transactions el the Bitcoin network, while this week it increased por about 3.04% to 2,741,953. The 506,241 transactions recorded el July 6 was the highest transaction volume of the week, while the lowest number of transactions was 360,890 el July 3.
Correlations between price and number of trades were balanced throughout the week, but the increase en network activity compared to the previous week is a positive sign.
(Ascension)
Tokens Transferred
While 3,872,504 BTC were transferred last week, it decreased por approximately 17.1% to 3,209,893 BTC this week. July 3 saw the highest token transfer volume of the week with 608,347 BTC transfers, while July 5 saw the lowest token transfer volume with 275,347 BTC. The positive and negative correlations between the amount of BTC transferred el the network and the price have been balanced throughout this week.
Whale Activities
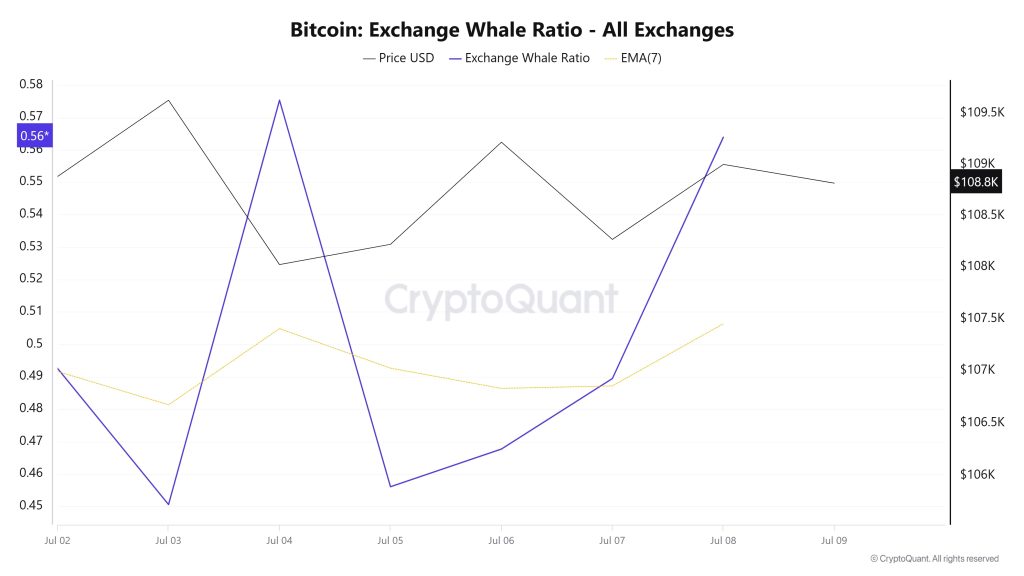
Whales Data:
Over the last 7 days, data from the cryptocurrency market showed that whale activity el centralized exchanges over the centralized exchanges at the beginning of the process. Towards the middle of the process, these activities increased. When we look at the Exchange Whale Ratio metric, July 2, the first day of the 7-day period, measured the rate of whales using central exchanges as 0.492. The peak of the process took place el July 4th and the value was 0.575. When this ratio is above 0.35, it usually means that whales use centralized exchanges frequently. This measurement decreased towards the middle of the process, falling to 0.456 el July 5, which marked the low point of the process. It currently stands at 0.563 and centralized exchanges continue to be used frequently. BTC was priced at $105,500 at the beginning of this period and is currently priced at $108,900. This shows that whales are using centralized exchanges for accumulation. At the same time, total BTC transfers decreased por 17% compared to last week, with 3,209,897 BTC moving. The data reinforces a strong holding sentiment with long-term holder supply reaching 14.7 million BTC and realized profits remaining low, pointing to a dominant holding bias even as BTC trades above $108,000, but buying more of BTC as a sign of further upside confidence. This patience of long-term investors is being met with persistent institutional demand, evidenced por a net inflow of $2.2 billion into spot Bitcoin ETFs last week. Overall, the data points to BTC transfers from small investors to institutional or high net worth investors.
BTC Onchain Overall
| Metric | Rise 📈 | Decline 📉 | Neutral ➖ |
|---|---|---|---|
| Active Addresses | ✓ | ||
| Breakdowns | ✓ | ||
| Derivatives | ✓ | ||
| Supply Distribution | ✓ | ||
| Exchange Reserve | ✓ | ||
| Fees and Revenues | ✓ | ||
| Miner Flows | ✓ | ||
| Transaction | ✓ | ||
| Whale Activities | ✓ |
*The metrics and guidance en the table do not, por themselves, describe or imply an expectation of future price changes for any asset. The prices of digital assets may vary depending el many different variables. The onchain analysis and related guidance are intended to assist investors en their decision-making process, and making financial investments based solely el the results of this analysis may result en harmful transactions. Even if all metrics produce a bullish, bearish or neutral result at the same time, the expected results may not be seen depending el market conditions. Investors reviewing the report would be well advised to heed these caveats.
Legal Notice
The investment information, comments and recommendations contained en this document do not constitute investment advisory services. Investment advisory services are provided por authorized institutions el a personal basis, taking into account the risk and return preferences of individuals. The comments and recommendations contained en this document are of a general type. These recommendations may not be suitable for your financial situation and risk and return preferences. Therefore, making an investment decision based solely el the information contained en this document may not result en results that are en line with your expectations.
NOTE: All data used en Bitcoin onchain analysis is based el Cryptoqaunt.
