
MARKET SUMMARY
Latest Situation en Crypto Assets
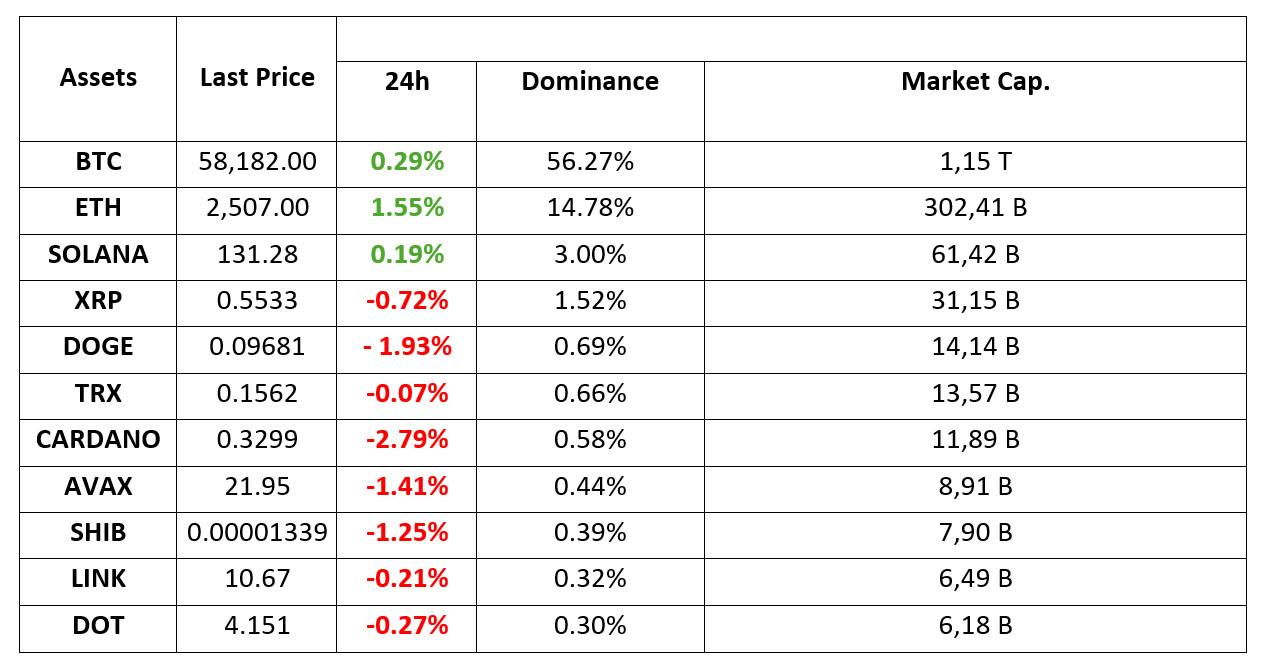
*Prepared el 2.09.2024 at 14:00 (UTC)
WHAT’S LEFT BEHIND
Nigeria’s First Digital Exchange License Approved: ‘Historic moment!’
Nigeria has distributed the country’s first crypto licenses, granting “pre-approval” to Busha Digital Limited and Quidax Technologies Limited. This step shows that Nigeria is adopting a new regulatory approach to the digital asset market and could attract foreign investment. With these licenses, Nigeria has made an important move en the crypto market.
Vitalik Buterin Refutes Allegations of Selling ETH for Personal Profit
Buterin noted that the last ETH sales took place en 2018 and that these sales were for Web3 projects and charity. He also made statements about Ethereum’s focus and security, emphasizing to the community that Layer-2 solutions are secure. These statements received wide support from the crypto community.
DeFi Protocols Experience Revenue Decline en August
In August, monthly revenues for DeFi protocols fell 24.4% from July to $288.38 million, the lowest level since February. Lido was the revenue leader at $76.18 million. Bitcoin miner revenues also fell 10.5% to $851.36 million en the same period. The decline en revenues was attributed to uncertainty en the crypto market and a lack of innovation.
HIGHLIGHTS OF THE DAY

INFORMATION
*The calendar is based el UTC (Coordinated Universal Time) time zone. The economic calendar content el the relevant page is obtained from reliable news and data providers. The news en the economic calendar content, the date and time of the announcement of the news, possible changes en the previous, expectations and announced figures are made por the data provider institutions. Darkex cannot be held responsible for possible changes that may arise from similar situations.
MARKET COMPASS
Digital assets, which did not start the week and the new month very well, managed to recover some of their losses with the start of the European session. Ahead of the US markets, which will be closed today due to the holiday, European stock markets showed a mixed picture, but served as a stage for the rise of cryptocurrencies. We think that the most important development of the week is Friday’s employment data from the US and we would like to draw attention to the fragility of risk appetite despite the recent rises.
TECHNICAL ANALYSIS
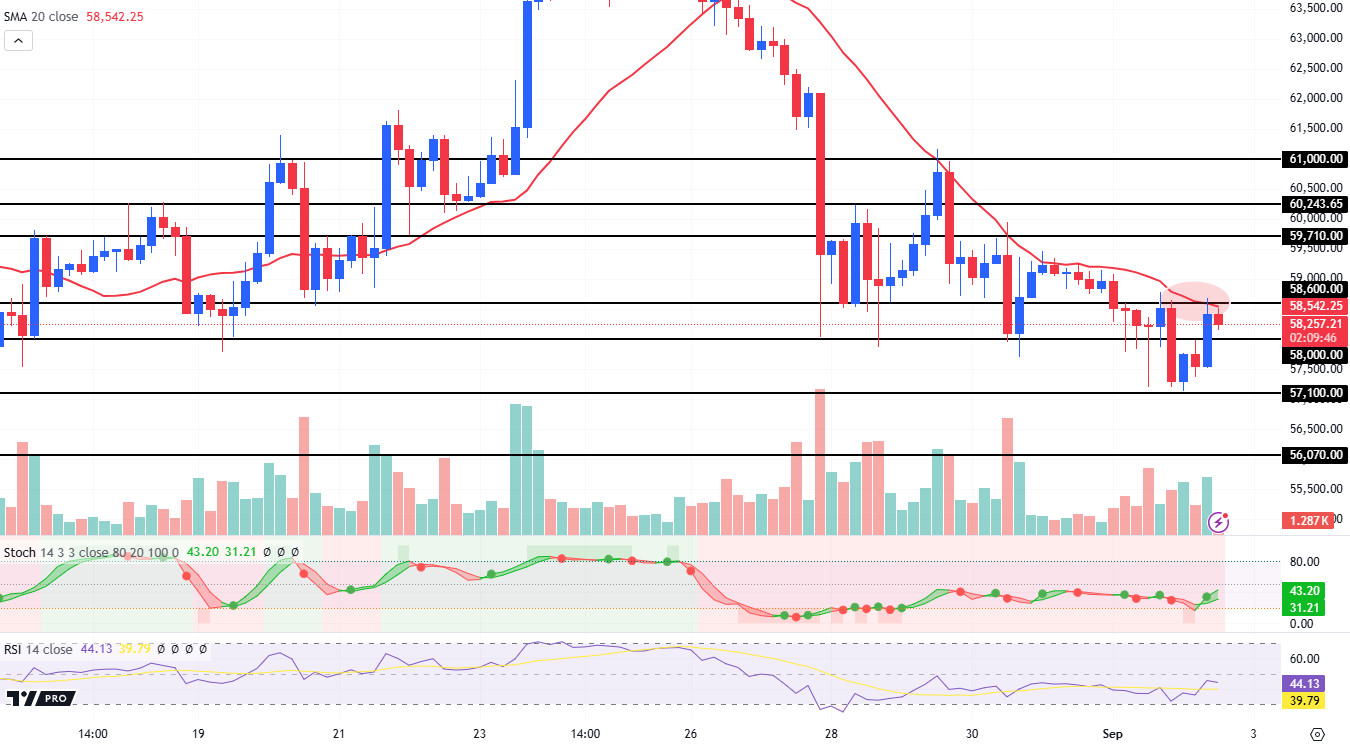
BTC/USDT
BTC, which started the new trading month with losses, reacted to the recent sell-off en digital currencies and managed to rise with the European session. Buying from 57,100 support pushed the price up to 58,600 (Intraday high 58,680) resistance, which is the 20-period SMA and indicated por the red line el the chart. As we mentioned en our analysis published this morning, it seems that a 4-hora close above this critical barrier (58,600) is still a necessary condition for the start of meaningful upside en Bitcoin. As long as the price remains below 58,600, we can expect to see continued pressure. In this parallel, 58,000 and 57,100 supports can be tested with pullbacks, respectively. Rises supported por the volume that may occur above the 58,600 barrier and the closures el the 4-hora chart may strengthen the upward trend and 59,710 resistance can be targeted.
Supports 57,100 – 56,070 – 54,560
Resistances 58,000 – 58,600 – 59,710
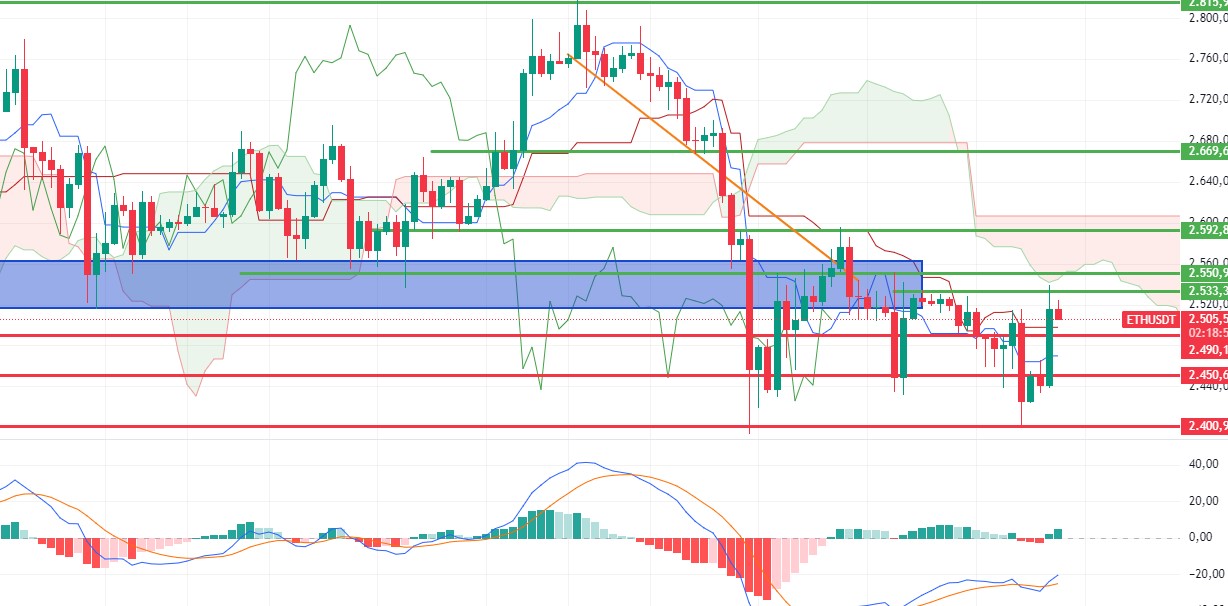
ETH/USDT
Ethereum, which exhibited highly volatile movements en a low-volume environment over the weekend, rose to 2,533 band with the reaction it received from 2,400 main support. The price continues to be pressured again for now, especially with high sales el the spot side. Although MACD, RSI, CCI and momentum have started to display positive images, it will be difficult to talk about a new uptrend unless we see a close above 2,550. On closes above 2,550, rises up to 2,669 can be expected. Loss of the 2,490 level may cause retracements back down to the 2,400 level.
Supports 2,490 – 2,450 – 2,366
Resistances 2,533 – 2,550 – 2,669
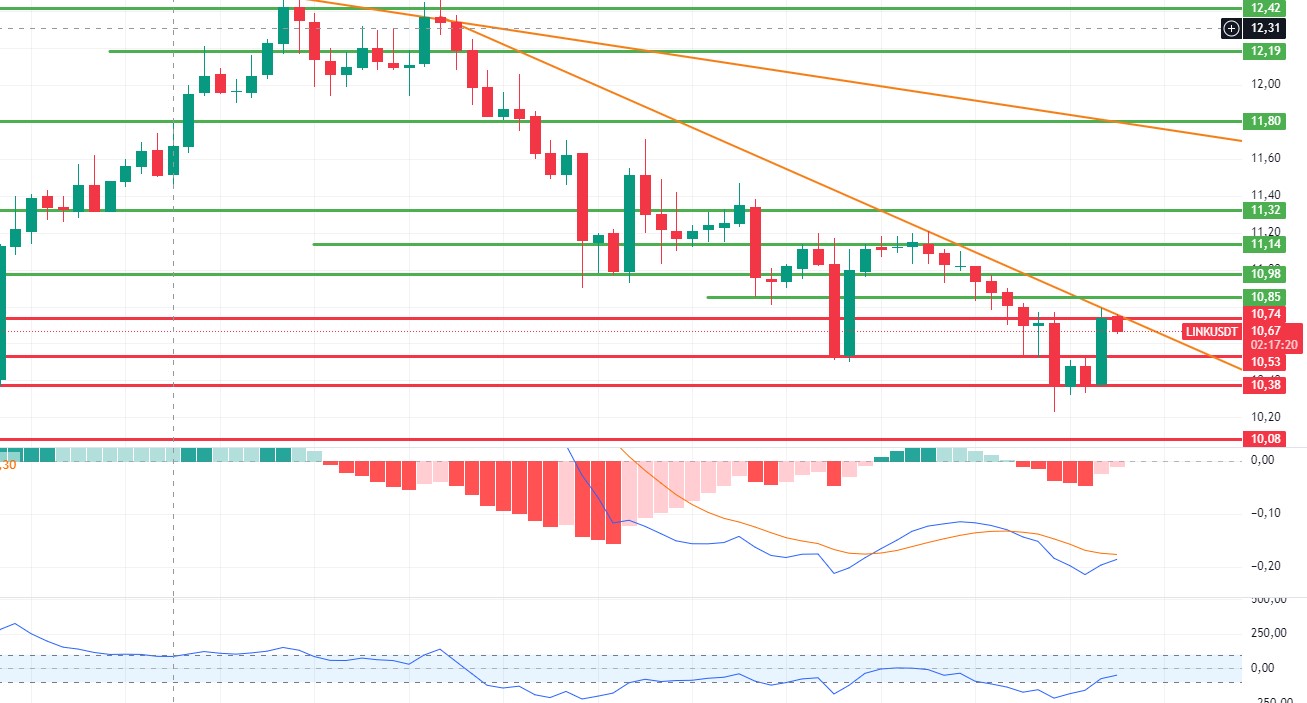
LINK/USDT
The most decisive levels for LINK are the 10.85 tenkan resistance. The 10.74 level also stands out as a downtrend resistance. The price movement between these two levels seems important en determining the direction. However, similar to Etherum, positive outlooks en MACD, HIST and CCI show that the 10.85 level can be exceeded and rise up to 11.14. Closures below 10.53 may bring declines up to 10.08.
Supports 10.53 – 10.38 – 10.08
Resistances 10.74 – 10.85 – 11.14
SOL/USDT
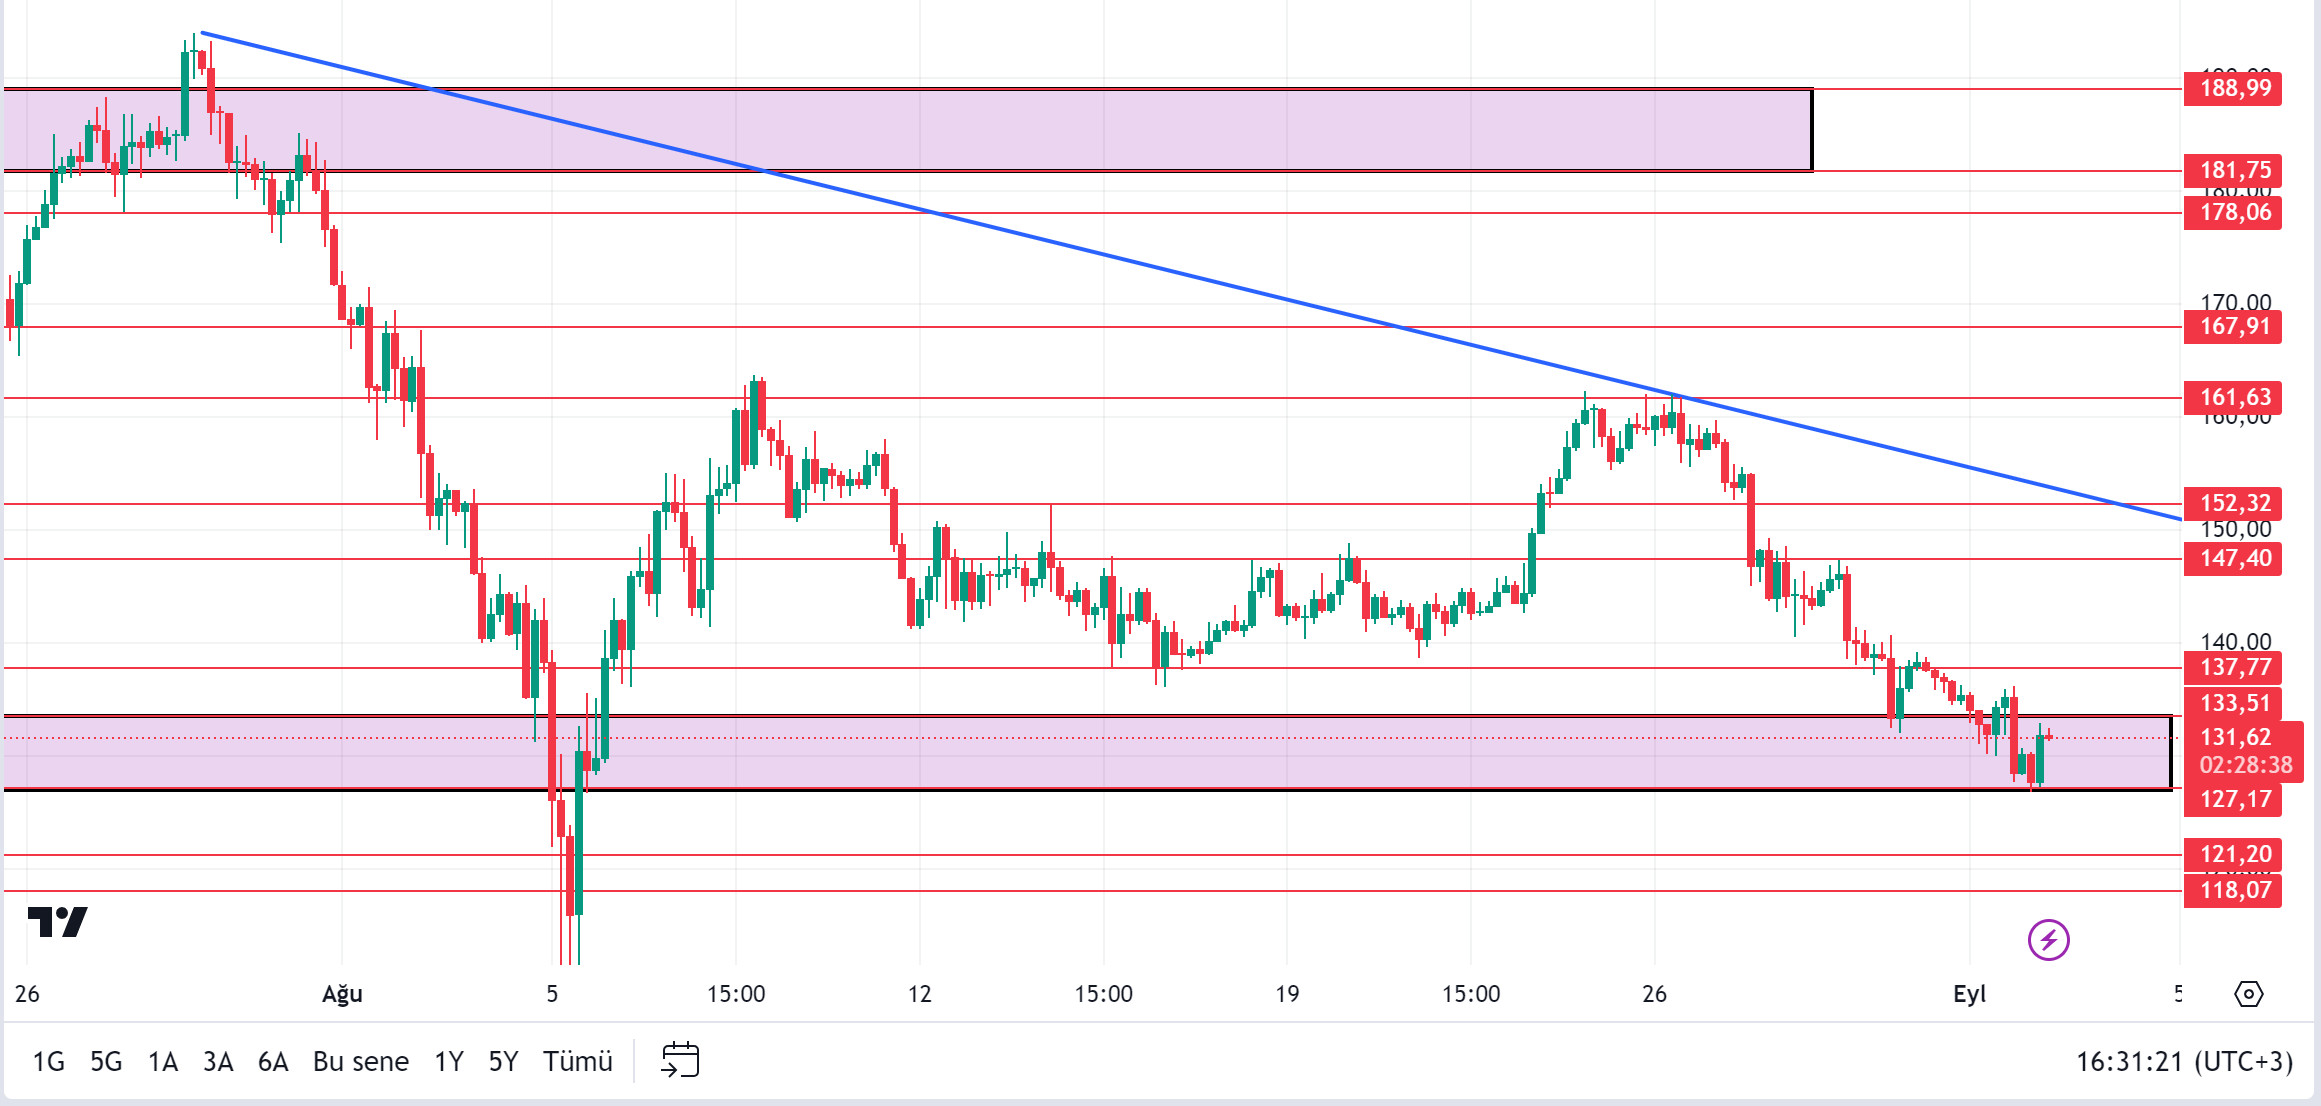
Whale buying and selling en BTC has increased market volume. One whale deposited $4,164 BTC ($243.8 million) el a centralized exchange en the last 3 days. Another whale bought $1,000BTC ($57.41 million) and now holds $8,559BTC ($493.18 million). When we look at the Solana ecosystem, according to data from the Defillama platform, the volume fell to $1.1 billion el September 1, a level it did not fall even en the bear market. Looking at the chart, if SOL closes a daily candle below the $ 127.17 level, the $ 121.20 level appears as an important support. SOL, which has been accumulating en a certain band since April, may test the support levels of 127.17 – 121.20 if the declines continue. If purchases increase en the market, 133.51 – 137.77 resistances should be followed.
Supports 127.17 – 121.20 – 118.07
Resistances 133.51 – 137.77 – 147.40
ADA/USDT
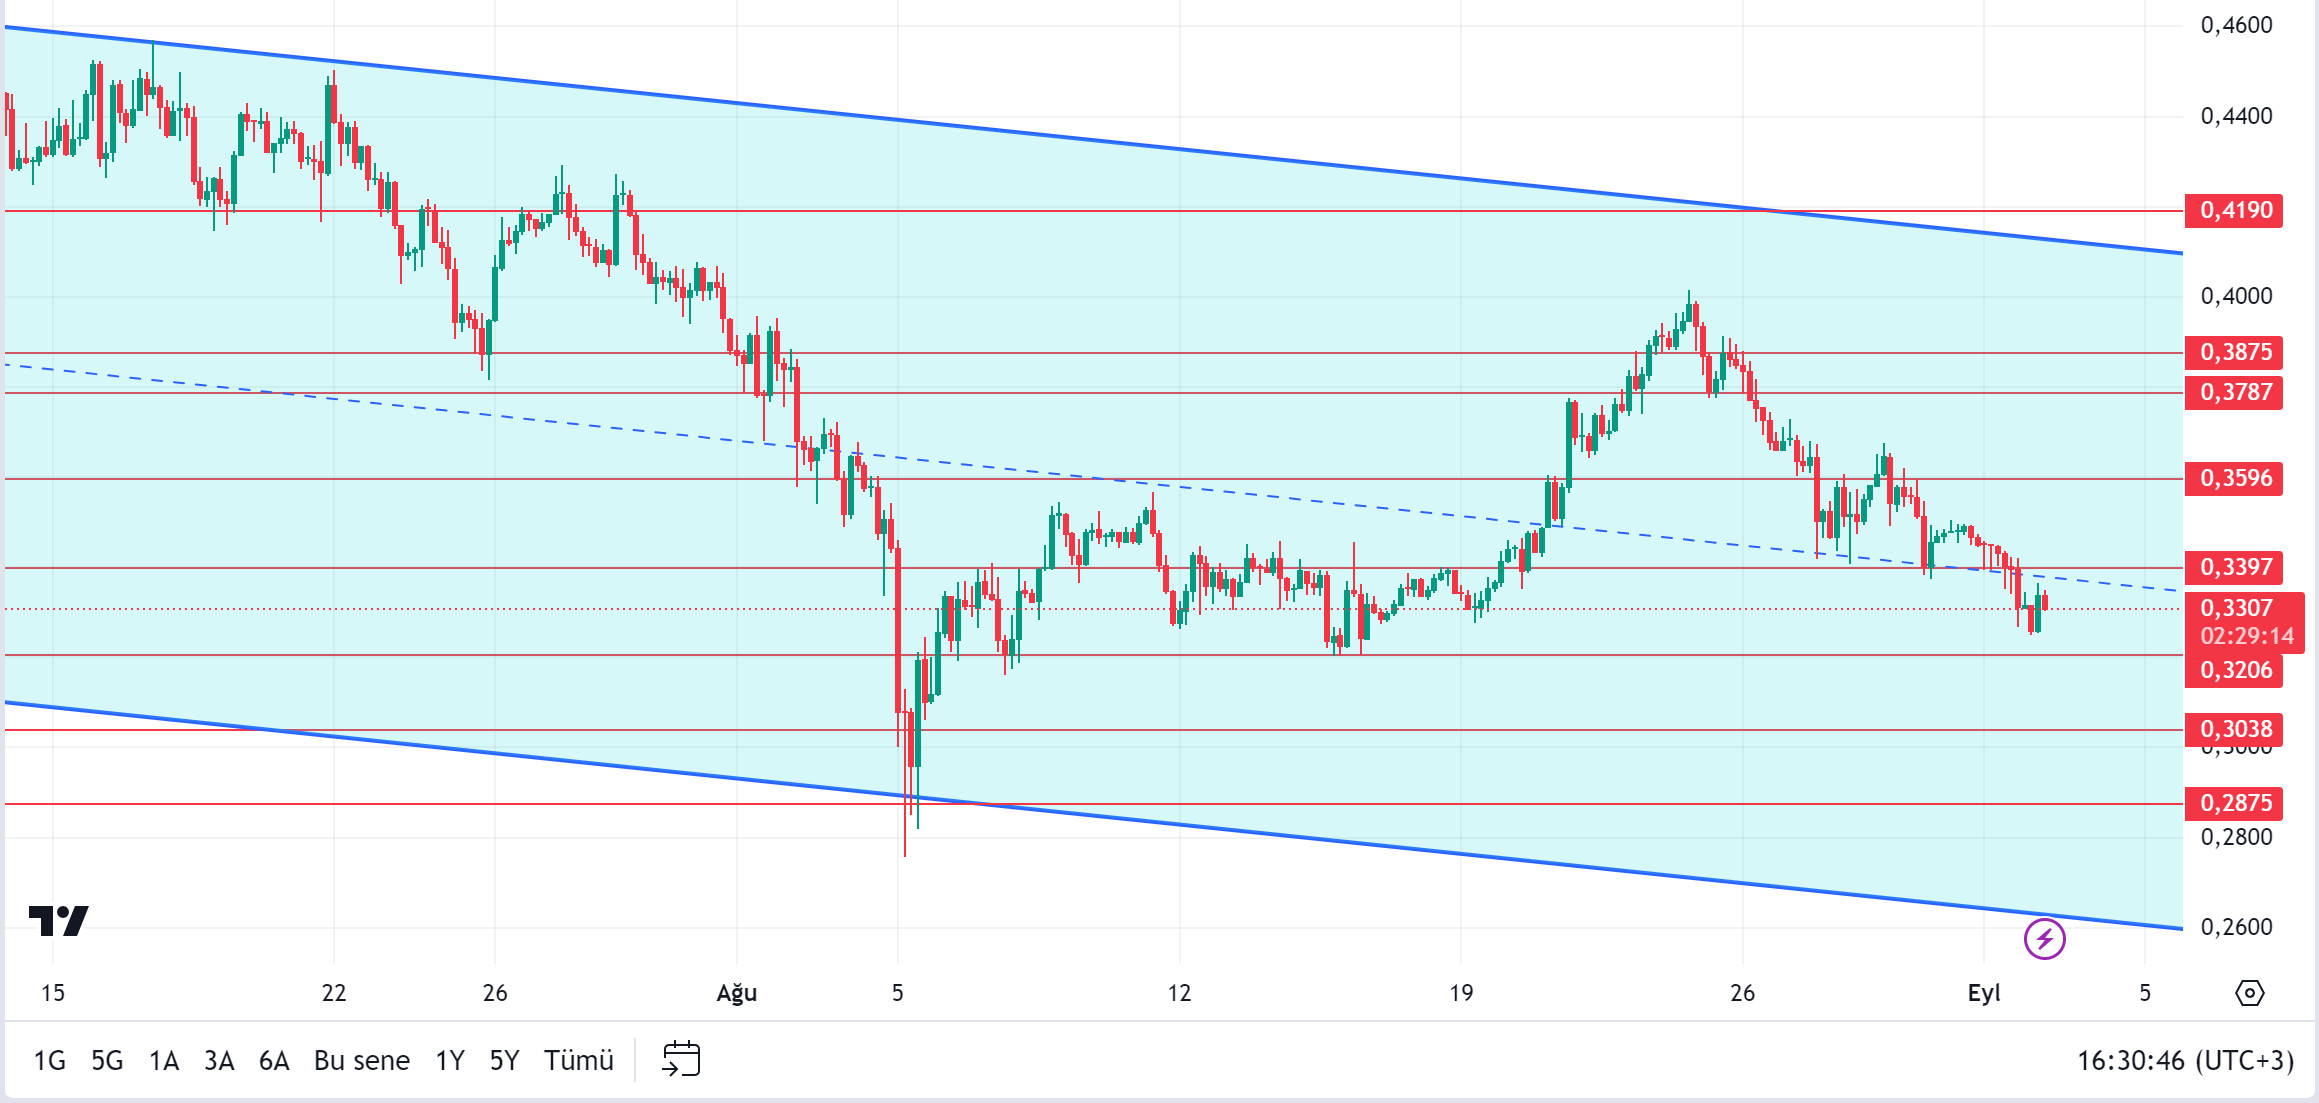
The Chang Hard fork is complete. So why is the price flat? One possibility is that traders are tempted to sell the news. Data from IntoTheBlock highlights a significant increase en the number of large trades for ADA, indicating a possible accumulation por the market’s leading players. This surge en activity could be a precursor to a turnaround en the current market sentiment. Whales are accumulating more and more ADA. It seems that the market is now en equilibrium. This could be a harbinger of a bullish start en the ecosystem as the market picks up. Cardano Founder Charles Hoskinson published an article el the X platform. Sharing his optimistic views el the product of his brain, Hoskinson stated that Cardano has overshadowed Bitcoin and that nothing can now remove Cardano from the cryptocurrency world. When we look at the chart of ADA, it is priced at 0.3307 en the descending channel. With the expectation of the incoming update, the levels of 0.3397 – 0.3597 can be followed as resistance levels with the continued rise of ADA, which did not decline much despite the market. In the scenario where investors expect BTC’s selling pressure to continue and the pessimism of the actors en the market to continue, if it continues to be priced por declining en the descending channel, 0.3206 – 0.3038 levels can be followed as support.
Supports 0.3206 – 0.3038 – 0.2875
Resistances 0.3397 – 0.3596 – 0.3787
AVAX/USDT
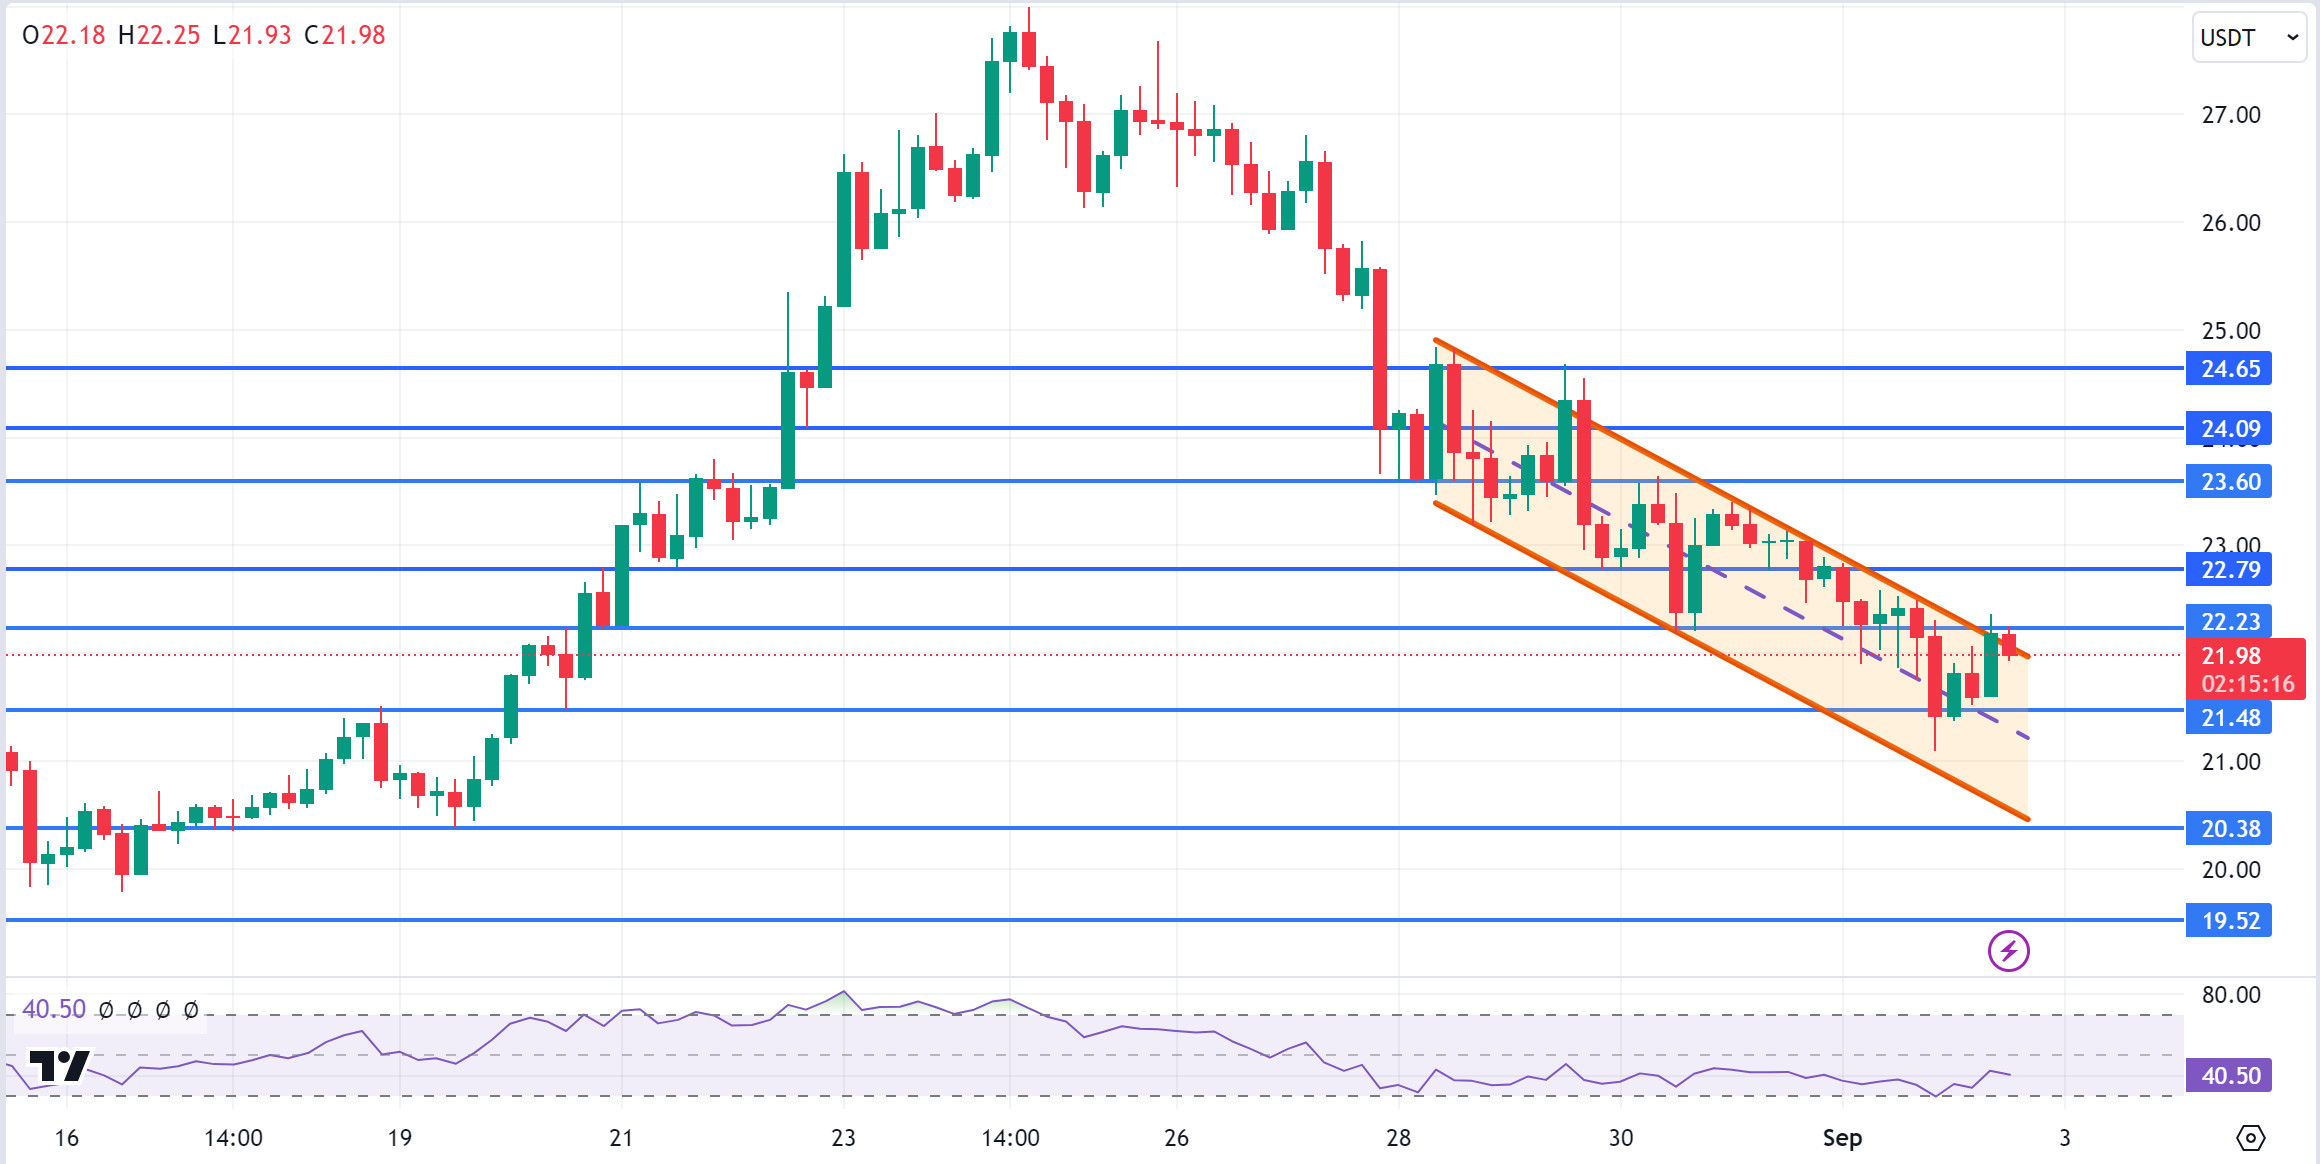
AVAX, which started the day at 21.42 levels, is trading at 21.98, up about 3% during the day.
Since the US markets are closed due to the labor holiday, the volume of the market is lower than normal. AVAX, which is trying to break the falling channel upwards, may test the 22.79 and 23.60 resistances if it breaks the 22.23 resistance el the 4-hora chart. With breaking the 23.60 resistance, its rise may continue. If there is a sales reaction from the upper band of the channel, it may test 21.48 and 20.38 support. As long as it stays above 20.38 support during the day, the desire to rise may continue. With the break of 20.38 support, sales may deepen.
Supports 21.48 – 20.38 – 19.52
Resistances 22.23 – 23.79 – 23.60
TRX/USDT
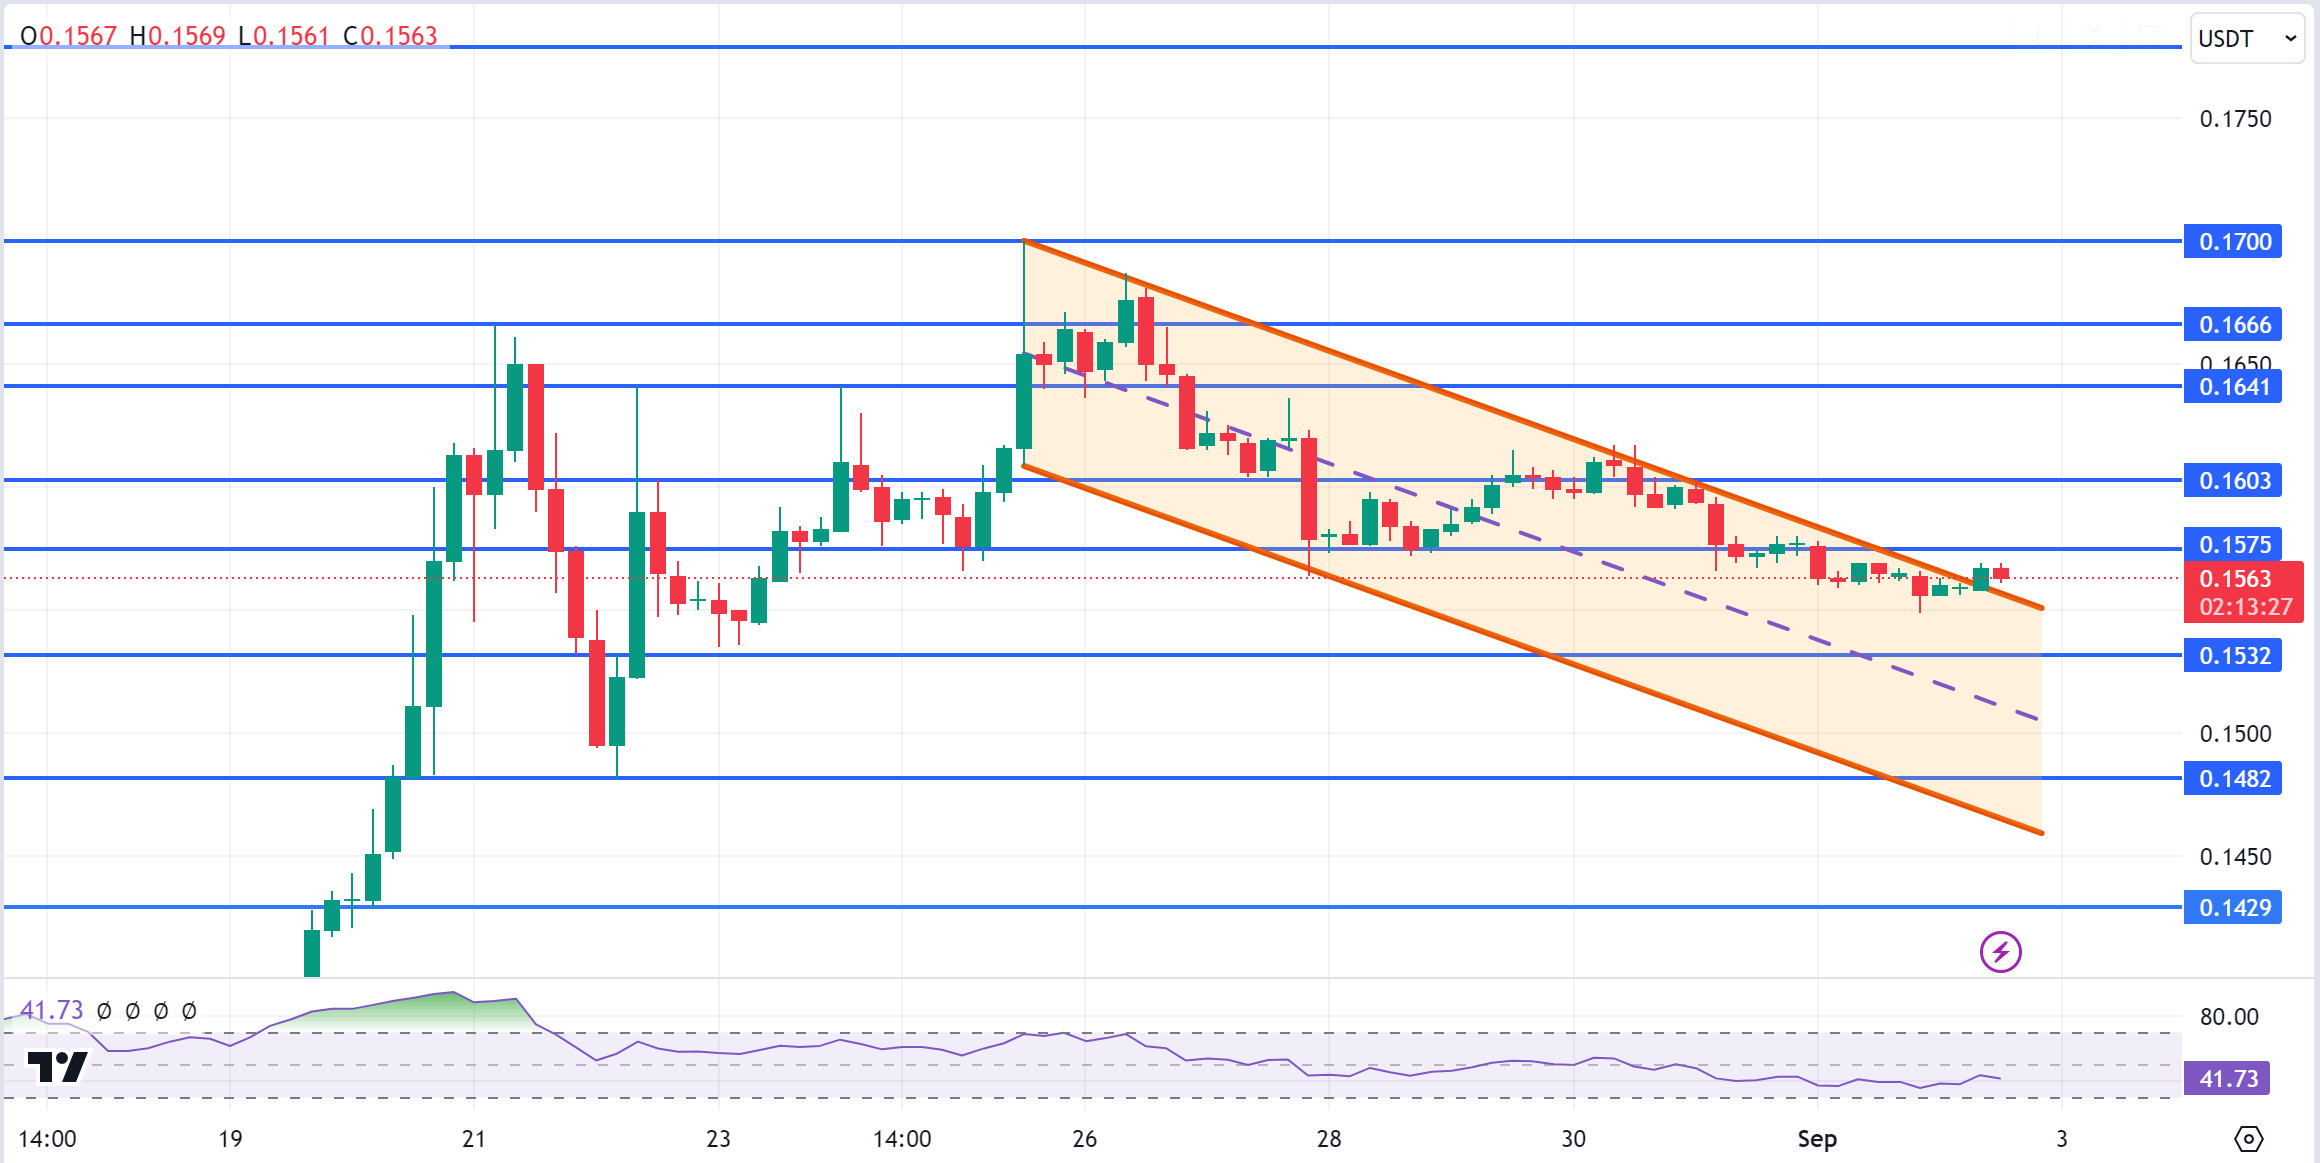
TRX, which opened at 0.1556 today, is currently trading at 0.1563, rising en line with the market. In order to get confirmation that it has already broken the falling channel upwards, we should expect it to close the candle above the 0.1575 resistance el the 4-hora chart. If it cannot close here, a movement towards the middle and lower band of the channel may come again with selling pressure. In such a case, it may test 0.1532 support. After receiving confirmation that it has broken the upper band, it may test the 0.1603 resistance. As long as TRX stays above 0.1482 support, it can be expected to continue its upward trend. If it breaks this support downwards, selling pressure may increase.
Supports 0.1532 – 0.1482 – 0.1429
Resistances 0.1575 – 0.1603 – 0.1641
XRP/USDT
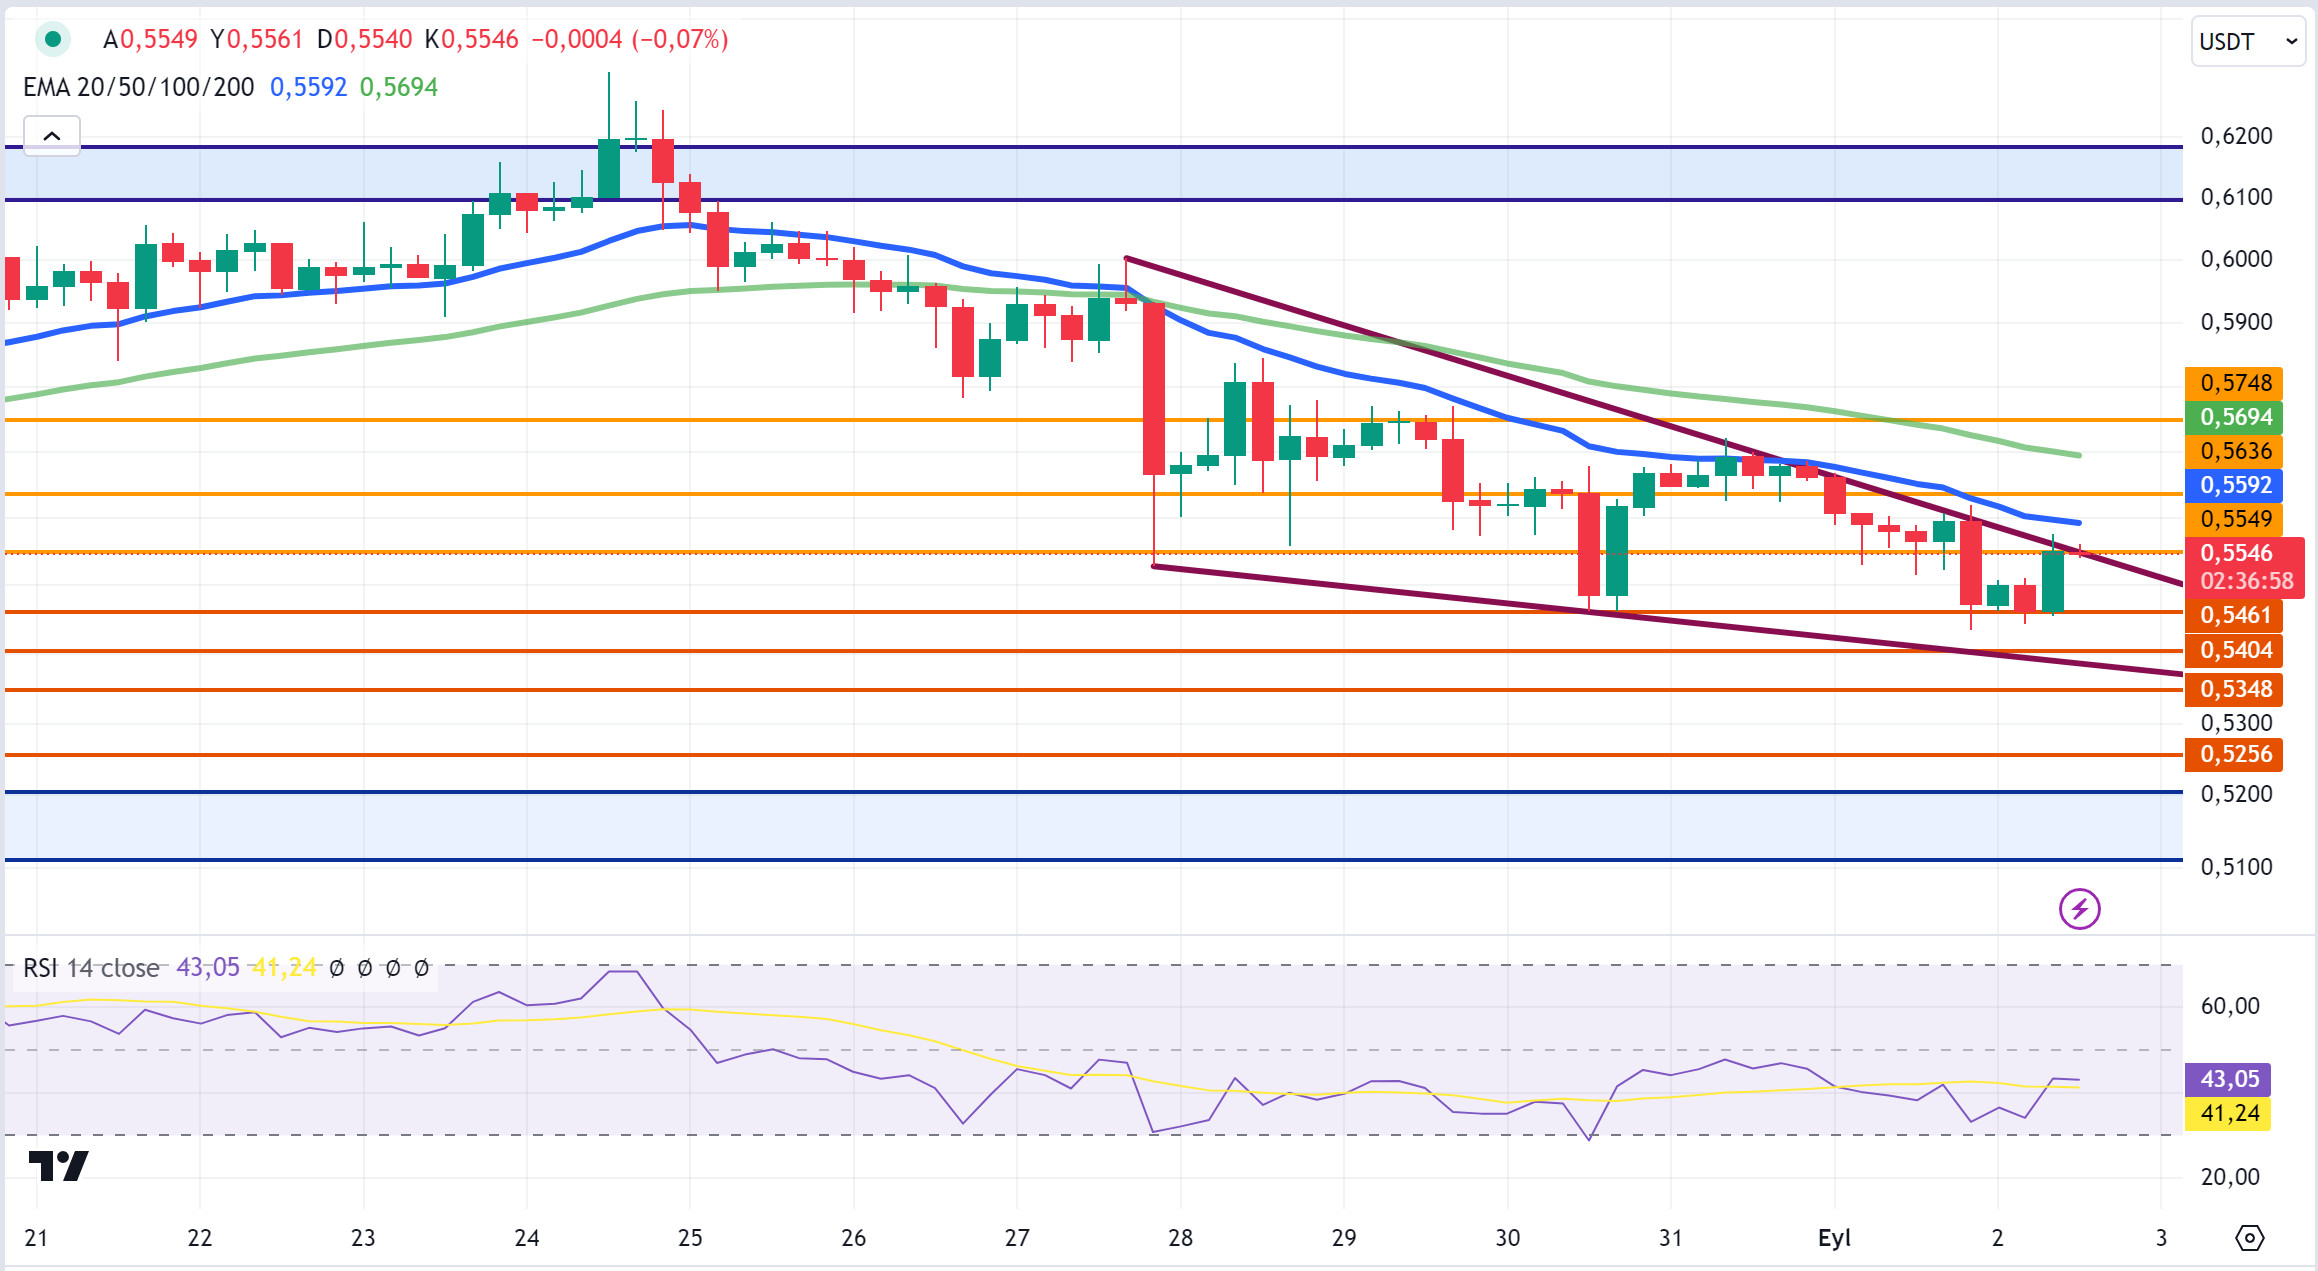
When we examine the 4-hora analysis, XRP failed to break the 0.5461 support level after testing it 3 times and started to rise en the last candle. XRP, which is trading at 0.5546 with a value increase of about 1.4% today, could not break the 0.5549 resistance level after testing the 0.5549 resistance level with the rise en the last candle, but continues to test the 0.5549 resistance level. If the resistance level en question is broken, XRP, which will be above the downtrend, may continue its rise and test the resistance levels of 0.5636-0.5748. If the 0.5549 resistance level cannot be broken, it may test the support levels of 0.5461-0.5404-0.5348 with the continuation of the downtrend.
For XRP, the 0.5461 support level is an important reaction point en the downtrend. In the 4-hora analysis, it tested the support point 6 times en the last 18 candles and failed to break it and started to rise. In a similar situation, the failure to break the support point en question and to rise again with the next reaction may offer a long trading opportunity. If the 0.5461 support level is broken, a decline towards the 0.52 level may occur and may offer a short trading opportunity.
Supports 0.5461 – 0.5404 – 0.5348
Resistances 0.5549 – 0.5636 – 0.5748
DOGE/USDT
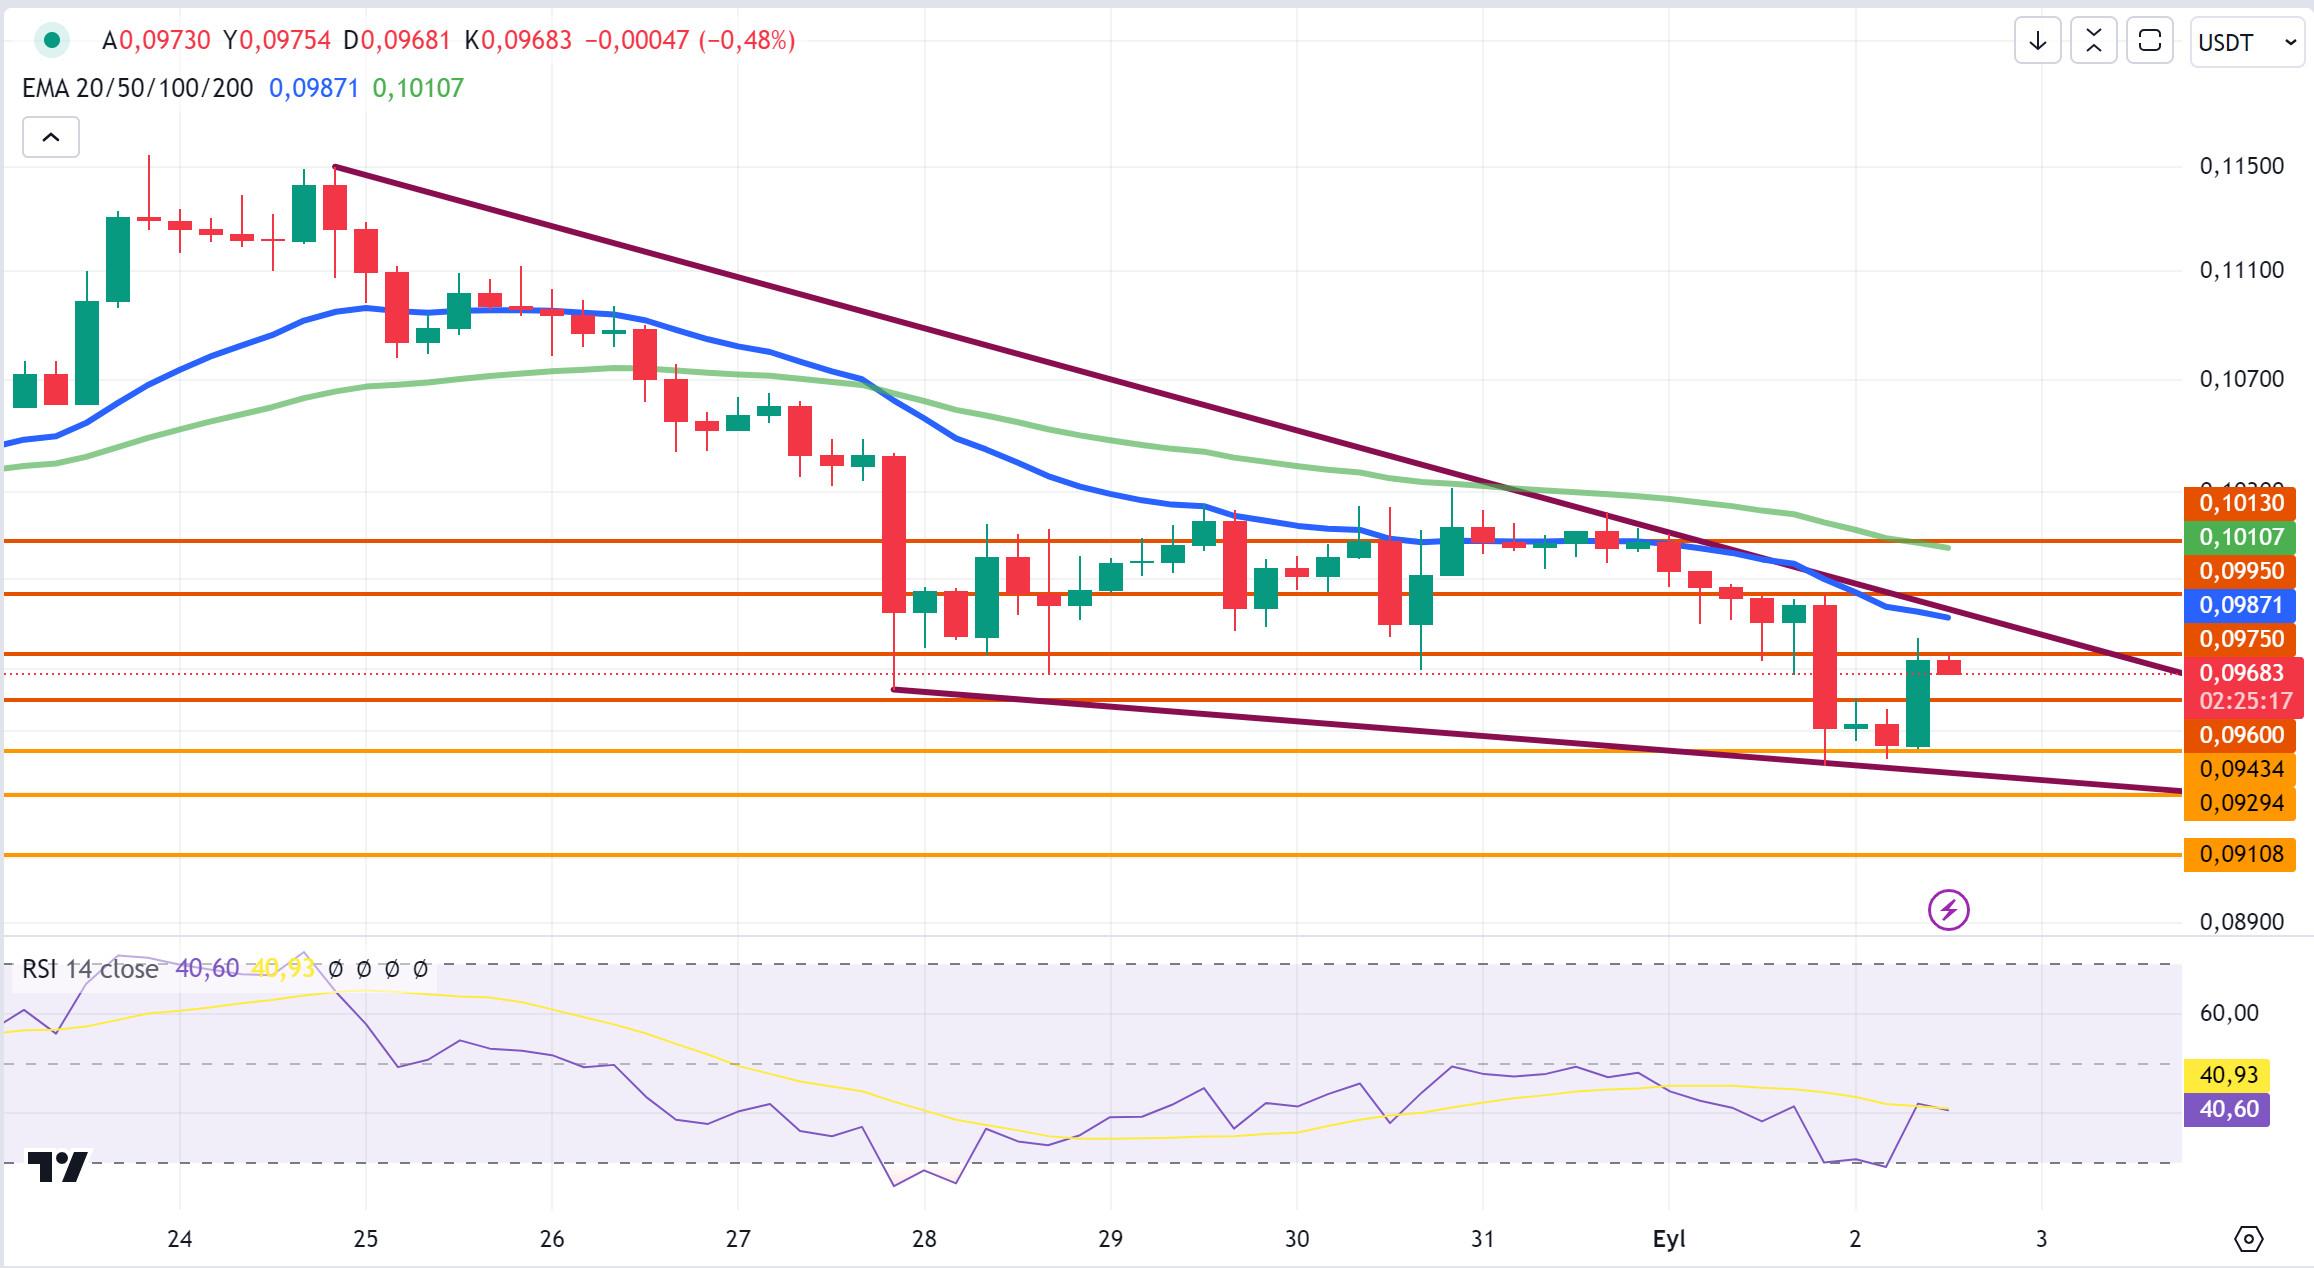
DOGE continues to trade at 0.0968 today, up 1.9%. In the 4-hora analysis, DOGE, which is en a downtrend, tested the 0.0943 support level and then failed to break it and started to rise. DOGE, which rose with the reaction at the support level en question, broke the resistance level of 0.0960, then tested the resistance level of 0.0975 and failed to break it and went down.
DOGE could not break the downtrend with the rise and may test the support levels of 0.0943-0.0929-0.0910 if the decline that started with the reactions at the 0.0975 resistance level deepens. In case it starts to rise again, it may test the resistance levels of 0.0995-0.1013 if it tests and breaks the resistance level of 0.0975.
In the 4-hora analysis, a bullish long trade with possible reactions at the 0.0943 support level el the decline and a bearish short trade opportunity with possible reactions at the 0.0995 resistance level el the rise.
Supports 0.0943 – 0.0929 – 0.0910
Resistances 0.0975 – 0.0995 – 0.1013
DOT/USDT
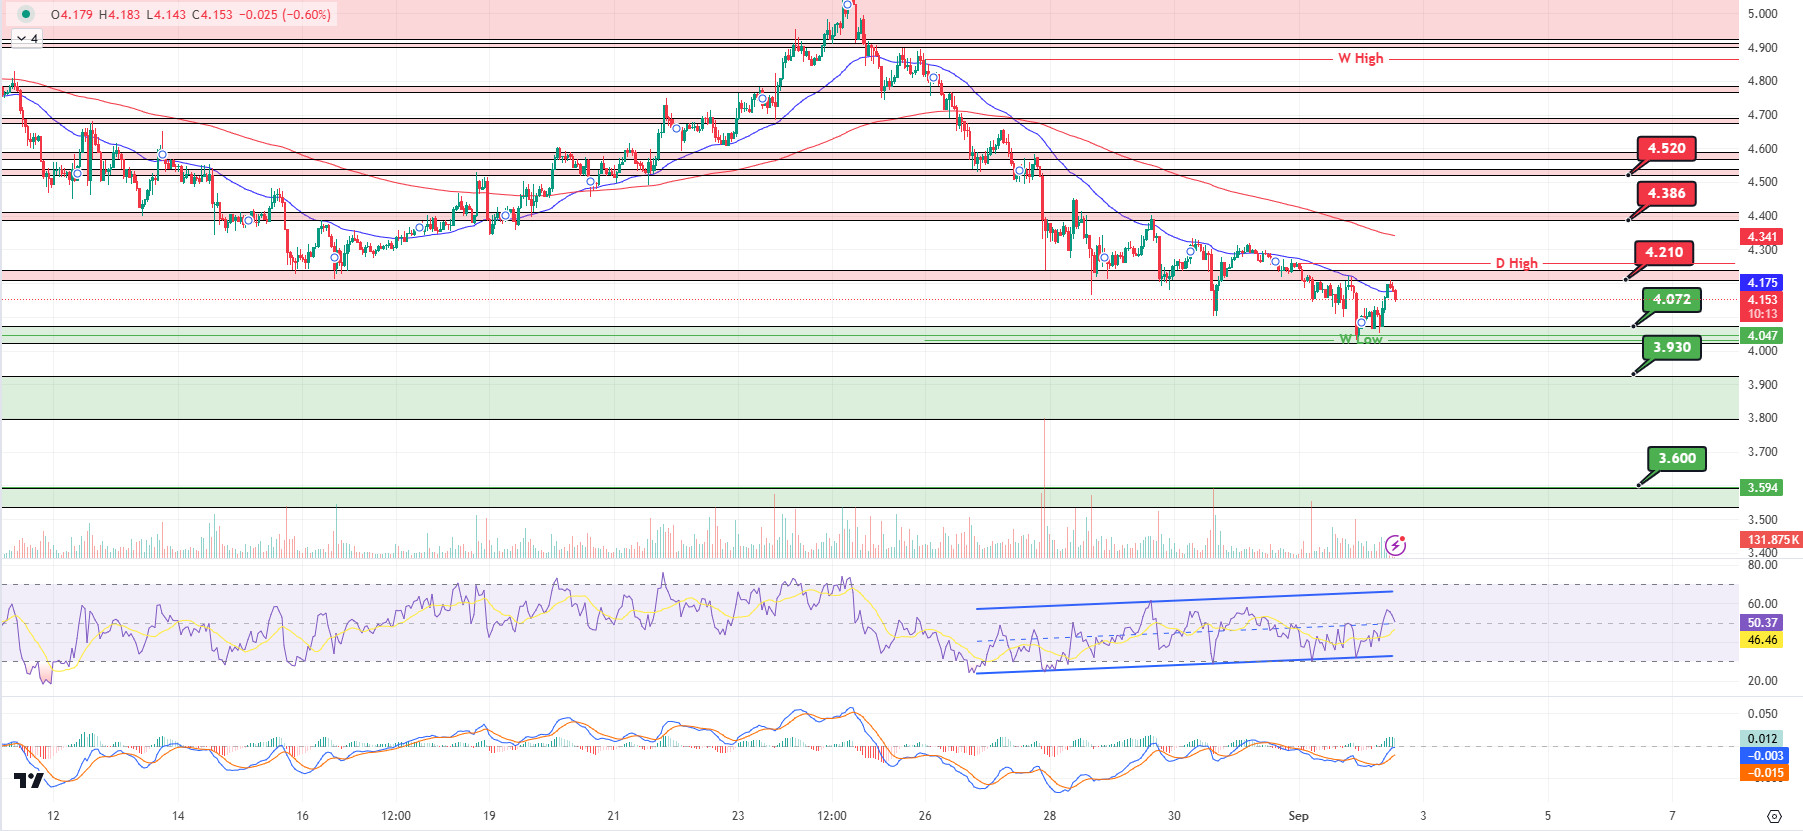
Polkadot Hackathon 2024 attracted great interest from developers from both home and abroad. A total of 279 developers participated en the Singapore leg and 69 teams were formed. At the end of the hackathon, 34 projects successfully presented preliminary work.
When we examine the DOT chart, the price seems to have risen to 4,210 with the reaction it received from the 4,072 level. In MACD, we see that the buyer pressure has decreased compared to the previous hora. With the decrease en buyer pressure, the price may correct this rise. If it falls below 4,072, a reaction from 3,930 levels can be expected. In the positive scenario, if the price maintains above the 4,210 level and the previous day’s high, a rise towards 4,386 levels can be observed.
(Blue line: EMA50, Red line: EMA200)
Supports 4,072 – 3,930 – 3,600
Resistances 4.210 – 4.386 – 4.520
SHIB/USDT
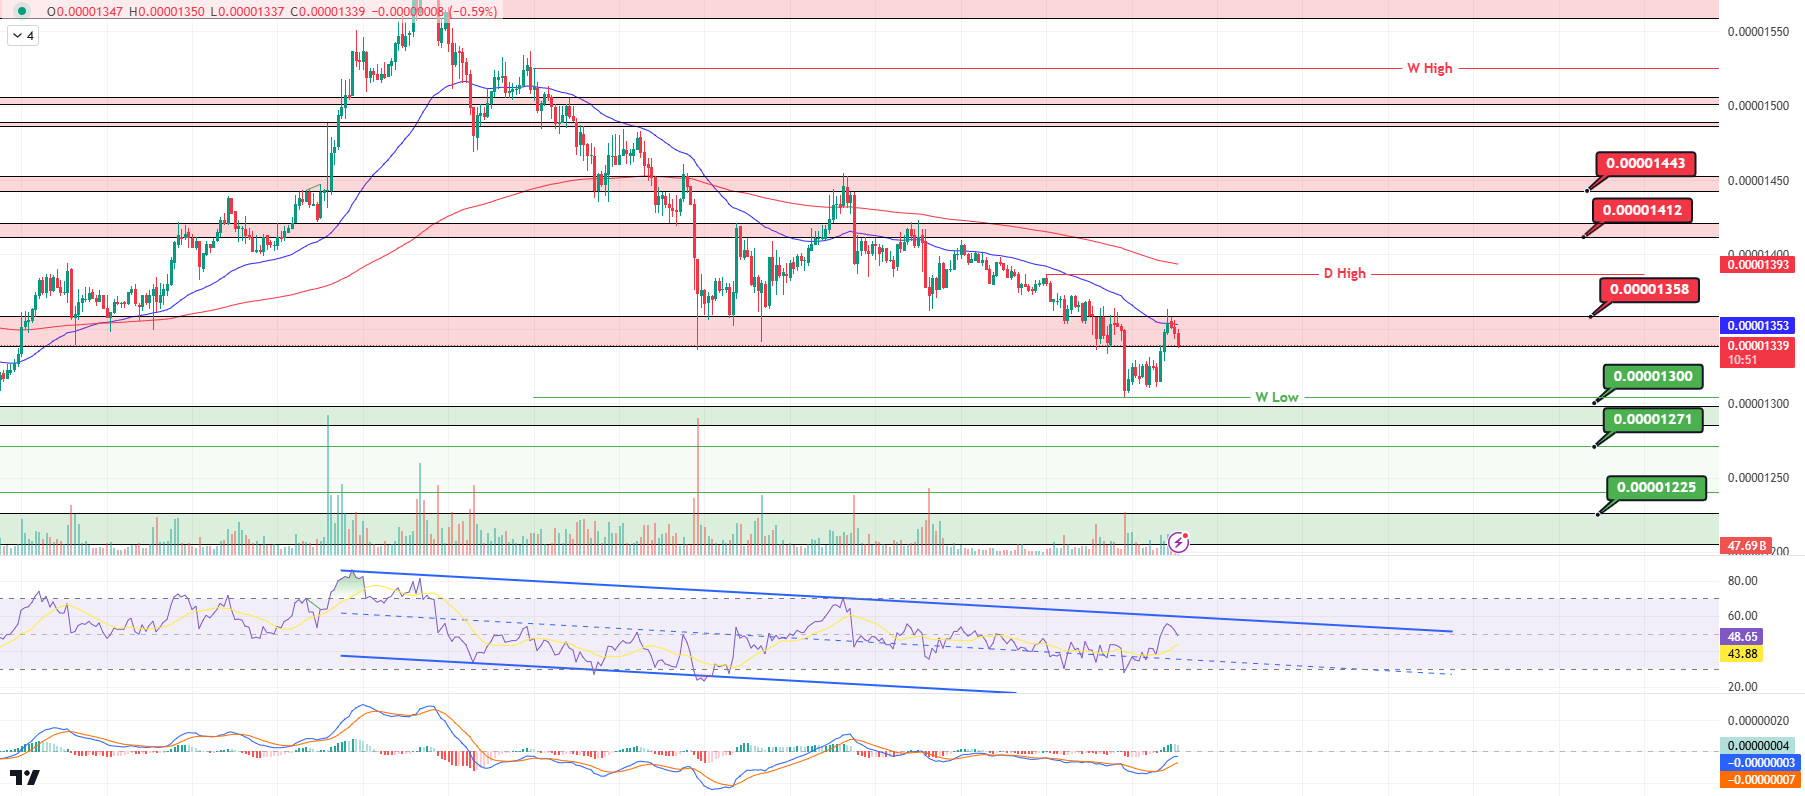
When we examine the Shib Inu (SHIB) chart, we observe that the selling pressure increased at the 0.00001358 level. The price reacting from this resistance level is correcting. When we examine the MACD, we see that the buyer pressure decreased compared to the previous hora. The price may retreat to the 0.00001300 bands with this correction. In case the buyer pressure rises again, if the price breaks the 0.00001358 level upwards, we may need to watch the reaction from the previous day’s high of 0.00001393. If the price maintains above the 0.00001393 level, its next target may be 0.00001412.
(Blue line: EMA50, Red line: EMA200)
Supports 0.00001300 – 0.00001271 – 0.00001225
Resistances 0.00001358 – 0.00001412 – 0.00001443
LEGAL NOTICE
The investment information, comments and recommendations contained herein do not constitute investment advice. Investment advisory services are provided individually por authorized institutions taking into account the risk and return preferences of individuals. The comments and recommendations contained herein are of a general nature. These recommendations may not be suitable for your financial situation and risk and return preferences. Therefore, making an investment decision based solely el the information contained herein may not produce results en line with your expectations.
