
TECHNICAL ANALYSIS
BTC/USDT
Tensions in the Middle East remain high, with Trump trying to prevent an Israeli attack on Iran, but citing violations of the ceasefire by both sides and claiming that Iran’s nuclear capability has been destroyed. Netanyahu’s narrowing of the scope of the attack and the parties’ symbolic reactions became critical for the course of the crisis in the region. In the rest of the day, US Federal Reserve Chairman Jerome Powell’s presentations to Congress will be followed whether the interest rate policy will continue its stable stance despite political pressures.
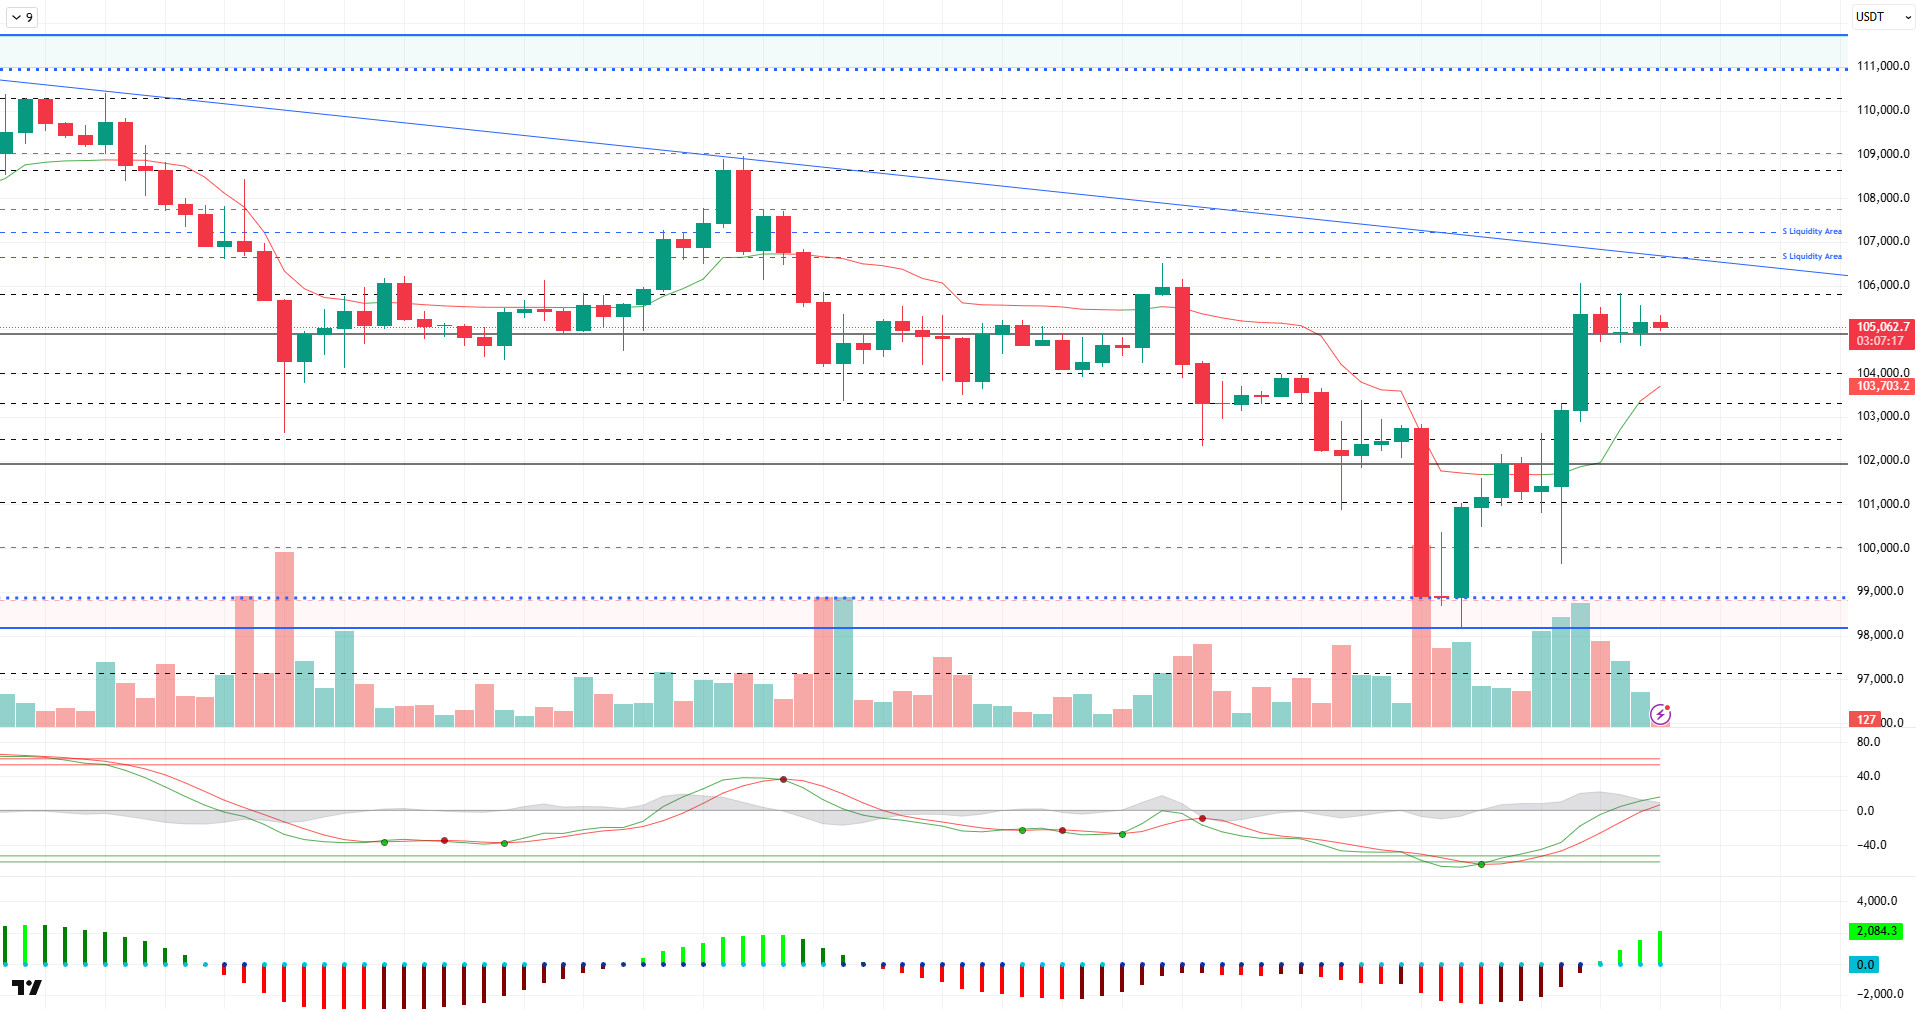
When we look at the technical outlook, BTC gives a strong outlook by maintaining its gains and taking place above the 105,000 level. At the time of writing, BTC continues to trade at 105,200.
On the technical indicators front, the Wave Trend (WT) oscillator came to the channel mid-band, confirming the trend reversal at the ovelsold area. The Squeeze Momentum (SM) indicator is also back in positive territory, supporting the upside. Kaufman moving average is positioned at 103,700, below the price, another bullish indicator.
When the liquidity data is analyzed, almost all of the buy trades were liquidated, while with the recent rise, the liquidation of the sell trades in the 104,000 – 105,000 band was also realized. The other sales tier is currently accumulated at 106,500-107,500 levels.
As a result, we have stated that the positive scenario created by fundamental developments and a possible compromise is the critical point for the price to recover. As a matter of fact, in parallel with this, BTC technical and liquidity data along with fundamental developments emerged as factors supporting the rise. In the next process, it will be followed whether the rise will continue or not, and in case of a possible new attack, we will follow the liquidity zone again. On the other hand, if bearish movements and selling pressure continue, the 105,000 level will be followed as a reference support area again.
Supports 105,000 – 103,300 – 102,400
Resistances 106,000 – 107,300 – 109,000
ETH/USDT
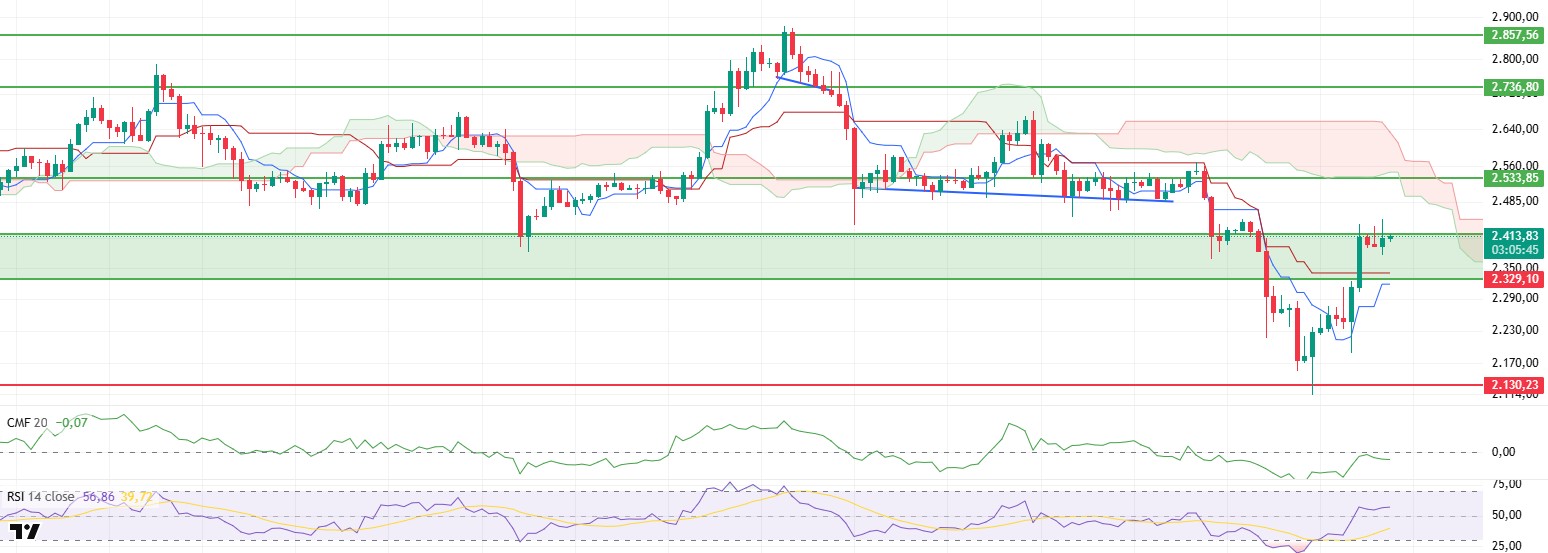
ETH attempted to break through the resistance zone colored in green on the chart during the day, but the news about the breakdown of the ceasefire between Israel and Iran increased the pressure on the price and caused this attempt to fail. However, despite this, the fact that the price continued to remain above the $2,400 level indicates that buyers still remain strong and the market has a limited reaction to negative news. Analyzing the technical indicators, it is seen that the overall outlook remains positive and the current course is supported.
In the case of the Ichimoku indicator, the price holding above both tenkan and kijun levels is an important signal for the short-term positive outlook. This suggests that bearish pressure has weakened and the market has the potential to regain upward momentum. However, the fact that the price is still below the kumo cloud suggests that it is too early to say that the trend has turned fully positive on higher timeframes. Unless a breakout above the kumo cloud occurs, the current upside may remain technically limited.
Although the Chaikin Money Flow (CMF) indicator managed to climb to the zero line with the recent rise, it has shown a slight retracement during the day. This indicates that although fund inflows to the market are strong, they are still not fully stabilized and limited liquidity outflows continue. It will be important for CMF to move into positive territory permanently in order to consolidate the dominance of the buy side.
The persistence of the Relative Strength Index (RSI) indicator above the 50 reference level indicates that the momentum in the market continues upwards. This structure in the RSI shows that buyers have not yet lost power and upside expectations remain valid in technical terms.
In general, technical indicators paint a positive picture for ETH, while the price’s persistence above the $2,420 level in the evening hours is critical for the continuation of the rise. However, the $2,329 level, which was also emphasized in the morning analysis, should be followed as a strong support point, as selling pressure may intensify if geopolitical uncertainties increase again. A pricing below this level may cause the technical structure to deteriorate.
Supports 2,329 – 2,130 – 2,029
Resistances 2,533 – 2,736 – 2,857
XRP/USDT
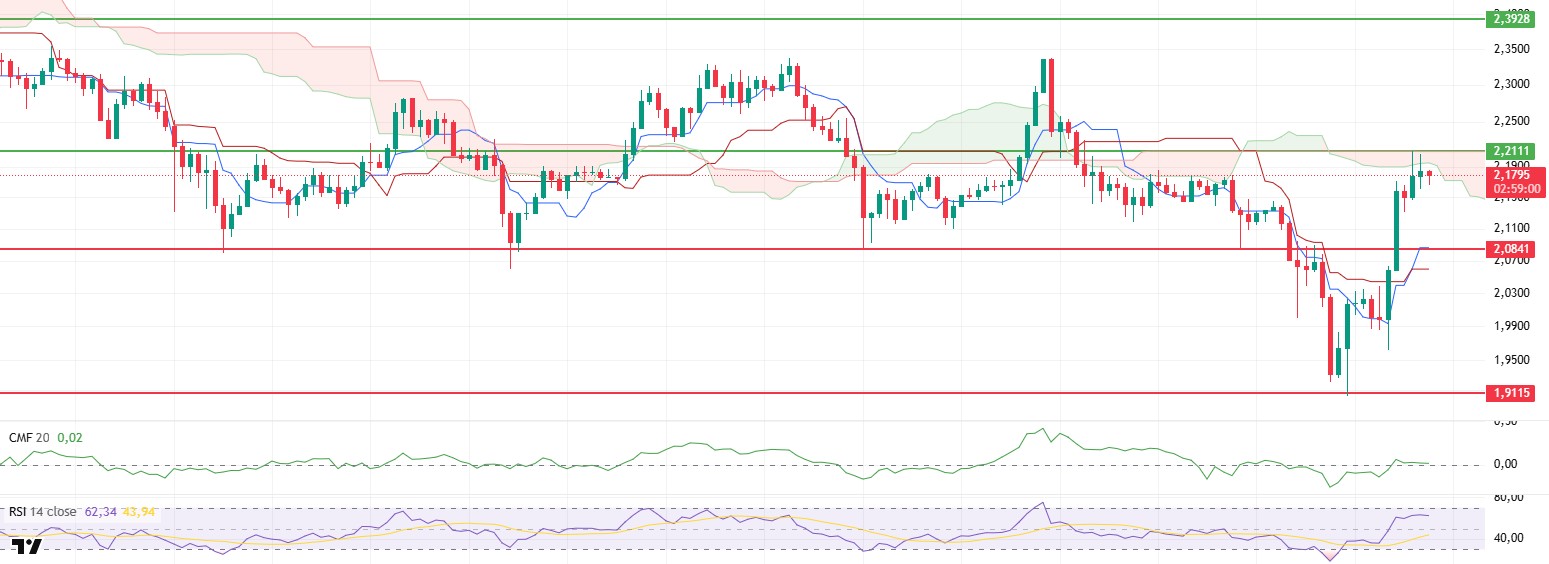
Although XRP managed to retest the upper band of the sand cloud at the $2.21 level during the day, it experienced a limited retracement with the selling reaction from this region. However, this pullback brought about a movement in which the price generally maintained its stability within a horizontal band. Considering the current technical outlook, it can be said that the short-term positive trend continues and the bullish expectation remains valid.
When the Ichimoku indicator is analyzed, the buy signal formed when the tenkan level crossed the kijun level upwards is still valid. This technical structure shows that the market is in a short-term bullish trend and buyers are still the dominant side. The fact that the price remains above these two levels and moves close to the kumo cloud suggests that the ground for a possible upside breakout is being prepared.
The Chaikin Money Flow (CMF) indicator, despite a slight pullback during the day, remained in positive territory, indicating that liquidity flows to the market continued. The persistence of CMF in the positive zone indicates that the buying volume continues and the retracements are likely to remain limited. This outlook stands out as an important factor that technically supports the basis of the bullish scenario.
The Relative Strength Index (RSI) indicator, on the other hand, remains above the reference level of 50, confirming that market momentum continues in a positive direction. The absence of any negative divergence in the RSI is a technical confirmation that a possible bullish move could take place on a healthy footing. The preservation of momentum suggests that the necessary energy for new highs is still available.
As of the general outlook, if XRP breaks through the resistance zone at the $2.21 level in the evening, it seems possible that the upward movement may gain momentum and higher targets may be on the agenda. However, since the ongoing geopolitical risks may cause sudden fluctuations in pricing, the $2.08 level remains a strong support point in a possible downward scenario. Closures below this zone may weaken the short-term technical structure.
Supports 2.0841 – 1.9115 – 1.7226
Resistances 2.2111 – 2.3928 – 2.5900
SOL/USDT
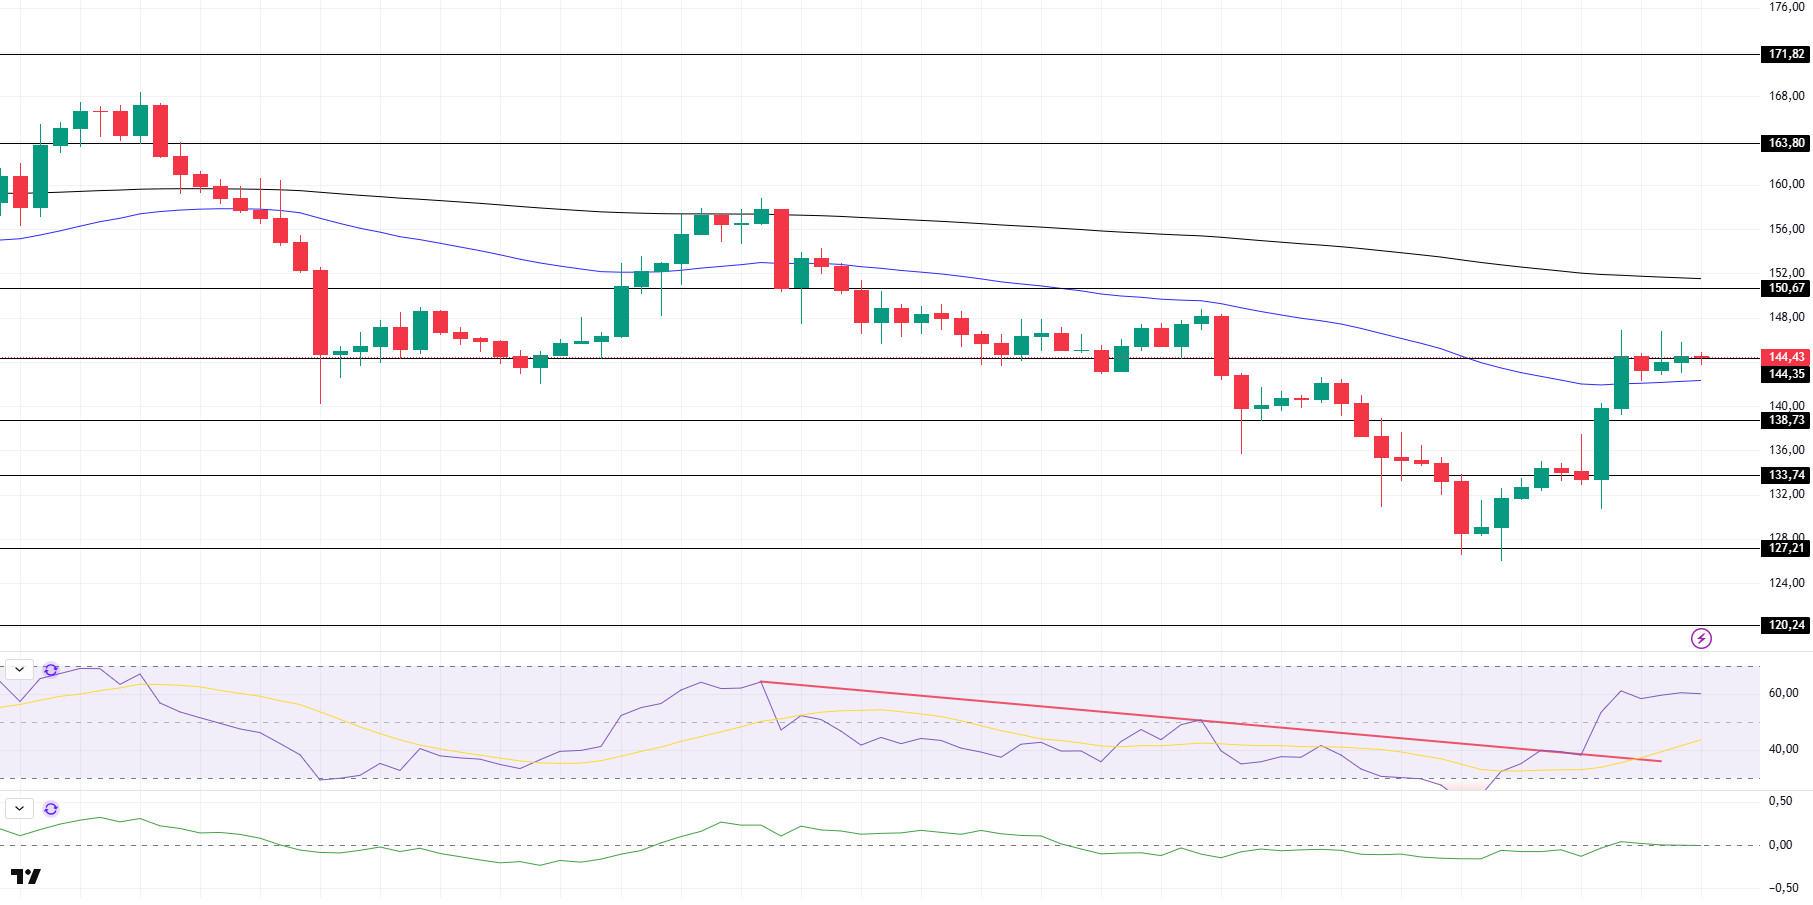
SOL price moved sideways during the day. The asset accelerated from the strong support level of $127.21 and managed to stay above the 50 EMA (Blue Line) moving average. The price, which is currently testing the $144.35 level as support, may test the 200 EMA (Black Line) moving average as resistance if the upward movement continues. Candle closes below the $ 144.35 level may experience a pullback.
On the 4-hour chart, the 50 EMA continued to be below the 200 EMA. This suggests that the bearish trend may continue in the medium term. At the same time, the fact that the price is between both moving averages suggests that the market is currently in a short-term decision-making phase. Chaikin Money Flow (CMF-20) continues to be in neutral territory; in addition, a decline in inflows could move CMF into negative territory. Relative Strength Index (RSI-14), on the other hand, continued to move in the middle of the positive zone. On the other hand, it remained above the downtrend that started on June 16. This could be bullish. The $150.67 level stands out as a strong resistance point in the event of a rise on the back of macroeconomic data or positive news on the Solana ecosystem. If this level is broken upwards, the rise can be expected to continue. If there are pullbacks due to contrary developments or profit realizations, the $ 138.73 level can be tested. In case of a decline to these support levels, the increase in buying momentum may offer a potential bullish opportunity.
Supports 144.35 – 138.73 – 133.74
Resistances 150.67 – 163.80 – 171.82
DOGE/USDT
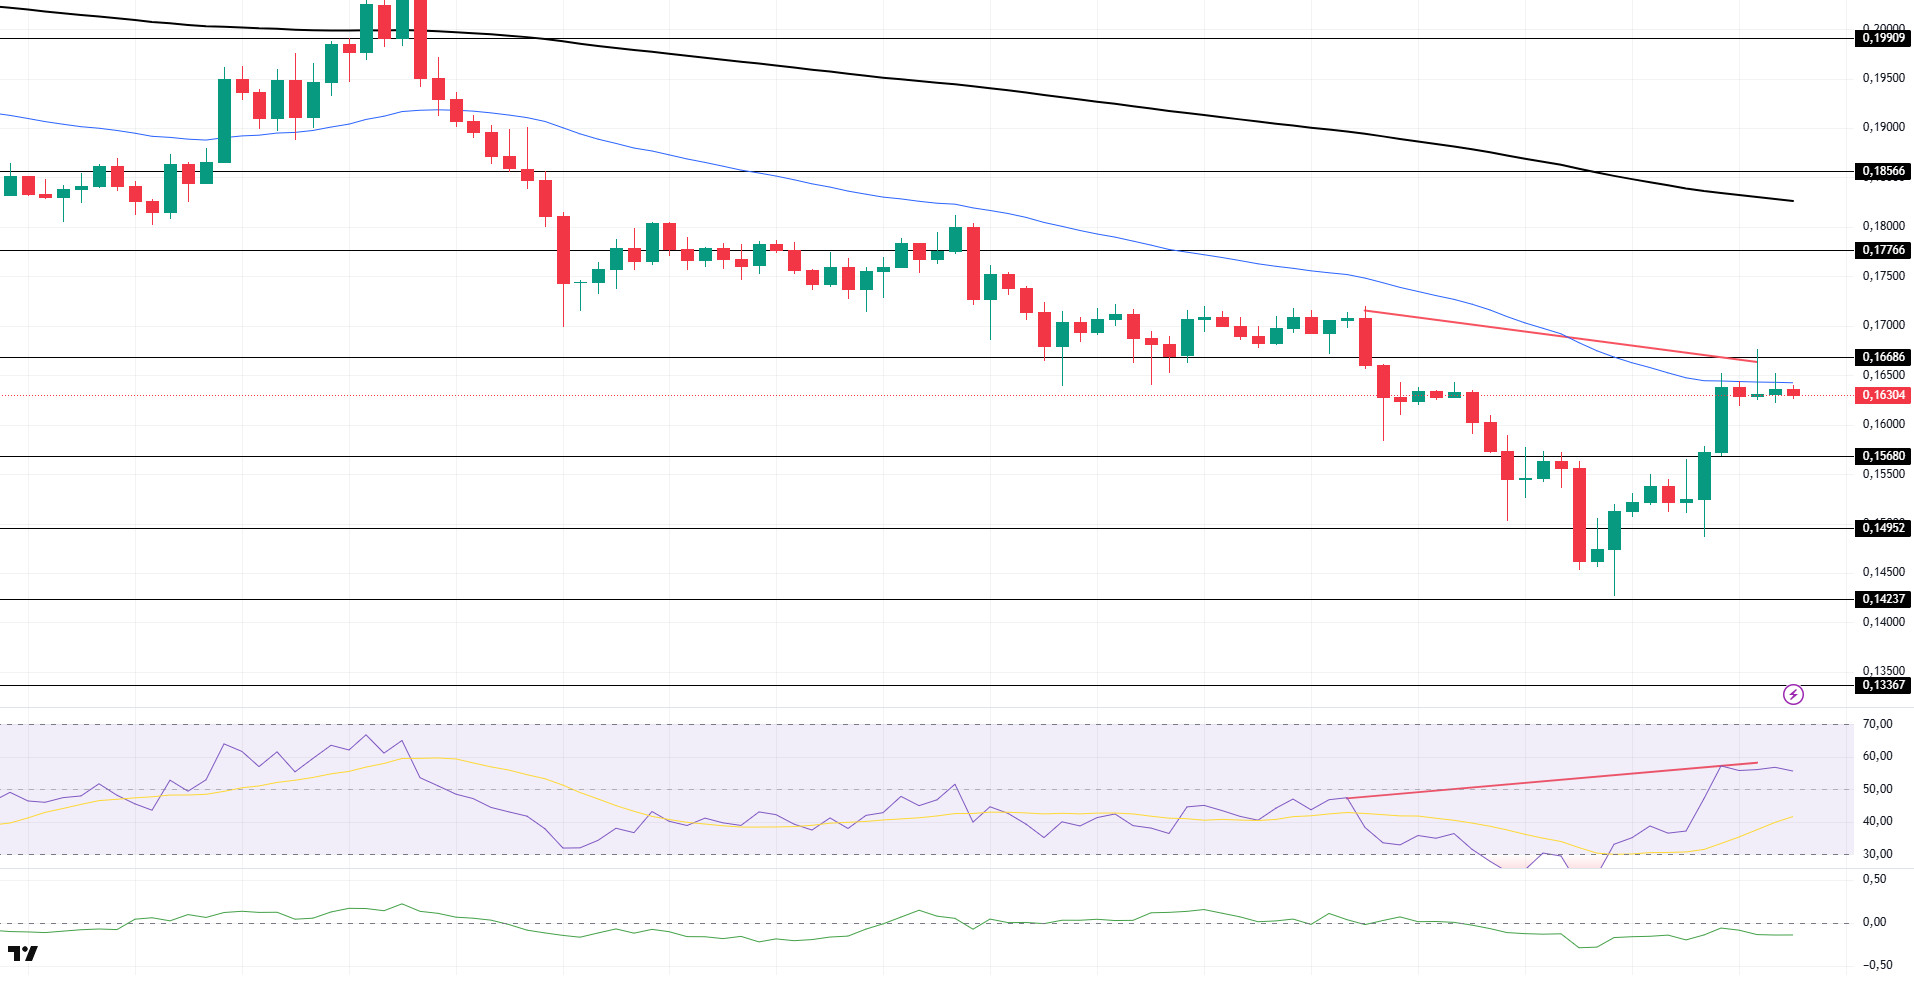
DOGE price continued to move sideways during the day. It failed to break the strong resistance at $0.16686 and remains below the 50 EMA (Blue Line) moving average. The price, which is currently testing the moving average as resistance, may test the $0.17766 level if it accelerates upwards and closes candles above the moving average.
On the 4-hour chart, the 50 EMA (Blue Line) continues to be below the 200 EMA (Black Line). This suggests that the asset is bearish in the medium term. The fact that the price is below the two moving averages signals that the asset remains bearish in the short term. Chaikin Money Flow (CMF-20) remained in negative territory. In addition, negative inflows may push CMF deeper into the negative territory. Relative Strength Index (RSI-14) remained in positive territory. However, there is a bearish mismatch. This may lead to a decline. The $0.16686 level stands out as a strong resistance zone in case of a rally in line with political developments, macroeconomic data or positive news flow in the DOGE ecosystem. In the opposite case or possible negative news flow, the $0.15680 level may be triggered. In case of a decline to these levels, the momentum may increase and a new bullish wave may start.
Supports 0.15680 – 0.14952 – 0.14237
Resistances 0.16686 – 0.17766 – 0.18566
Legal Notice
The investment information, comments and recommendations contained herein do not constitute investment advice. Investment advisory services are provided individually by authorized institutions taking into account the risk and return preferences of individuals. The comments and recommendations contained herein are of a general nature. These recommendations may not be suitable for your financial situation and risk and return preferences. Therefore, making an investment decision based solely on the information contained herein may not produce results in line with your expectations.