
BTC/USDT
At a time of accelerating regulation in crypto markets, the US Senate Banking Committee will hold an important hearing this week on reshaping the market structure of the digital asset industry. While the House of Representatives is taking a break after the “Big and Beautiful” bill, the Senate has devoted its agenda to crypto reform. On the other hand, Treasury Secretary Bessent’s announcement that he will establish new trade contacts with Chinese officials brings geopolitical and economic balances back to the agenda. On the institutional investor side, Cango’s BTC reserves exceeded 4,000 units, while Strategy aims to increase its Bitcoin buying capacity with a new $4.2 billion share issue.
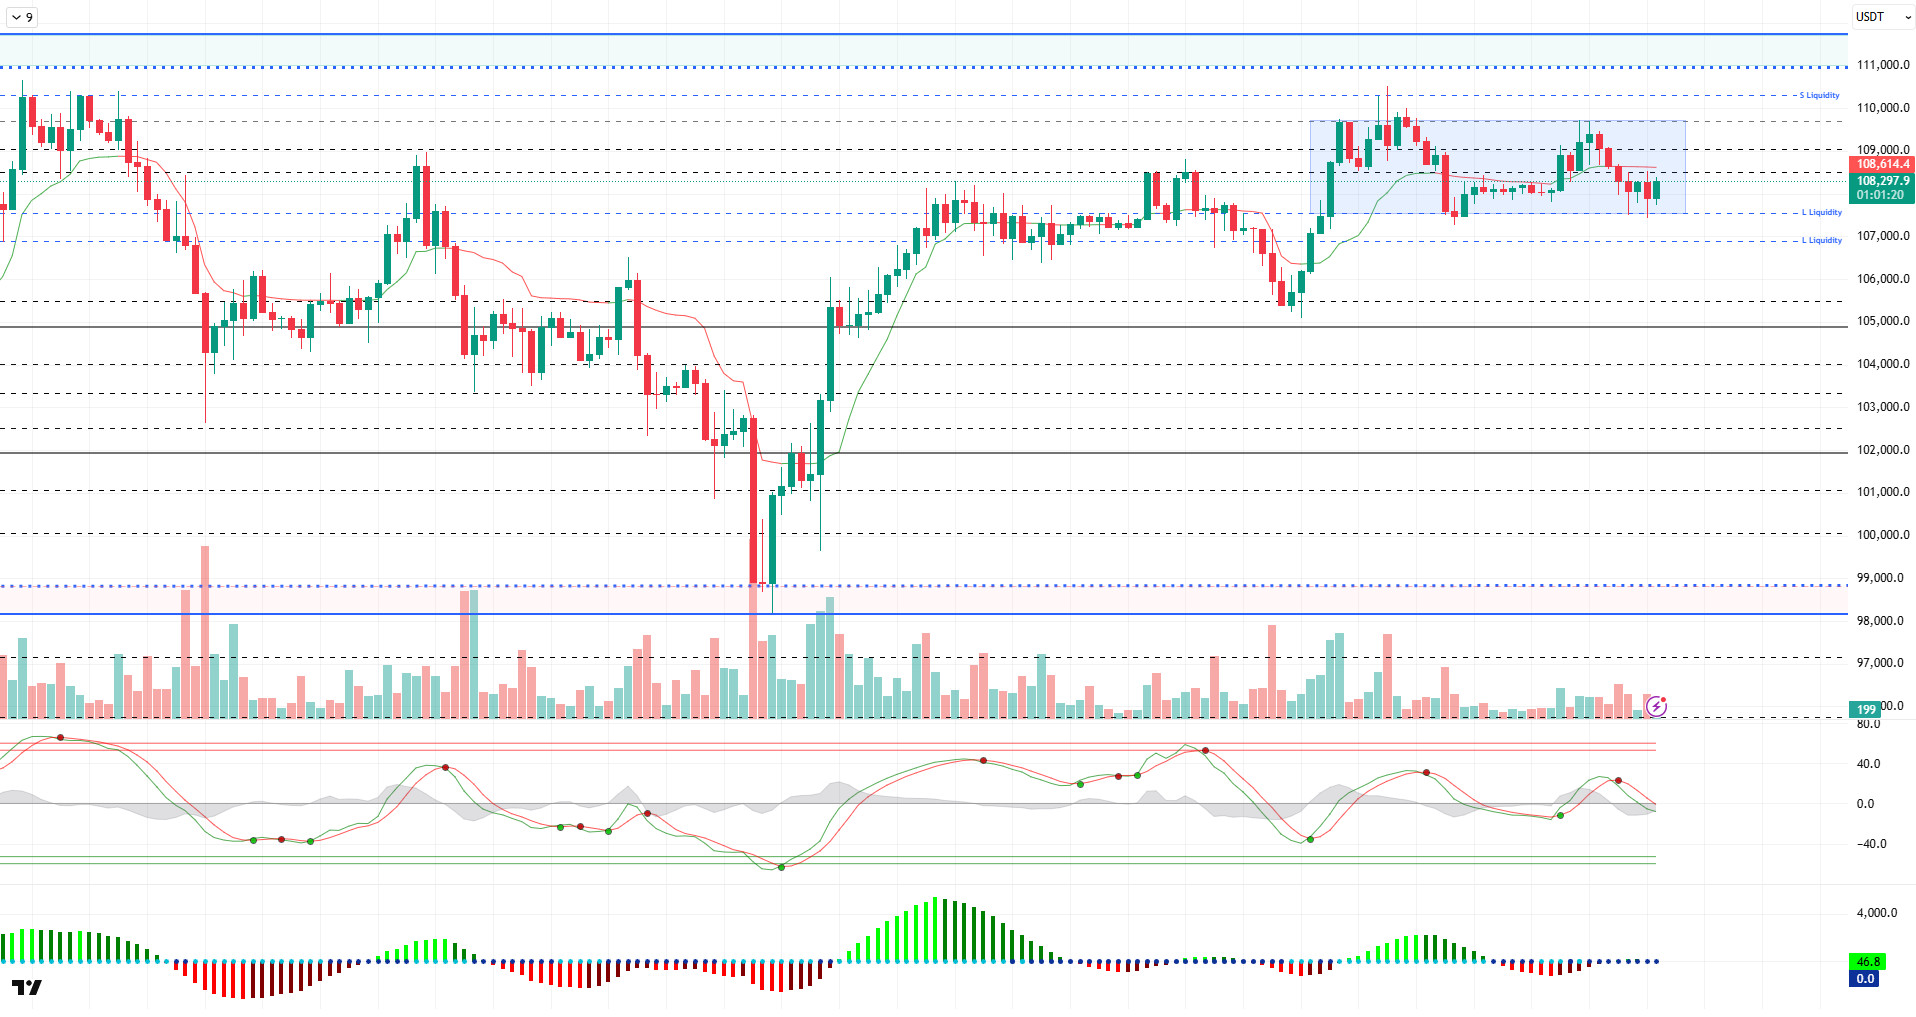
Looking at the technical outlook, BTC continues to maintain its strong stance, while the horizontal band range it formed near the ATH level draws attention. BTC, which felt a slight downward selling pressure yesterday, fell to 107,500 levels. Then, the price rebounded and settled above 108,000 once again.
Technical indicators continued to show signs of weakening with Wave Trend (WT) showing signs of weakening, while the histogram on the Squeeze Momentum (SM) indicator reflects very low volume and volatility in the neutral zone. The Kaufman moving average crossed just above the price at 108,600.
Liquidity data showed that yesterday’s decline led to the liquidation of buy trades above 107,500. The next buying level is concentrated at 107,000. The selling tier continues to accumulate at 110,000.
As a result, while fundamental developments continue to be a catalyst for pricing, a new catalyst may be needed for the uptrend to gain momentum after this stage. While the technique continues to show signs of selling, liquidity data may partially support this scenario. In this context, while liquidity areas continue to be a reference in a possible selling pressure, 107,000 will be followed as a new liquidity and support level. In the continuation of the rise, we will follow the closures above the 110,000 level to be a reference for us on behalf of ATH.
Supports 108,500 – 107,500 – 106,800
Resistances 109,000 – 110,000 – 111,000
ETH/USDT
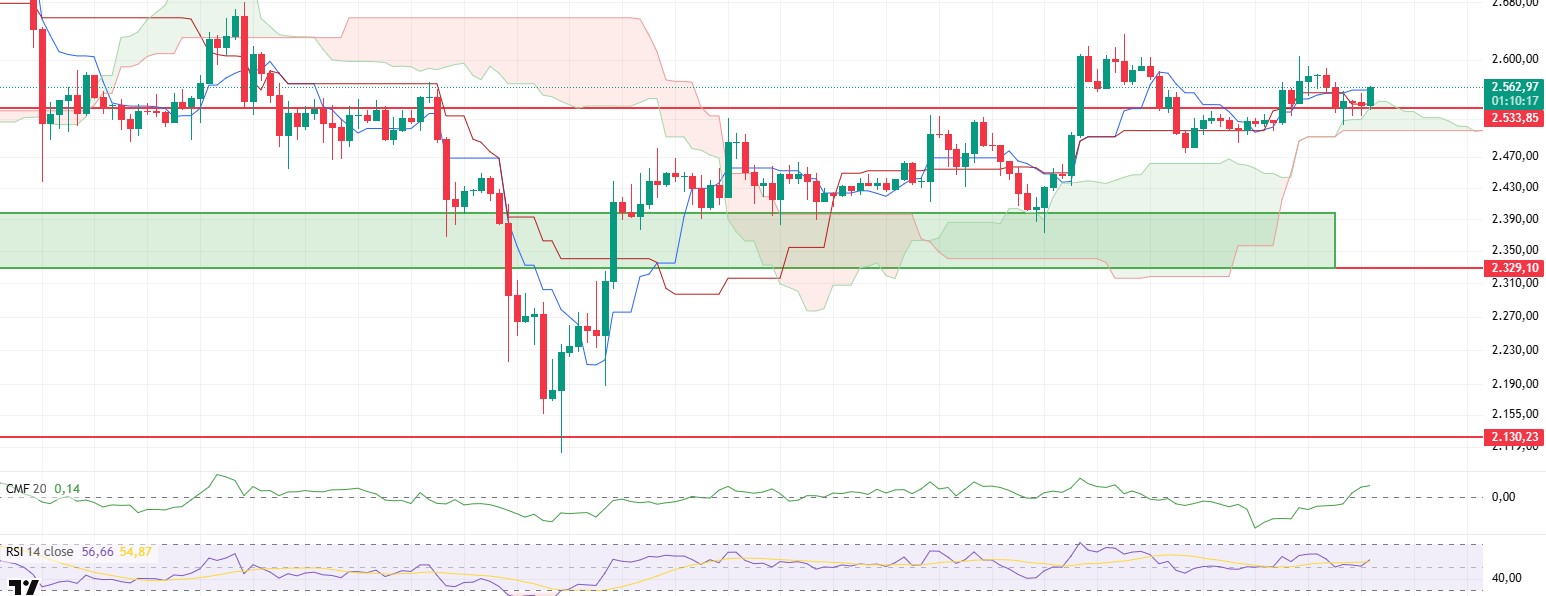
ETH fell below the $2,533 level yesterday evening with the selling pressure following the US tariff announcements but did not close below this level. This once again showed that the price zone in question is working as a strong support area, while the price rose above the $2,550 level again with the effect of purchases in the morning hours and gave signals of recovery in the short term.
Technical indicators remain generally positive. In particular, the Chaikin Money Flow (CMF) indicator remains in positive territory and continues to trend upwards, indicating that the strong liquidity flow into the market continues. This outlook indicates that investor confidence remains high and sales are considered as buying opportunities.
On the Ichimoku indicator, the fact that the price did not fall below the kumo cloud despite yesterday’s pullback stands out as an indicator that the trend remains strong. The fact that the price, which continues to stay above the cloud, rose to the tenkan level again supports that the short-term upward movement is still strong and the market continues its positive trend. Moreover, the upper band of the kumo cloud continues to support the price, indicating that downside risks remain limited.
The Relative Strength Index (RSI) indicator is another factor that supports the positive side of the analysis. The RSI, which broke upwards with the reaction from the 50 level, also managed to break above the based MA line. This structure reveals that momentum has switched back to the buy side and bullish expectations are strengthening.
In the general outlook, the probability of ETH price moving towards the $2,600 level seems high during the day. However, the $2,533 level remains important. A close below this support point could disrupt the positive technical structure and set the stage for a deeper correction.
Parte superior del formulario
Debajo del formulario
Soportes 2.533 - 2.329 - 2.130
Resistances 2,735 – 2,857 – 3,062
XRP/USDT
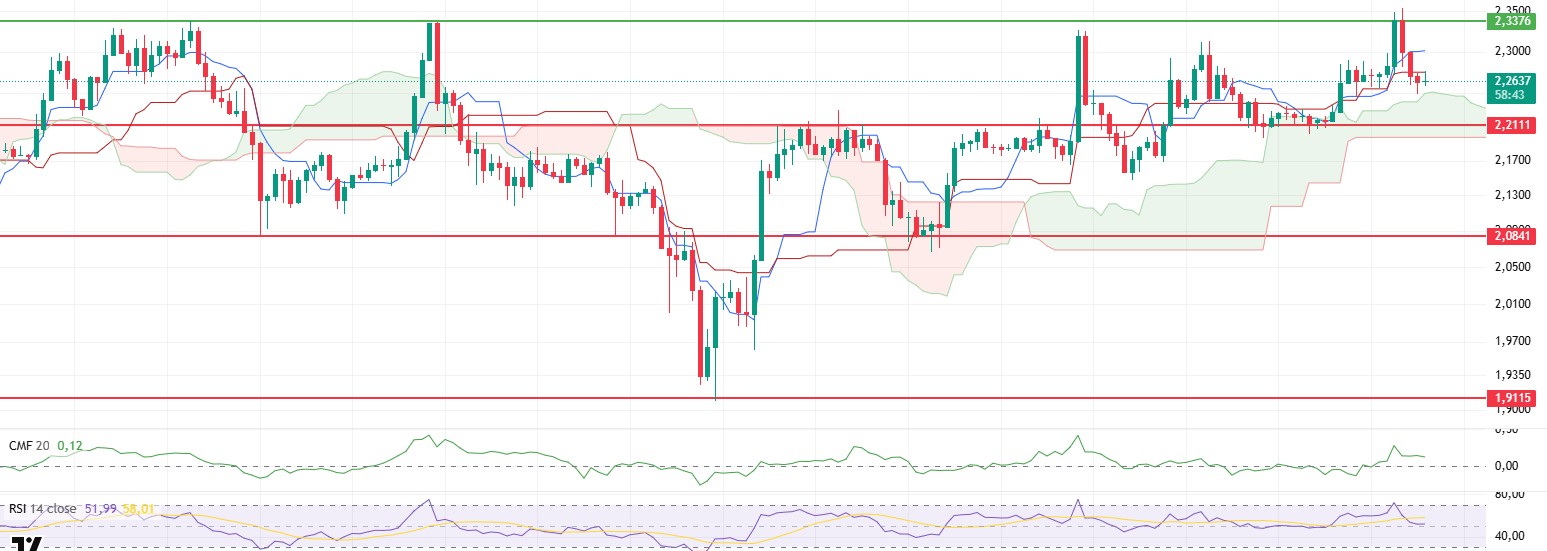
XRP gained an upward momentum yesterday evening with the positive outlook in technical indicators and managed to rise above the $2.33 level. While this movement gained strength, especially with the operation of the technical structures mentioned in the evening analysis, there was a rapid retracement as a result of the general selling pressure in the cryptocurrency markets and the price encountering an important technical resistance zone. With this correction, the price fell to the level of $2.24 and entered a short-term correction process.
When the technical structure is analyzed in detail, the fact that the price broke both tenkan and kijun levels downwards and remained below these levels indicates a weak technical structure in the short term. However, the fact that the decline took place up to the upper band of the kumo cloud on the ichimoku indicator shows that the price has not yet broken the general trend and is still in positive territory. The fact that the Kumo cloud has not fallen below and the cloud has maintained its upward slope indicates that the positive structure continues in terms of the medium-term trend.
The Relative Strength Index (RSI) indicator has fallen below the based MA line with the retracement. Although this indicates a weakening in momentum, the fact that the RSI is holding within the neutral zone suggests that the current correction may be limited and bullish expectations have not completely disappeared. The fact that the RSI remains away from the oversold zone suggests that buyers are still active in the market.
The Chaikin Money Flow (CMF) indicator, on the other hand, remains in positive territory but shows a slight pullback. This indicates that the liquidity entering the market has slowed down and investors are becoming cautious in the short term. The fact that CMF is still above zero supports that there is no complete exit from the market and the current correction may remain limited.
When evaluated in this technical framework, the price is likely to move in a horizontal band between the upper band of the kumo cloud at $2.25 and the tenkan line at $2.30 during the day. This range stands out as the main region to follow in terms of the price’s search for short-term direction . On the other hand, the $2.21 level is a critical support. It should be noted that if this level is broken downwards, the declines may accelerate and the price will be more likely to head towards lower support zones.
Supports 2.2111 – 2.0841 – 1.9115
Resistances 2.3376 – 2.5900 – 2.8347
SOL/USDT
Fidelity’s Solana ETF delayed by the SEC.
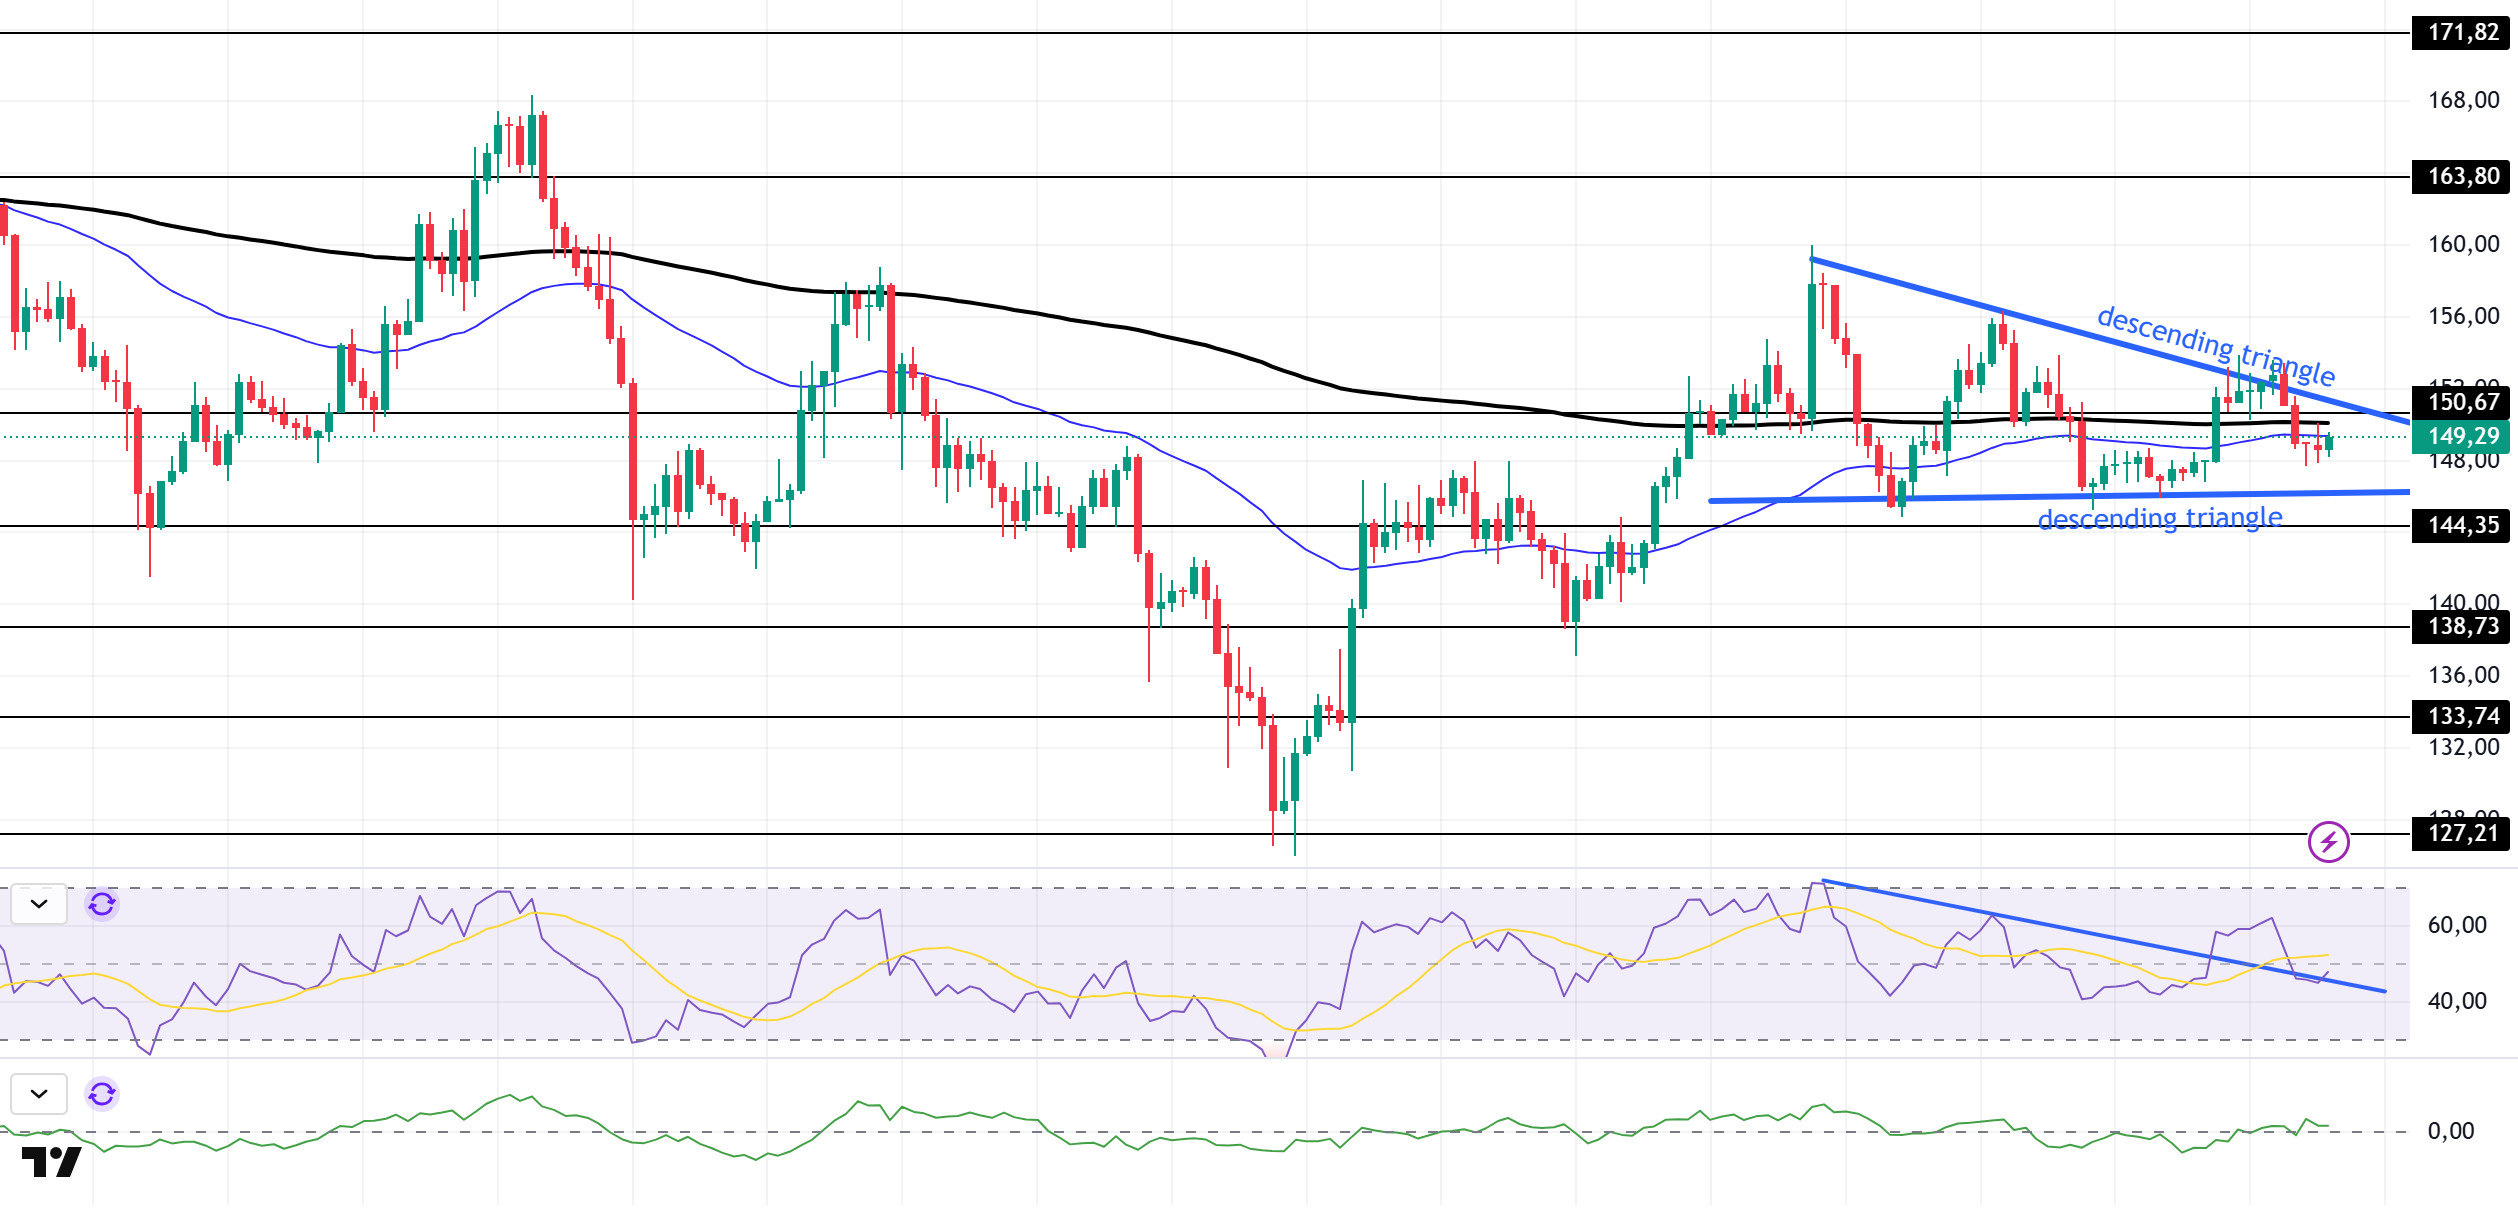
SOL price was bearish. The asset continued to remain inside the descending triangle pattern, breaking the 200 EMA (Black Line) moving average to the downside, which is a strong support. Currently, the price is below the 200 EMA and 50 EMA (Blue Line), testing the 50 EMA moving average as resistance. If it continues to stay below this level, the base level of the descending triangle pattern should be followed.
On the 4-hour chart, the 50 EMA (Blue Line) continued to be below the 200 EMA (Black Line). This suggests that the bearish trend may continue in the medium term. At the same time, the fact that the price is below both moving averages suggests that the market is currently bearish in the short term. Chaikin Money Flow (CMF-20) continued to be in positive territory; however, an increase in inflows could push CMF above the positive zone. Relative Strength Index (RSI-14) moved into negative territory. In addition, it moved back to the bottom of the downtrend that started on Junio 30. This may bring a decline. The $163.80 level stands out as a strong resistance point in the event of a rally on the back of macroeconomic data or positive news on the Solana ecosystem. If this level is broken upwards, the rise can be expected to continue. If there are pullbacks due to contrary developments or profit realizations, the $144.35 level can be tested. In case of a decline to these support levels, the increase in buying momentum may offer a potential bullish opportunity.
Soportes 144,35 - 138,73 - 133,74
Resistencias 150,67 - 163,80 - 171,82
DOGE/USDT
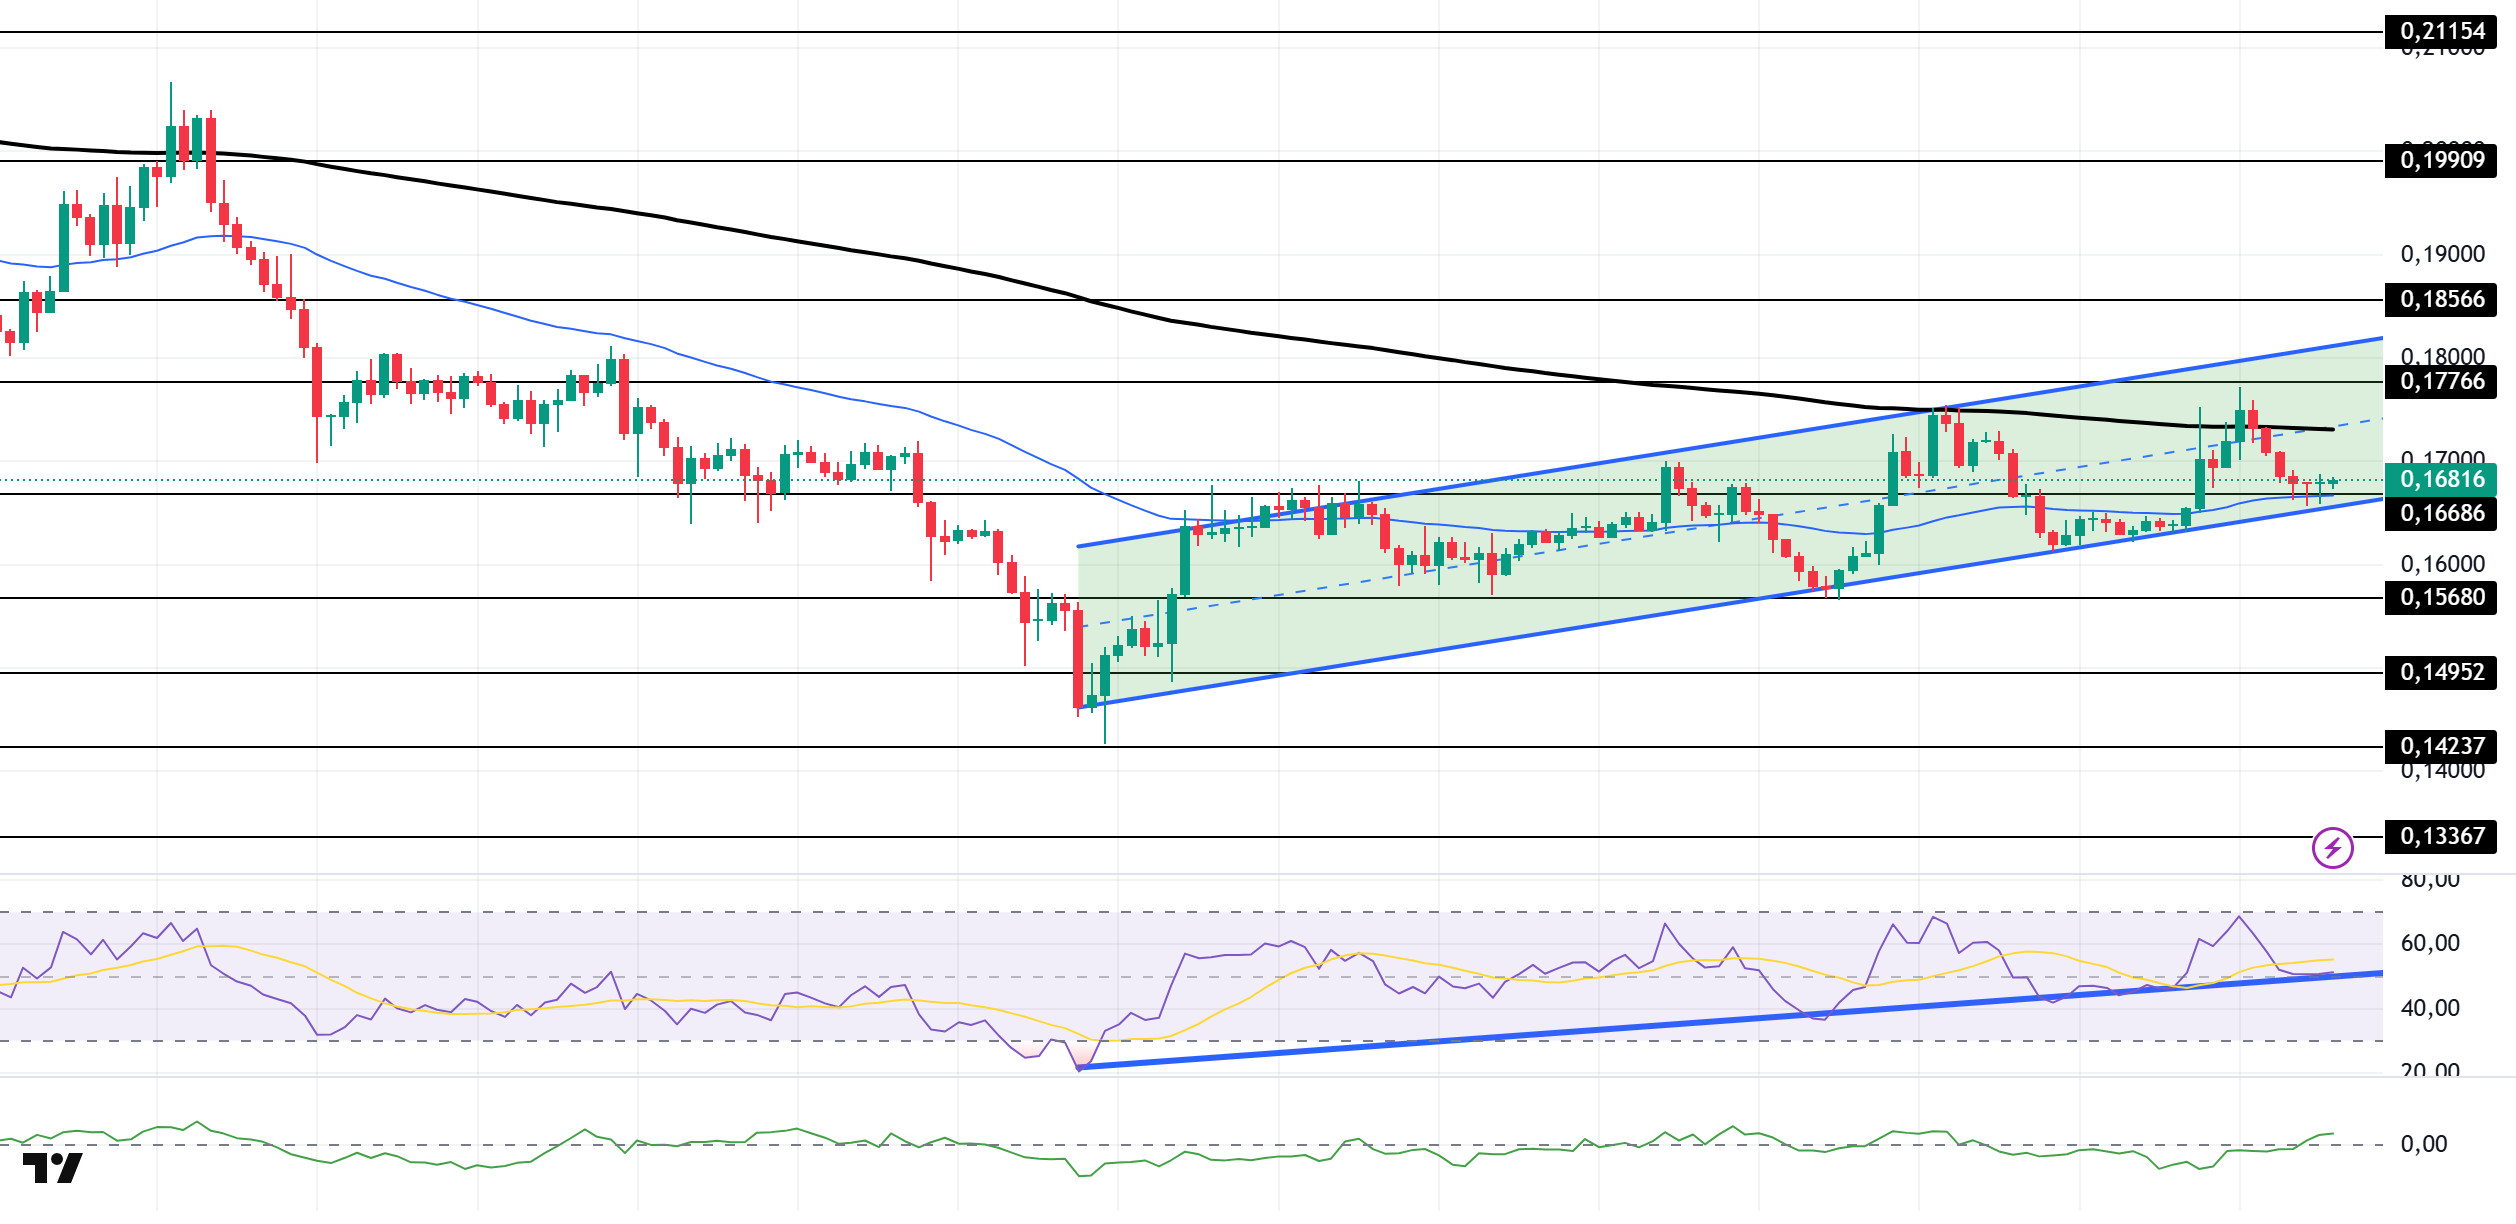
DOGE price depreciated. The asset, which managed to stay above the 50 EMA (Blue Line) moving average, failed to stay above the 200 EMA (Black Line) moving average and is currently testing the base level of the uptrend as support. If the price, which continues to stay in the falling pennant pattern, continues to retreat, the level of $ 0.15680 can be followed on candle closures below the falling pennant pattern.
On the 4-hour chart, the 50 EMA (Blue Line) continues to be below the 200 EMA (Black Line). This suggests that the asset is bearish in the medium term. The fact that the price is between both moving averages suggests that the asset is in the decision-making phase in the short term. Chaikin Money Flow (CMF-20) started to be in positive territory. In addition, positive inflows may push CMF to the upper levels of the positive zone. Relative Strength Index (RSI-14), on the other hand, retreated from the overbought level and retreated to the middle of the positive zone, indicating that selling pressure is building. However, it continues to be above the uptrend that started on Junio 22. The $0.17766 level stands out as a strong resistance zone in the uptrend that may be experienced in line with political developments, macroeconomic data or positive news flow in the DOGE ecosystem. In the opposite case or possible negative news flow, the $0.15680 level may be triggered. In case of a decline to these levels, the momentum may increase and a new bullish wave may start.
Soportes 0,16686 - 0,15680 - 0,14952
Resistencias 0,17766 - 0,18566 - 0,19909
Aviso legal
La información sobre inversiones, los comentarios y las recomendaciones que figuran en este documento no constituyen asesoramiento en materia de inversiones. Los servicios de asesoramiento en materia de inversión son prestados individualmente por instituciones autorizadas teniendo en cuenta las preferencias de riesgo y rentabilidad de los particulares. Los comentarios y recomendaciones aquí contenidos son de carácter general. Estas recomendaciones pueden no ser adecuadas para su situación financiera y sus preferencias de riesgo y rentabilidad. Por lo tanto, tomar una decisión de inversión basándose únicamente en la información aquí contenida puede no producir resultados acordes con sus expectativas.

