
Technical Analysis
BTC/USDT
US President Donald Trump announced that the tariff plan set to take effect on August 1 will not be postponed and that the decision is final. It was also reported that India will face a 25% tariff and additional sanctions. The US economy grew by 3% on an annualized basis in the second quarter of 2025, while private sector employment rose by 104K in July. Following the data, President Trump reiterated his call for interest rate cuts. While the White House’s first cryptocurrency report to be released today will cover tokenization, the SEC framework, and legislative proposals, the market’s focus will be on the Fed’s interest rate meeting and Powell’s message on the economy later in the day.
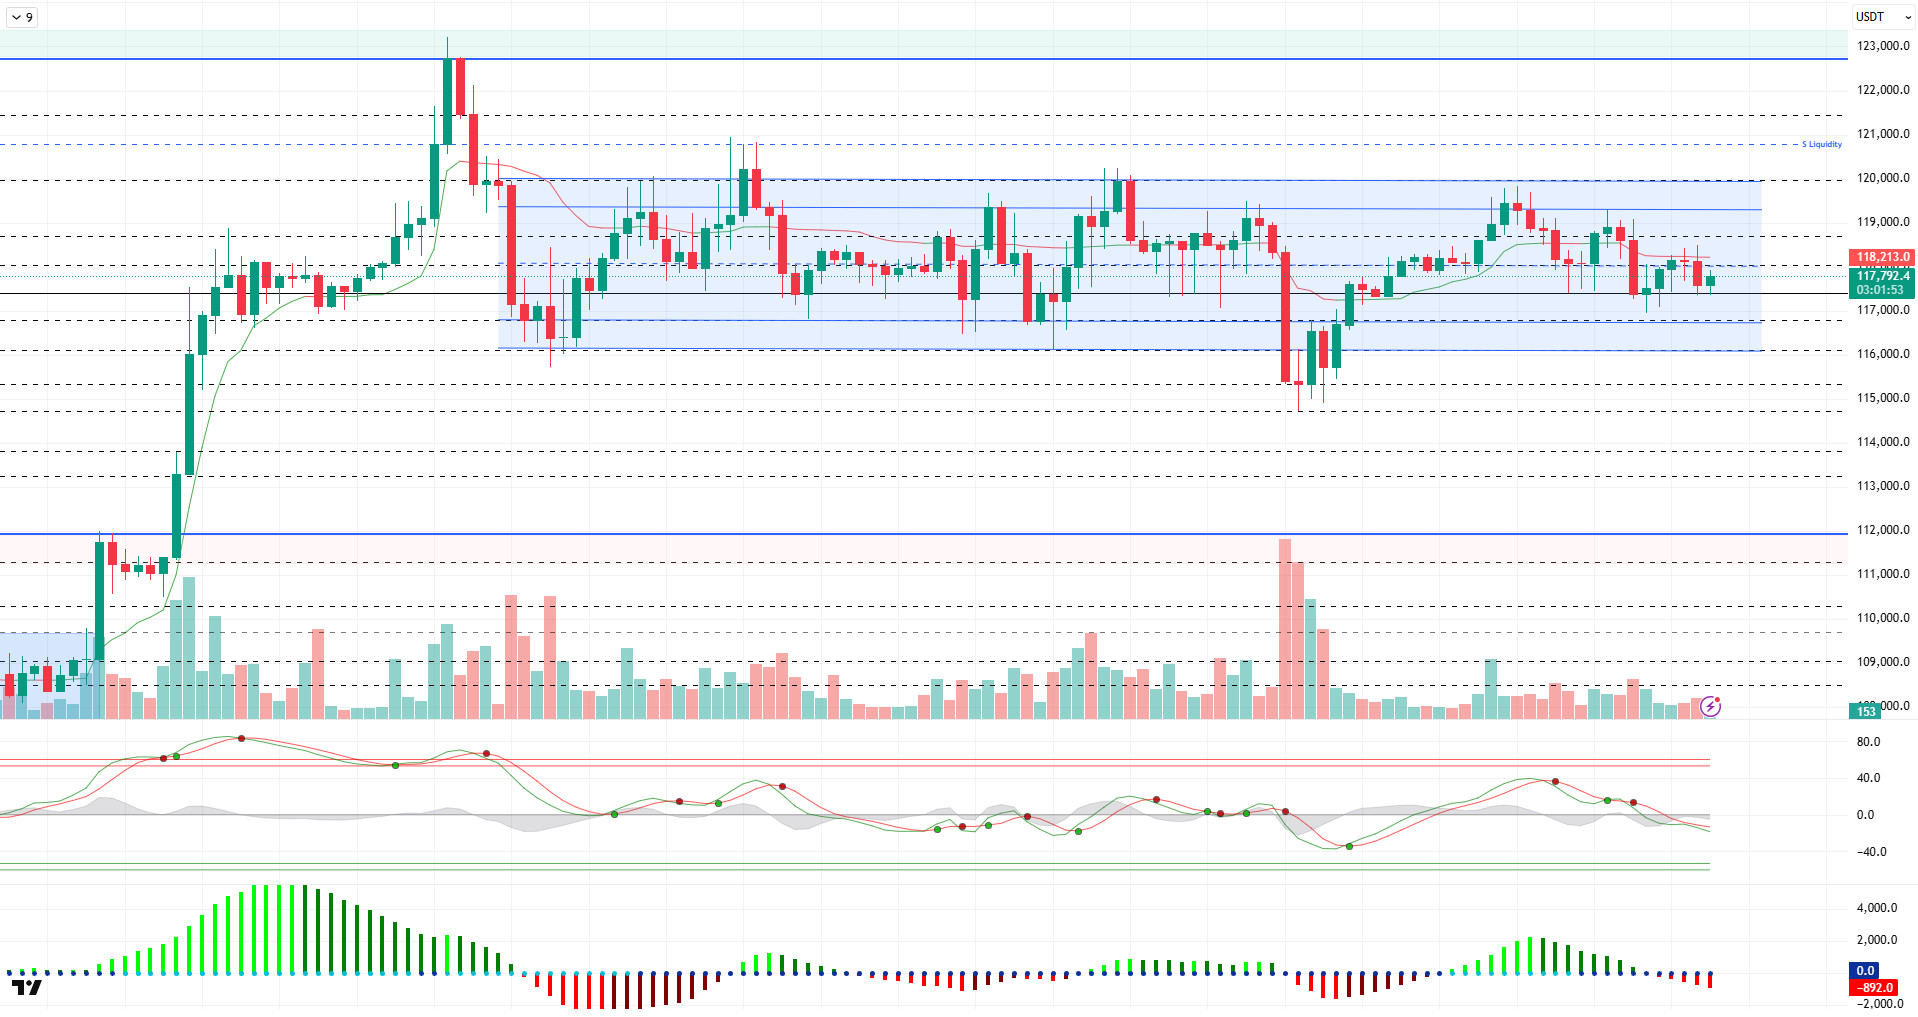
Looking at the technical picture, BTC has formed a minor downward trend channel within a horizontal band compared to the previous analysis and has retreated to the 117,400 level. At the time of writing, it continues to trade at a slightly bearish 117,600 level.
On the technical indicators front, the Wave Trend (WT) oscillator has been showing an indecisive pattern within the channel’s middle band for an extended period and continues to signal divergence. The Squeeze Momentum (SM) indicator has re-entered the negative zone, confirming the downtrend. The Kaufman moving average is positioned just below the price at the 118,200 level.
Looking at liquidity data, liquidation occurred at the 117,000 level, where short-term buy orders have accumulated. However, increasing sell-side transactions above the 120,000 level are noteworthy.
In summary, along with fundamental developments, the BTC price continues to remain in a band close to its ATH level, while the consolidation process has been ongoing since July 14. The technical outlook shows inconsistent results along with indecisive price movements. Liquidity data, on the other hand, shows us the price’s reversals from its reaction areas. In this context, the developments mentioned at the beginning may bring a breakout in terms of price. If the price buys liquidity, it is expected to test above the 120,000 level, while the 117,500 support level can be followed in the event of a possible selling pressure. In the event of a breakout and hourly closes below this level, the 115,000-reference zone will come into focus.
Support levels: 118,000 – 117,500 – 116,800
Resistance levels: 118,600 – 120,000 – 120,600
ETH/USDT
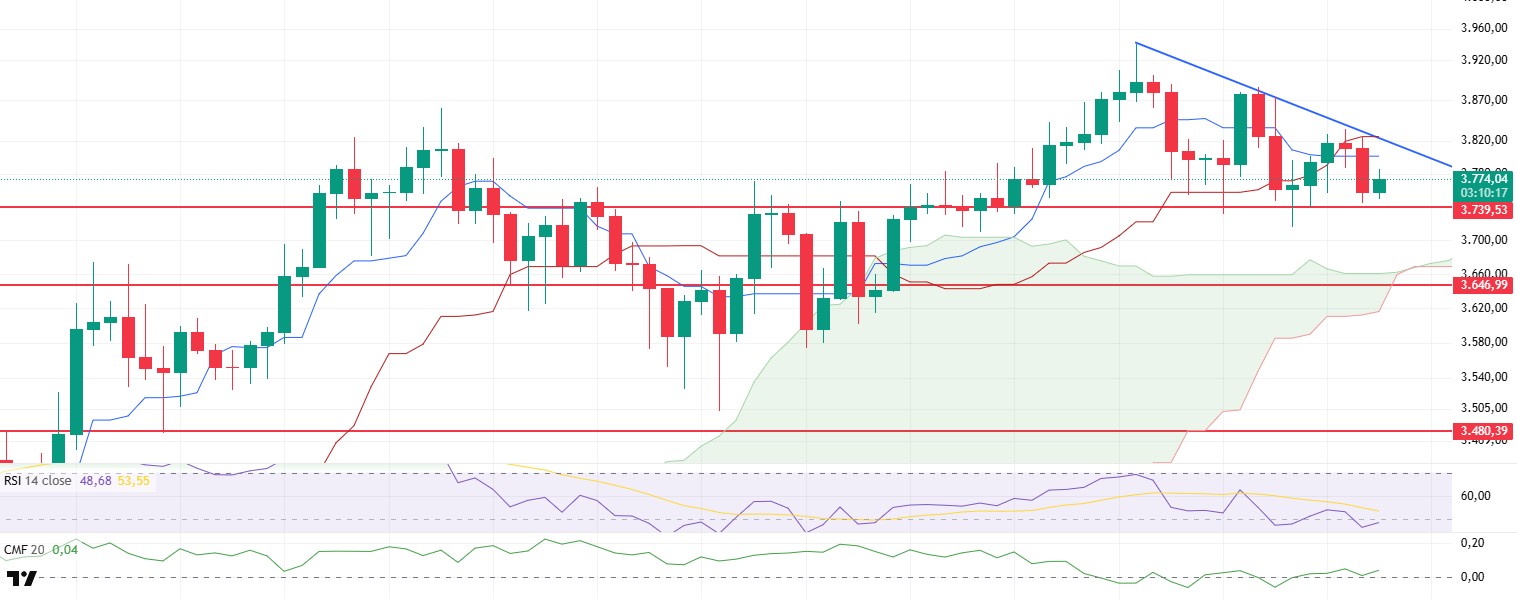
The ETH price reacted to the downward trend line shown in blue on the chart during the day and fell back to the support level of $3,739, in line with expectations. With the reaction from this level, the price recovered slightly and is currently trying to hold above the $3,770 level.
When technical indicators and on-chain data are analyzed together, the market structure appears weak in the short term but open to recovery in the medium term. The decline in open interest data indicates that long positions are continuing to close, while short positions are gradually increasing. This structure confirms that selling pressure is decreasing, particularly with the decline in upward positions, and that upward potential on the price is beginning to regain strength.
However, technical indicators point to the persistence of downside risk in the short term. The Relative Strength Index (RSI) indicator continues to form lower highs alongside the price and remains below the MA level. This indicates weak momentum and limited buyer interest. In the Ichimoku indicator, the price falling below both the tenkan and kijun levels and the tenkan line crossing below the kijun line has triggered a strong technical sell signal. This structure strengthens the likelihood of the price coming under downward pressure again.
All of these technical indicators suggest that a break below the $3,739 support level could accelerate the decline and push the price back to the $3,646 level. However, on-chain data points to the possibility that any declines may be limited and that the overall market structure remains positive. The gradual decrease in long positions and the increase in short positions suggest that the market is beginning to rebalance, which could trigger an upward correction in the coming days.
Therefore, despite ongoing technical pressure, the positive structure in on-chain data supports the idea that declines are more likely to be short-term corrections rather than sustained declines. In particular, if the price breaks above the downward trend line drawn in blue, the technical negative scenario could become invalid, and in this case, the price could initiate a new upward wave toward the $3,900 level.
Supports: 3,739 – 3,646 – 3,480
Resistances: 4,084 – 4,381 – 4,857
XRP/USDT
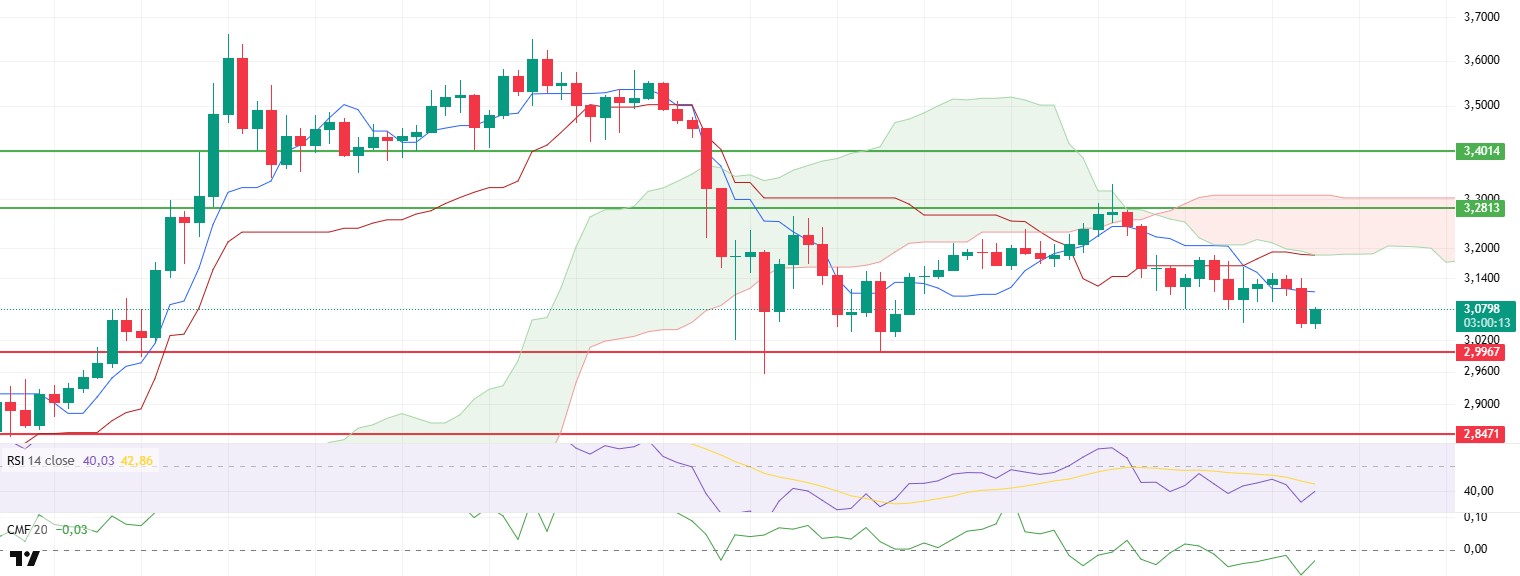
XRP fell below the $3.10 level during the day and retreated to the $3.04 region. Although the price recovered to the $3.08 level with buying from this region, the weakness in technical indicators is noteworthy and indicates that the short-term outlook is still under pressure.
In particular, the Chaikin Money Flow (CMF) indicator, which measures liquidity flow, has moved into negative territory, indicating an increase in capital outflows from the market and a weakening of buy-side activity. This supports the notion that investors are acting cautiously and risk appetite remains low.
The Relative Strength Index (RSI) indicator also continues to show a structurally weak appearance alongside prices. The indicator remains below neutral levels and continues to trade below the based MA line. This technical structure confirms that the buyer side lacks the strength to drive the market, in line with the decline in momentum. The limited upward movement is also a direct result of this weak momentum.
When examining the Ichimoku indicator, the price moving below both the Tenkan and Kijun lines, while also trading below the Kumo cloud, clearly indicates that the negative technical structure is persisting. Continued pricing below the cloud signals that the market’s short-term direction has shifted downward and that the bearish trend remains dominant.
Overall, if selling pressure intensifies in the evening, the 2.99 dollar support level could be tested again. A break below this level could lead to a deeper decline, bringing lower support zones into focus. However, if this level is maintained ( ), the possibility of the price forming a bottom in this region and producing a renewed upward reaction remains on the table. Therefore, the $2.99 level stands out as a critical threshold in the short term, both technically and psychologically. If the support zone is maintained, it is possible to say that the structure is still generally positive.
Supports 2.9967 – 2.8471 – 2.6513
Resistances: 3.2813 – 3.4014 – 3.8615
SOL/USDT
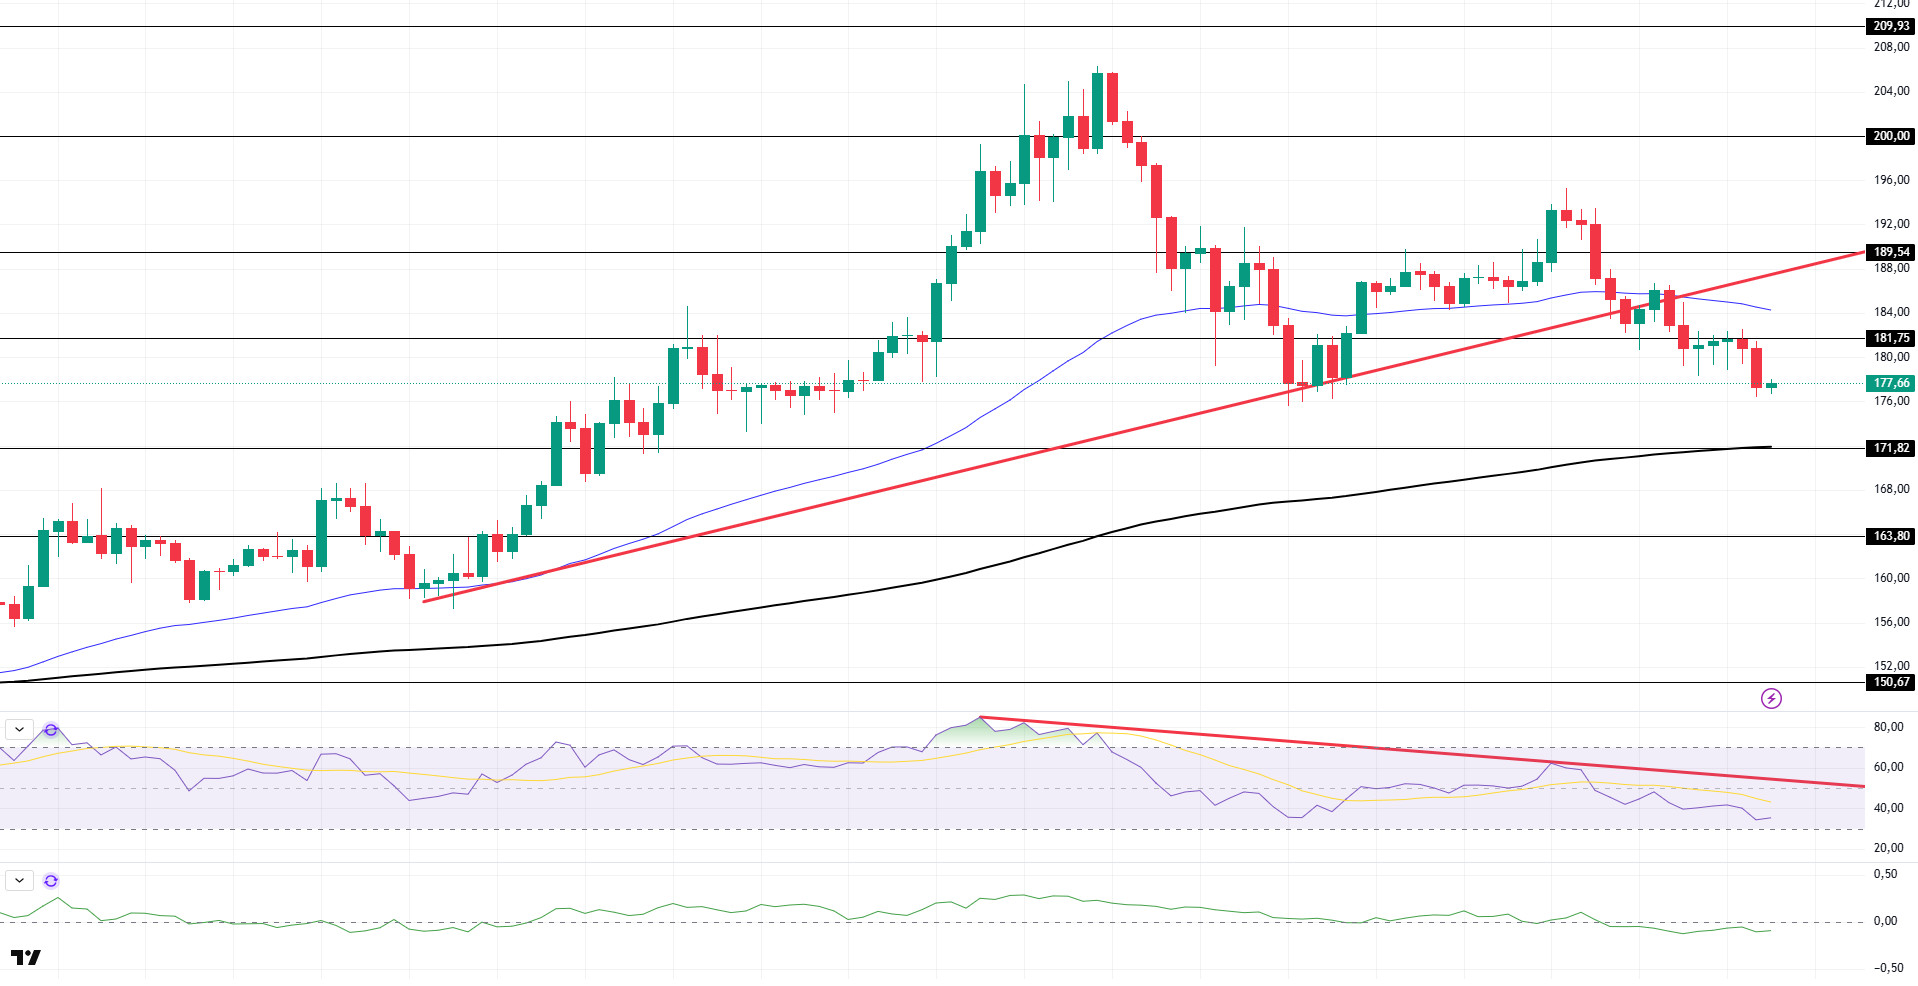
SOL price showed a downward trend during the day. The asset remained below the upward trend that began on July 15. The price tested the strong resistance level of $181.75 but failed to break through it and retreated. If the retreat continues, the 200 EMA (Black Line) moving average can be monitored. If an uptrend begins, the 189.54-dollar level can be monitored.
On the 4-hour chart, the 50 EMA (Blue Line) remains above the 200 EMA (Black Line). This indicates that the upward trend could continue in the medium term. Additionally, the price being between the two moving averages suggests that the market is currently in a decision phase. Chaikin Money Flow (CMF-20) has continued to remain in the negative zone. However, a decrease in money inflows could push the CMF further into the negative zone. The Relative Strength Index (RSI-14) has continued to remain below the downward trend that began on July 21. In the event of an upward movement due to macroeconomic data or positive news related to the Solana ecosystem, the $189.54 level emerges as a strong resistance point. If this level is broken upward, the upward trend is expected to continue. In the event of a pullback due to adverse developments or profit-taking, the $171.82 level could be tested. A decline to these support levels could see an increase in buying momentum, presenting a potential opportunity for an upward move.
Support levels: 171.82 – 163.80 – 150.67
Resistance levels: 181.75 – 189.54 – 200.00
DOGE/USDT
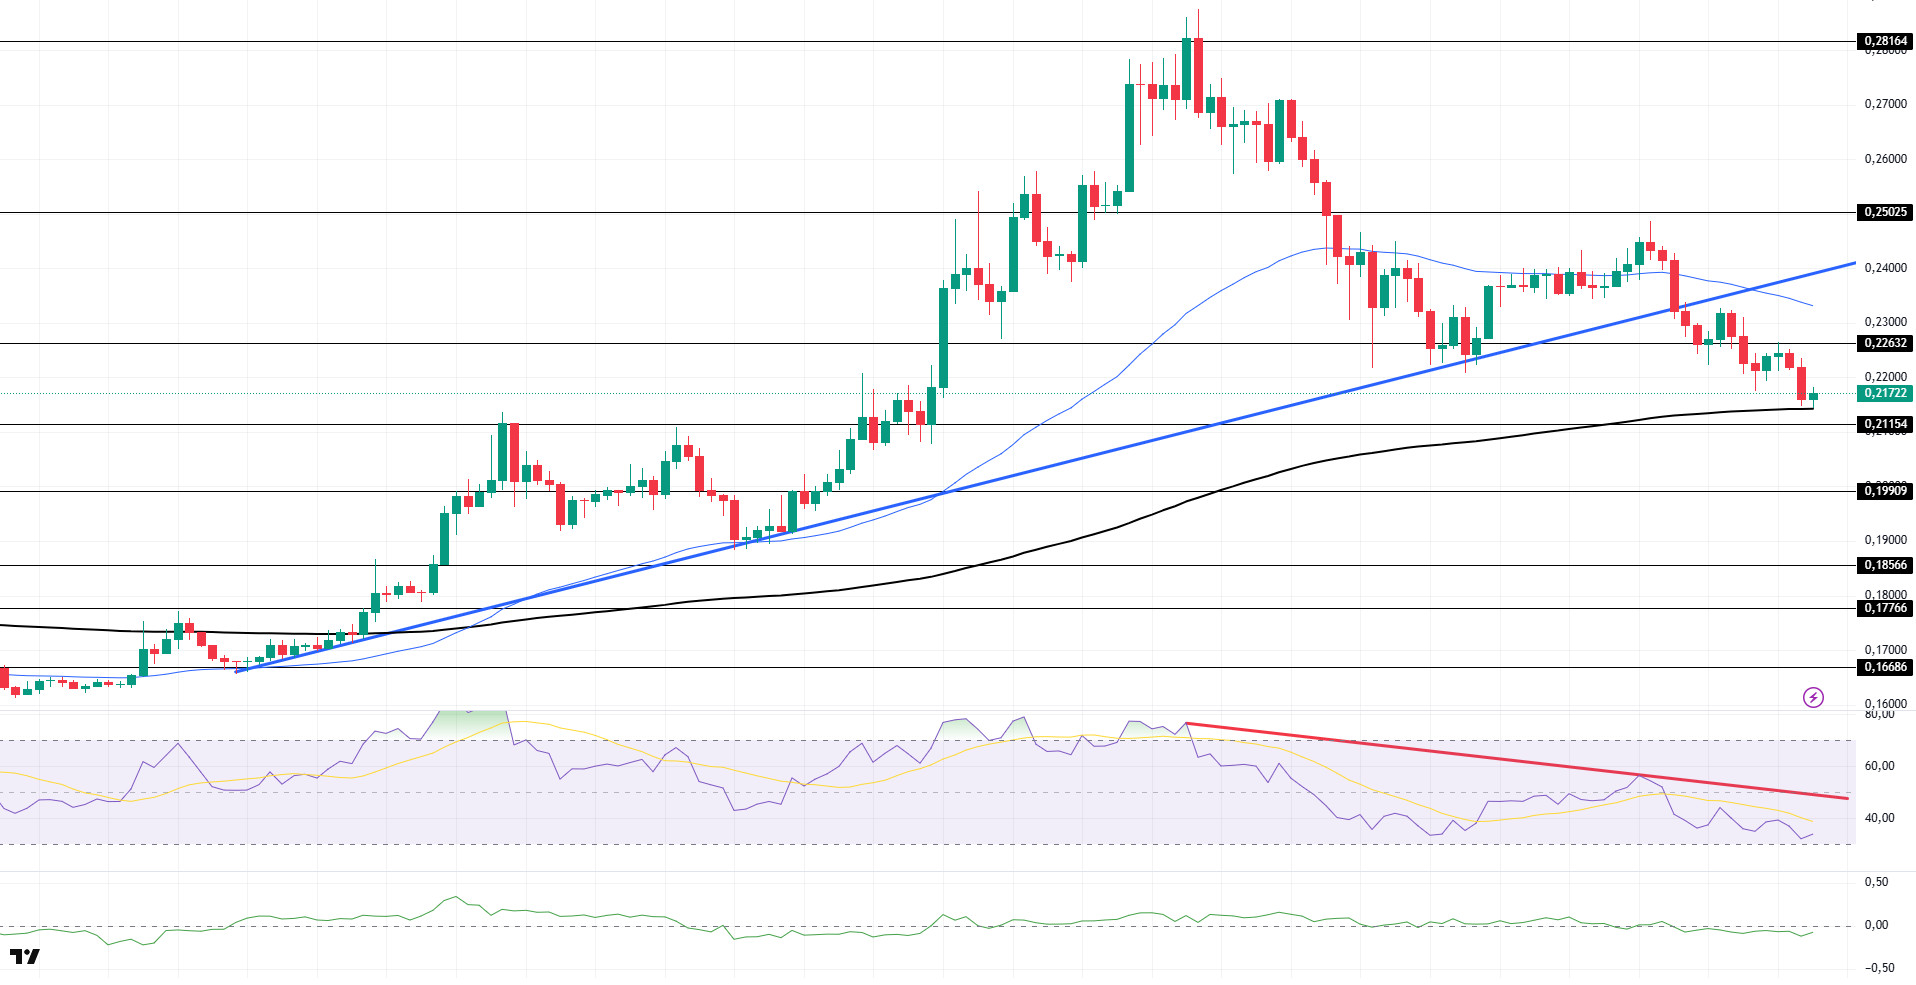
The DOGE price experienced a decline during the day. The asset continued to trade below the 50 EMA (Blue Line) moving average, which began on July 7. The price tested the $0.22632 level as resistance but failed to break through, continuing its pullback. As of now, it is testing the 200 EMA (Black Line) moving average as support. If the pullback continues, the 0.19909-dollar level can be monitored as support. If the upward movement begins, the 0.22632 dollar level should be monitored.
On the 4-hour chart, the 50 EMA (Blue Line) remains above the 200 EMA (Black Line). This indicates that the asset is in an upward trend in the medium term. The price being between the two moving averages indicates that the asset is in a decision phase in the short term. The Chaikin Money Flow (CMF-20) remained in negative territory. Additionally, negative cash inflows could push the CMF further into the negative zone. The Relative Strength Index (RSI-14) remains in the negative zone. Furthermore, it remains below the downward trend that began on July 21. This could continue the downward movement. In the event of upward movements driven by political developments, macroeconomic data, or positive news flow within the DOGE ecosystem, the $0.25025 level emerges as a strong resistance zone. In the opposite scenario or in the event of negative news flow, the 0.19909 dollar level could be triggered. A decline to these levels could increase momentum and potentially initiate a new upward wave.
Support levels: 0.21154 – 0.19909 – 0.18566
Resistance levels: 0.22632 – 0.25025 – 0.28164
Legal Notice
The investment information, comments, and recommendations contained herein do not constitute investment advice. Investment advisory services are provided individually by authorized institutions taking into account the risk and return preferences of individuals. The comments and recommendations contained herein are of a general nature. These recommendations may not be suitable for your financial situation and risk and return preferences. Therefore, making an investment decision based solely on the information contained herein may not produce results in line with your expectations.