
Análisis técnico
BTC/USDT
Strategy purchased 155 BTC at an average price of $116,401 during the week of Agosto 4–10. U.S. President Donald Trump stated that the development of cryptocurrencies would accelerate during his administration. Empery Digital increased its total Bitcoin holdings to 4,018 by purchasing 17.51 BTC. According to CoinShares data, following the approval of cryptocurrency investments in 401(k) retirement plans, weekly net inflows into digital asset funds reached $572 million.
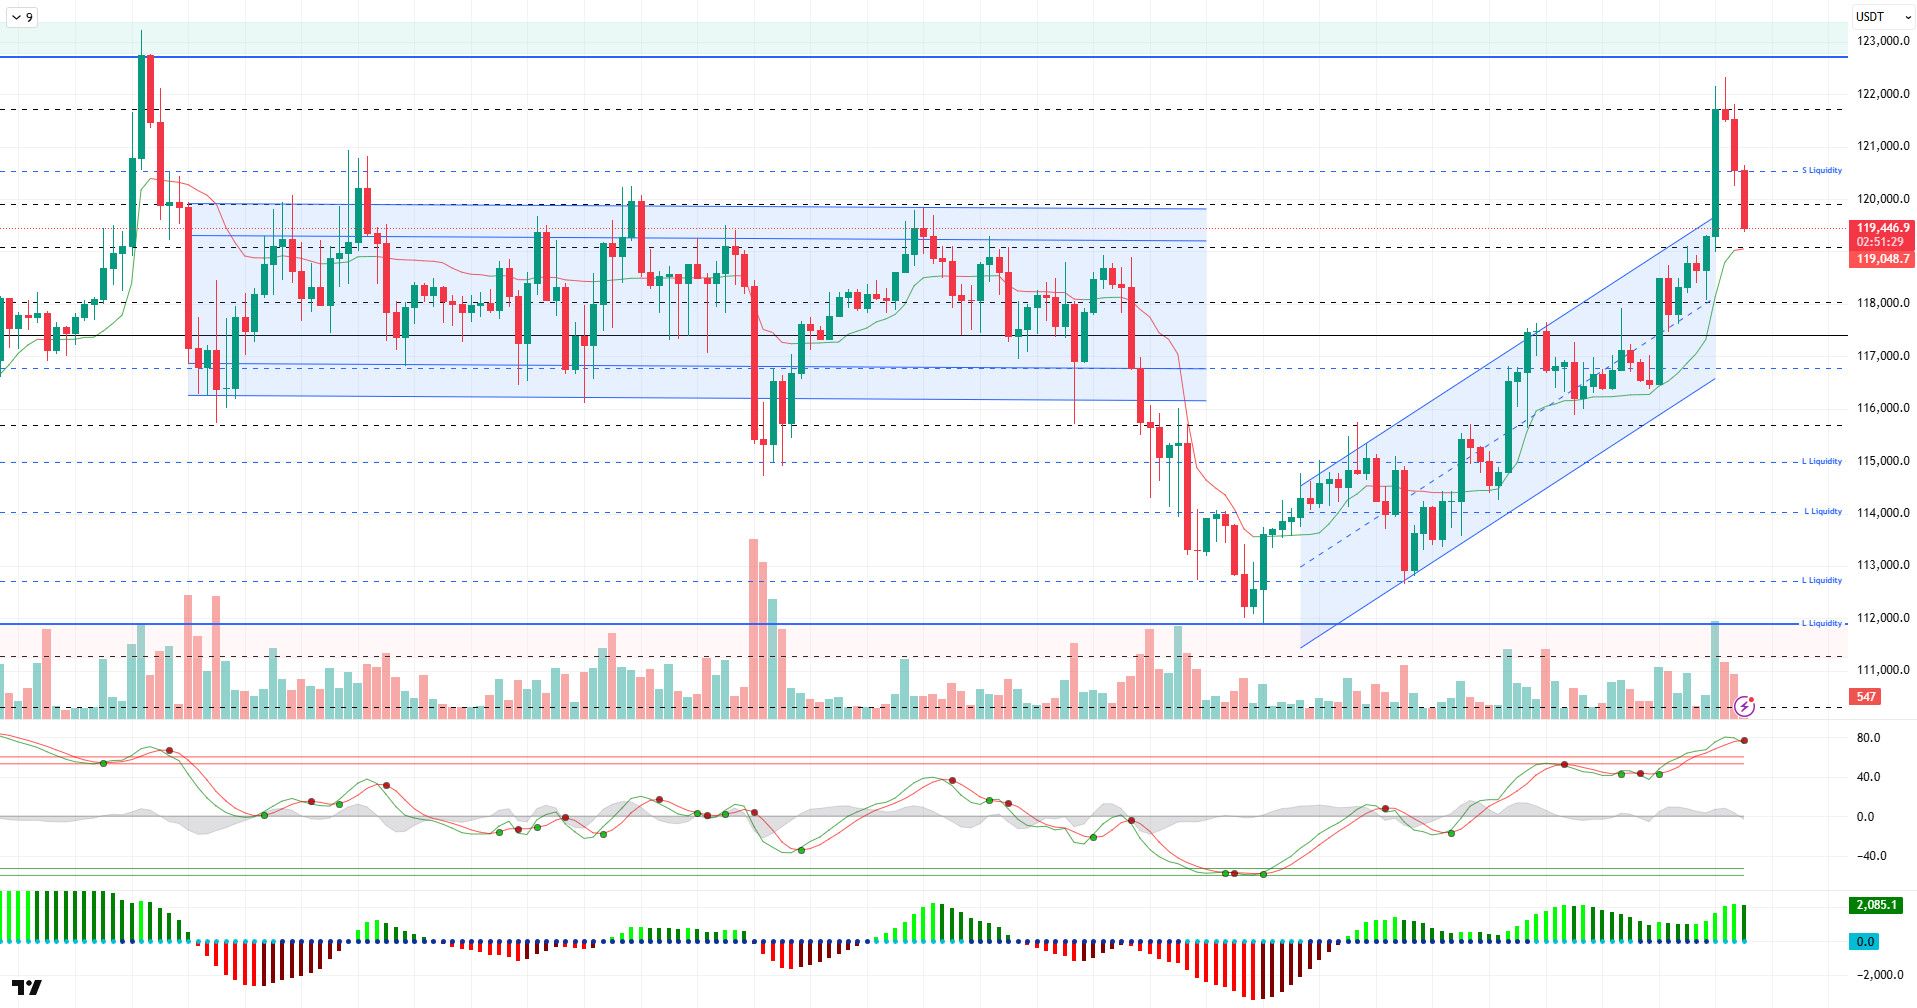
Looking at the technical picture, BTC, which had been testing its all-time high (ATH) level in the previous analysis, has entered a correction phase amid profit-taking. As of the time of this analysis, the price has retreated to the 119,500 level, with volatile movements present. If it manages to recover, it could form a flag pattern.
Technical indicators show that the Wave Trend oscillator (WT) has crossed the overbought zone and surpassed the saturation point. The Squeeze Momentum (SM) indicator continues to accelerate in the positive zone. The Kaufman moving average is currently trading below the price at the 119,000 level.
Looking at liquidity data, buy positions have continued to increase significantly in the 115,000 range following the recent rise. Sell positions have once again increased at the 123,000 level.
In summary, while fundamental developments continue to send positive signals for BTC, the technical structure reflects that price movements have reached their saturation point and that the correction movement may continue. Liquidity data continues to outline the price range on the chart. In this context, the new support level formed at 115,000, and if the price finds support at the 119,000 KAMA level, closes above the 120,000 level could target the 123,000 level as the next target area.
Support levels: 119,000 – 118,000 – 117,500
Resistance levels: 120,000 – 121,500, 123,000
ETH/USDT
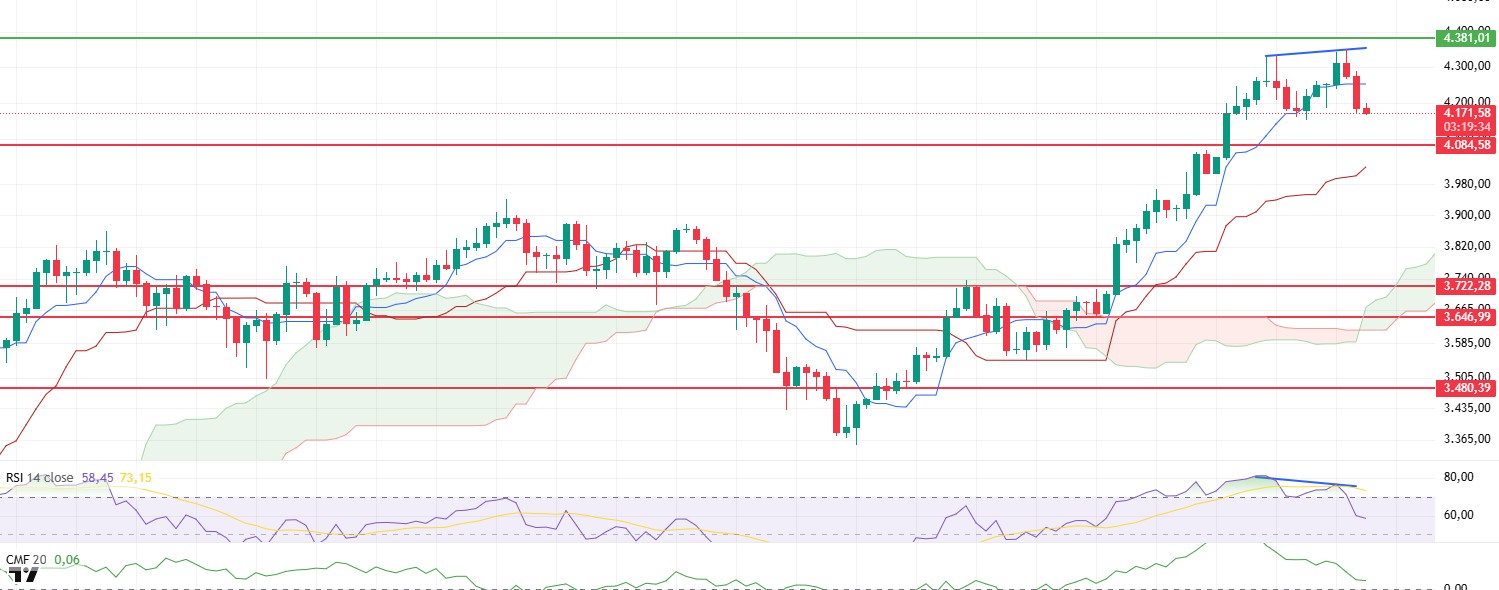
Ethereum experienced a pullback during the day in line with expectations due to selling pressure, with the price falling below the $4,200 level. This weakening, which began due to the impact of negative signals that have been observed for some time in the intraday technical outlook, is strengthening the possibility of a short-term correction that could continue into the evening hours.
In particular, the Relative Strength Index (RSI) had produced a negative divergence signal with the price after rising into the overbought zone in the recent past. This signal indicated a weakening of upward momentum, and the subsequent decline of the RSI below the 60 level clearly confirmed the short-term loss of momentum. The momentum indicator’s simultaneous downward trend suggests that this weakening is not random and that the market remains open to further downward price movements.
A similar picture is emerging on the liquidity side. The Chaikin Money Flow (CMF) is moving downward in parallel with price movements, indicating that profit-taking and net capital outflows are continuing in the market. This trend in the CMF suggests that buying appetite has clearly diminished and that organic demand is weakening in upward price movements. This situation reduces the likelihood of short-term recovery attempts becoming sustainable unless they are supported by strong volume and liquidity.
In the Ichimoku indicator, the price breaking below the Tenkan line is another technical factor that increases the risk of a decline. The Tenkan line is an important reference point that typically reflects the health of the short-term trend and the strength of market momentum. A break below this level indicates that the market has temporarily shifted into seller control and that the trend may weaken in the short term.
If the price fails to rise above the short-term resistance level of $4,250 in the evening and close above this level, downward pressure is likely to continue. In this scenario, the 4,084 dollar level will be monitored as the first strong support level, and a sustained move below this level could lead to accelerated selling and trigger deeper pullbacks. On the other hand, if the price breaks above the 4,381 dollar level and sustains itself above it, this could invalidate the current negative technical outlook and reignite buying momentum. In such a scenario, the market could enter a recovery process aimed at testing upward targets once again.
Support levels: 4,084 – 3,722 – 3,646
Resistance levels: 4,381 – 4,550 – 4,857
XRP/USDT
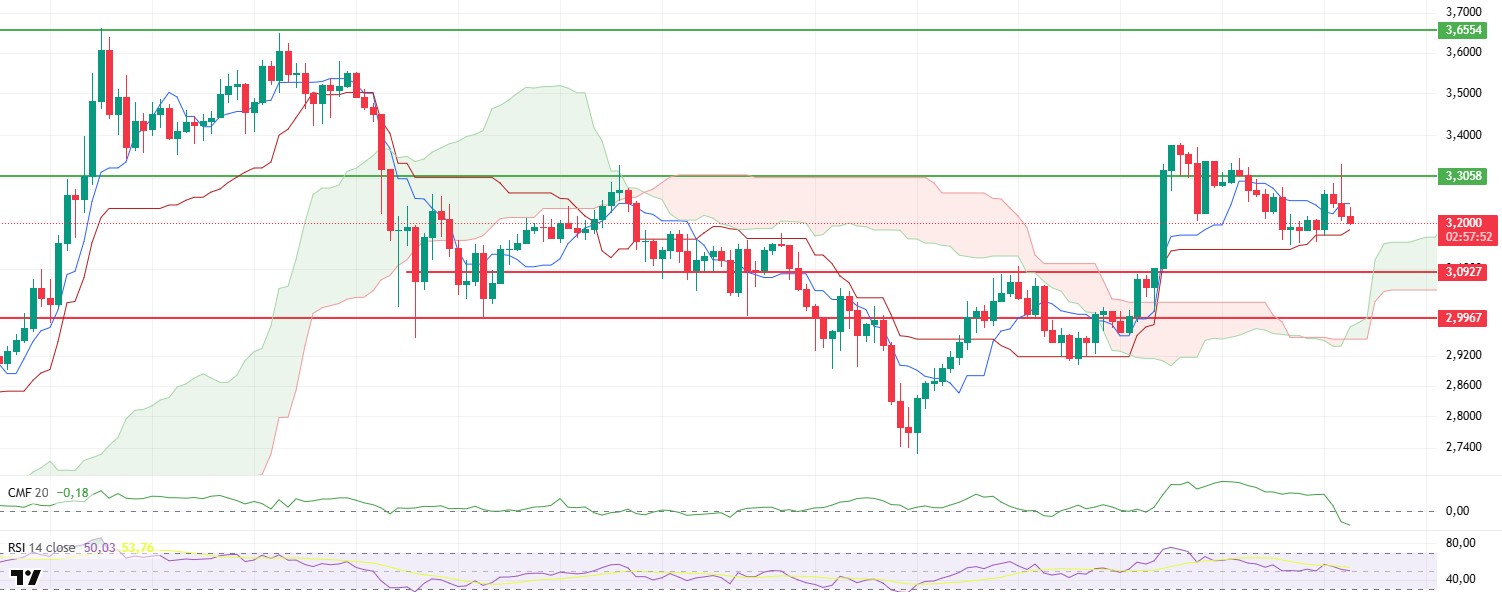
The XRP price rose briefly above the $3.3058 level during the day, forming a pin bar in this region before encountering heavy selling and forming a negative candlestick pattern. This movement, combined with technical indicators that were already weakening during the day, points to a possible continuation of the pullback in the evening hours. The Relative Strength Index (RSI) rapidly declined after losing the moving average line it was based on, approaching the 50 level. This indicates that market momentum has significantly weakened and that selling pressure remains strong. The momentum indicator’s concurrent downward trend further confirms this picture and increases the likelihood of short-term downward movements continuing.
When the price drops below the tenkan level in the Ichimoku indicator, it’s a clear sign that the short-term trend is weakening, while the Chaikin Money Flow (CMF) indicator moving sharply into negative territory shows that liquidity is flowing out of the market. This increase in liquidity loss suggests that buyers are losing strength and that upward price reactions may be limited. The CMF’s drop to such low levels underscores the possibility that recovery attempts following sudden sell-offs may be weak.
Considering the current technical structure, if the price loses the kijun support at the $3.18 level in the evening, a pullback to the $3.09 level seems likely. If this support level is broken, selling will accelerate and lower levels will be tested. On the other hand, if the price manages to rise above the 3.30 dollar level and close above this area on a daily basis, this could invalidate the negative scenario and pave the way for an upward movement to regain momentum.
Supports: 3.0927 – 2.9967 – 2.7355
Resistance levels: 3.3058 – 3.6554 – 4.0055
SOL/USDT
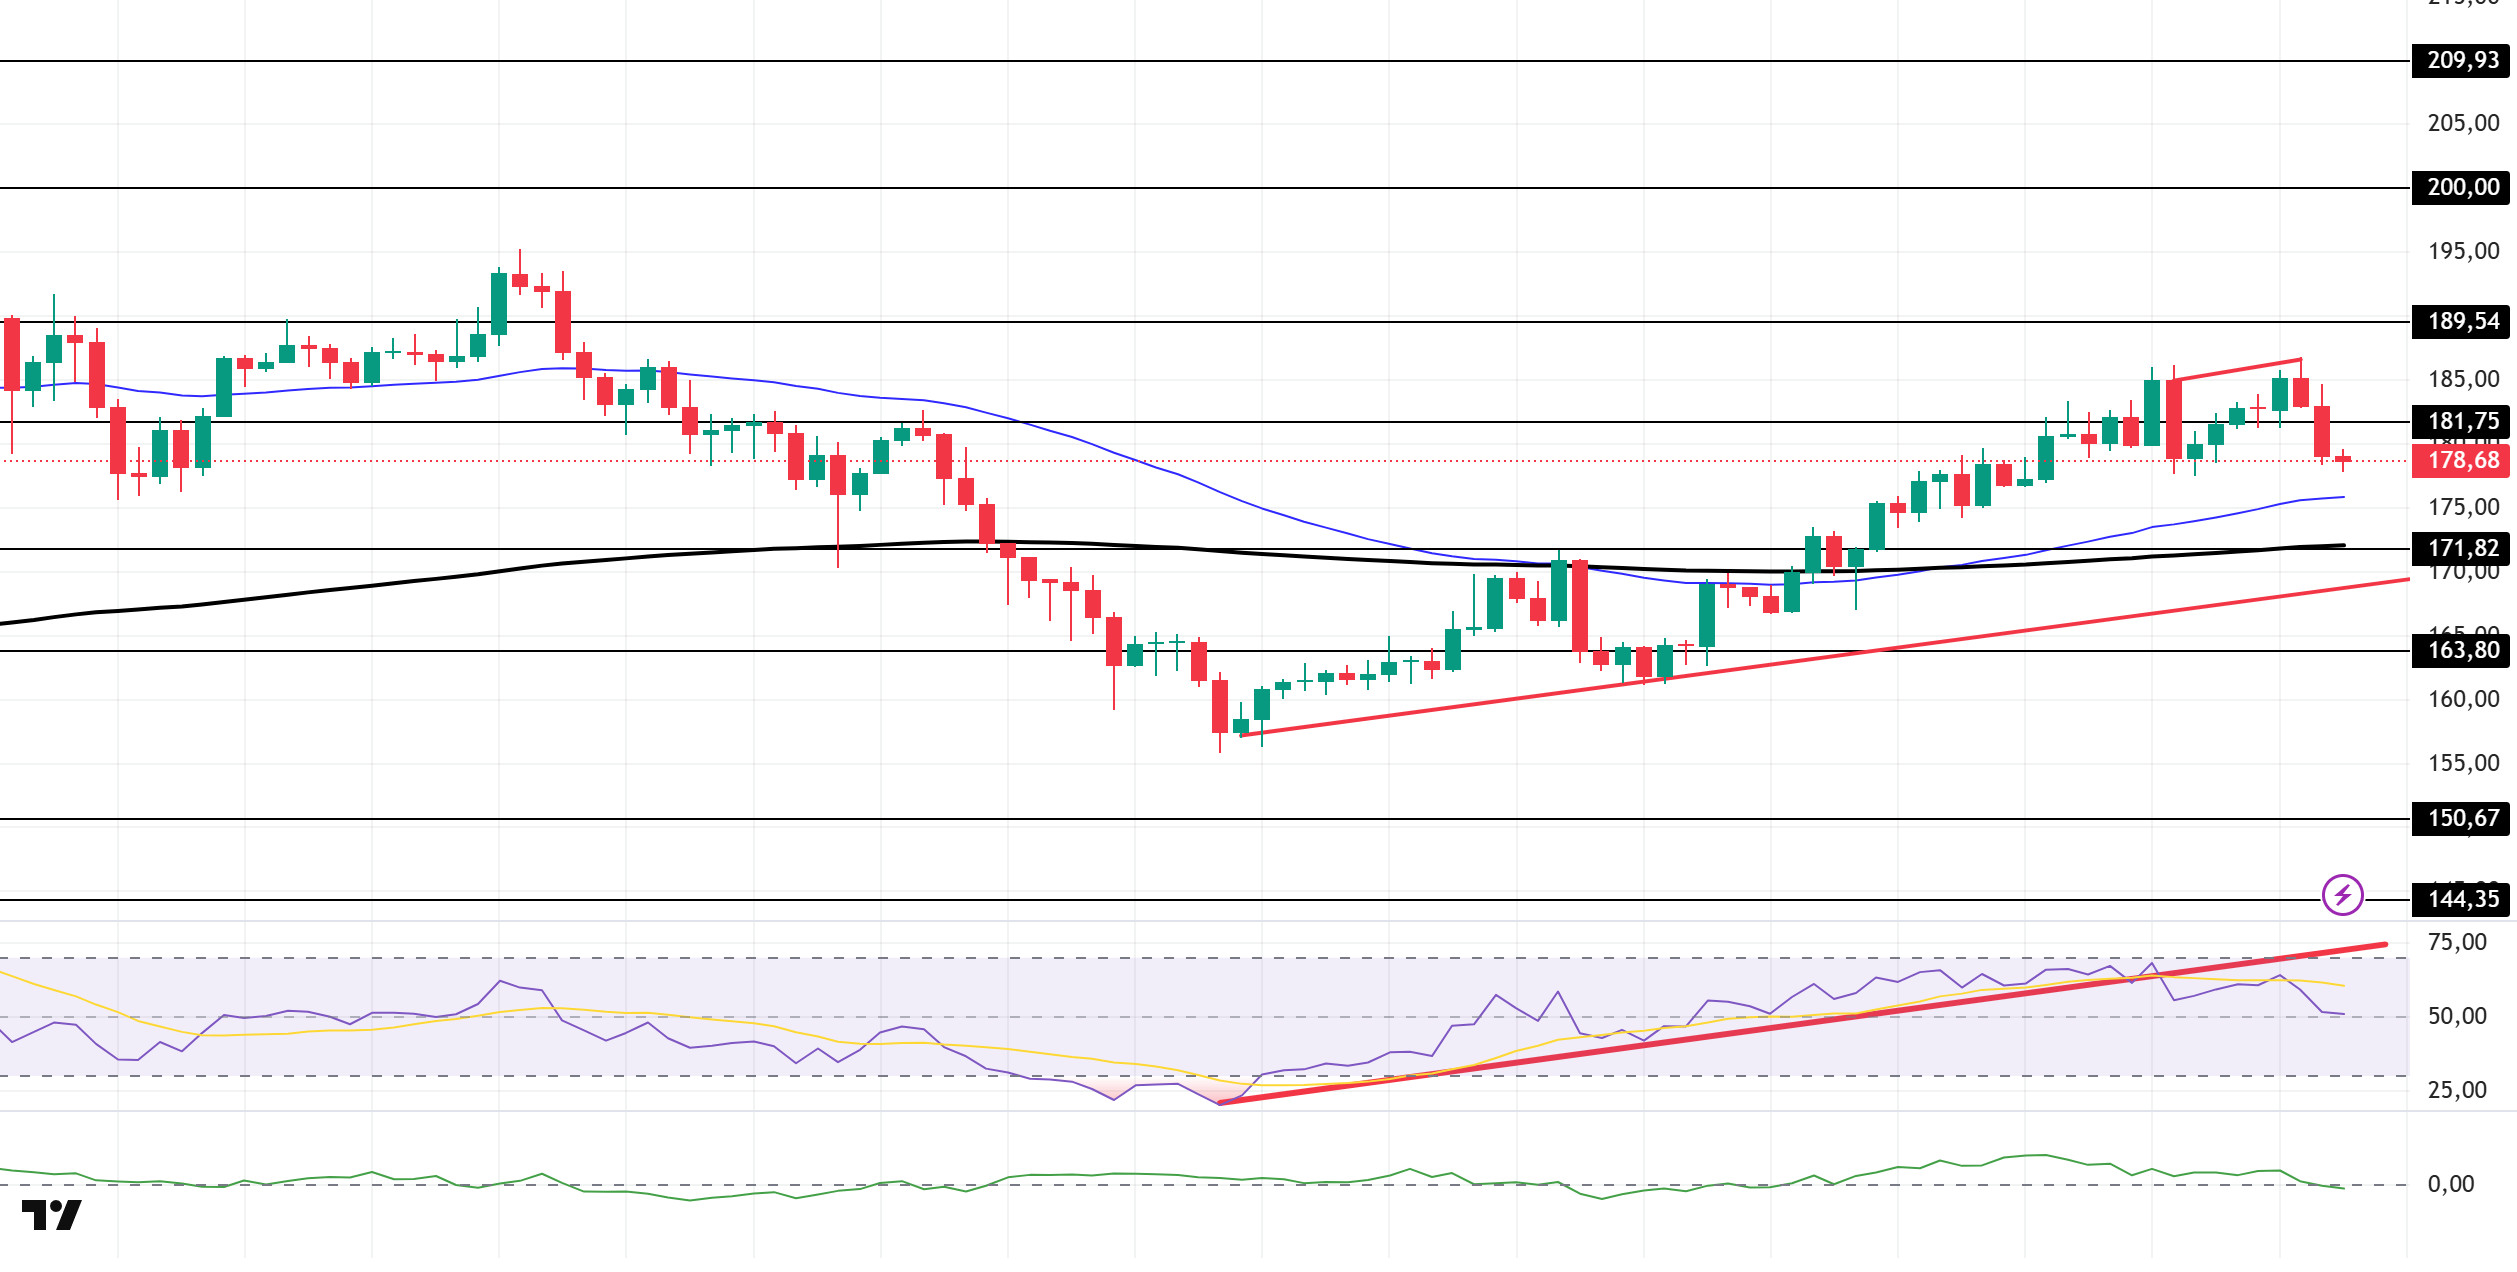
SOL experienced a pullback during the day. The asset remained above the upward trend line that began on Agosto 2. The price broke below the major level of $181.75, lost momentum, and continued its decline. If the declines continue, it may test the $171.82 level. On the upside, the 181.75 dollar level and the 50 EMA (Blue Line) could act as support.
On the 4-hour chart, the 50 EMA (Blue Line) remained above the 200 EMA (Black Line). This indicates that the upward trend may continue in the medium term. Additionally, the price being above both moving averages shows that the market is currently maintaining its upward momentum. The Chaikin Money Flow (CMF-20) is at a neutral level. However, a decrease in money inflows could push the CMF into negative territory. The Relative Strength Index (RSI-14) has crossed below the upward trend that began on Agosto 2. This indicates that selling pressure may begin. Additionally, there is a negative divergence, which could cause the price to decline. In the event of an uptrend driven by positive macroeconomic data or news related to the Solana ecosystem, the $181.75 level emerges as a strong resistance point. If this level is broken to the upside, the uptrend is expected to continue. In the event of a pullback due to adverse developments or profit-taking, the 171.82 dollar level could be tested. A decline to these support levels could see an increase in buying momentum, potentially presenting an opportunity for an upward move.
Niveles de soporte: 171,82 - 163,80 - 150,67
Niveles de resistencia: 181,75 - 189,54 - 200,00
DOGE/USDT
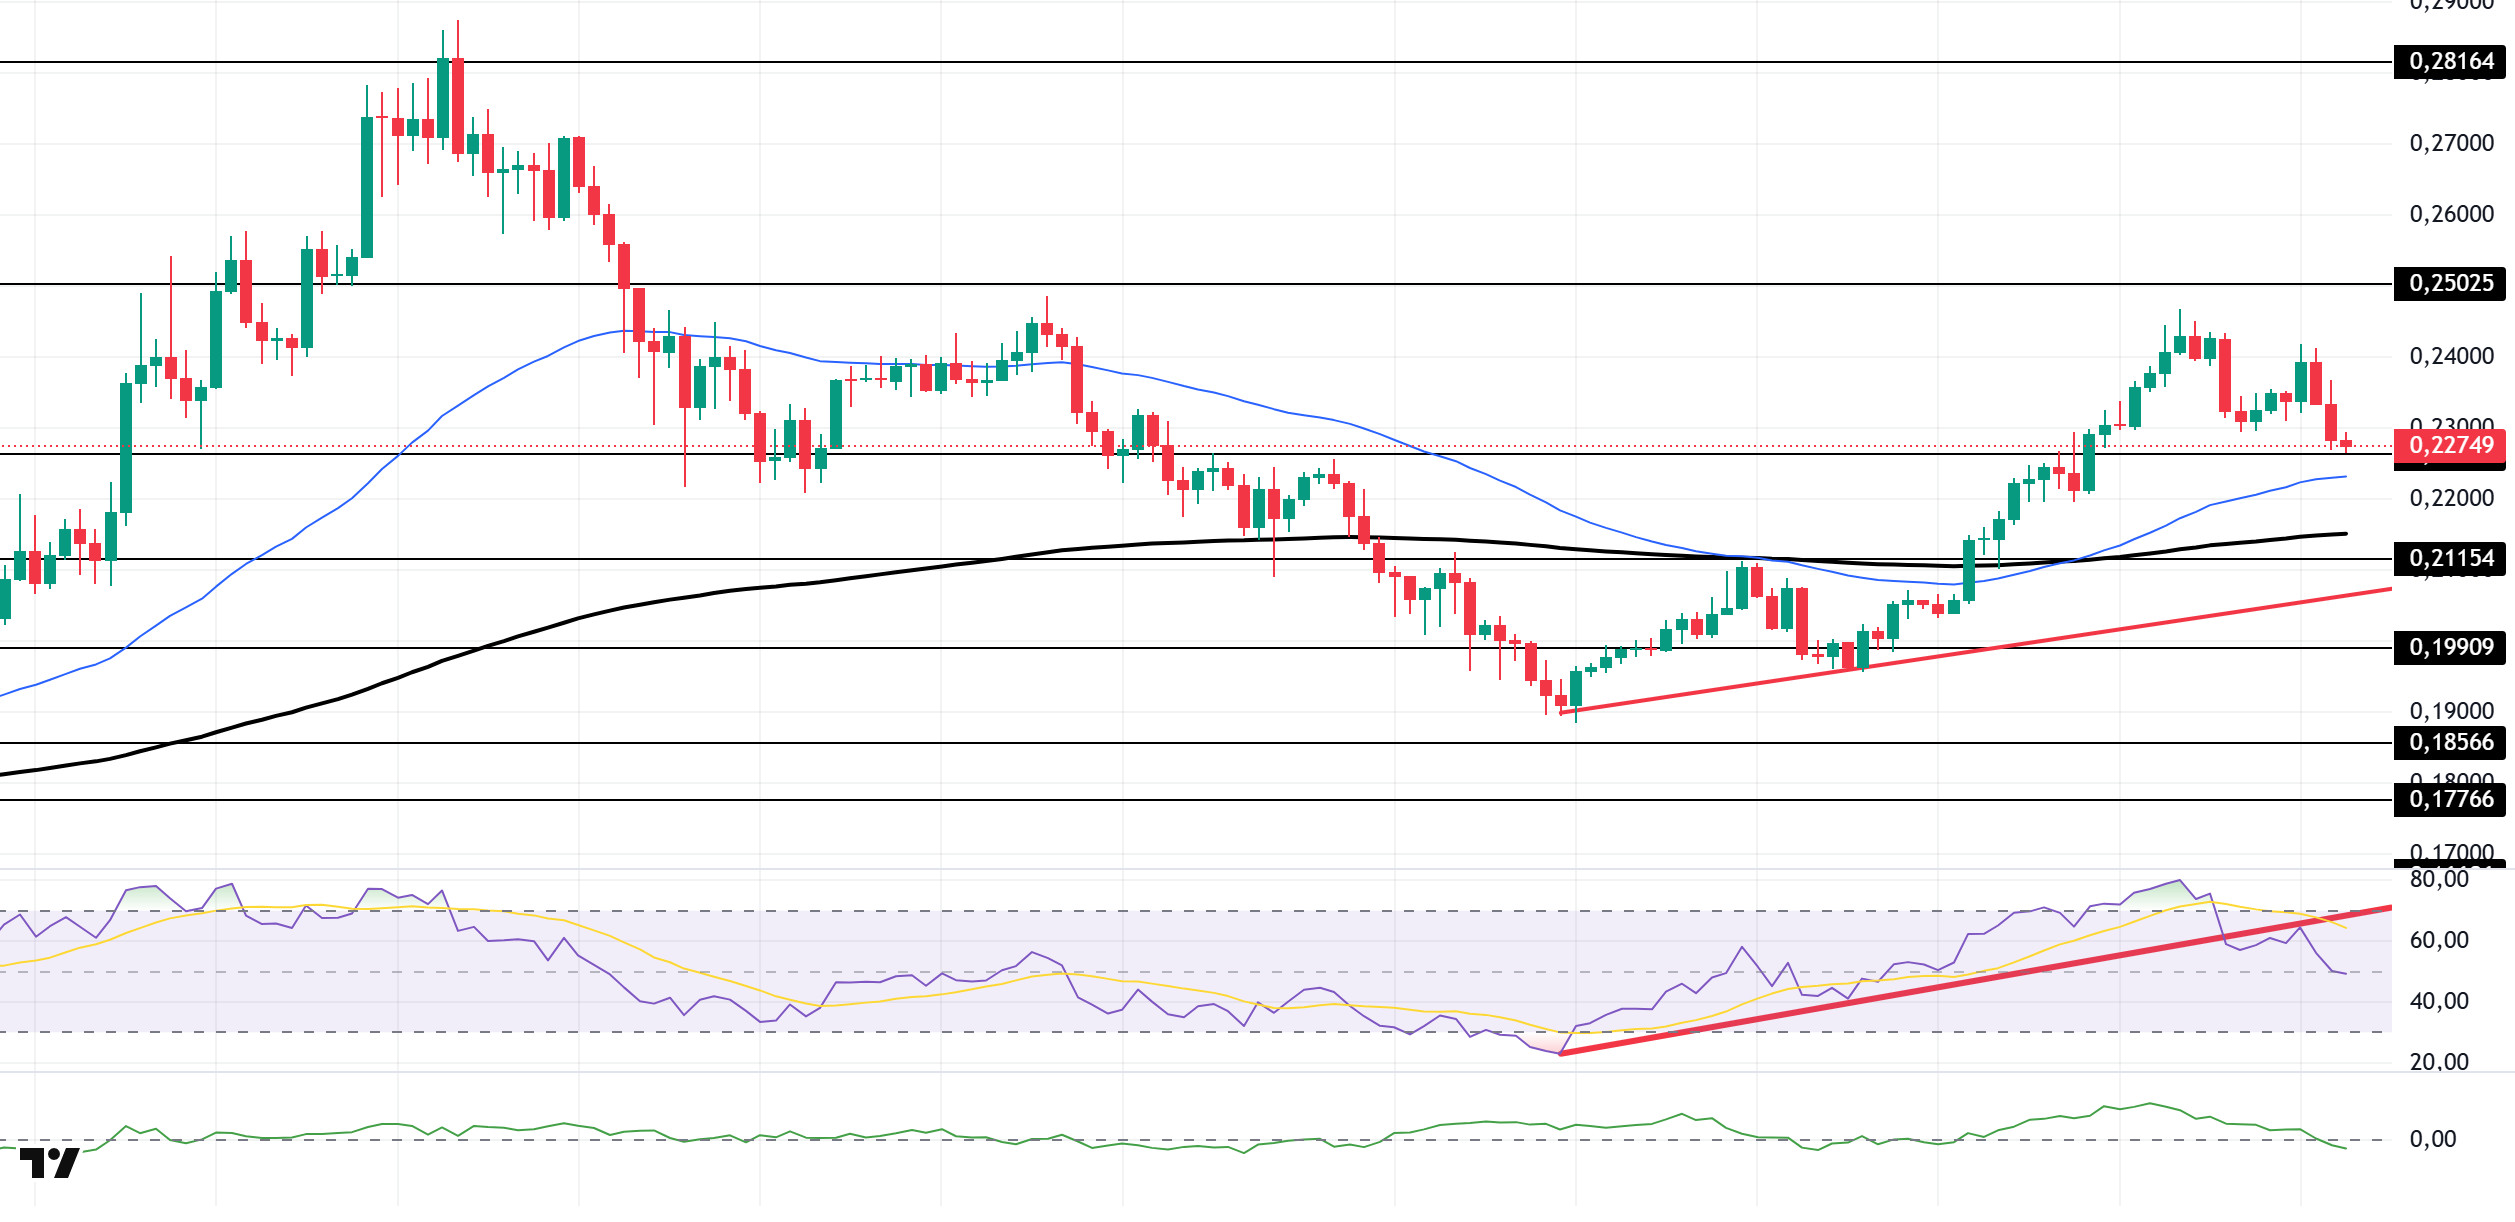
The DOGE price experienced a decline during the day. The asset remained above the upward trend that began on Agosto 2 and continued its upward movement by breaking through the strong resistance level of $0.22632. As of now, the price is testing this level as support. Additionally, the price remains above the 50 EMA (Blue Line) and 200 EMA (Black Line) moving averages. If the downtrend continues, the price may test the 50 EMA moving average as support.
On the 4-hour chart, the 50 EMA (Blue Line) remains above the 200 EMA (Black Line). This indicates that the asset is in an upward trend in the medium term. The price being above both moving averages also indicates that the asset is in an upward trend in the short term. The Chaikin Money Flow (CMF-20) has moved into the negative zone. Additionally, negative cash inflows could push the CMF further into the negative zone. The Relative Strength Index (RSI-14) is at a neutral level. At the same time, the indicator, which has begun to fall below the upward trend that started on Agosto 2, signals that selling pressure may continue. In the event of upward movements driven by political developments, macroeconomic data, or positive news flow within the DOGE ecosystem, the $0.25025 level emerges as a strong resistance zone. In the opposite scenario or in the event of negative news flow, the 0.21154 dollar level could be triggered. A decline to these levels could lead to increased momentum, potentially initiating a new upward wave.
Support levels: 0.22632 – 0.21154 – 0.19909
Resistance levels: 0.25025 – 0.28164 – 0.30545
SHIB/USDT
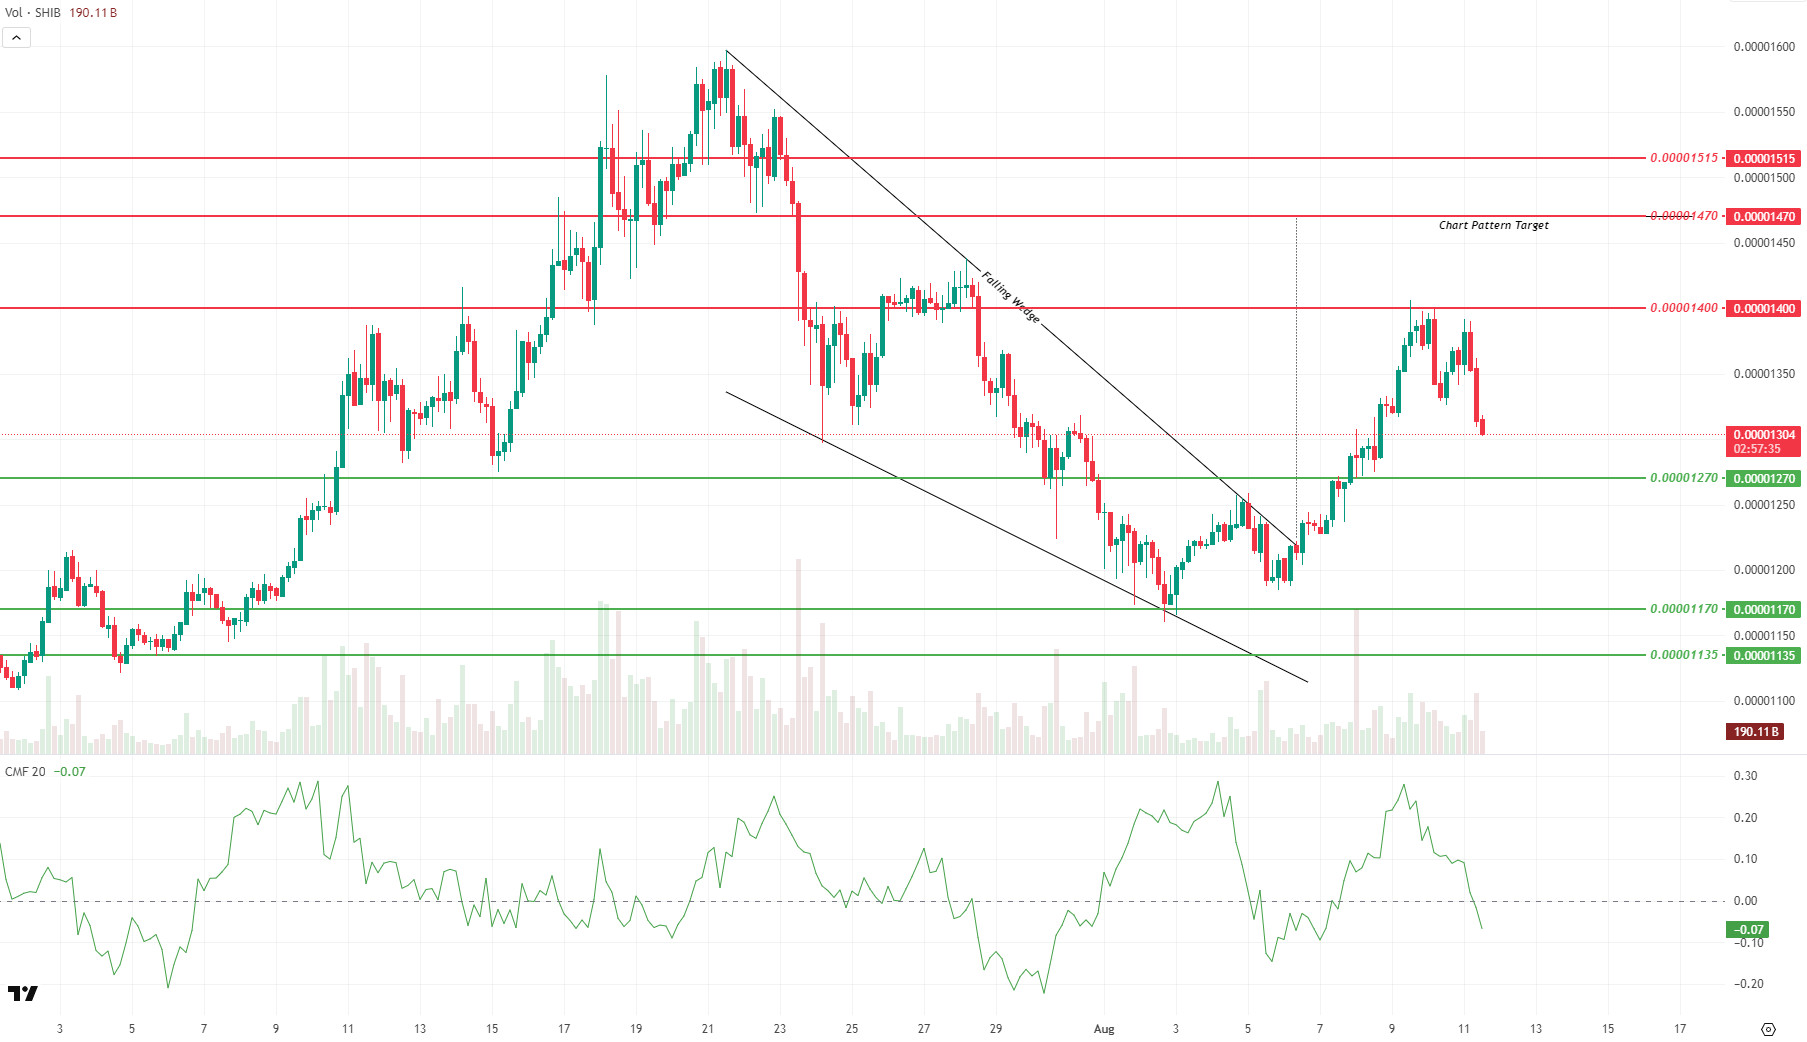
During the day, Shiba Inu (SHIB) price movement saw selling pressure from the 0.00001390 dollar level in the morning, gradually pushing the price down. In the afternoon, as selling intensified, the $0.00001330 support level was tested. Although buyers stepped in at this level, stabilizing the price for a while, the upward reaction remained limited due to weak volume and a decline in momentum. The narrowing volatility confirms that the market is cautious and in a wait-and-see mode in the short term. While there were no developments that could directly affect the price throughout the day, investors appear to be focusing on technical levels.
On the technical chart, the upward movement that began after the breakout of the Falling Wedge formation formed on Julio 21, stalled at the $0.00001400 resistance level and gave way to a correction process. The loss of the 0.00001330 dollar support level increases downside risks, with the 0.00001270 and 0.00001170 dollar levels emerging as new critical support zones. For an upward recovery, the price must reclaim the 0.00001330 level and then break above the 0.00001390–0.00001400 range. The Chaikin Money Flow (CMF) indicator moving into the negative zone confirms that capital flows are intensifying in the selling direction in the short term.
In the short-term technical picture, a meaningful increase in trading volume is required for the price to rebound from support levels and move toward resistance zones. Otherwise, the current weak volume conditions could delay the process of reaching the formation target of 0.00001470 dollars. During this period when the market is in a direction-finding phase, it is important for investors to closely monitor both price reactions at support levels and volume movements.
Support levels: 0.00001270 – 0.00001170 – 0.00001135
Resistance levels: 0.00001400 – 0.00001470 – 0.00001515
ADA/USDT
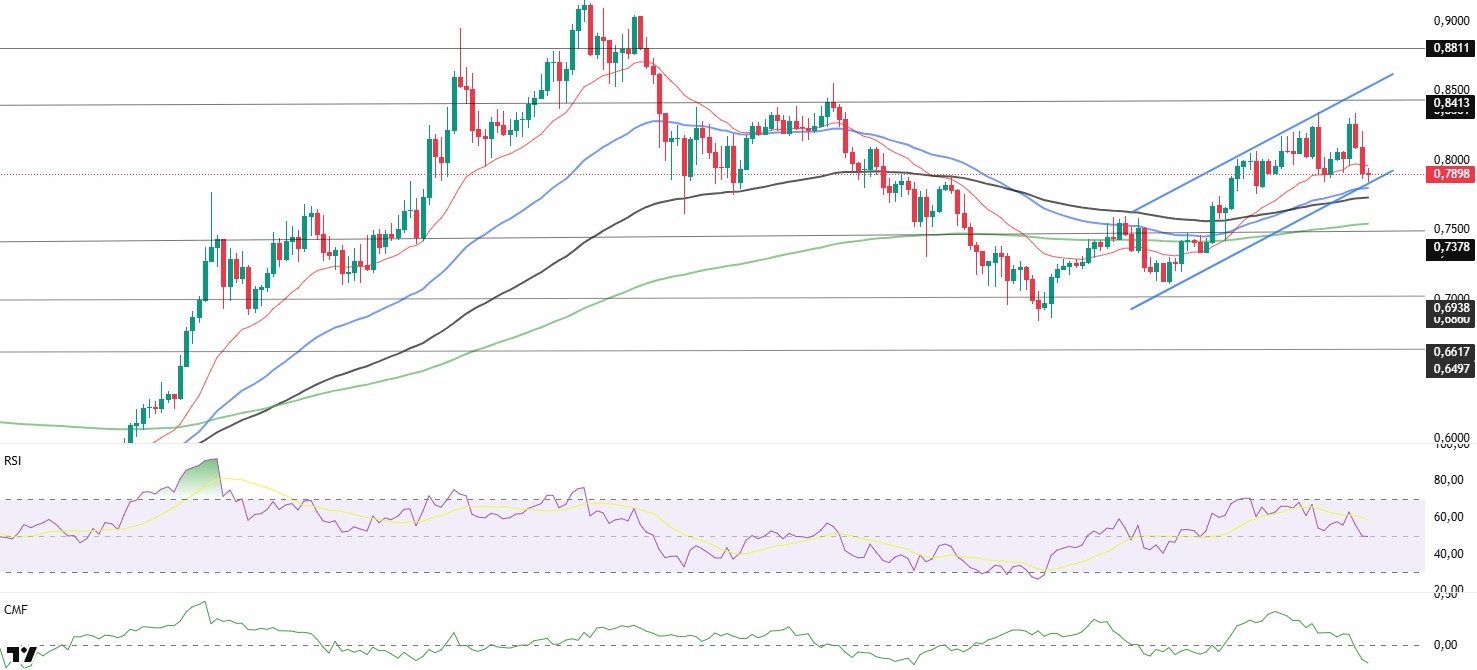
ADA price fell during the day, dropping below the 20 EMA (Red Line). On the 4-hour chart, ADA continues to move within an upward channel, remaining above the 50 EMA (Blue Line) and 100 EMA (Black Line). If the price closes below the 50 EMA (Blue Line) at the end of the day, it could break out of the rising channel that has been in place since Agosto 5. This could signal the end of the upward trend and a potential decline to the support level at 0.7378. If the price continues within the rising channel band, the 0.8414 levels could be tested as the first resistance level, which could indicate that the upward trend may continue in the medium term. Although the Relative Strength Index (RSI-14) has retreated to the 50 level and continues to show positive correlation with the price, the Chaikin Money Flow (CMF-20) is showing divergence and remains at a negative level of -0.17. The decrease in capital inflows could keep the CMF in the negative zone and continue to exert selling pressure.
In the event of an uptrend driven by macroeconomic data or positive news related to the Cardano ecosystem, the $0.8811 level emerges as a strong resistance point. If this level is broken upward, the uptrend is expected to continue. In the event of developments in the opposite direction or profit-taking, pullbacks may occur, testing the 0.7378 dollar level. A decline to these support levels could indicate an increase in selling momentum, signaling a potential downward trend.
Support levels: 0.7378 – 0.6938 – 0.6617
Resistance levels: 0.8413 – 0.8811 – 0.9038
Aviso legal
La información sobre inversiones, los comentarios y las recomendaciones aquí contenidos no constituyen asesoramiento en materia de inversiones. Los servicios de asesoramiento en materia de inversión son prestados individualmente por instituciones autorizadas teniendo en cuenta las preferencias de riesgo y rentabilidad de los particulares. Los comentarios y recomendaciones aquí contenidos son de carácter general. Estas recomendaciones pueden no ser adecuadas para su situación financiera y sus preferencias de riesgo y rentabilidad. Por lo tanto, tomar una decisión de inversión basándose únicamente en la información aquí contenida puede no producir resultados acordes con sus expectativas.

