
Technical Analysis
BTC/USDT
In the US, July non-farm payrolls came in at 73K, below expectations, while the unemployment rate rose to 4.2%. The previous month’s employment data was revised down from 147,000 to 14,000. President Trump criticized Fed Chair Powell for not cutting interest rates and said the Board should step in. Fed Member Michelle Bowman said that gradual interest rate cuts would be appropriate amid slowing economic growth. Virtu Financial increased its total Bitcoin holdings to 410 by purchasing 175 BTC in the second quarter. Japan-based Metaplanet applied for a preferred stock issuance worth 555 billion yen. According to Glassnode data, over 90% of Bitcoin’s supply is in profit.
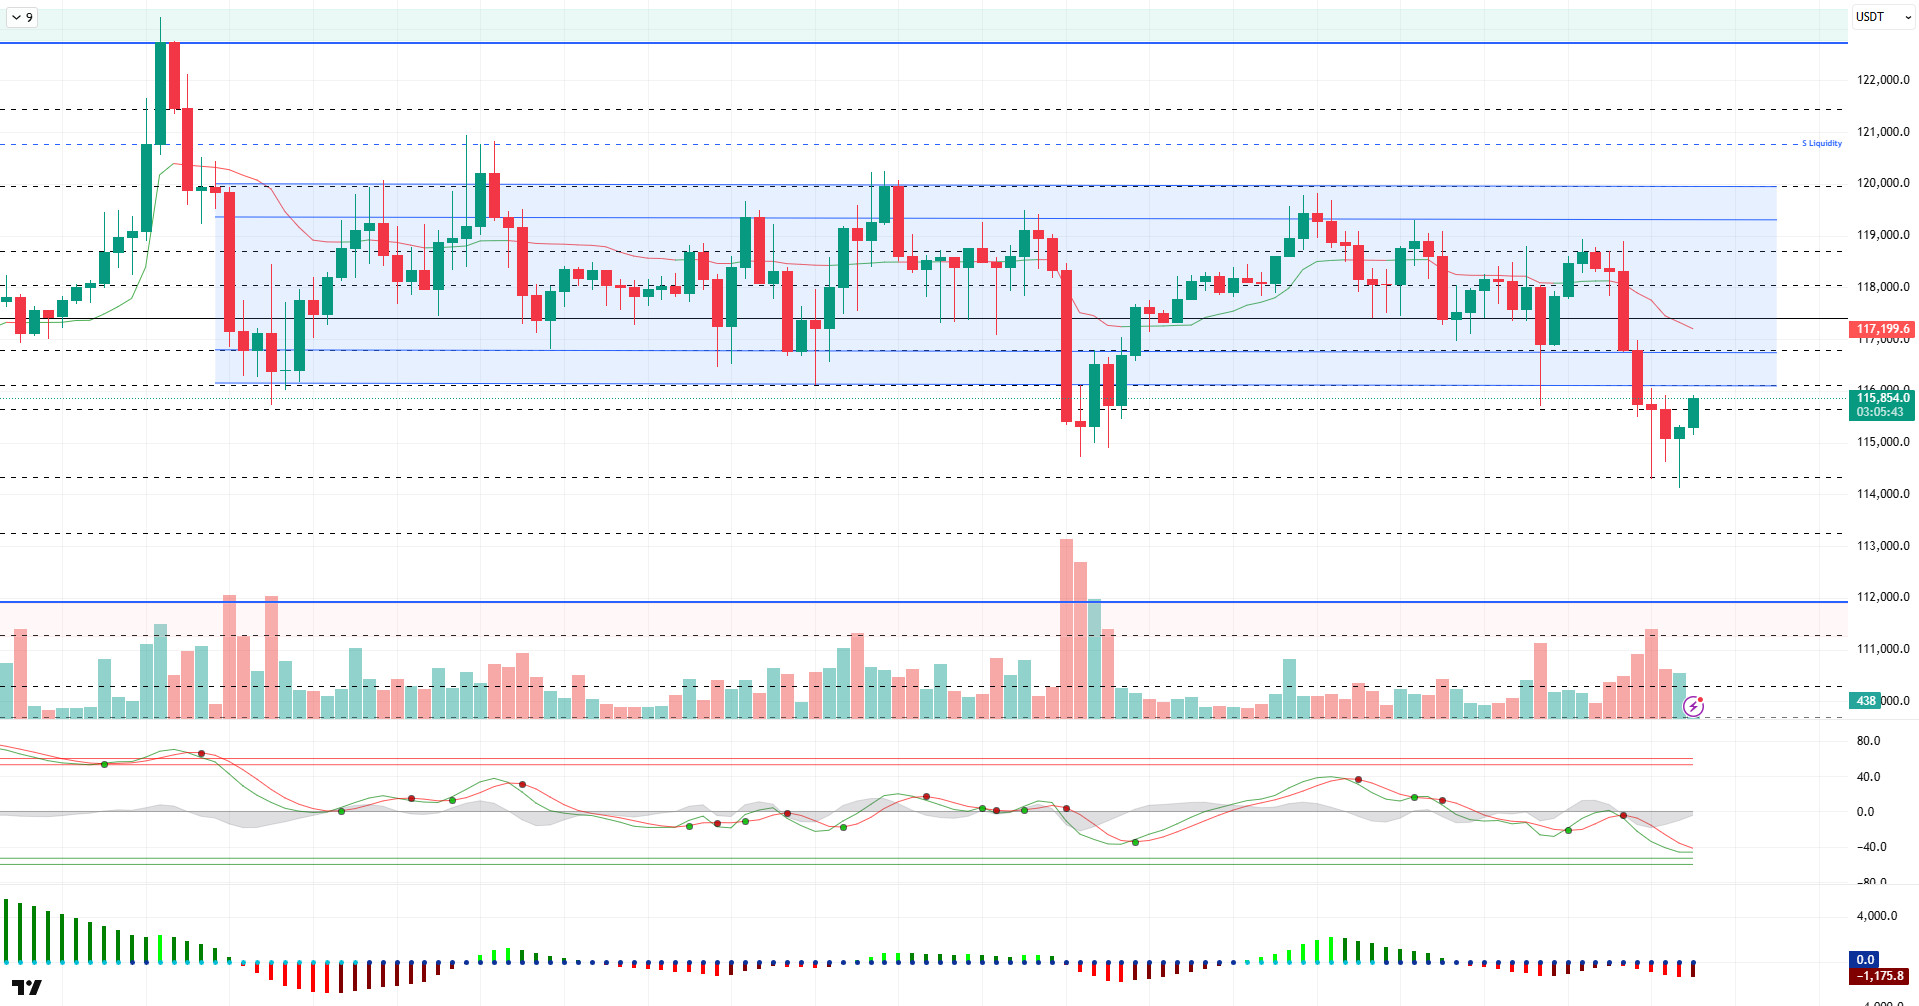
Looking at the technical picture, BTC broke below the horizontal band range after a consolidation phase and fell to 114,100. BTC, which was trading around 115,000 in the previous analysis, gained momentum following the above developments and continues to test the 116,000 level as of the time of writing.
On the technical indicators front, the Wave Trend (WT) oscillator, after showing indecision in the middle band of the channel for a long time, is moving towards the oversold zone while giving the impression of turning upward once again. The Squeeze Momentum (SM) indicator has started to gain momentum in the negative zone. The Kaufman moving average has retreated to the 117,100 level.
Looking at liquidity data, the region where limited accumulation was recorded in the 115,000–114,000 band has been liquidated, while sell positions continue to accumulate above the 120,000 level.
In summary, while fundamental developments emerged as factors creating selling pressure in terms of pricing, expectations for interest rate cuts rose again following the release of data. In this context, technical and liquidity data, combined with fundamental developments, may indicate that the price could return to a consolidation phase within a horizontal band after forming a double bottom at this level. In this context, the 116,000 level is being monitored as a minor resistance point, and if it is broken, the 117,500 level could once again act as a major resistance. In the event of potential selling pressure, the 115,000 level will continue to be monitored as a reference point.
Support levels: 115,000 – 114,300 – 113,200
Resistance levels: 116,000 – 116,800 – 117,500
ETH/USDT
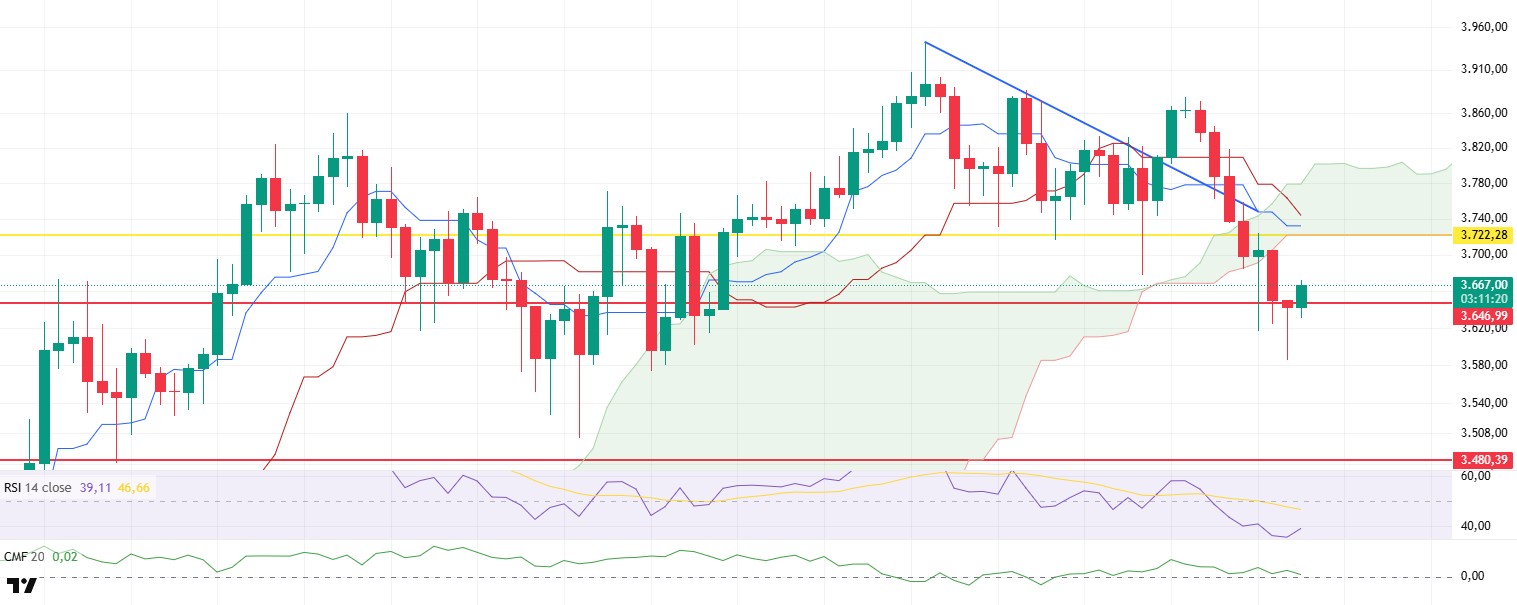
The ETH price fell below the intermediate support level of $3,646 during the day, retreating to $3,595. This decline confirmed that technical weaknesses are still in effect. However, the release of U.S. non-farm payroll data that fell short of expectations sparked a renewed appetite for risk in the markets. Following this development, ETH recovered its intraday losses and once again surpassed the $3,646 level.
Although prices are attempting to recover in the short term, technical indicators are insufficient to confirm this rise. When examining the Ichimoku indicator, the price remains below the Kumo cloud and also below the Tenkan and Kijun levels, indicating that downward pressure persists in the overall outlook. The failure to break above the lower band of the cloud at the 3,722 dollar level suggests that this pressure is structural and that the current rise does not yet signal a trend reversal.
Weakness also continues on the liquidity side. The Chaikin Money Flow (CMF) indicator did not show a significant positive reaction during the price recovery period and declined towards the zero line, indicating continued liquidity outflows. This suggests that there has been no strong capital inflow accompanying the rise and that there is still insufficient appetite on the buyer side.
When the overall picture is assessed, it is seen that despite ETH’s short-term recovery, structural pressures continue. A sustained close above the $3,722 level could only confirm a trend reversal in technical terms. Until this happens, it seems more likely that upward attempts will remain limited and downward volatility will continue.
Support levels: 3,722 – 3,646 – 3,480
Resistance levels: 4,084 – 4,381 – 4,857
XRP/USDT
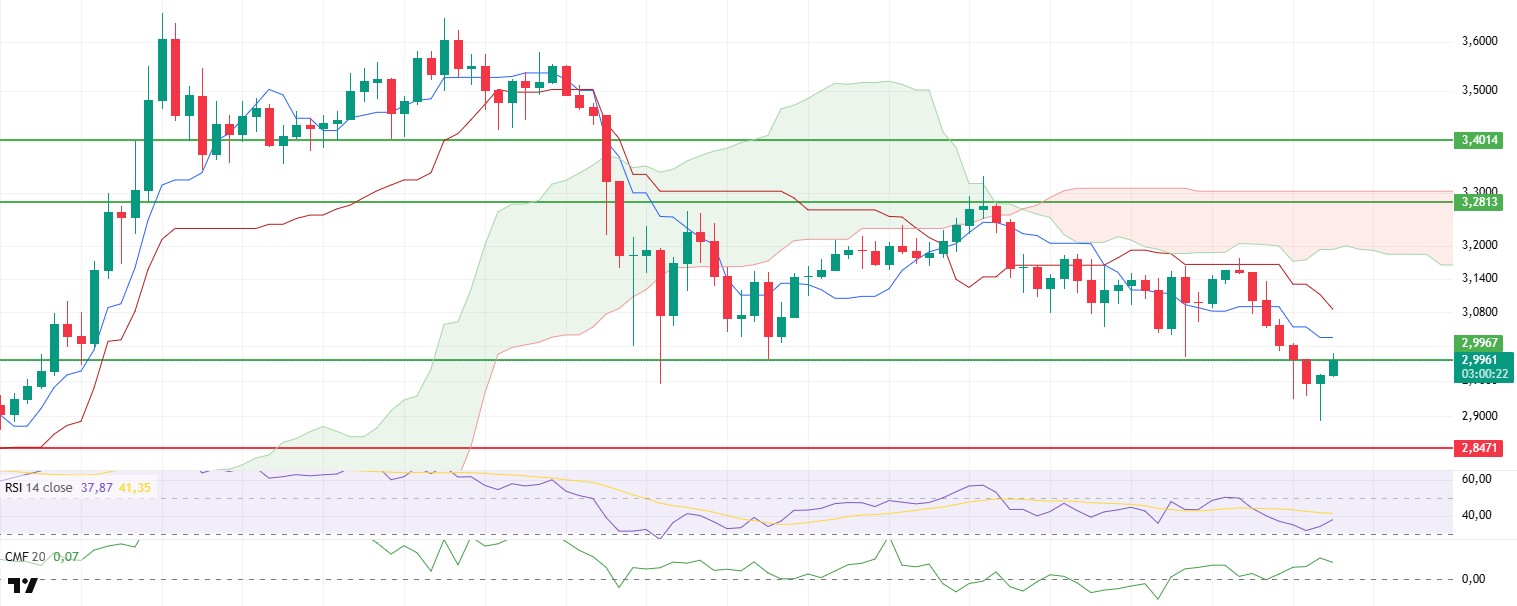
XRP experienced a sharp decline after losing its short-term support level at $2.99, with sales accelerating, falling to $2.89. This pullback indicates ongoing technical weakness and market sensitivity, while the release of U.S. Non-Farm Payroll data, which came in below market expectations, reignited risk appetite in risky assets. The positive sentiment created by the macroeconomic data supported XRP’s intraday recovery, with the price rising back to the $2.99 level.
Technical indicators continue to show that the negative structure remains intact despite the current price recovery. When examining the Ichimoku indicator, it can be seen that XRP remains below both the tenkan and kijun levels and is also priced below the kumo cloud. This situation indicates that pressure continues in the short and medium term and confirms that the overall technical outlook has not yet improved.
In contrast, the Chaikin Money Flow (CMF) indicator remains in positive territory. The fact that the CMF has stayed in this region even during a price decline indicates that there is no significant liquidity outflow from the market and that a certain degree of balance has been established on the capital side. This suggests that buyers have not completely exited the market despite the sharp price decline and that the price is in a state of seeking equilibrium.
On the other hand, the Relative Strength Index (RSI) indicator shows a slight recovery from the oversold zone, indicating a limited upward trend in momentum. This fragile recovery in the RSI signals that the price is attempting to form a base by creating higher lows in the short term.
In conclusion, the XRP price remaining above the $2.99 level throughout the day is critical for the continuation of upward movements. Daily closes above this region could technically pave the way for a recovery to gain momentum and for the price to gradually move towards the $3.10 level. However, a rejection from the 2.99 dollar level could reactivate the current weak structure, potentially pushing the price back toward the 2.89 dollar support level.
Supports: 2.8471 – 2.6513 – 2.4777
Resistances: 2.9967 – 3.2813 – 3.4014
SOL/USDT
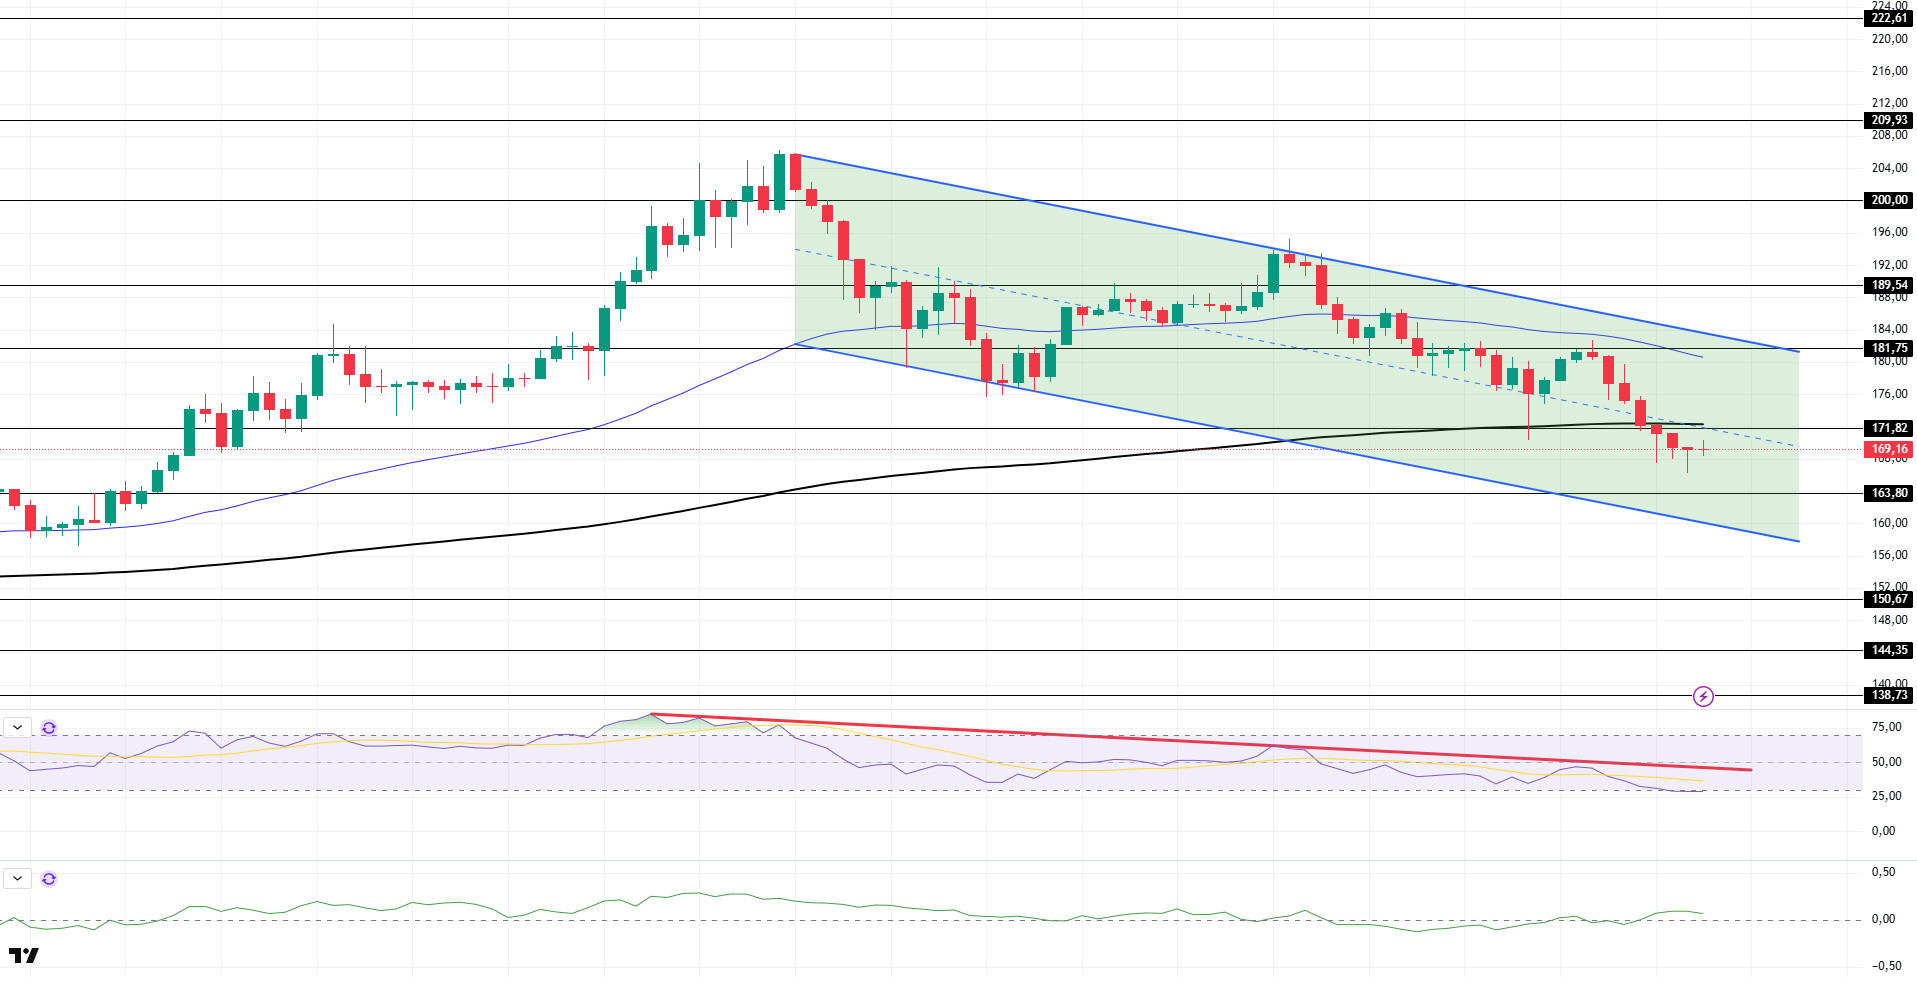
The SOL price remained flat during the day. The asset continued to remain within the downward trend that began on July 23. The price, which remains below the 200 EMA (Black Line) moving average, may test the $163.80 level as resistance if the pullback continues. If an uptrend begins, the 181.75 dollar level could be monitored.
On the 4-hour chart, the 50 EMA (Blue Line) remains above the 200 EMA (Black Line). This indicates that the upward trend may continue in the medium term. At the same time, the price being below both moving averages shows that the market is currently in a downward trend. Chaikin Money Flow (CMF-20) has started to move into positive territory. However, a decrease in money inflows could push the CMF into negative territory. The Relative Strength Index (RSI-14) has continued to remain below the downward trend that began on July 21 and is now in the oversold zone. This could trigger an upward movement. In the event of an uptrend driven by positive macroeconomic data or news related to the Solana ecosystem, the $181.75 level emerges as a strong resistance point. If this level is broken to the upside, the uptrend is expected to continue. In the event of a pullback due to adverse developments or profit-taking, the 163.80 dollar level could be tested. A decline to these support levels could see an increase in buying momentum, presenting a potential opportunity for an upward move.
Support levels: 163.80 – 150.67 – 144.35
Resistance levels: 171.82 – 181.75 – 189.54
DOGE/USDT
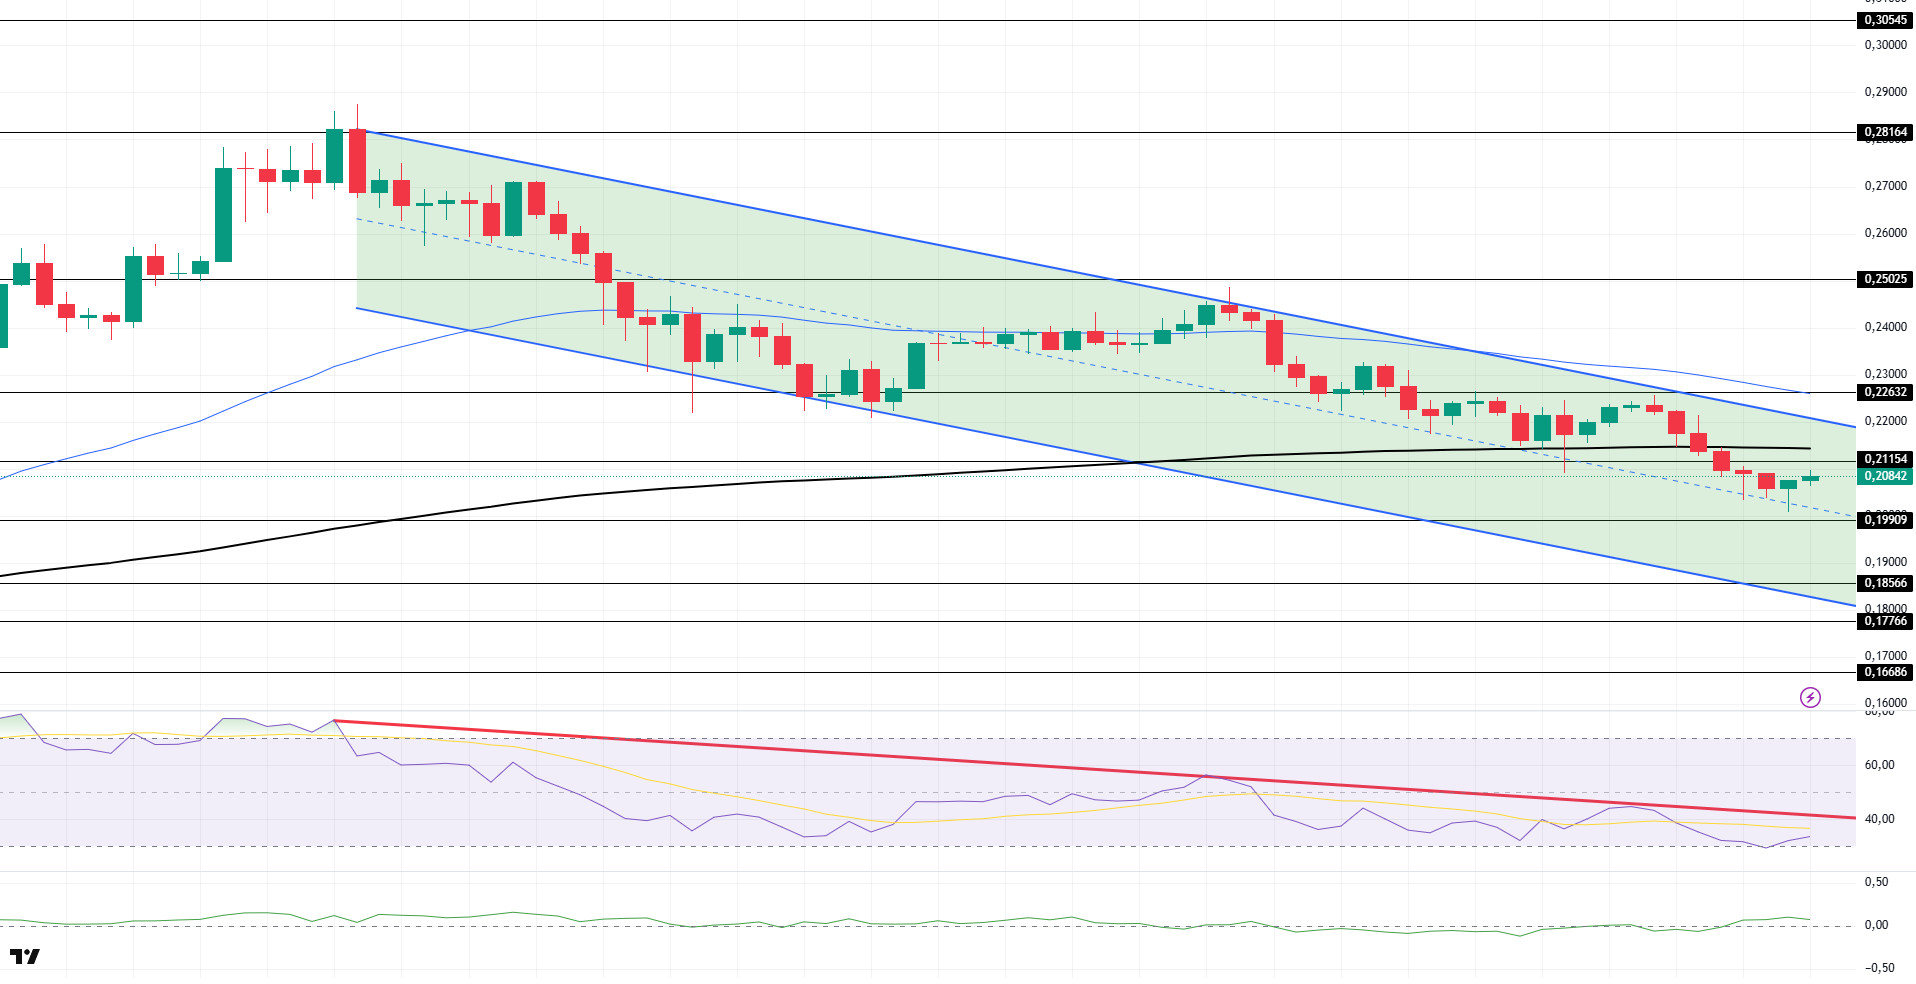
The DOGE price remained flat during the day. The asset continued to lose value after encountering resistance at the top of the downtrend that began on July 21 and at the $0.22632 level. The price remains within the trend and continues to trade below the 200 EMA (Black Line) moving average. In the event of a further decline, the 0.19909 dollar level can be monitored as support. If an upward movement begins, the 0.22632 dollar level should be monitored.
On the 4-hour chart, the 50 EMA (Blue Line) remains above the 200 EMA (Black Line). This indicates that the asset is in an upward trend in the medium term. The price being below both moving averages indicates that the asset is in a downward trend in the short term. The Chaikin Money Flow (CMF-20) has crossed into positive territory. Additionally, positive cash inflows could push the CMF further into the positive zone. The Relative Strength Index (RSI-14) remains in the negative zone. Furthermore, it remains below the downward trend that began on July 21. It is also approaching the oversold zone, which could trigger an upward movement. In the event of an upward movement driven by political developments, macroeconomic data, or positive news flow within the DOGE ecosystem, the $0.22632 level emerges as a strong resistance zone. In the opposite scenario or in the event of negative news flow, the 0.19909 dollar level could be triggered. A decline to these levels could increase momentum and potentially initiate a new upward wave.
Support levels: 0.19909 – 0.18566 – 0.17766
Resistance levels: 0.21154 – 0.22632 – 0.25025
Legal Notice
The investment information, comments, and recommendations contained herein do not constitute investment advice. Investment advisory services are provided individually by authorized institutions taking into account the risk and return preferences of individuals. The comments and recommendations contained herein are of a general nature. These recommendations may not be suitable for your financial situation and risk and return preferences. Therefore, making an investment decision based solely on the information contained herein may not produce results in line with your expectations.