
Análisis técnico
BTC/USDT
Strategy made no stock sales or new Bitcoin purchases last week, while the total value of its existing Bitcoin holdings remained at $31.1 billion. FTX repaid $1.2 billion on Febrero 18. On the other hand, the US and Russia agreed to form a joint task force to end the Ukraine conflict. On the crypto side, El Salvador increased its daily Bitcoin purchases, bringing its total holdings to 93,417 BTC.
When we look at the technical outlook of BTC after the developments of the day, it is seen that a narrowing triangle structure has formed within the rectangle formation. BTC, which tested the 95,000 level once again during the day, turned its direction upwards by finding buyers from this region. It is currently trading at 96,300, close to the upper line of the triangle pattern, but has not yet been able to break this level. When technical oscillators are analyzed, it is observed that it produces a buy signal from the oversold zone on the hourly charts. On the momentum indicators side, the fact that Squeeze Momentum is starting to regain strength and the On-Balance Volume (OBV) indicator is showing an increase in volume may indicate the potential for the price to break out of the neutral zone and re-enter an uptrend. Closes between 97,000 and 98,000 levels will be closely monitored for BTC to enter an uptrend. In a possible pullback scenario, the 95,000 level remains important as a major support point.
Supports 95,000 – 92,800 – 90,400
Resistances 97,000 – 99,100 -101,400
 ETH/USDT
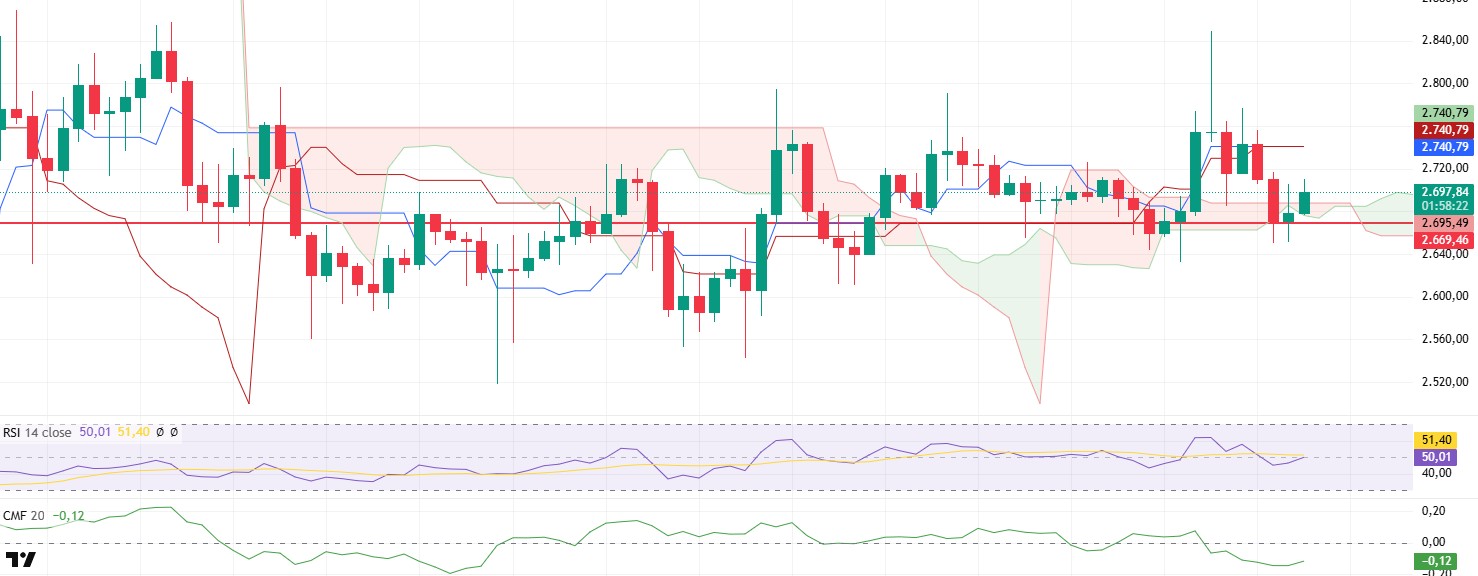
ETH showed a slight recovery during the day, reacting from the intermediate support at the level of $ 2,641 after yesterday’s decline. Technical indicators for ETH, which is currently priced at $ 2.695, started to give positive signals.
First of all, when the Ichimoku indicator is analyzed, the fact that the price rose above the kumo cloud again and the tenkan and kijun levels equalized can be considered as a positive development in terms of the direction of the market. In addition, the fact that the Relative Strength Index (RSI) indicator reacted from the 46 level to form a double bottom indicates that the selling pressure has subsided and buyers have started to gain strength. If the RSI rebounds from this level and continues its upward movement, it may be a critical signal for the continuation of the uptrend. The Chaikin Money Flow (CMF) indicator, on the other hand, rebounded after the recent decline, signaling a renewed increase in market liquidity, indicating that investors’ confidence in market conditions has increased and buying trades are gaining strength.
These improvements in technical indicators and the preservation of the $2,641 intermediate support suggest that the ETH price may continue its upward movement in the short term. Daily closes, especially above the $2,781 level, could trigger sharp upward price movements and target higher resistance levels. However, it should be considered that if the intermediate support level of $ 2,641 is broken, selling pressure may increase and the price may retreat to the main support at $ 2,501.
Supports 2,641 – 2,501 – 2,368
Resistances 2,781 – 2,881 – 2,992
XRP/USDT
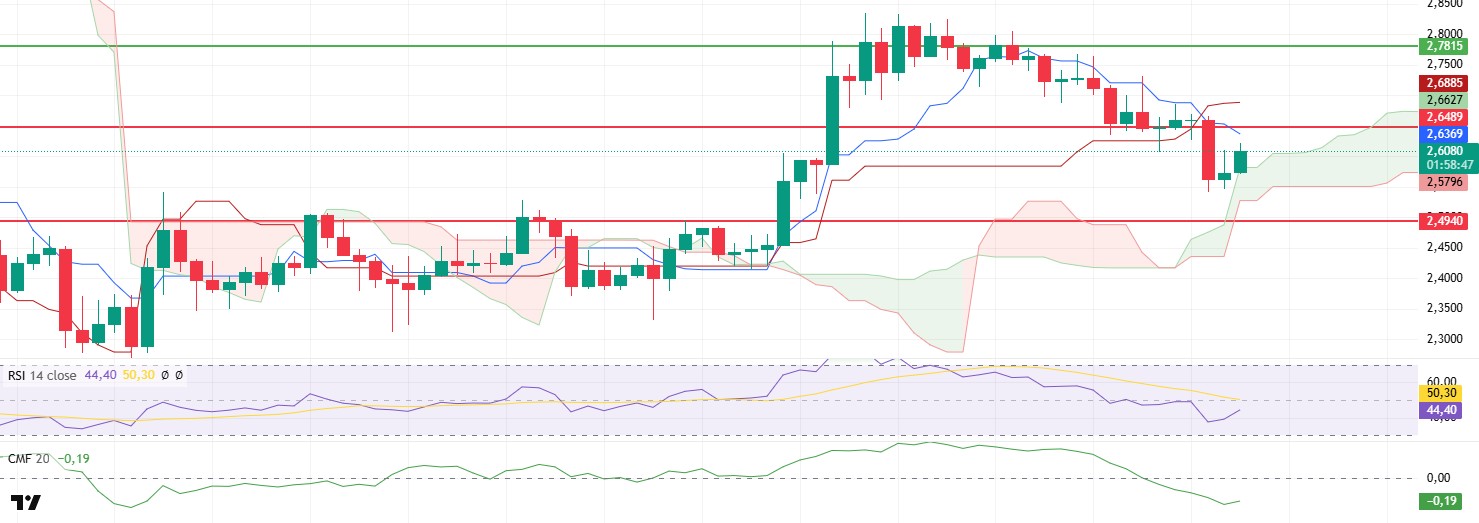
With the slight bullish trend in the overall cryptocurrency market, XRP managed to rise above the $2.60 level again, reacting from the sand cloud support. However, price movements still do not give a clear return signal and continue to be priced in a critical zone.
An important element of the Ichimoku indicator is that the sell signal formed when the tenkan level crosses the kijun level downwards is still valid. In order for this negative signal to be invalidated and the price to enter a stronger uptrend, XRP needs to rise above the $2.65 level. Breaching this level could be a decisive factor for the short-term direction of the market. When momentum and liquidity indicators are analyzed, Chaikin Money Flow (CMF) and Relative Strength Index (RSI) indicators are in a slight upward trend. However, both indicators have not yet reached a fully positive outlook structurally.
In the coming period, exceeding the $2.65 level stands out as a critical resistance point. Closes above this level can ensure the continuation of the uptrend and take the XRP price to higher levels. On the other hand, if the current support zone is lost, there is a strong possibility that the selling pressure will increase with the descent below the kumo cloud and the price will retreat to the main support at $ 2.49. However, it is also possible that buyers will re-engage at this support level and the price will react upwards.
Supports 2.4940 – 2.2502 – 2.0201
Resistances 2.6486 – 2.7815 – 2.9379
SOL/USDT
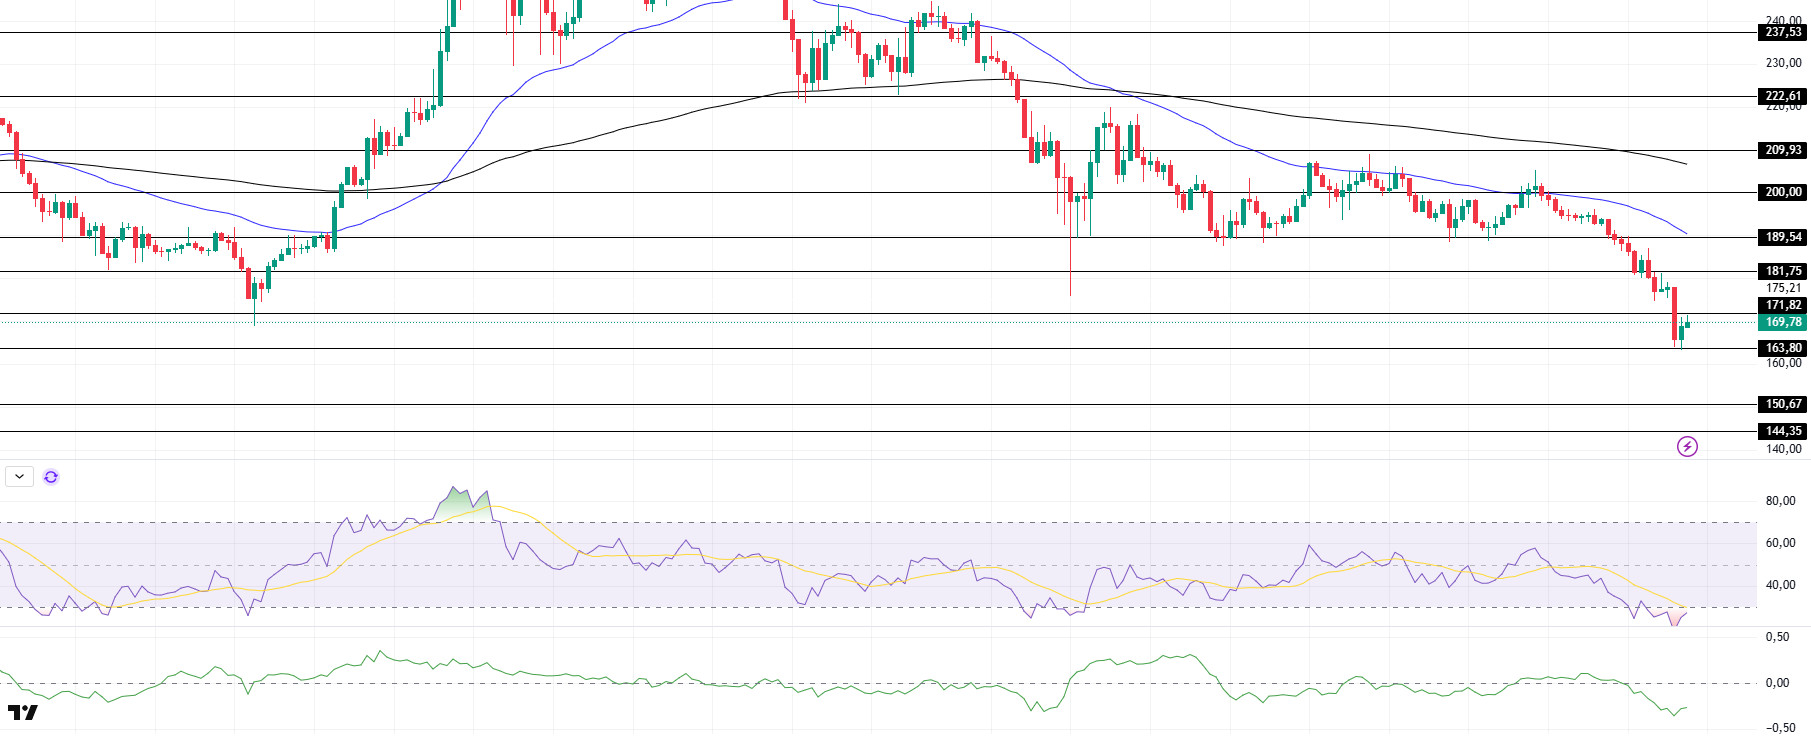
Solana’s price plummeted to as low as $162 due to declining network activity. Solana has been linked to high-profile carpet-pulling scams, reducing investor confidence in the network. The upcoming token unlock could further weaken Solana’s price by increasing selling pressure.
On the 4-hour timeframe, the 50 EMA (Blue Line) continues to be below the 200 EMA (Black Line). This may continue to deepen the decline in the medium term. At the same time, the asset continued to hover below both moving averages. However, the higher level between the two moving averages may move the asset up. When we examine the Chaikin Money Flow (CMF)20 indicator, although it is in the negative zone, the decrease in money outflows and the increase in volume can be seen as a bullish sign. This could mean that buyers have started to increase and are struggling with sellers. However, the Relative Strength Index (RSI)14 indicator is in oversold territory. The $ 200.00 level appears to be a very strong resistance point in the rises driven by both the upcoming macroeconomic data and the news in the Solana ecosystem. If it breaks here, the rise may continue. In case of retracements for the opposite reasons or due to profit sales, the support level of $ 163.80 can be triggered again. If the price reaches these support levels, a potential bullish opportunity may arise if momentum increases.
Supports 163.80 – 150.67 – 144.35
Resistances 171.82 – 181.75 – 189.54
DOGE/USDT
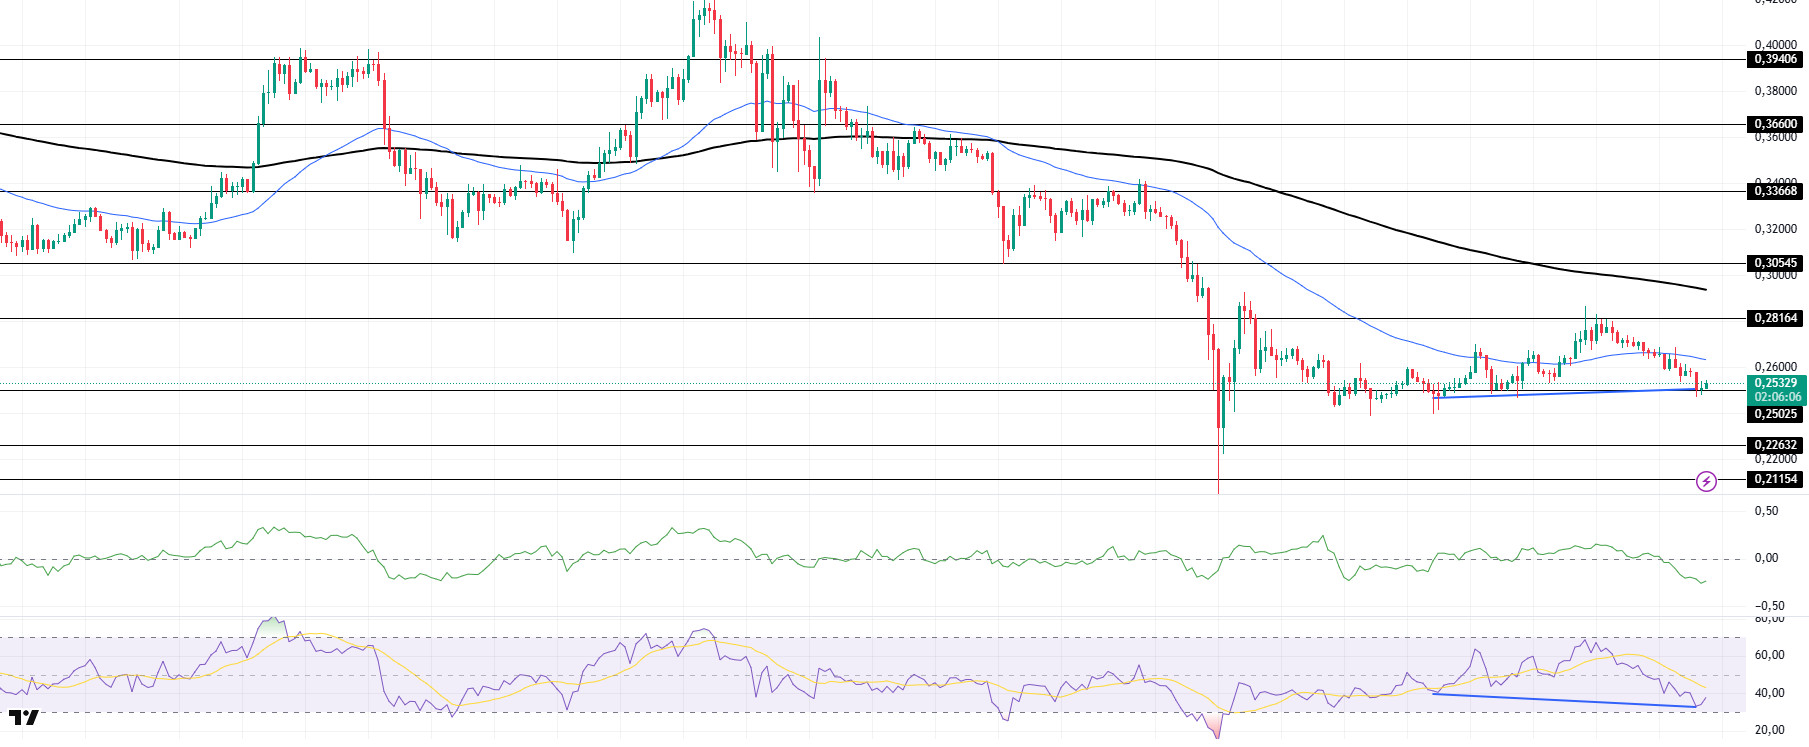
DOGE has continued its decline since our morning analysis, showing a slight rebound from its strong support at 0.25025. At the same time, the asset remains below the 50 EMA (Blue Line) 200 EMA (Black Line) on the 4-hour timeframe. This could mean that the decline could deepen further in the medium term. The price, however, remains below the two moving averages. However, the larger gap between the two moving averages could further increase the probability of DOGE moving higher. The Chaikin Money Flow (CMF)20 indicator is in negative territory and has started to decline despite the large outflows. The fact that the volume has increased and CMF is at a negative level shows us that sellers are dominant. At the same time, the Relative Strength Index (RSI)14 is in oversold territory and there is a bullish mismatch. This may increase the price. The $0.33668 level is a very strong resistance point in the uptrend due to political reasons, macroeconomic data and innovations in the DOGE coin. In case of possible pullbacks due to political, macroeconomic reasons or negativities in the ecosystem, the $0.22632 level, which is the base level of the trend, is an important support. If the price reaches these support levels, a potential bullish opportunity may arise if momentum increases.
Supports 0.25025 – 0.22632 – 0.21154
Resistances 0.28164 – 0.30545 – 0.33668
AVISO LEGAL
La información sobre inversiones, los comentarios y las recomendaciones que figuran en este documento no constituyen asesoramiento en materia de inversiones. Los servicios de asesoramiento en materia de inversión son prestados individualmente por instituciones autorizadas teniendo en cuenta las preferencias de riesgo y rentabilidad de los particulares. Los comentarios y recomendaciones aquí contenidos son de carácter general. Estas recomendaciones pueden no ser adecuadas para su situación financiera y sus preferencias de riesgo y rentabilidad. Por lo tanto, tomar una decisión de inversión basándose únicamente en la información aquí contenida puede no producir resultados acordes con sus expectativas.
