
Informe semanal de análisis técnico
BTC/USDT
Although the second week of Agosto was relatively calm, there was a notable development in the market. U.S. President Donald Trump signed an executive order allowing cryptocurrencies to be included in 401(k) retirement accounts, sparking market volatility. Trump also claimed that revisions to non-farm employment data indicated that labor statistics were being manipulated for political purposes. Additionally, the US announced new tariffs on several countries, including Canada, Brazil, India, and Switzerland. The administration stated that it would impose a 100% tariff on semiconductor products without production commitments. Additionally, it was reported that Apple will make an additional $100 billion investment in the US. Corporate purchases continued with Strategy and small-scale companies based in Europe.
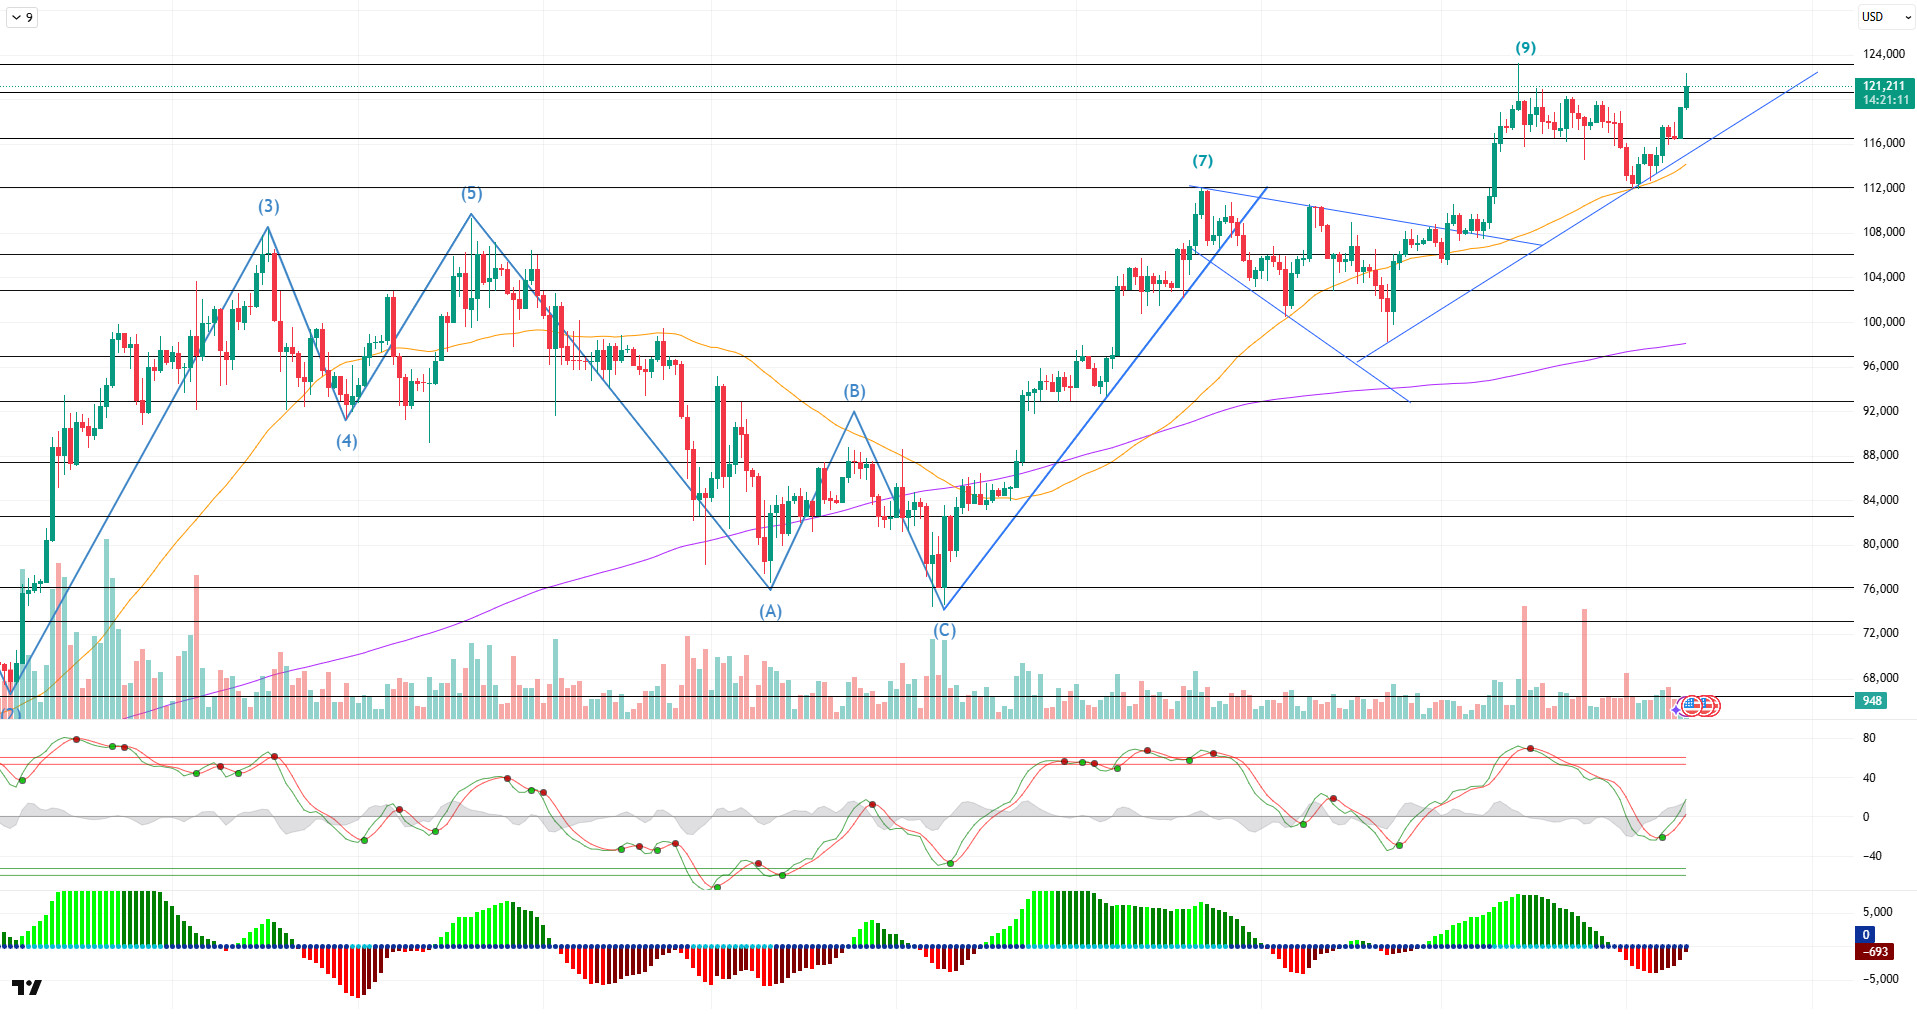
Looking at the daily technical outlook following all these developments, BTC completed its consolidation phase near the ATH level after reaching the 9th peak with its golden cross formation and retreated to the 112,000 level, which is the SMA 50 line. After the dip at this level, BTC has resumed its upward trend, crossing back into the ATH zone and currently trading around 122,000.
Looking at technical indicators, the WT oscillator has shifted to the overbought zone by forming a trend reversal at the middle band of the channel on the daily chart. The Squeeze Momentum (SM) indicator is preparing to move into the positive zone. Meanwhile, the golden cross pattern continues as the 50-day SMA crosses above the 200-day SMA.
When examining weekly liquidity data, it is observed that the selling level has been cleared above the 120,000 level with the recent rise, while the buying level is concentrated around 115,000 on a weekly basis.
In summary, fundamental developments have once again created a driving force on the price. The technical structure has prepared the ground for an upward movement, enabling the price to gain momentum. Liquidity data, on the other hand, targeted sell-side positions above 120,000 and executed liquidity purchases in this region. While the price is seen to be trading close to the peak level it reached at the 9th point, breaking above this level could lead to an acceleration in the upward movement. In this context, 125,000 stands out as a psychological resistance point. In the event of a possible correction, the trend line and liquidity zone are the areas where we expect the price to find support.
Support levels: 116,400 – 115,000 – 112,000
Resistance levels: 123,000 – 125,000 – 130,000
ETH/USDT
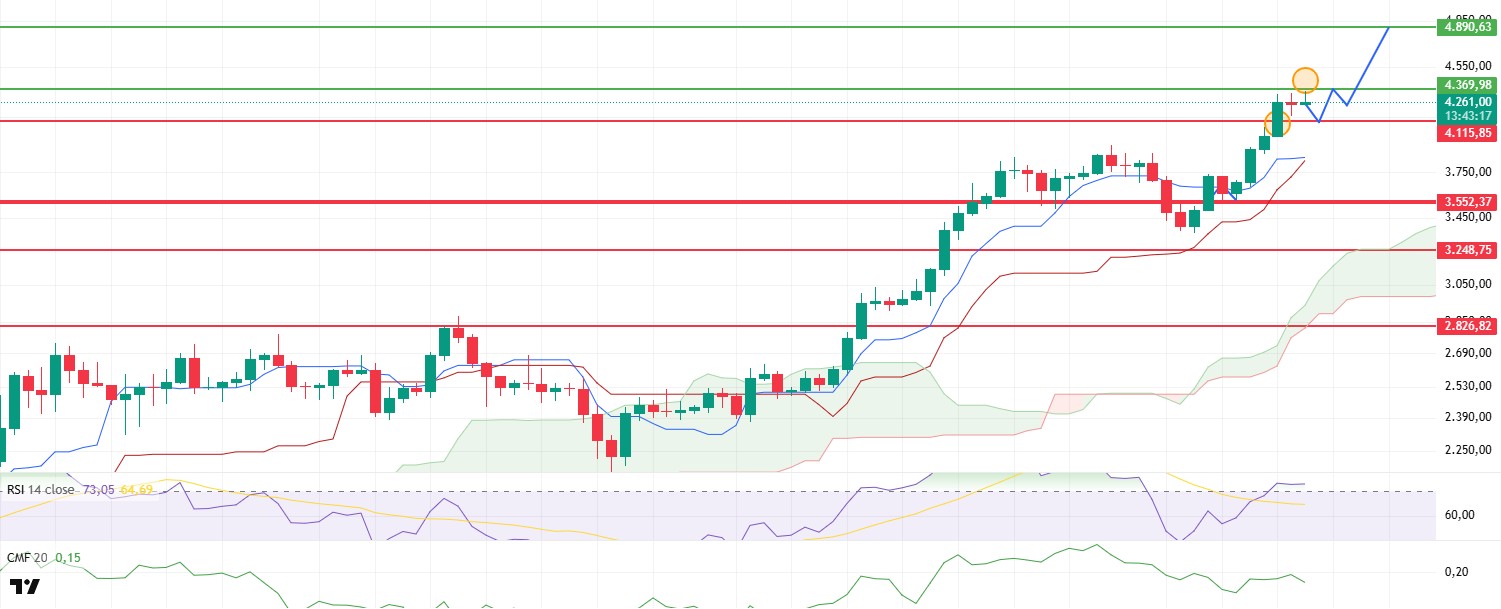
Ethereum managed to break through the major resistance level of $4,115, which had been tested multiple times since Marzo 2024, despite the strengthening of institutional demand and the approval of the “Genius Act” in the US and rose to $4,350 with strong momentum. The most significant catalyst for the rise was the U.S. government’s official announcement last Jueves of regulations allowing investments in digital assets in 401(k) retirement plans. This decision represents a structural change that could facilitate the entry of large institutional players with a long-term investment perspective, such as pension funds, into the crypto asset market. However, on the on-chain side, the total amount of staked ETH decreased from 36.20 million to 36.16 million, indicating that large-scale investors have partially realized their profits. This seemingly small decrease shows that certain investor groups have reduced their positions due to risk management requirements, despite the price surpassing critical levels.
When on-chain and technical indicators are analyzed together, the picture does not appear entirely smooth. The Spot Market Cumulative Volume Delta (CVD) data not moving in the same direction as the price increase indicates that aggressive buying in the spot market has been limited, with sell orders dominating the order book. In particular, the continued presence of CVD in the negative zone indicates that the price is being supported more by buying from futures than from spot market purchases. Leveraged trading can push prices higher in the short term but creates a risky environment in terms of sustainability. If leveraged positions are liquidated, downward movements could accelerate.
The Ichimoku indicator, with the price above the Tenkan, Kijun, and Kumo cloud, confirms the positive outlook for both the short-term and overall trends. However, the convergence of the Tenkan and Kijun lines suggests that momentum may slow down and the price could enter a short-term balancing or consolidation phase.
The Chaikin Money Flow (CMF) indicator remained in positive territory throughout the uptrend, confirming the presence of buyer entries, but showed a slight pullback with recent price movements. This suggests that net capital inflows are slowing and that short-term investors are increasingly looking to realize profits. While the CMF remaining in the positive zone is important for maintaining the trend, its approach toward the zero line could be an early indicator of increasing selling pressure.
The Relative Strength Index (RSI) indicator re-entered the overbought zone with the latest price move and is now moving sideways. While the RSI remaining in the overbought zone confirms the strength of the trend, the possibility of a short-term correction becomes more pronounced if a negative divergence forms between the price and the RSI.
In terms of critical levels, the $4,115 level stands out technically. Sustained daily closes above this level could help maintain the current uptrend. However, closes below $4,115 could increase selling pressure and cause the price to retreat toward deeper support zones. On the other hand, daily closes above $4,369 would strengthen the likelihood of the upward trend continuing without an intermediate correction.
Support levels: 4,115 – 3,552 – 3,248
Resistance levels: 4,369 – 4,648 – 4,890
XRP/USDT
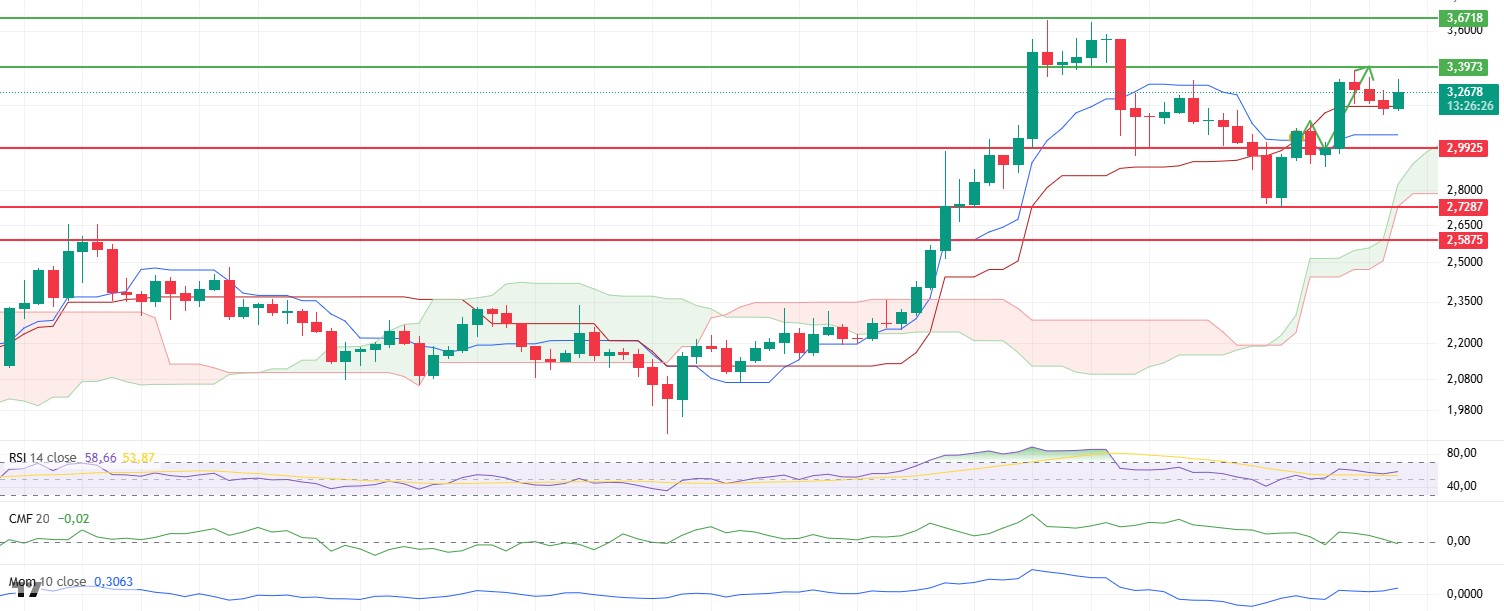
The rejection of Ripple’s joint appeal with the SEC and the official end of the nearly five-year legal process significantly reduced market uncertainty, causing prices to rebound quickly. Following this news, XRP rose to the strong resistance zone at the $3.39 level. However, it experienced a slight pullback due to selling pressure at this level. Nevertheless, the price currently holding above the kijun level at approximately $3.19 on the Ichimoku indicator is helping to maintain the short-term positive outlook.
From the Ichimoku perspective, the price being above both the tenkan and kijun lines as well as the kumo cloud confirms that the primary trend remains upward. However, the tenkan line being below the kijun line could be interpreted as a sign of weakening momentum in the short term.
On the technical indicators side, the Chaikin Money Flow (CMF) is noteworthy. The CMF falling below the zero line indicates that profit-taking has increased during the uptrend and that there has been a net outflow of money from the market . This suggests that buying power has not strengthened in tandem with the price rise. Similarly, if the Cumulative Volume Delta (CVD) data does not accompany price movements, it is possible to think that the rise is not based on organic spot demand, but rather on leveraged transactions. This type of structure is generally fragile, and the market becomes more sensitive during pullbacks.
On the momentum side, RSI continues its upward movement. However, as the price continues to rise, RSI approaching the overbought zone, especially when the price reaches new highs but RSI fails to reach the same levels, has led to negative divergence and may increase the risk of a short-term reversal. Therefore, it is important to closely monitor the alignment between price movement and RSI.
Looking at possible scenarios, if there is a daily close above the $3.39 level, supported by increasing volume and recovering CVD, the likelihood of the uptrend continuing will increase, and the next resistance levels could be tested. On the other hand, if the price drops below 3.19 dollars, with the CMF remaining in the negative zone and the CVD weakening, this could increase selling pressure, pushing the price first to 3.09 dollars and then to deeper levels.
Top of the Form Bottom of the Supports levels: 2.9925 – 2.7287 – 2.5875
Resistance levels: 3.3973 – 3.6718 – 4.1848
SOL/USDT
La semana pasada en el ecosistema de Solana;
- Anatoly Yakovenko criticized the community, calling it “useless,” sparking backlash amid growing meme coin confidence and an active holder base in Solana.
- DeFi Development Corp added 110,466 SOL to its treasury.
- Solana Mobile’s Seeker smartphone begins shipping today with over 150,000 pre-orders.
- Upexi increased its Solana holdings by 172% in Julio, surpassing 2 million SOL.
- Phantom announced its fourth acquisition in the past 16 months by adding SolSniper, an advanced on-chain trading terminal.
- BIT Mining launched its first Solana validator with a $4.89 million investment.
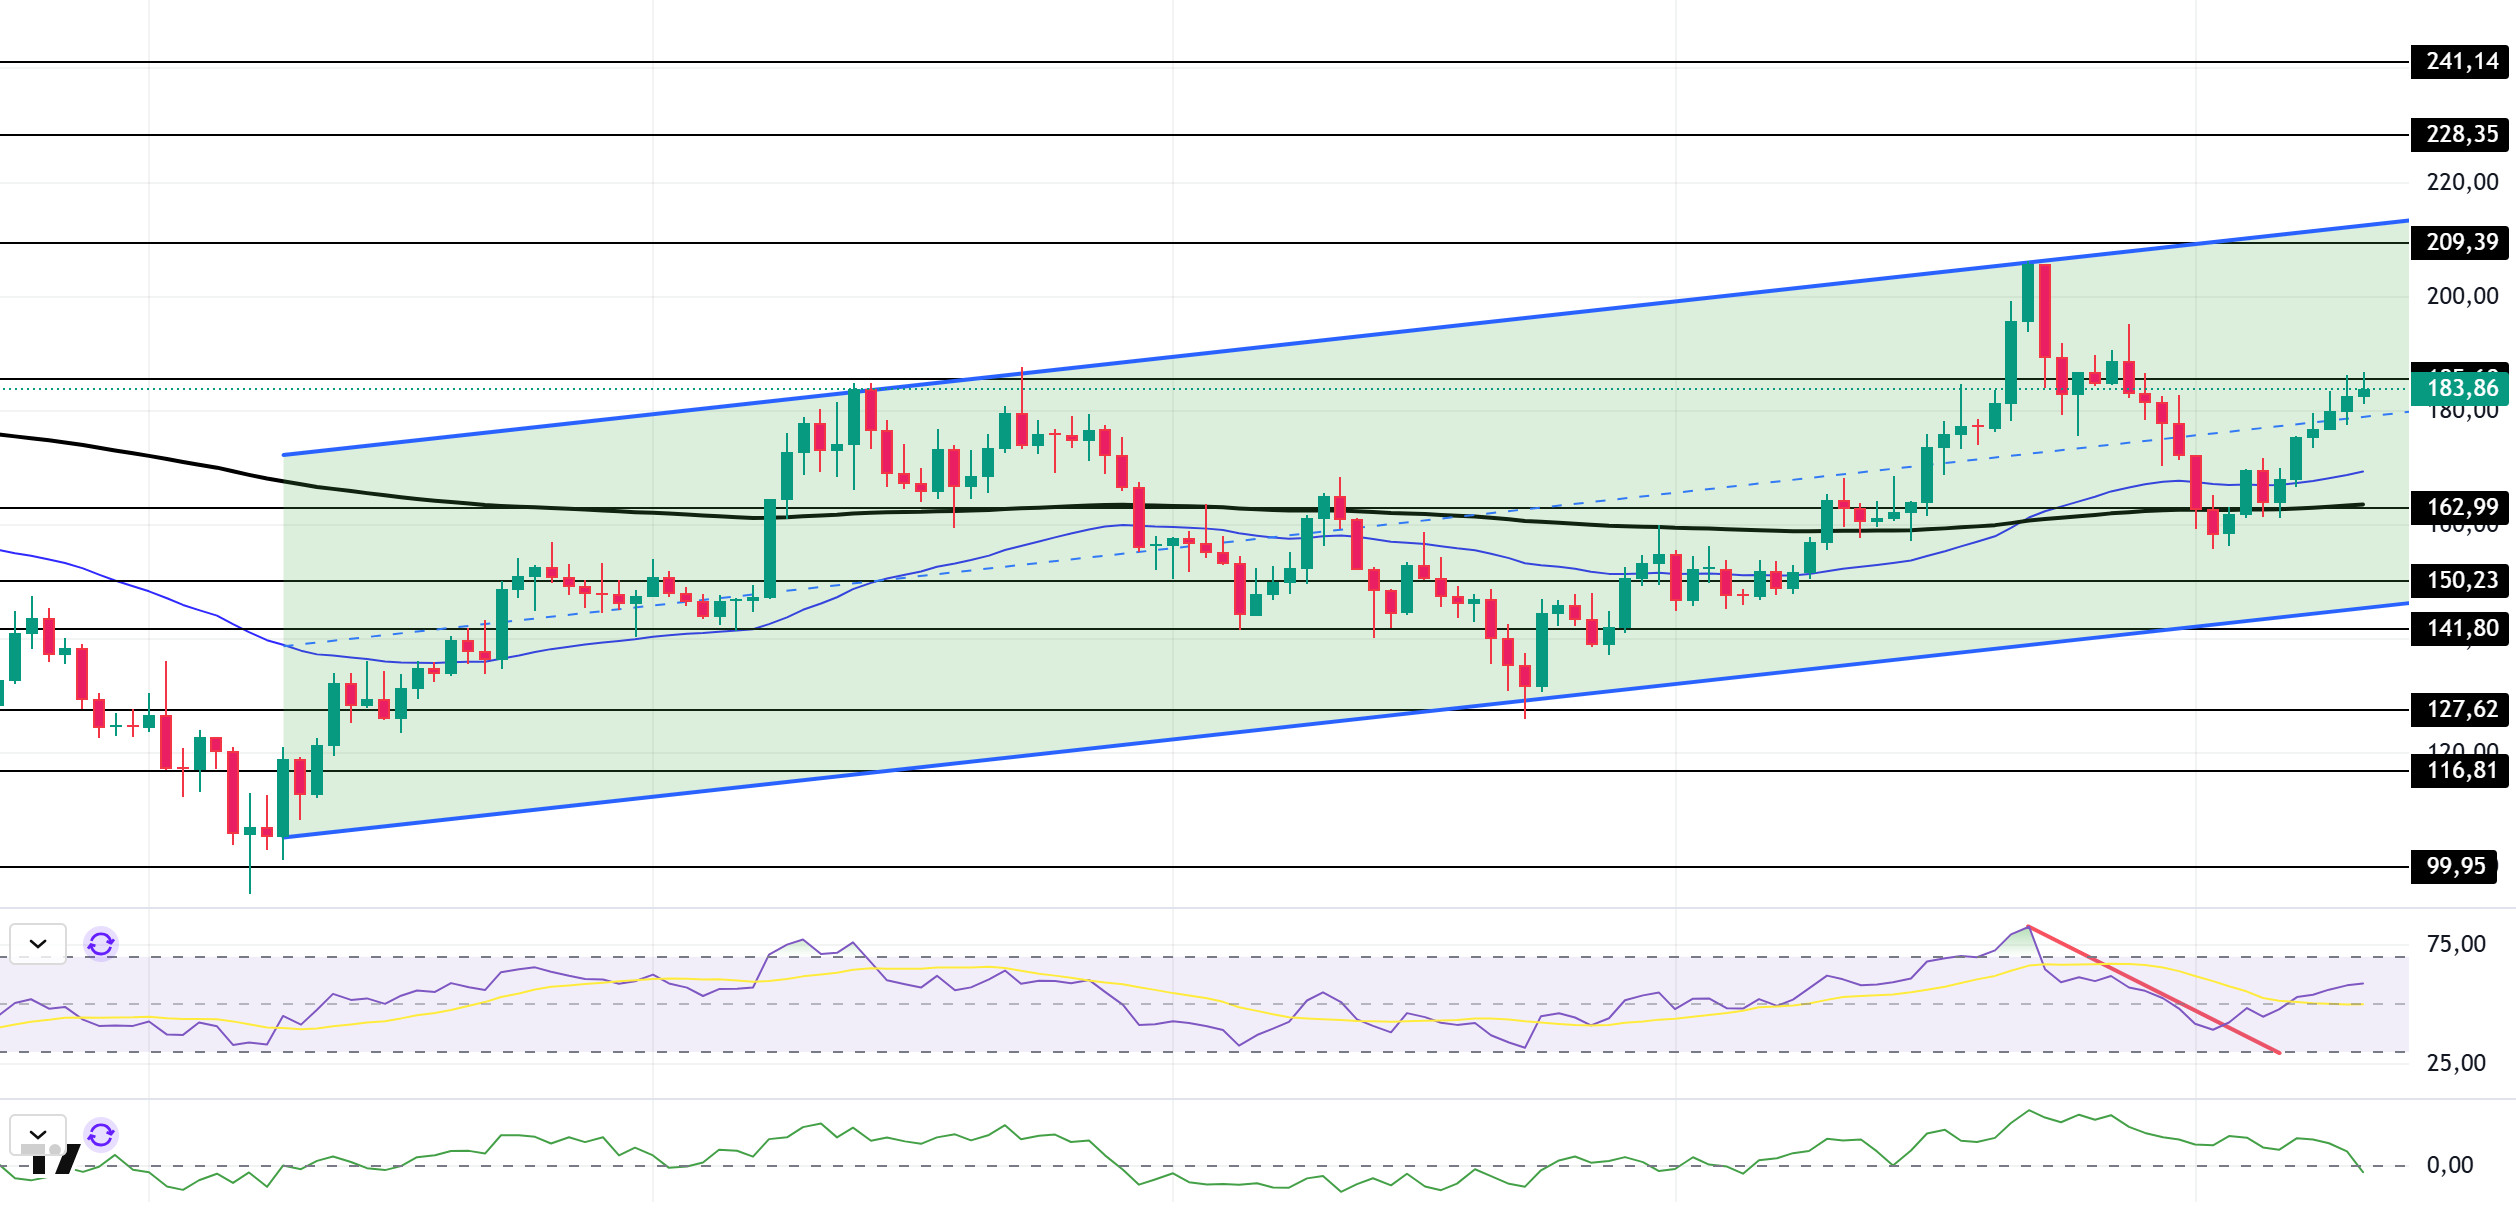
The SOL price experienced an uptrend this week. The asset continues to gain value at the mid-levels of the upward trend that began on Abril 9. The price tested the 50 EMA (Blue Line) and 200 EMA (Black Line) moving averages as support and rose from there. As of now, the asset is testing the strong resistance level at $185.60. If it closes above this level, the trend’s ceiling level should be monitored. In case of pullbacks, the 50 EMA moving average should be tested.
The asset is trading above the 50 EMA (Blue Line) and 200 EMA (Black Line) moving averages, indicating that the asset is in an uptrend. Additionally, the 50 EMA remaining above the 200 EMA indicates the continuation of a technical “golden cross” formation. This suggests the potential for an upward movement in the medium term. The RSI (14) has moved into the positive zone, indicating the formation of buying pressure. Additionally, the indicator broke above the downward trend that began on Julio 22. This could strengthen the upward movement. The Chaikin Money Flow (CMF-20) has moved into the negative zone; simultaneously, the decline in capital inflows could push the CMF-20 indicator deeper into the negative zone. If macroeconomic data continues to perform positively and developments in the ecosystem remain favorable, the first major resistance level at $209.39 could be retested. Conversely, in the event of potential negative news flow or deterioration in macroeconomic data, the $162.99 level could be monitored as a potential buying opportunity.
Support levels: 162.99 – 150.23 – 141.80
Resistance Levels: 185.60 – 209.39 – 228.35
DOGE/USDT
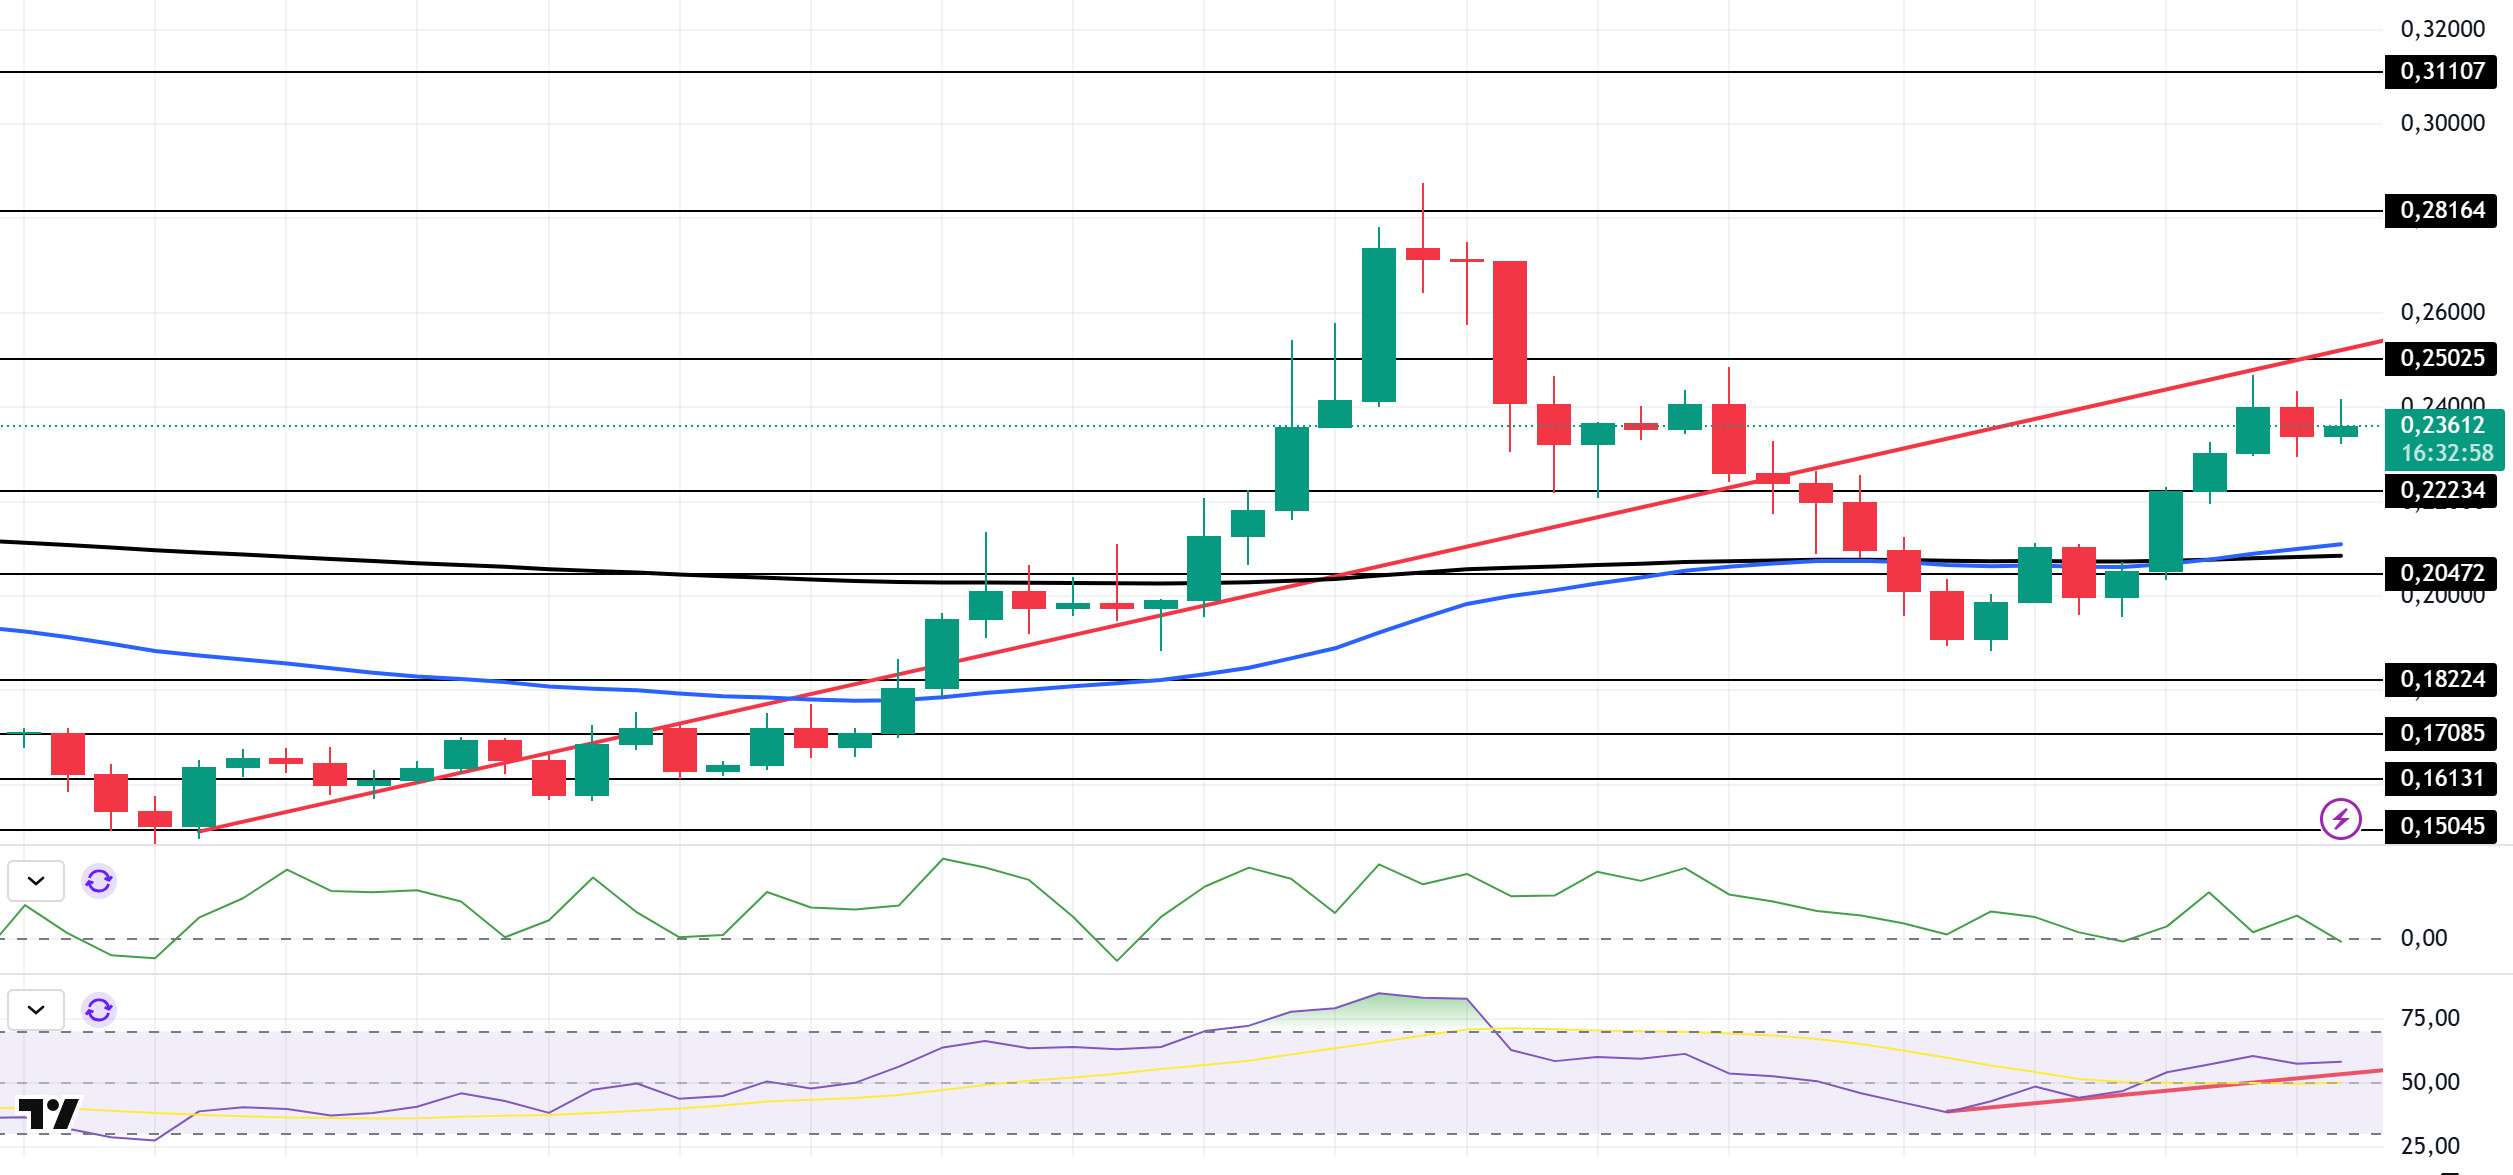
DOGE has seen an increase of approximately 19.55% since last week on the daily chart. The asset, which has been testing the resistance level of the upward trend that began on Junio 23, may test the $0.22234 level if it fails to break through this level. Additionally, the price has broken above the 50 EMA (Blue Line) and 200 EMA (Black Line) moving averages, maintaining its upward momentum. If the price closes above the 0.25025 dollar level ( ), the upward trend may continue. In the event of a pullback, the 0.22234 dollar level can be monitored as support.
The asset began trading above the 50 EMA and 200 EMA moving averages. This indicates that the asset is trending upward. On the other hand, the 50 EMA began to rise above the 200 EMA, indicating the beginning of a “golden cross” formation. This signals that upward pressure may continue in the medium term. The Chaikin Money Flow (CMF–20) indicator is at a neutral level. Money inflows continue to decline, which could push the CMF-20 into negative territory. Looking at the Relative Strength Index (RSI-14) indicator, it is at a buy level. On the other hand, it has remained above the upward trend that has been ongoing since Agosto 2. This indicates that the positive effect is continuing. In the event of macroeconomic risks or negative news from the ecosystem, the $0.20472 level can be monitored as a strong support level. On the other hand, if the upward movement gains strength, the $0.25025 level comes to the fore as the first strong resistance level.
Support levels: 0.22234 – 0.20472 – 0.18224
Resistance levels: 0.25025 – 0.28164 – 0.31107
TRX/USDT
During the week of Agosto 4–10, 2025, a total of 42.3 million TRX were burned on the TRON network. As a result, the circulating supply decreased by 14.9 million. The decrease in circulating supply continues to exert deflationary pressure on TRX. Additionally, the total number of addresses increased by 1.6 million to reach 325 million during the same week.
Last week, the TRON network generated a total revenue of $96.6 million, increasing its revenue by approximately $5 million compared to the previous week and continuing to be the highest-revenue-generating ecosystem among all blockchain networks. This increase was driven by stablecoin transfers on the TRON network and user interactions in the DeFi sector.
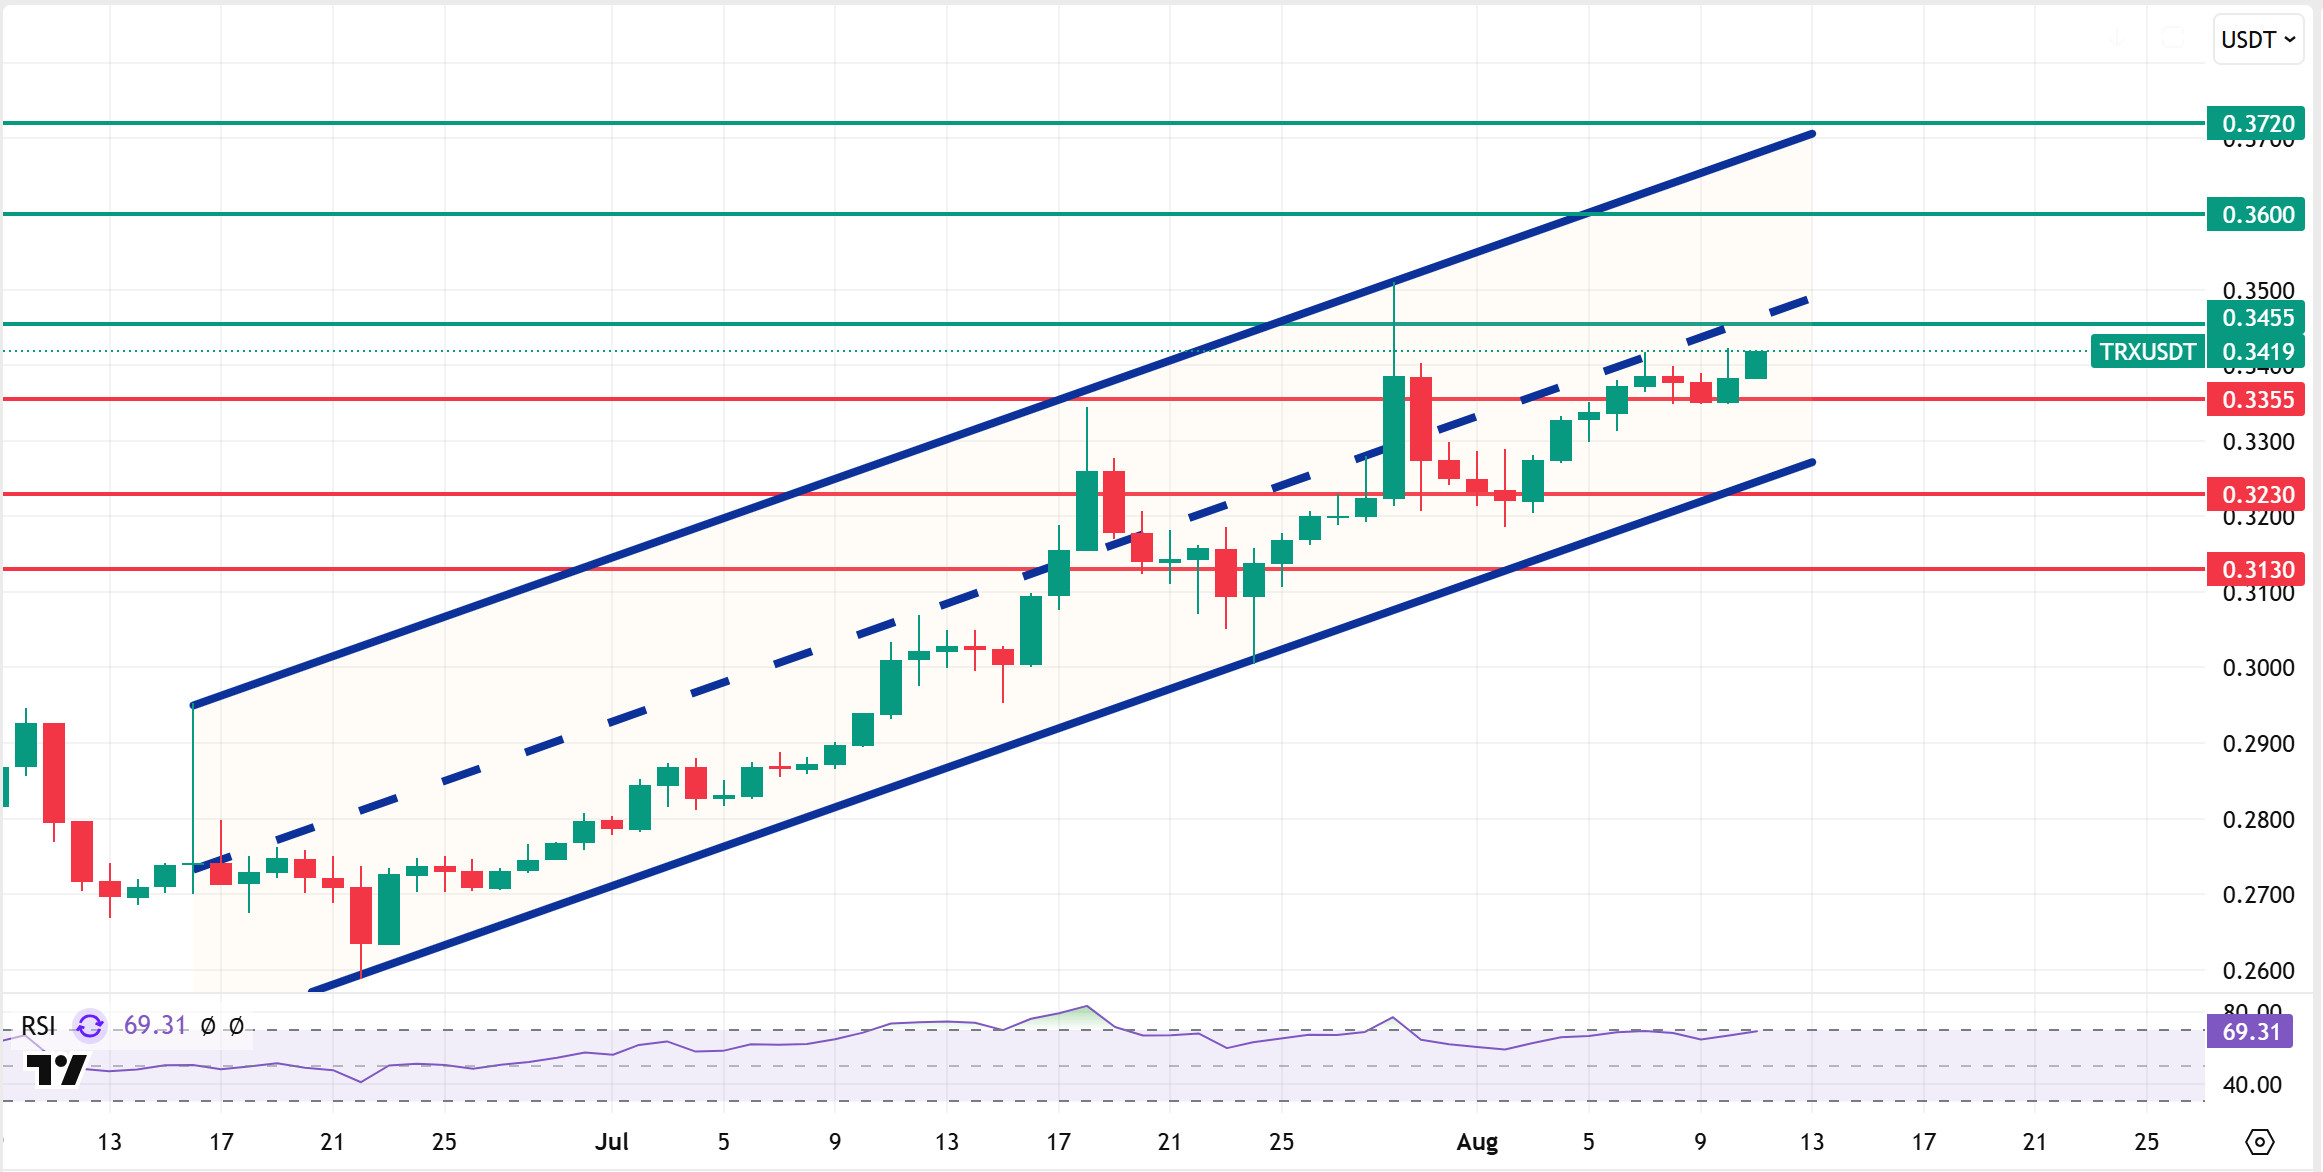
TRX started last week at 0.3275 and rose by approximately 3.5% during the week, closing at 0.3383. Thus, it closed its seventh consecutive week with an increase, reaching a market value of $32.2 billion. Currently trading at 0.3419, TRX is in the middle band of the bullish channel on the daily chart. The Relative Strength Index (RSI) value is 69, very close to the overbought zone. The TRX price is expected to rise slightly from these levels to the 0.3455 resistance level, then pull back and move towards the lower band of the bullish channel. In such a scenario, it could test the support levels of 0.3355 and 0.3230. If it closes below the 0.3230 support level, it may test the 0.3130 support level. If it fails to close below the 0.3355 support level and the positive market sentiment persists, it could rise due to potential buying activity in this area. In such a scenario, it could move toward the upper band of the bullish channel and test the resistance levels of 0.3455 and 0.3600. The 0.3130 level is an important support on the daily chart, and as long as it remains above this level, the upward momentum is expected to continue. A break below this support could increase selling pressure.
Support levels: 0.3355 – 0.3230 – 0.3130
Resistance levels: 0.3455 – 0.3600 – 0.3720
AVAX/USDT
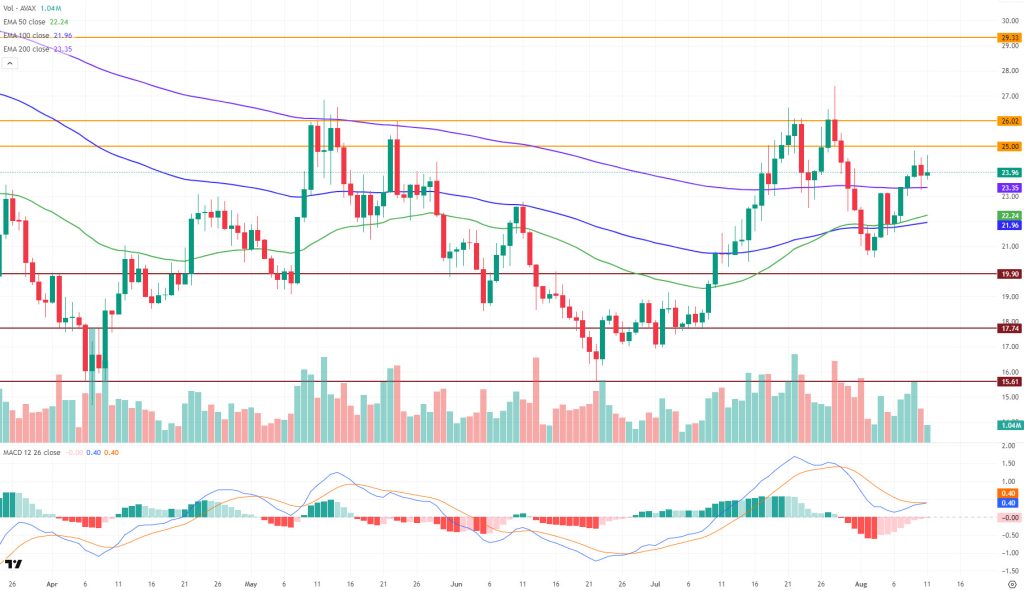
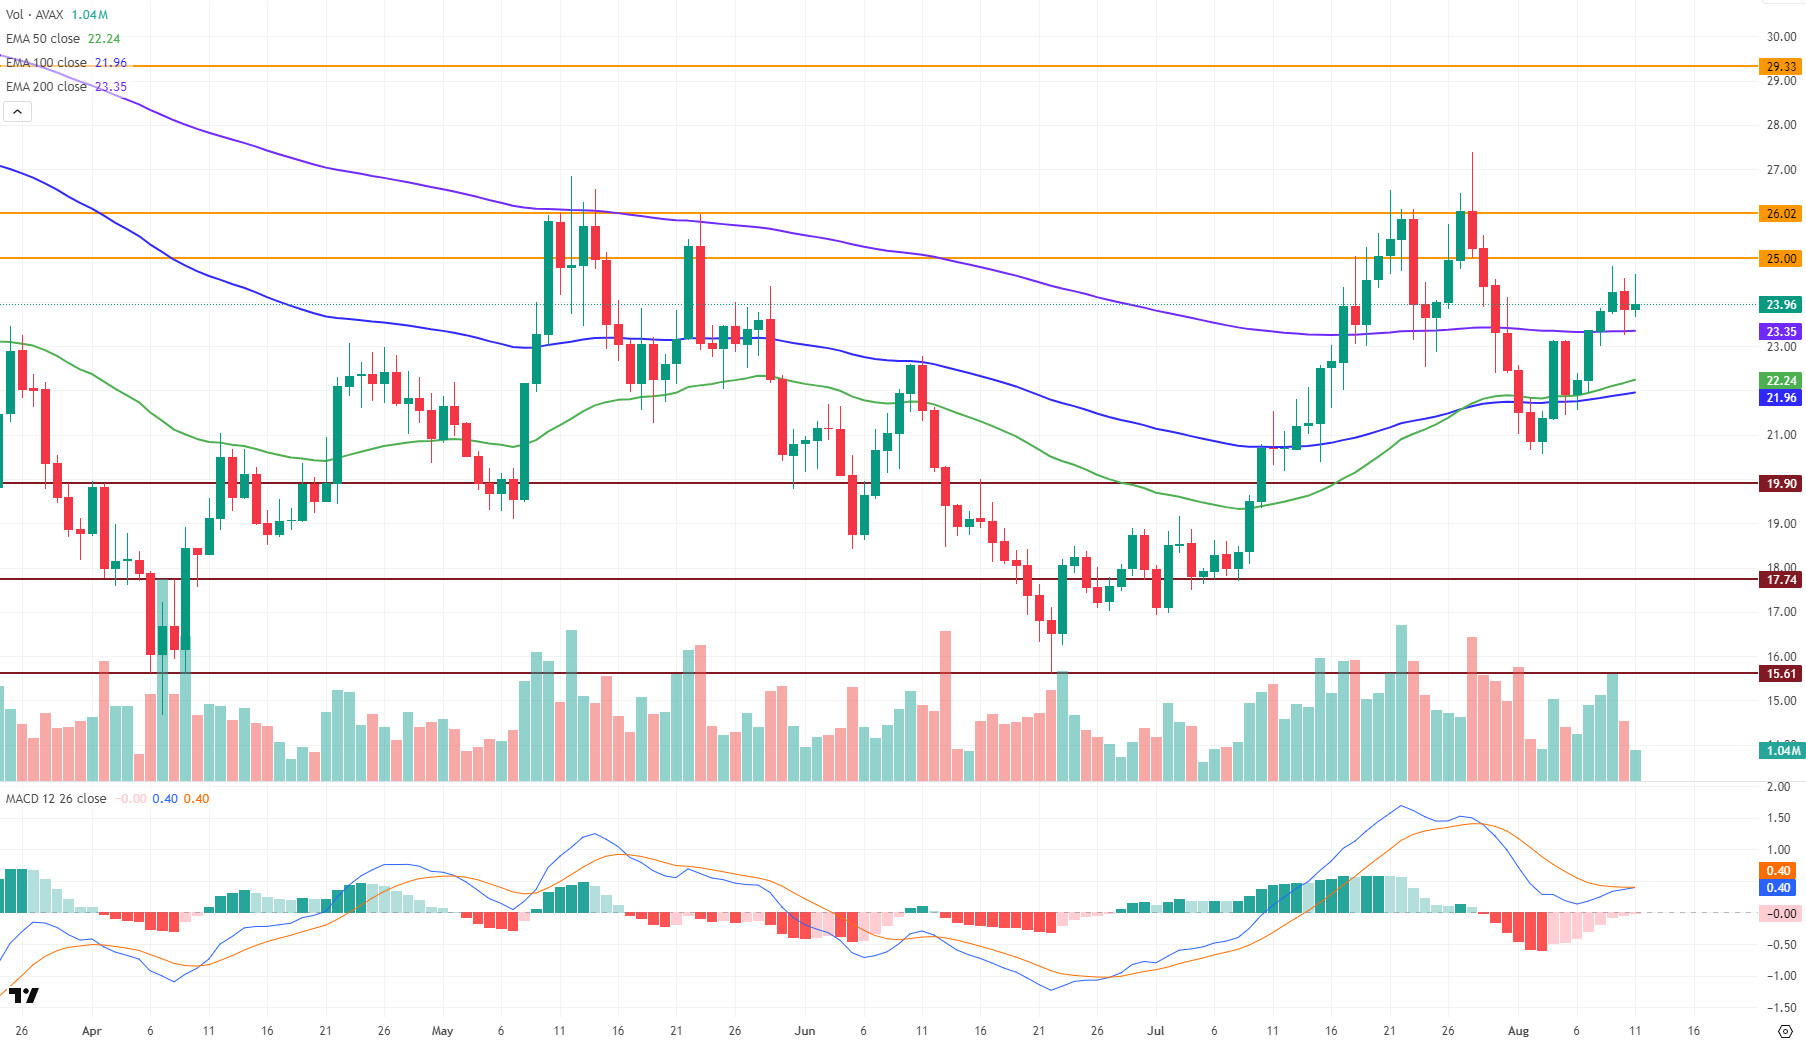
AVAX started the previous week at $21.38 and closed at $23.83, up approximately 11% on a weekly basis. On the first day of the week, AVAX broke above the 50 and 100-period Exponential Moving Average (EMA) levels, then surpassed the 200-period EMA level, leaving our first resistance level of 23.08 behind. AVAX retreated on the last day of the week but started the new week with an upward trend, supported by the reaction at the EMA200 level. On the daily chart, AVAX began the week strongly, breaking above the 50, 100, and 200-period EMA levels. Maintaining this level above the critical EMA levels is crucial for the continuation of the upward trend.
When examining the technical indicators on the daily chart, we observe that the Moving Average Convergence/Divergence (MACD) line and the signal line have nearly reached the same level and are approaching the crossover phase. The MACD value is very close to 0, indicating that it has entered the neutral zone. This suggests that the significant negative momentum observed in the previous week has weakened, and selling pressure is beginning to give way to a more balanced price movement. The gradual contraction of the histogram bars toward the zero line could signal a potential shift in momentum. If the MACD line crosses above the signal line, a short-term positive momentum could begin, and buyers could regain strength. However, if this crossover does not occur and the MACD remains below the signal line, the market could resume its weak appearance.
In the coming period, it is critical for AVAX to maintain stability above the EMA50, EMA100, and EMA200 levels for the uptrend to continue. If stability is maintained above these levels, the 25 dollar level may come into focus as an intermediate resistance level, followed by the 26.02 dollar level as the main resistance level. If the $26.02 level is broken, the upward movement is expected to gain momentum and continue towards the $29.33 level. On the contrary, if AVAX cannot remain above these critical EMA levels and selling pressure increases again, the $19.90 level may be tested in the first stage. If this level is broken downward, the $17.74 level will emerge as the main support. In a deeper pullback, the decline could continue to the $15.61 level. Overall, staying above the critical EMA levels could create positive momentum for an uptrend; otherwise, selling pressure could re-emerge in the short term.
(EMA50: línea verde, EMA100: línea azul, EMA200: línea púrpura)
Niveles de soporte: 19,90 - 17,74 - 15,61
Resistance levels: 25 – 26.02 – 29.33
 SHIB/USDT
This week, the Shiba Inu (SHIB) ecosystem experienced a period marked by the continued momentum of mechanisms aimed at reducing supply, sustained interest from major investors, and significant steps taken by the community and infrastructure teams. Over a seven-day period, a total of 23 million SHIB were permanently removed from circulation. Midweek, the burn rate reached an impressive 3.464%, resulting in the burning of 9.6 million SHIB in a single day. Despite these fluctuations, the deflationary process continued steadily, with community-led burn campaigns continuing to reduce the supply.
On-chain data indicated that whales maintained their SHIB positions and continued to expand them when opportunities arose. One notable transaction this week involved an anonymous wallet linked to Coinbase Prime increasing its SHIB balance by 193.4 billion units (approximately $2.37 million) in a single day. SHIB reserves on centralized exchanges remained at around 84 trillion, near the lowest levels of the year. This indicates that investors are sticking to their long-term strategies by holding their assets in non-exchange wallets. The percentage of addresses in loss increased due to price fluctuations, while the percentage of addresses in profit dropped to 27%. Although there was a partial improvement in this metric as SHIB prices recovered later in the week, the majority of addresses remained in loss positions. On the community front, the Shiba Inu project took concrete steps toward decentralized governance. A new governance model consisting of a temporary “president” elected by the community and multi-DAO councils was announced. Within this framework, community representatives who will have a say in the management of the ecosystem will guide project decisions in line with the principle of decentralization. A new burn plan based on games has also been implemented. Players in games connected to the SHIB ecosystem can now earn SHIB as rewards, while a portion of in-game transactions is directly directed toward burning. This dual-benefit system integrates a reward mechanism that encourages user participation with a burning mechanism that reduces supply. On the infrastructure and development side, the effects of updates to the Shibarium developer portal have become evident. Developers have begun to utilize Shibarium more effectively by leveraging comprehensive documentation ranging from validator node setup to cross-chain bridging. Shibarium’s Ethereum-compatible SDK and tools (such as the Hardhat plugin, ElderJS/Elder-Wrap libraries, and Alpha Layer support) have accelerated smart contract development processes. Additionally, the Shib Paymaster feature allows applications to cover gas fees on behalf of users, while the Bury 2.0 staking model enables long-term holders to earn higher rewards, thereby enhancing the network’s user experience and community engagement. Activity on the Shibarium network remained high, with daily transaction counts consistently exceeding 3,000,000 and total transactions surpassing 1.4 billion. The number of user wallets also continued to grow, indicating continued new participation in the ecosystem.
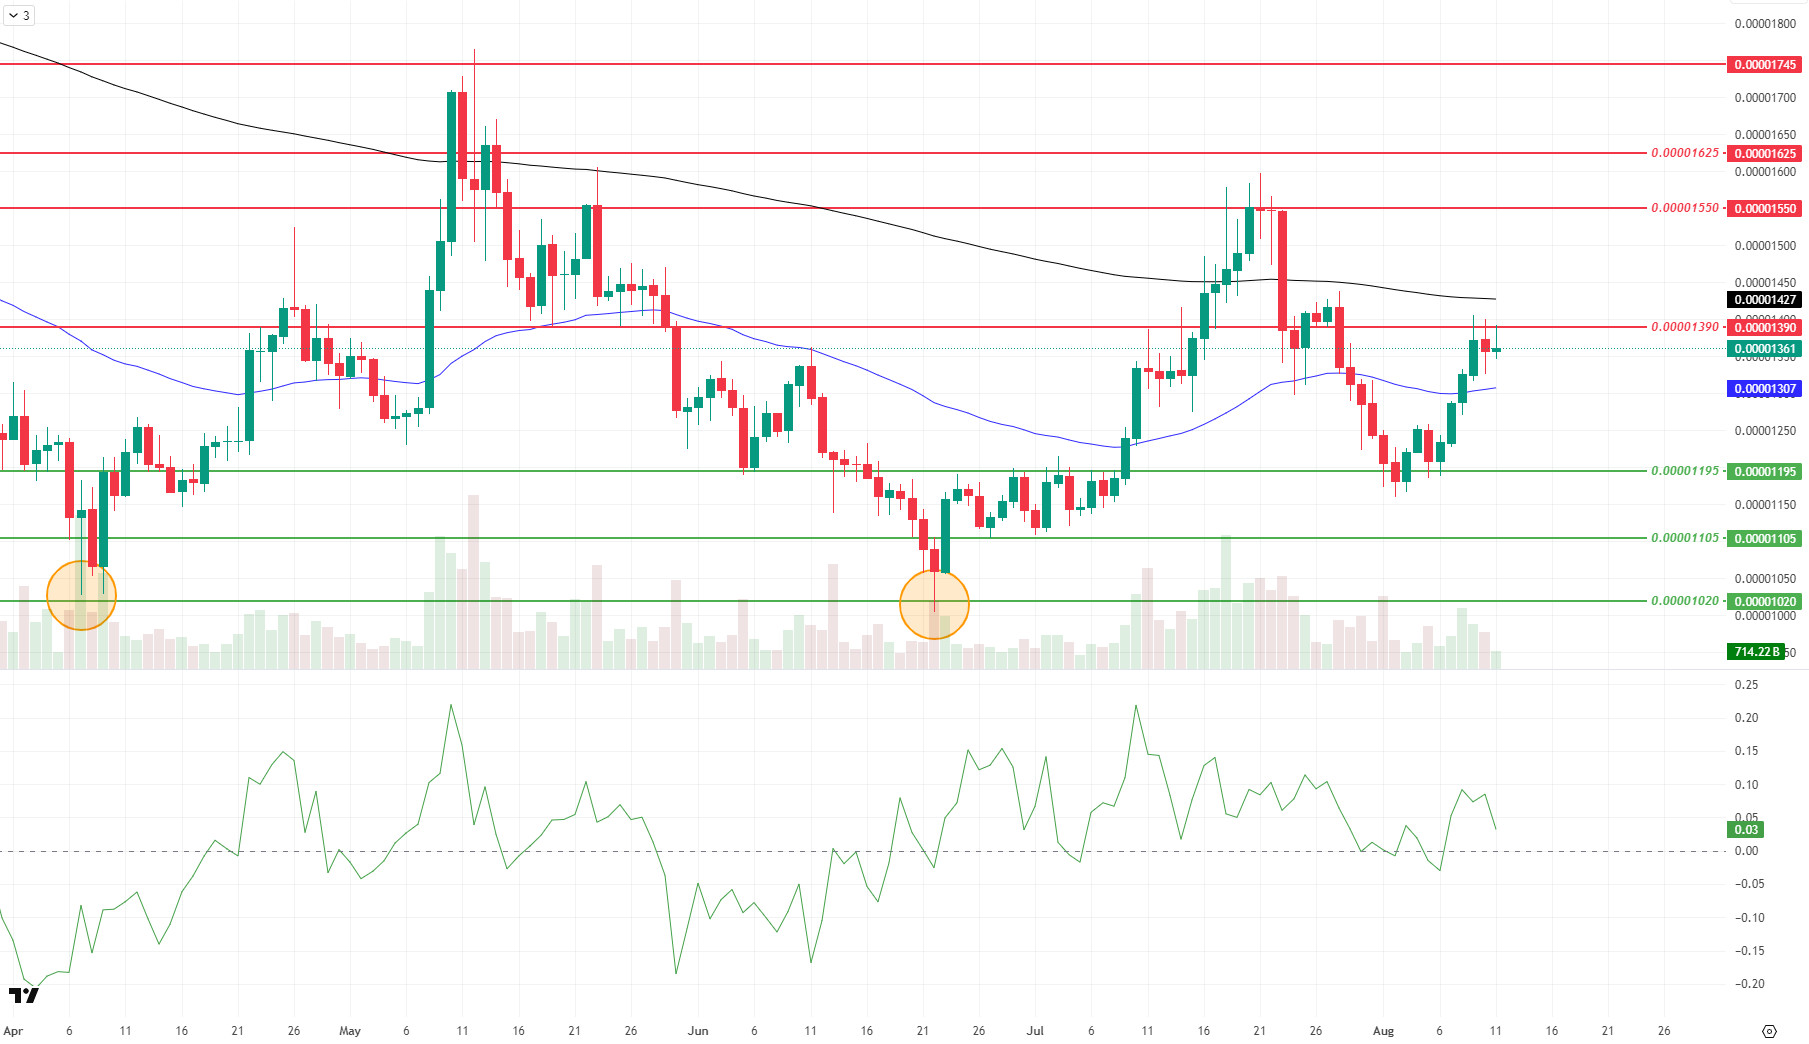
On the technical front, this week saw a rise in Shiba Inu prices driven by rebound buying, with increased momentum and trading volume, while volatility narrowed. The price rose from the support level of $0.00001195 to the resistance level of $0.00001390 and is currently stabilizing at $0.00001350. Remaining above the 50-period Exponential Moving Average (EMA50) level supports short-term momentum, while the 200-period Exponential Moving Average (EMA200) level remains above the price and continues to form a critical barrier in the medium term. The distance between EMA50 and EMA200 is narrowing, which could bring the possibility of a potential upward crossover in the coming days. However, for this scenario to gain validity, daily closes above EMA200 with volume support and sustainability at the 0.00001390 dollar level are required.
In a potential downward scenario, selling pressure from the EMA200 level could pull the price back to the EMA50 region. If the price fails to hold in this region, the 0.00001195 dollar level emerges as the first defense line, with the 0.00001105 dollar and 0.00001020 dollar levels as other support regions to watch below. The Chaikin Money Flow (CMF) indicator remaining in the positive zone at the 0.03 level indicates that capital inflows are continuing and demand may remain strong during pullbacks, but for a stronger buy signal, it is important for the CMF to continue its upward trend. In upward movements of the ” ,” if the $0.00001390 resistance level is broken, the $0.00001550 and $0.00001625 levels could come into focus as the next targets. It will be difficult to speak of a sustained breakout without volume confirmation and consecutive closes at these levels. (EMA200: Black line, EMA50: Blue line)
Niveles de soporte: 0.00001195 - 0.00001105 - 0.00001020
Niveles de resistencia: 0,00001390 - 0,00001550 - 0,00001625
LTC/USDT
Last week, MEI Pharma launched a $100 million corporate treasury strategy by purchasing Litecoin under the guidance of Charlie Lee and GSR. With this development, LTC ended the week with a 12.1% increase and entered the new week at 123.31. During the same period, LTC also gained 7.34% against Bitcoin, reaching a market value of approximately 9.4 billion dollars and climbing one spot to rank 19th in the market rankings. In the futures market, open positions increased by approximately 27% compared to the previous week, while funding rates maintained their positive trend.
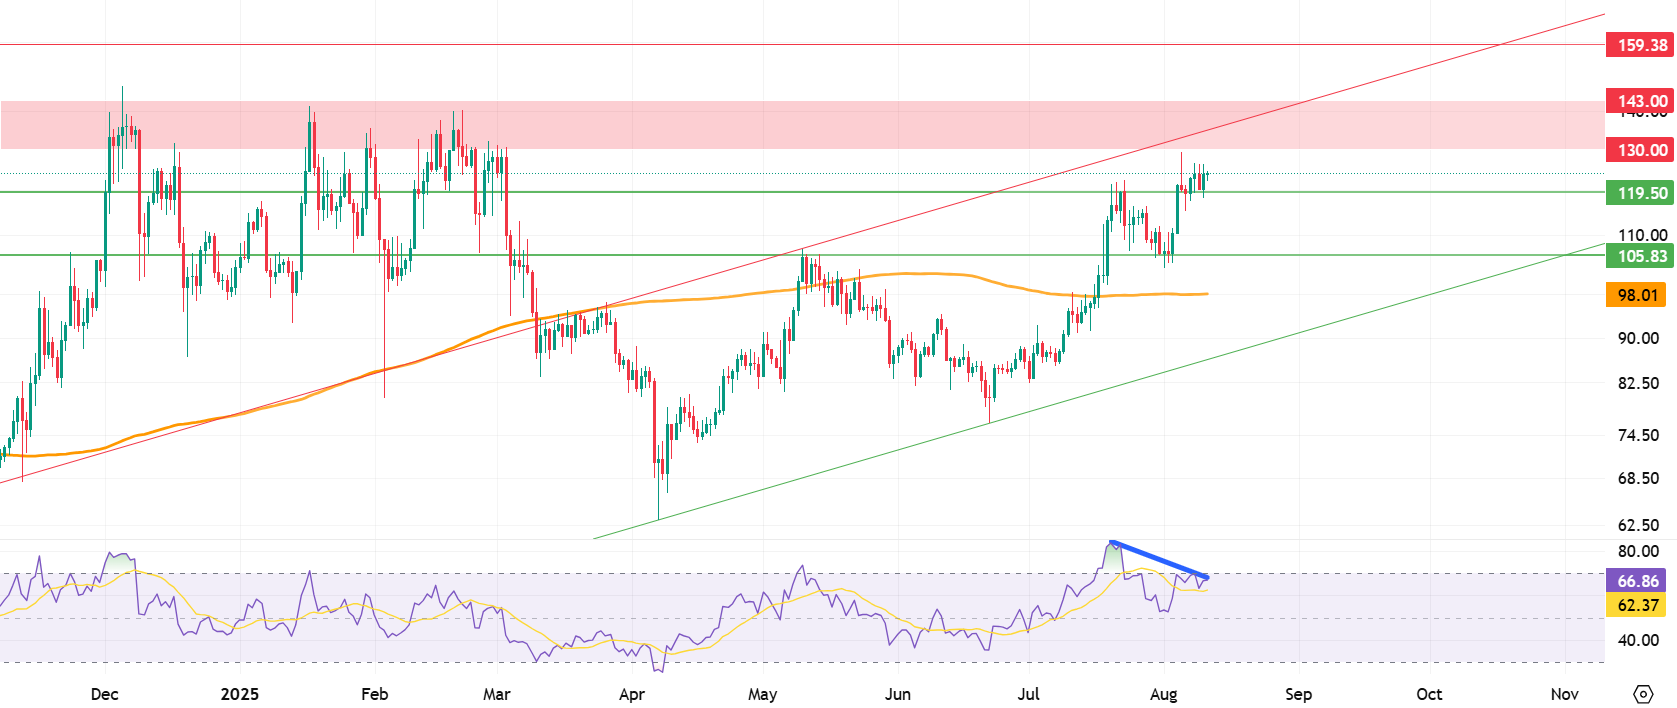
This week, Litecoin (LTC) continues to trade above all key short-, medium-, and long-term moving averages. The absence of any moving averages forming dynamic resistance above the price indicates that upward momentum remains strong. The first notable resistance zone is the 130.00–143.00 range. This band stands out as an important level that has been tested multiple times in the past but has yet to be broken. As the price approaches this zone, quick sell-off reactions may be observed; however, if a breakout occurs, sharp rallies at the same pace are also expected. If this resistance is broken, the only horizontal resistance left in front of the price is at 159.38. With confirmation from the Relative Strength Index (RSI), volume, and trend indicators, price movements are likely to gain momentum after the breakout.
On the other hand, the divergence seen in the RSI has increased the likelihood of a pullback. In this scenario, the first support level is at 119.50. Below this, the intermediate support level at 105.83 can be monitored. In more deep corrections, the 200-day moving average at 98.01 will be one of the critical levels where the price is expected to hold.
Support levels: 119.50 – 105.83 – 98.01
Niveles de resistencia: 130,00 - 143,00 - 159,38
BNB/USDT
This week in the BNB ecosystem, the PROVE project has been listed on Binance Launchpool. The listing is expected to have a positive impact on the BNB price overall, as it is anticipated to increase demand for BNB used in transaction fees and reduce the circulating supply through users staking BNB.
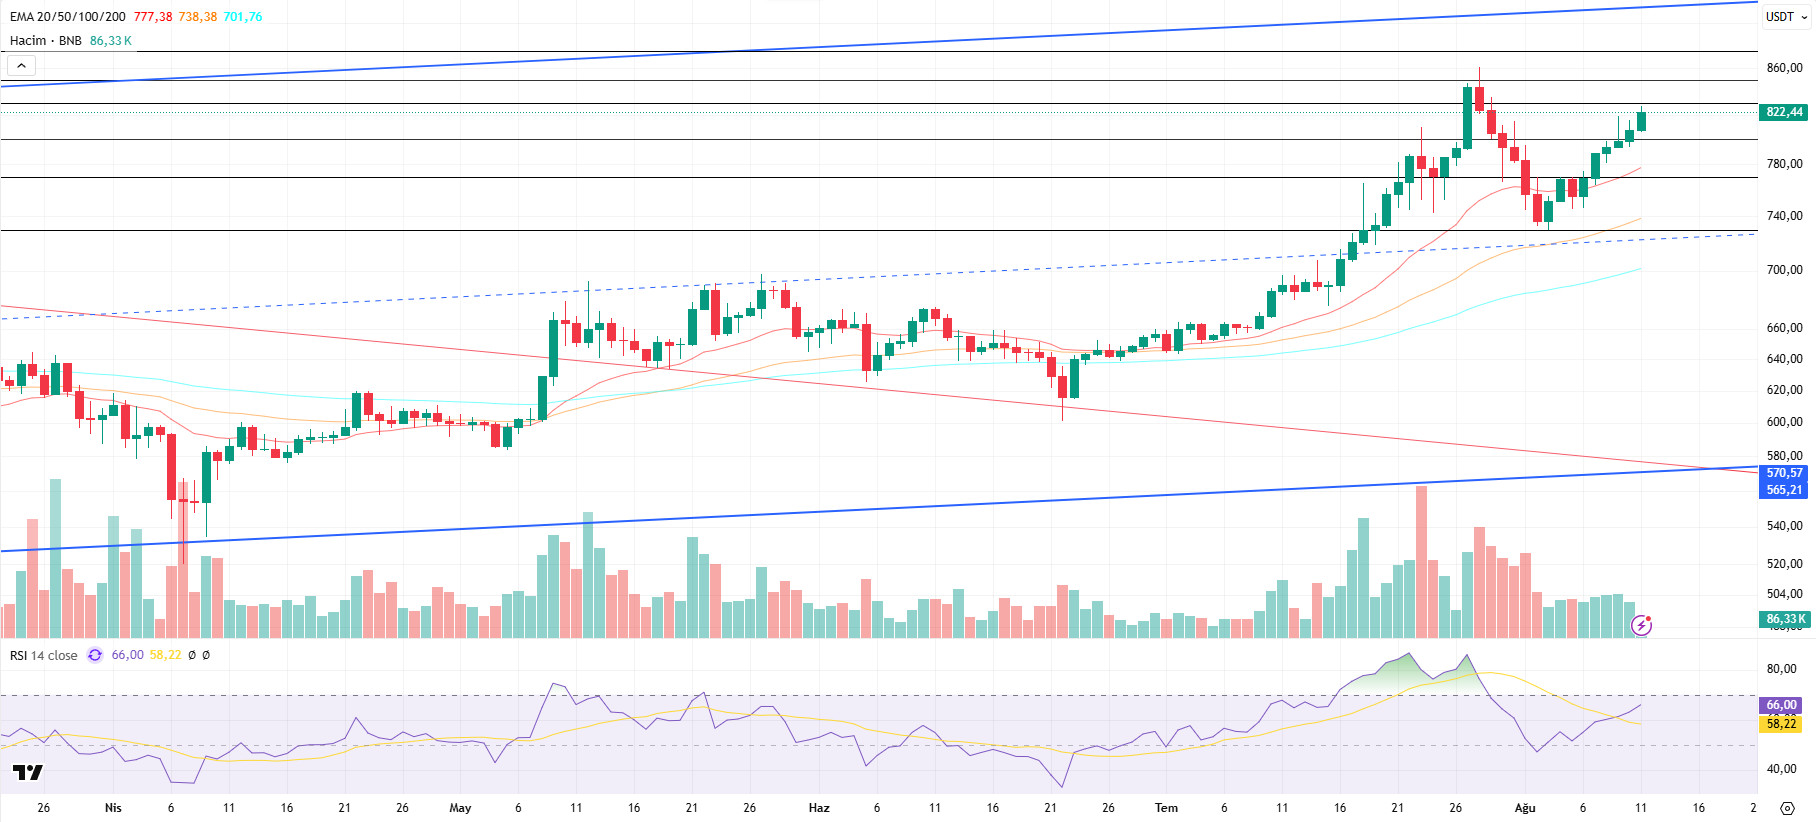
From a technical perspective, the general positive trend in the markets contributed to the rise in the BNB/USDT pair last week, pushing the price up to the $800 level. Entering the new week, BNB started positively, trading above the $800 level and showing an upward trend.
Currently trading in the $800-$830 range, technical indicators for the BNB/USDT pair show a positive trend in trading volume over the past week. This indicates increased buying appetite in the market. On the other hand, the Relative Strength Index (RSI) fell below the 50 level due to the recent pullback but rebounded to above the 50 level and the average with the recovery in the new week. This technical structure indicates an increase in positive trends in the short term.
Within the current technical outlook, if the positive momentum continues, the BNB price is expected to test the 830 dollar resistance level in the first stage. If this level is broken upward, the 850 and 875 dollar levels will emerge as the next strong resistance zones. On the other hand, if the 830 dollar level is not broken and selling pressure increases, the price may return to the 800 dollar support level. If this support is broken downward, the 770 and 730 dollar levels should be monitored as the next critical support points.
Supports levels: 800 – 770 – 730
Resistance levels: 830 – 850 – 875
SUI/USDT
The Sui (SUI) network kicked off the new week with both technological updates and the impact of balancing factors in supply dynamics. The recent increase in trading volume and the vibrancy of the developer community indicate that the Sui ecosystem is maintaining its growth momentum. The most notable development of the week was the official announcement by Swiss Sygnum Bank, a Swiss-based digital asset bank, of its integration with Sui. This strategic move provides institutional investors with access to SUI tokens within a fully regulated framework. The integration includes secure storage services, trading capabilities, and staking services planned to be launched soon. This ensures both security and ease of use at the institutional level. The growing interest of financial institutions in blockchain projects supports not only price dynamics but also the long-term sustainability of ecosystems. Sui’s partnership with a regulated and internationally recognized institution such as Sygnum Bank strengthens the network’s reliability and brand value. When all these factors come together, Sui is expected to continue its upward trend from both a technical and economic perspective. The acceleration of corporate adoption is likely to increase liquidity within the ecosystem, while technological updates are expected to support this growth by improving the network’s performance and user experience.
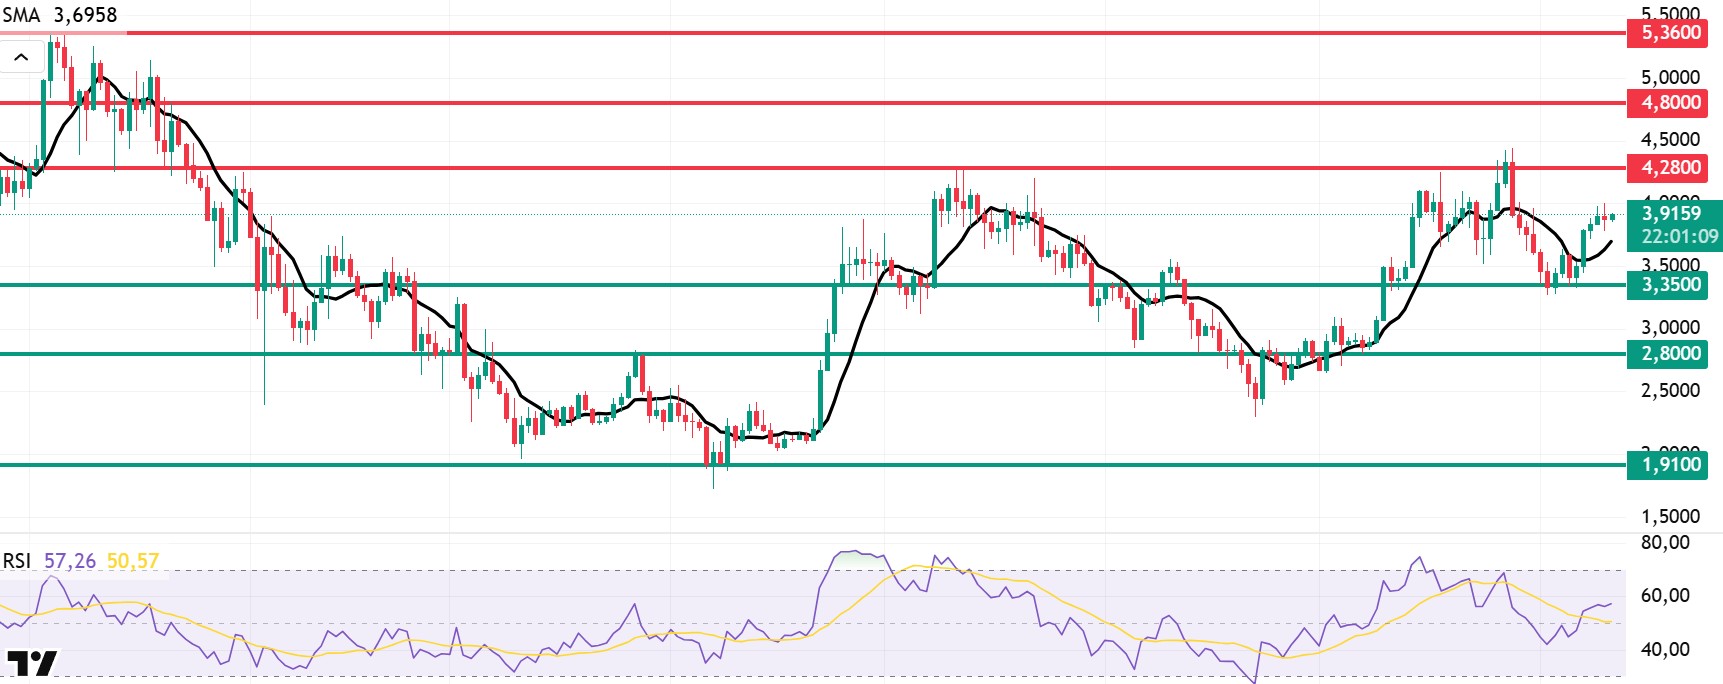
Looking at Sui’s technical outlook following recent developments, the price has declined on a weekly basis to around $3.91, influenced by fundamental developments. The Relative Strength Index (RSI) is currently in the 57.26–50.57 range. This value range indicates that the market is trading near the sell zone; a weakening RSI falling to the 35.00–40.00 range could signal a potential buy point. If the price moves upward, the resistance levels of 4.28, 4.80, and 5.36 dollars can be monitored. However, if the price retreats to new lows, it could indicate that selling pressure is intensifying. In this case, the 3.35 and 2.80 dollar levels stand out as strong support zones. Especially when considering the trend line, a pullback to 2.80 dollars is technically possible. According to Simple Moving Averages (SMA) data, the average price of Sui is currently at 3.69 dollars. If the price remains above this level, it indicates that the current upward trend could technically continue. The upward trend of the SMA also supports this scenario.
Niveles de soporte: 1,91 - 2,80 - 3,35
Niveles de resistencia: 4,28 - 4,80 - 5,36
ADA/USDT
The Cardano network saw significant developments this week. The Cardano core development team received community approval for a budget of 96 million ADA for projects such as Hydra and Acropolis. Input Output Global (IOG) submitted an offer worth 71 million dollars in ADA. The 12-month development plan focuses on improving scalability, developer experience, and interoperability. According to the governance action, the proposal was approved with 74% support. The funding will be milestone-based, and Intersect, a Cardano-member-based organization, will serve as an independent administrator. According to Input Output Global, payments will be released as upgrades are delivered, and audits will be conducted through smart contracts and a special committee. Among the key projects outlined in the proposal are Hydra, a protocol for fast and low-cost transactions, and Project Acropolis, which involves modularly restructuring the Cardano node to enhance flexibility and streamline the onboarding process for new core developers.
Looking at on-chain data, Cardano’s average transaction cost is currently 0.34 ADA, with an average block time of 20 seconds. Input Output Global aims to reduce RAM usage through performance improvements, lower operational costs for stake pool operators, and implement the technical foundations for seamless interoperability with more advanced smart contracts.
Technically speaking, the ADA price has gained approximately 11.96% since last week and continues its bullish trend. In the last 24 hours, ADA rose 0.24% to settle at approximately 61 on the Relative Strength Index (RSI), with signals pointing to positive momentum. The “Overtrading – Reverse Trading” zone indicated on the chart shows the price’s intense trading zones, where momentum is advancing within narrow ranges. These zones, which the price continuously tests, indicate the intensity of trading frequency on the weekly chart and are the zones where the price shows downward and upward trends. This week, ADA’s price is consolidating in the $0.8200–$0.8400 range, with the $0.6237–$0.5159 level emerging as a support zone in a potential downturn scenario, while the $0.9414–$0.9868 range is attracting attention as a resistance zone.
Support levels: 0.7072 – 0.6237 – 0.5115
Resistance levels: 0.9414 – 0.9868 – 1.1122
Aviso legal
La información sobre inversiones, los comentarios y las recomendaciones contenidas en este documento no constituyen servicios de asesoramiento en materia de inversiones. Los servicios de asesoramiento en materia de inversión son prestados por instituciones autorizadas a título personal, teniendo en cuenta las preferencias de riesgo y rentabilidad de los particulares. Los comentarios y recomendaciones contenidos en este documento son de carácter general. Estas recomendaciones pueden no ser adecuadas para su situación financiera y sus preferencias de riesgo y rentabilidad. Por lo tanto, tomar una decisión de inversión basándose únicamente en la información contenida en este documento puede no dar lugar a resultados que se ajusten a sus expectativas.

