
Weekly Bitcoin Onchain Report
Active Addresses
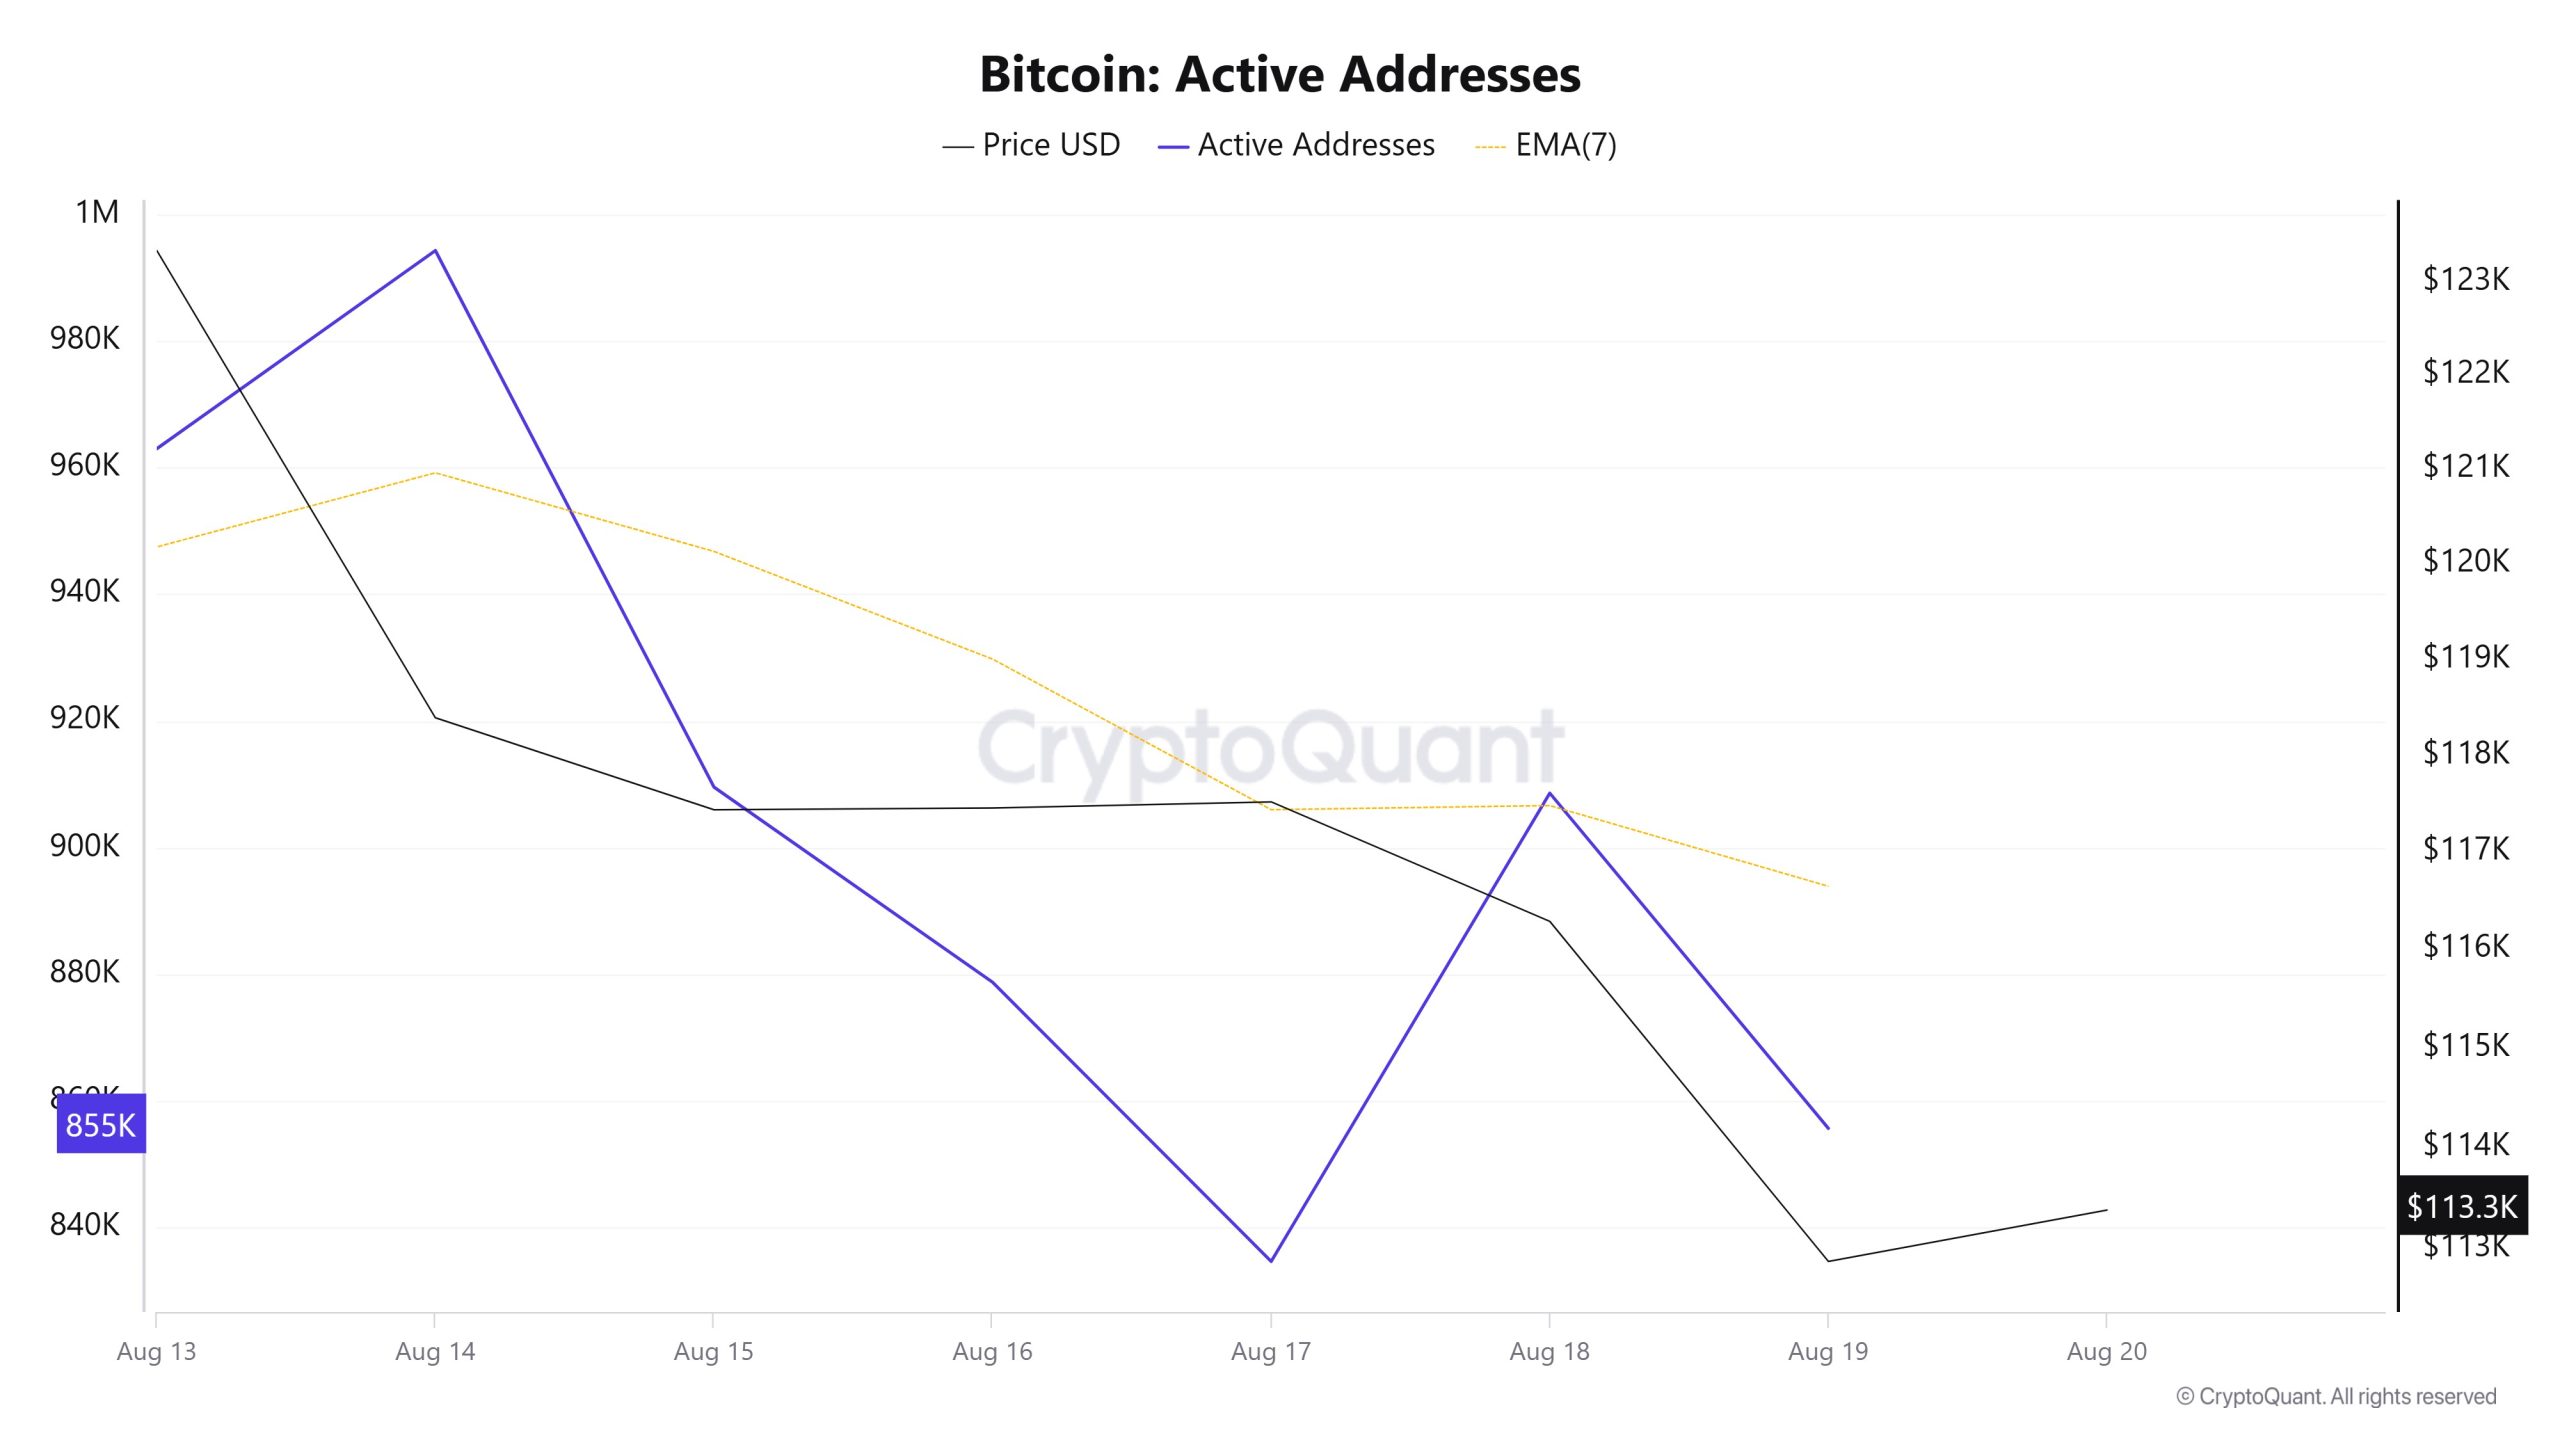
Between August 13 and August 20, there were 994,288 active addresses el the Bitcoin network. During this period, the price of Bitcoin rose to $123,000. In particular, the decline en the number of active addresses el August 17 caused the price to fall to $117,000. From a technical perspective, the downward movement observed at the point where the 7-day simple moving average (SMA) crossed the price el August 7 is noteworthy. This technical signal indicates that there is selling pressure en the market.
Active Sending Addresses
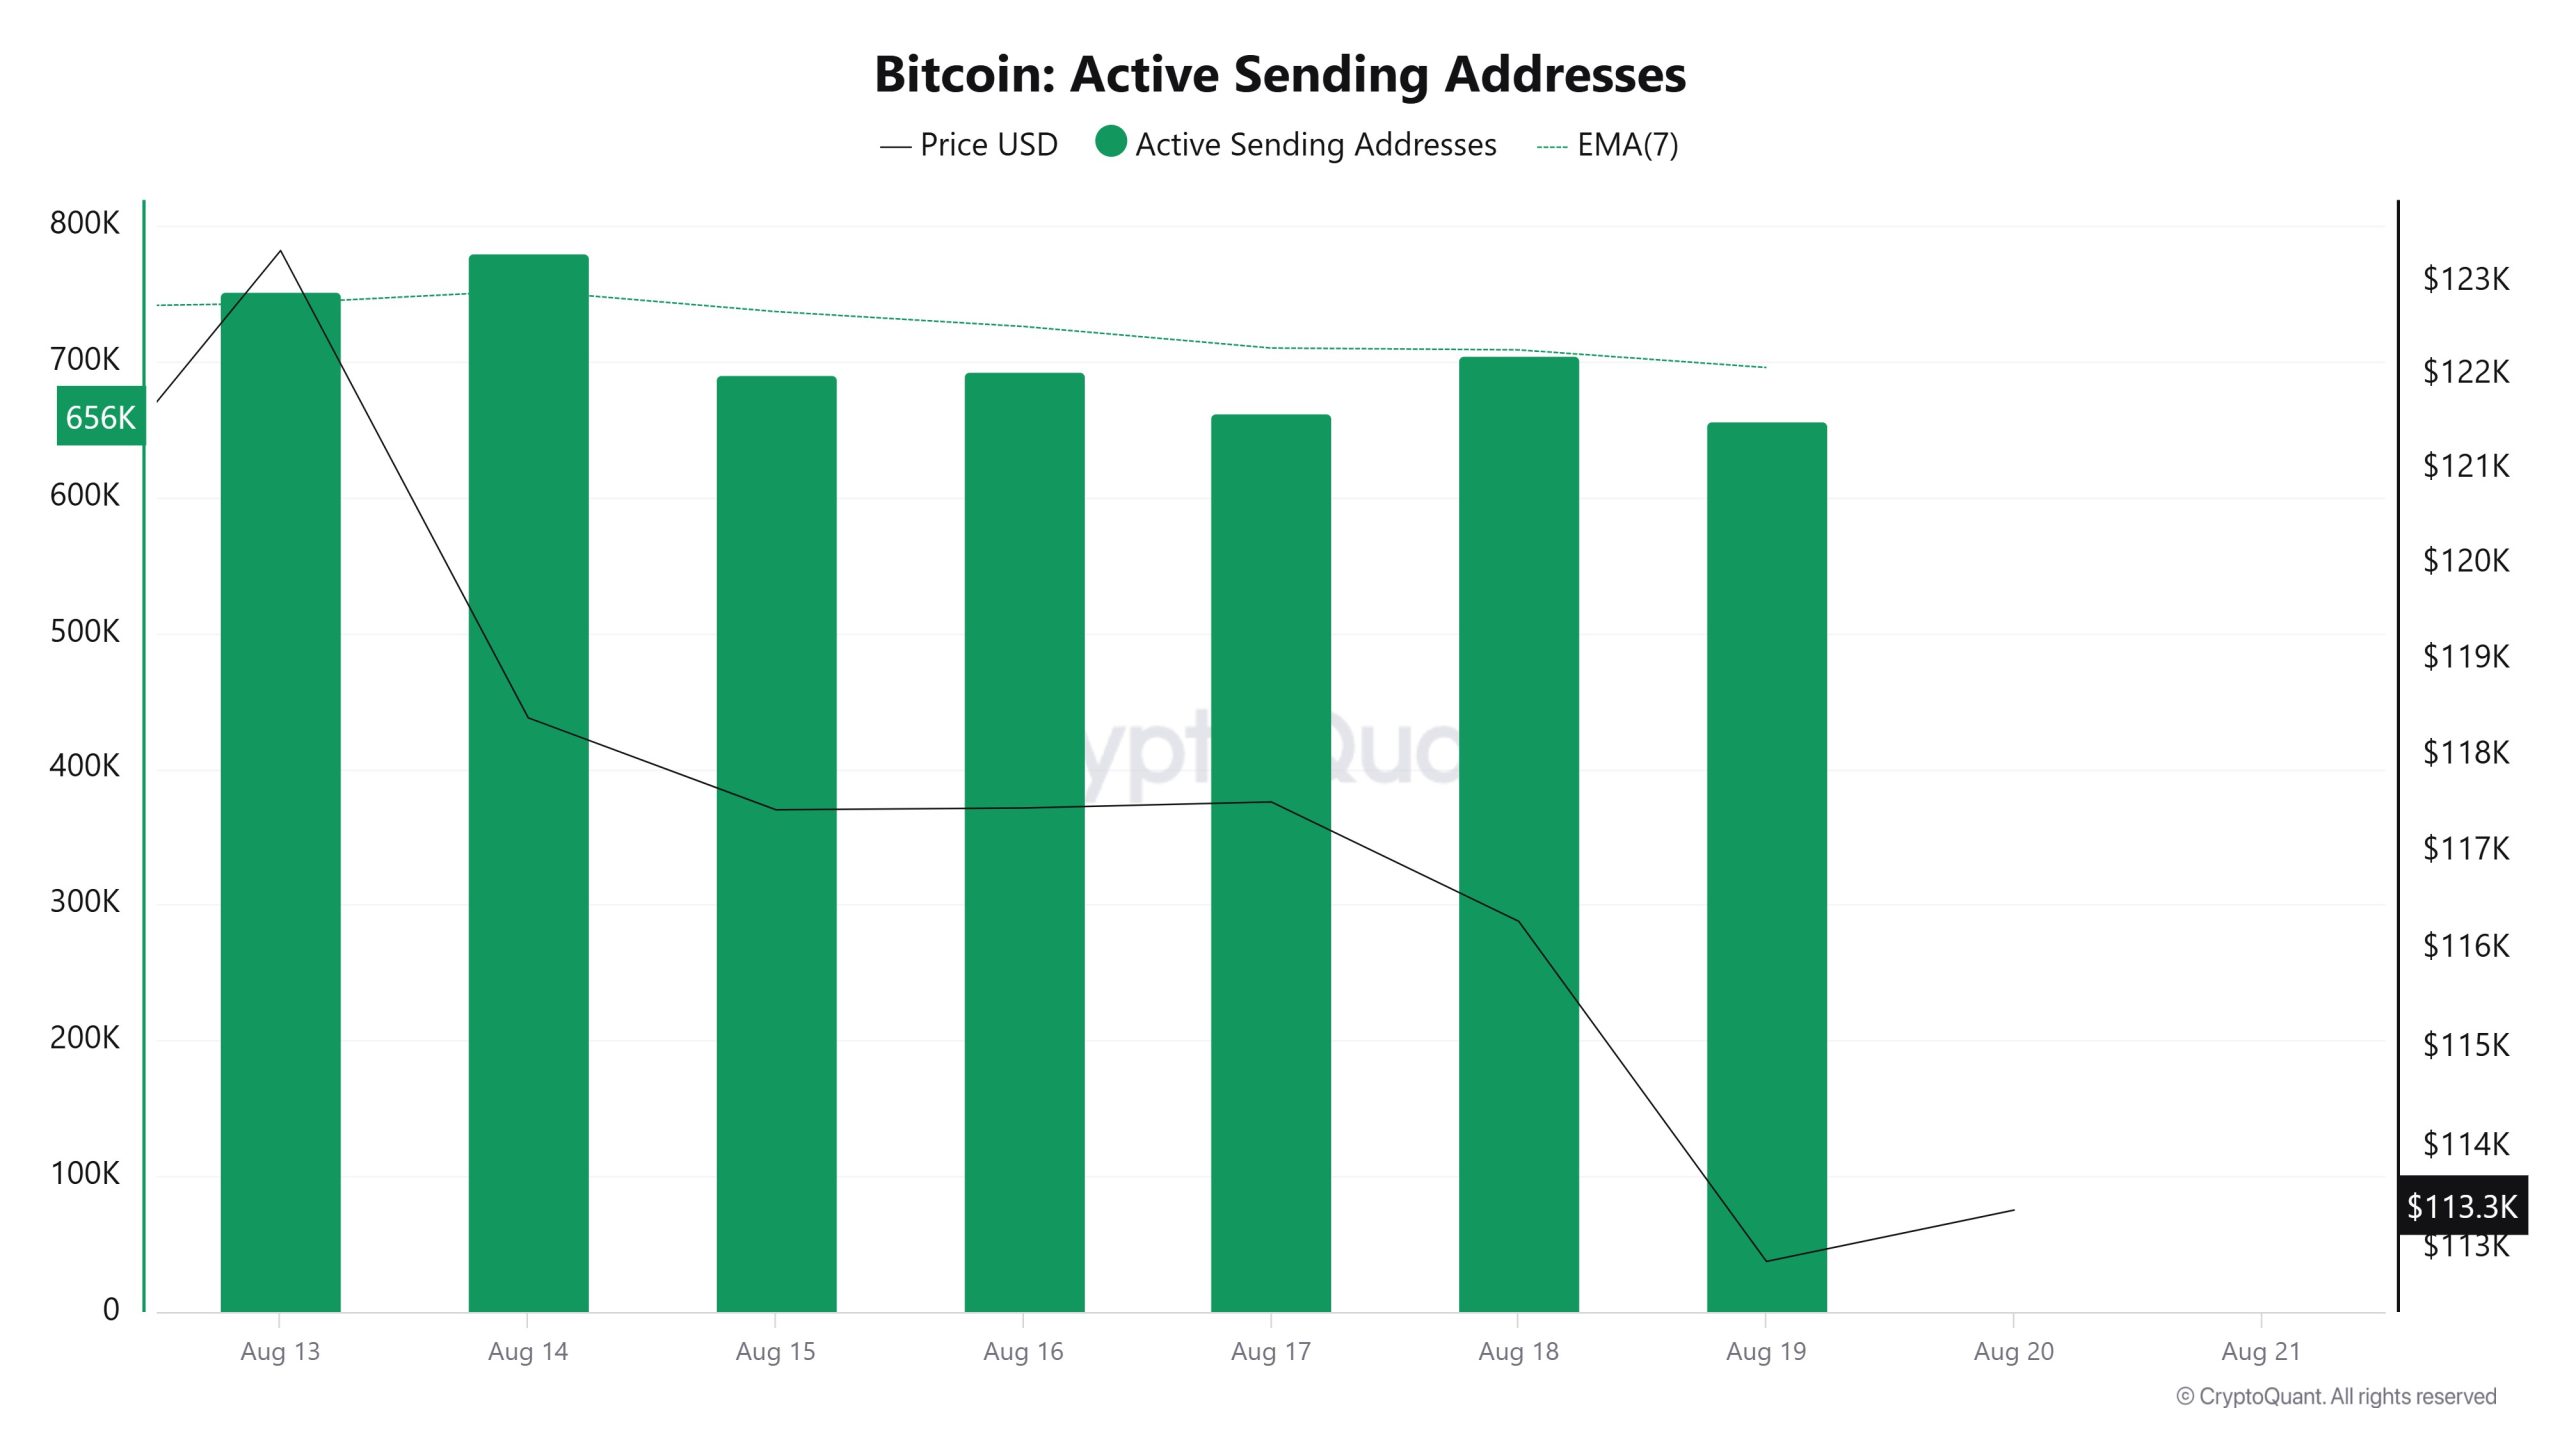
Between August 13 and August 20, an upward trend was observed en the “active sending addresses” metric. On the day the price reached its highest level, this metric stood at 752,461, indicating that user activity el the Bitcoin network was moving en parallel with the price. This data indicates that the $123,000 level is supported not only por price-based factors but also por el-chain address activity. Overall, the Active Sending Addresses metric followed a downward trend during this period.
Active Receiving Addresses
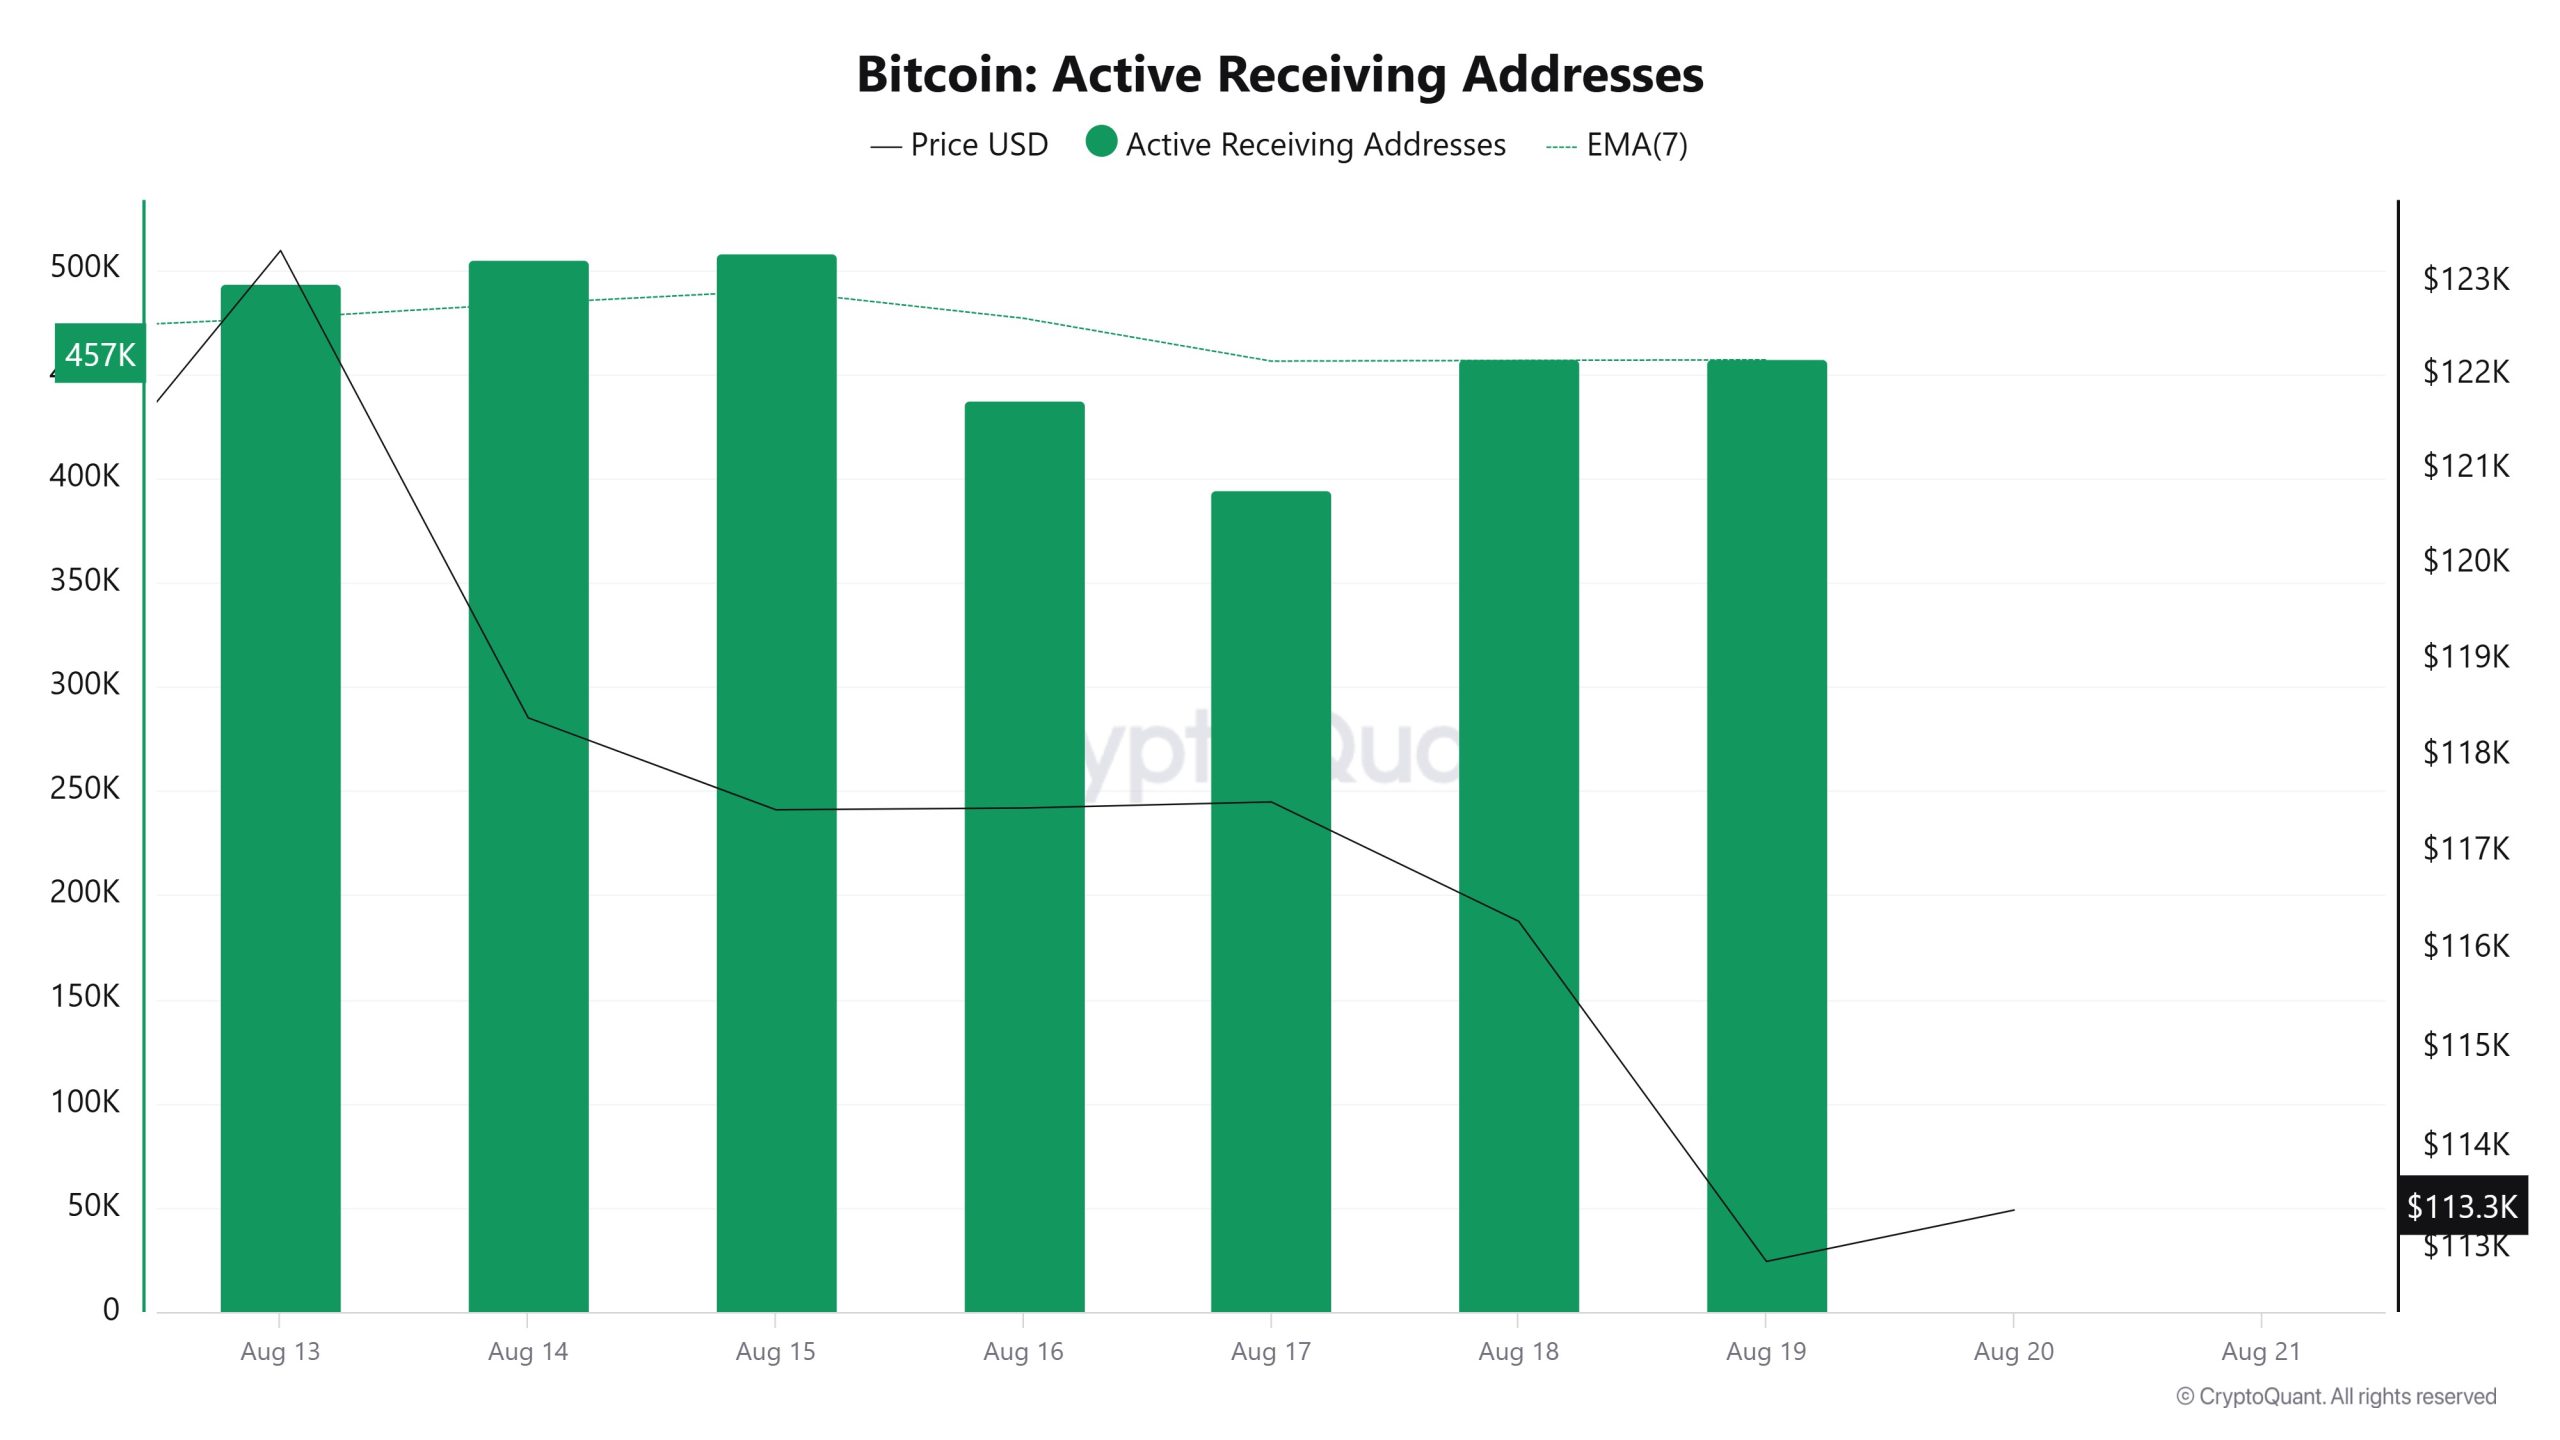
Between August 13 and August 20, a normal decline was observed en active receiving addresses along with the Black Line (price line). On the day the price reached its peak, active receiving addresses dropped to 493,302, indicating that buyers sold Bitcoin at around 123,000 dollars.
Breakdowns
MVRV
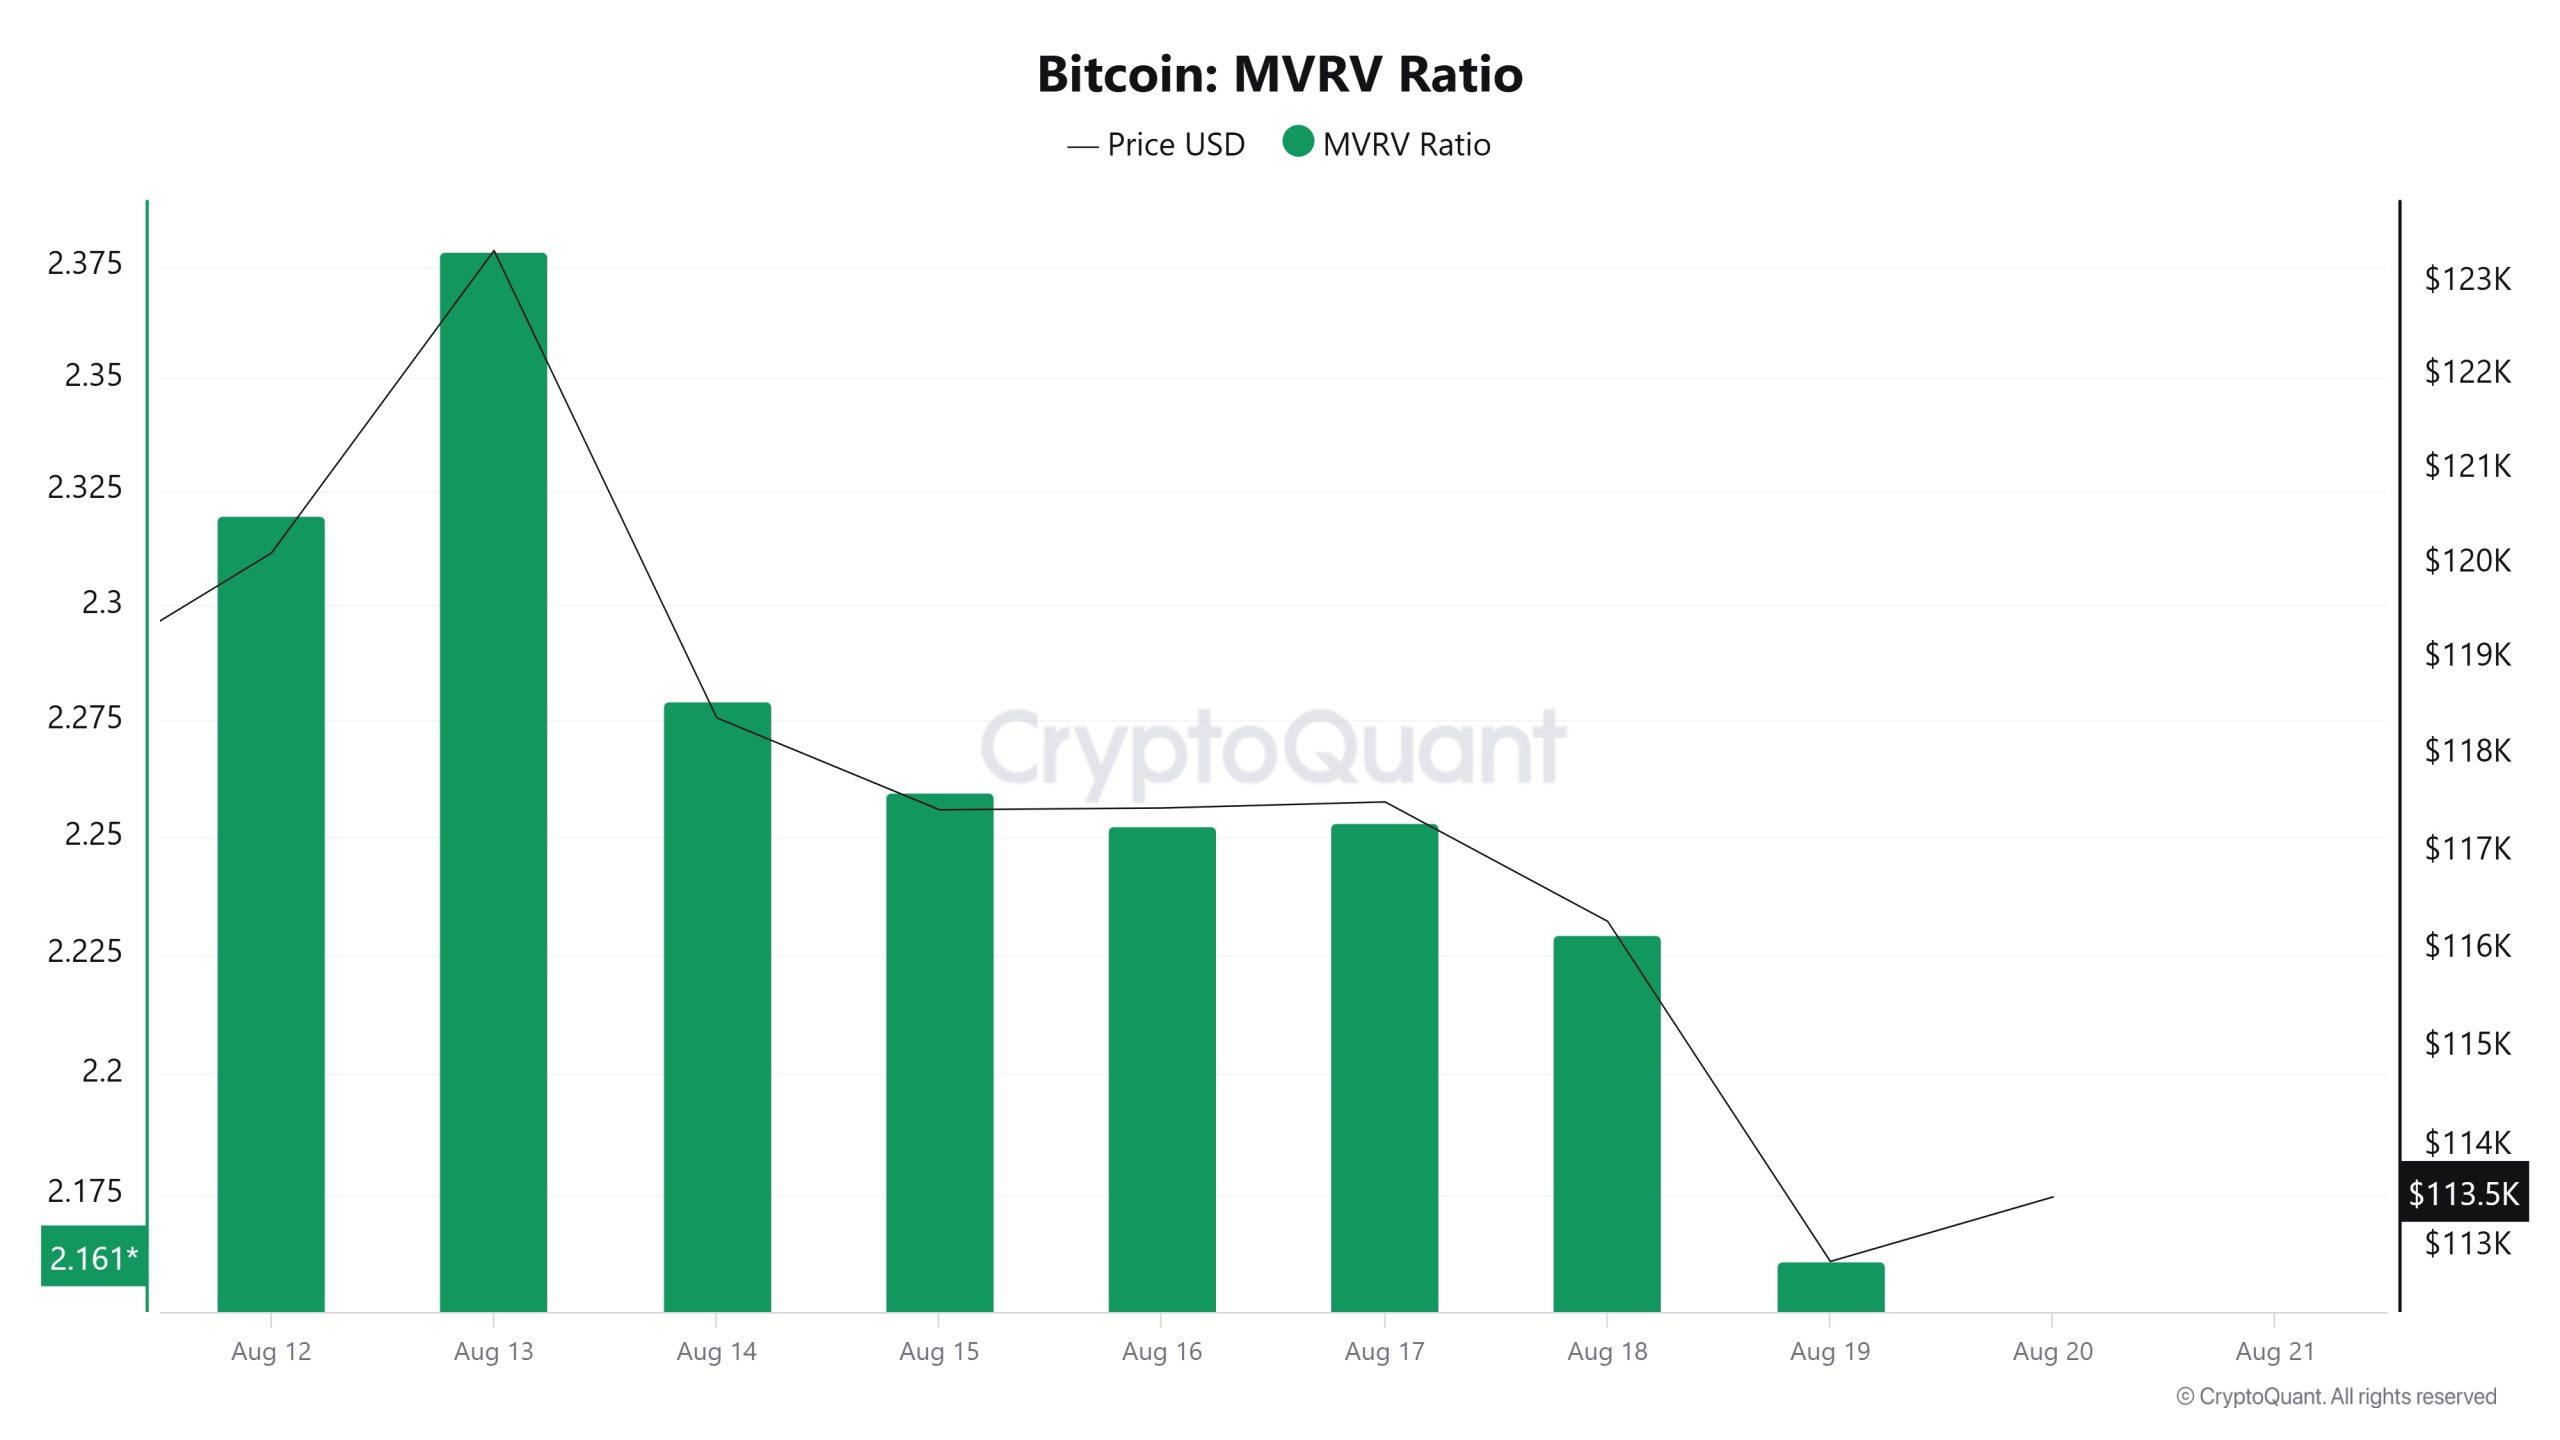
On August 13, when the Bitcoin price was at 123,345, the MVRV Ratio was at 2.378. As of August 19, the Bitcoin price dropped to 112,860, marking an 8.50% decline, while the MVRV Ratio fell to 2.161, recording a 9.13% decrease.
Realized Price
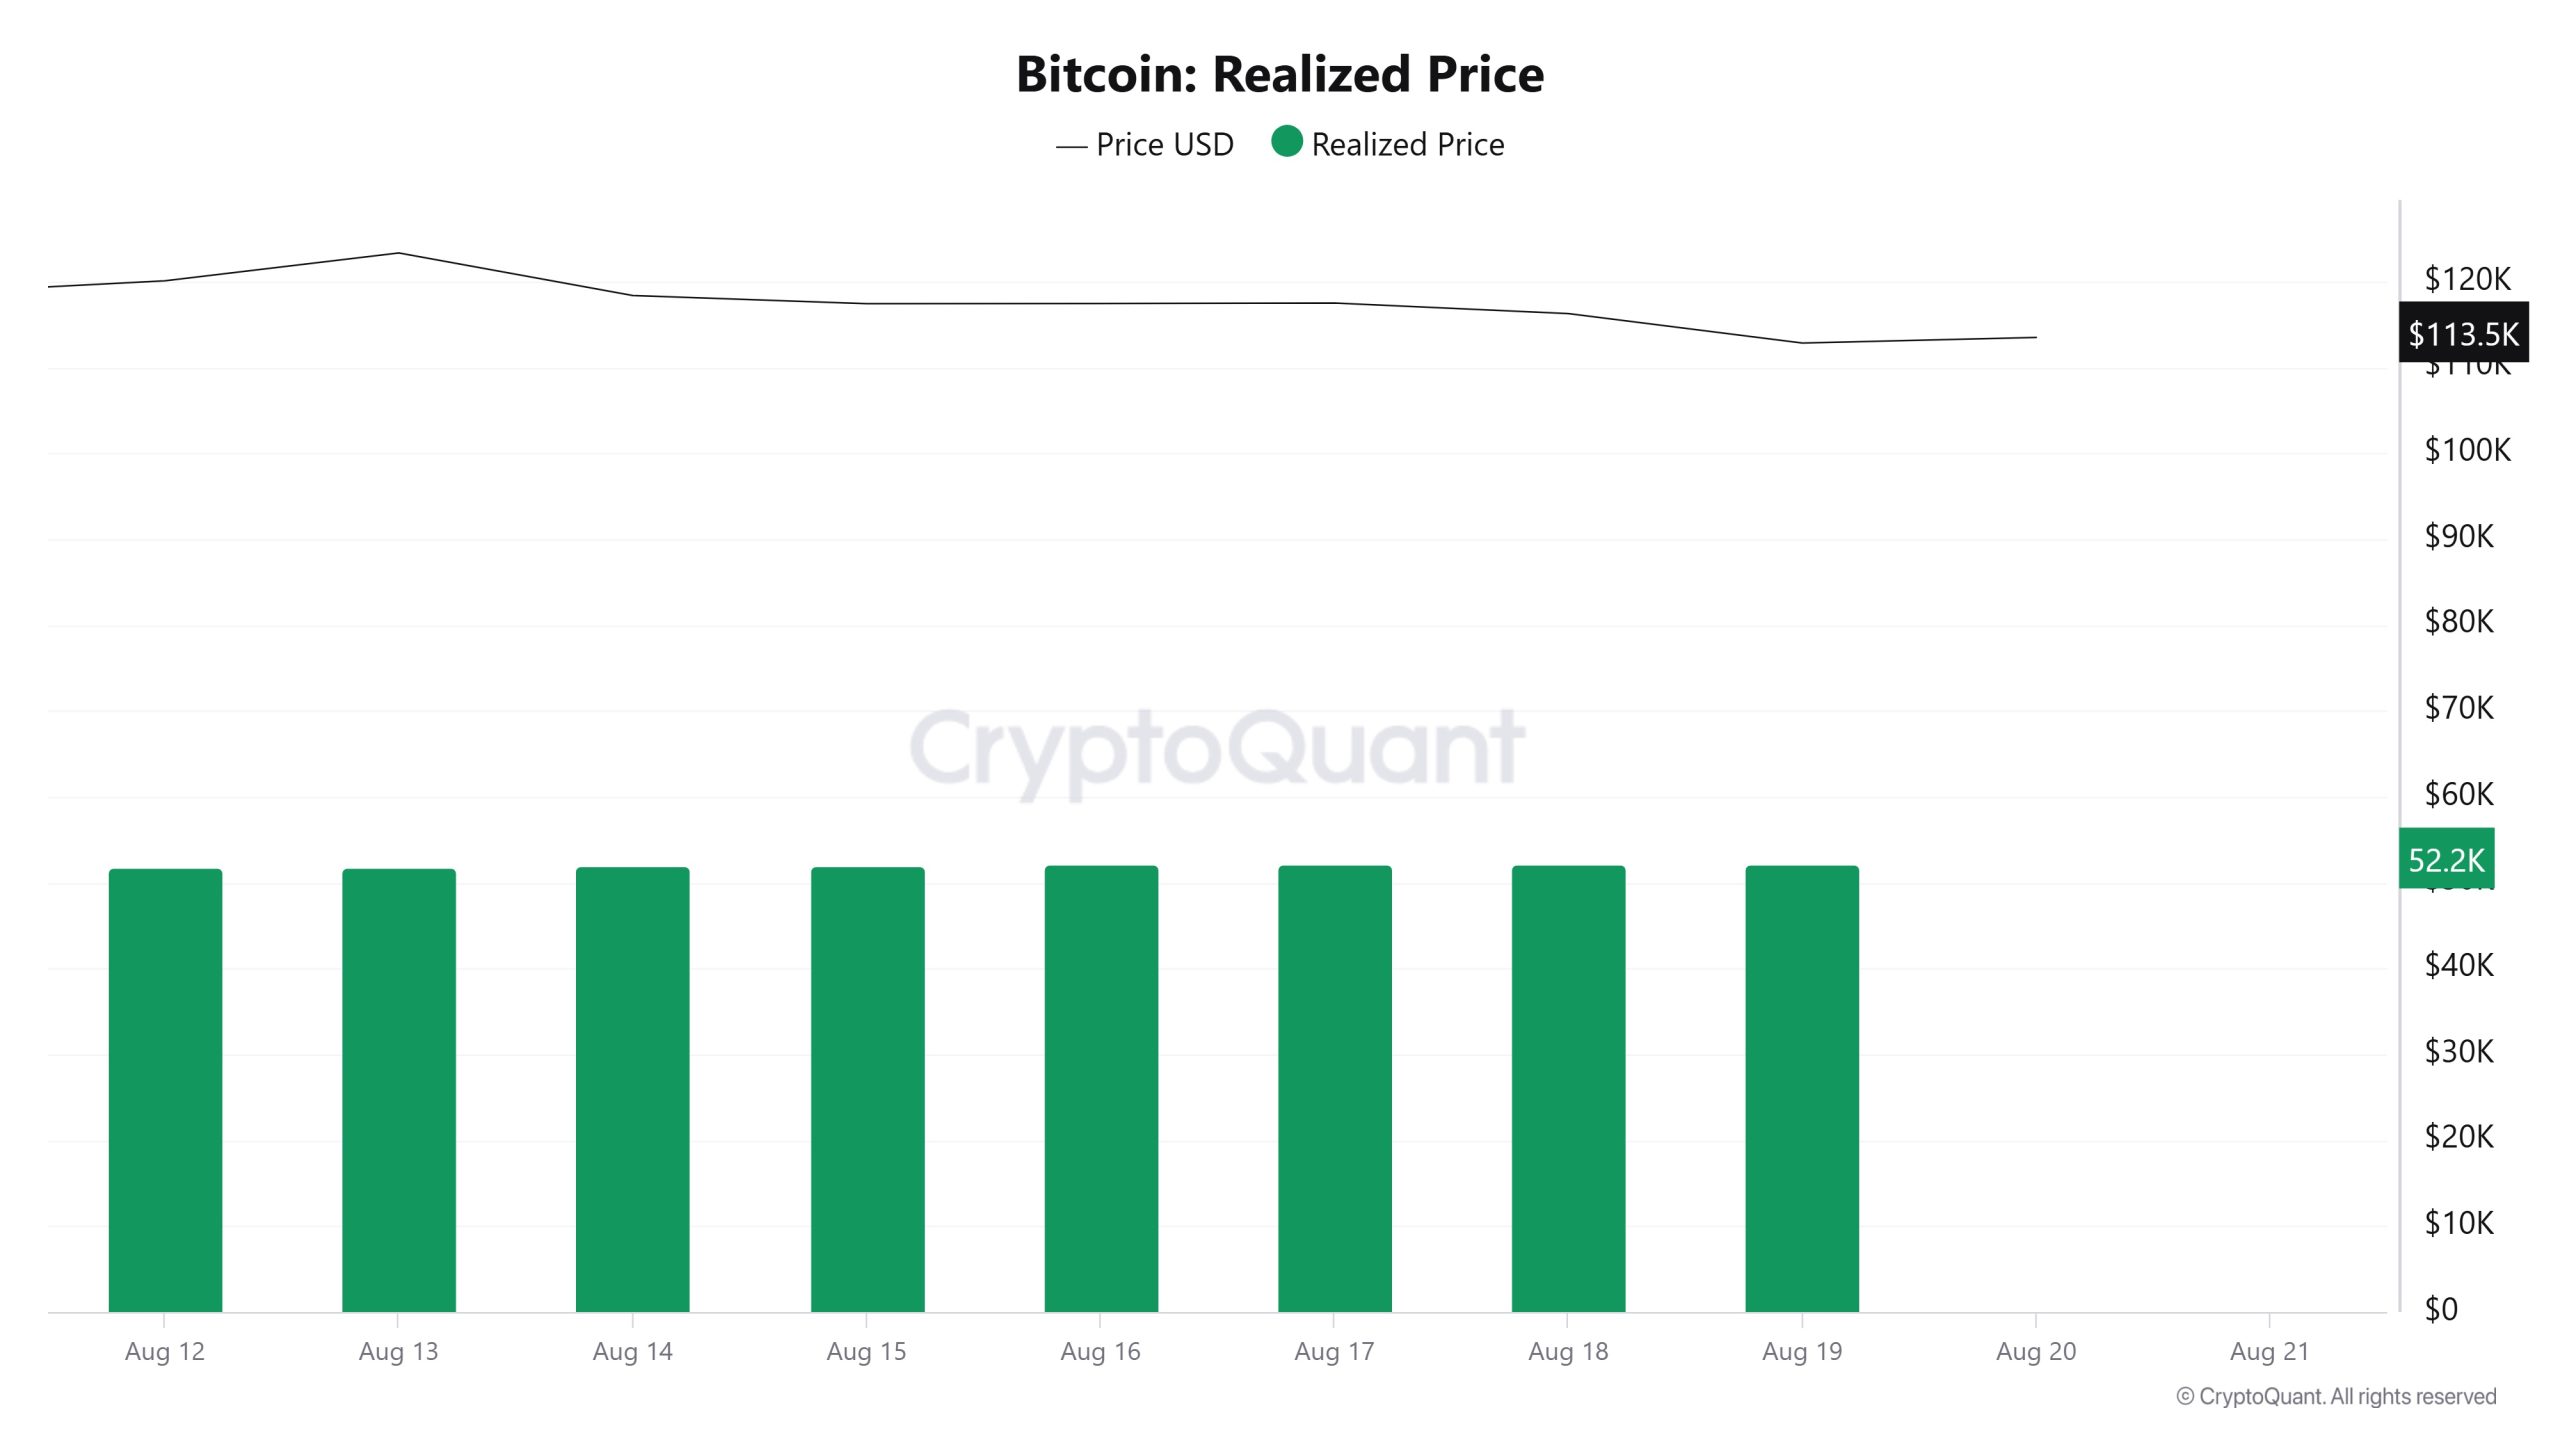
On August 13, when the Bitcoin price was at 123,345, the Realized Price was at 51,856. As of August 19, the Bitcoin price dropped to 112,860, recording an 8.50% decrease, while the Realized Price rose to 52,219, recording a 0.70% increase.
Spent Output Profit Ratio (SOPR)
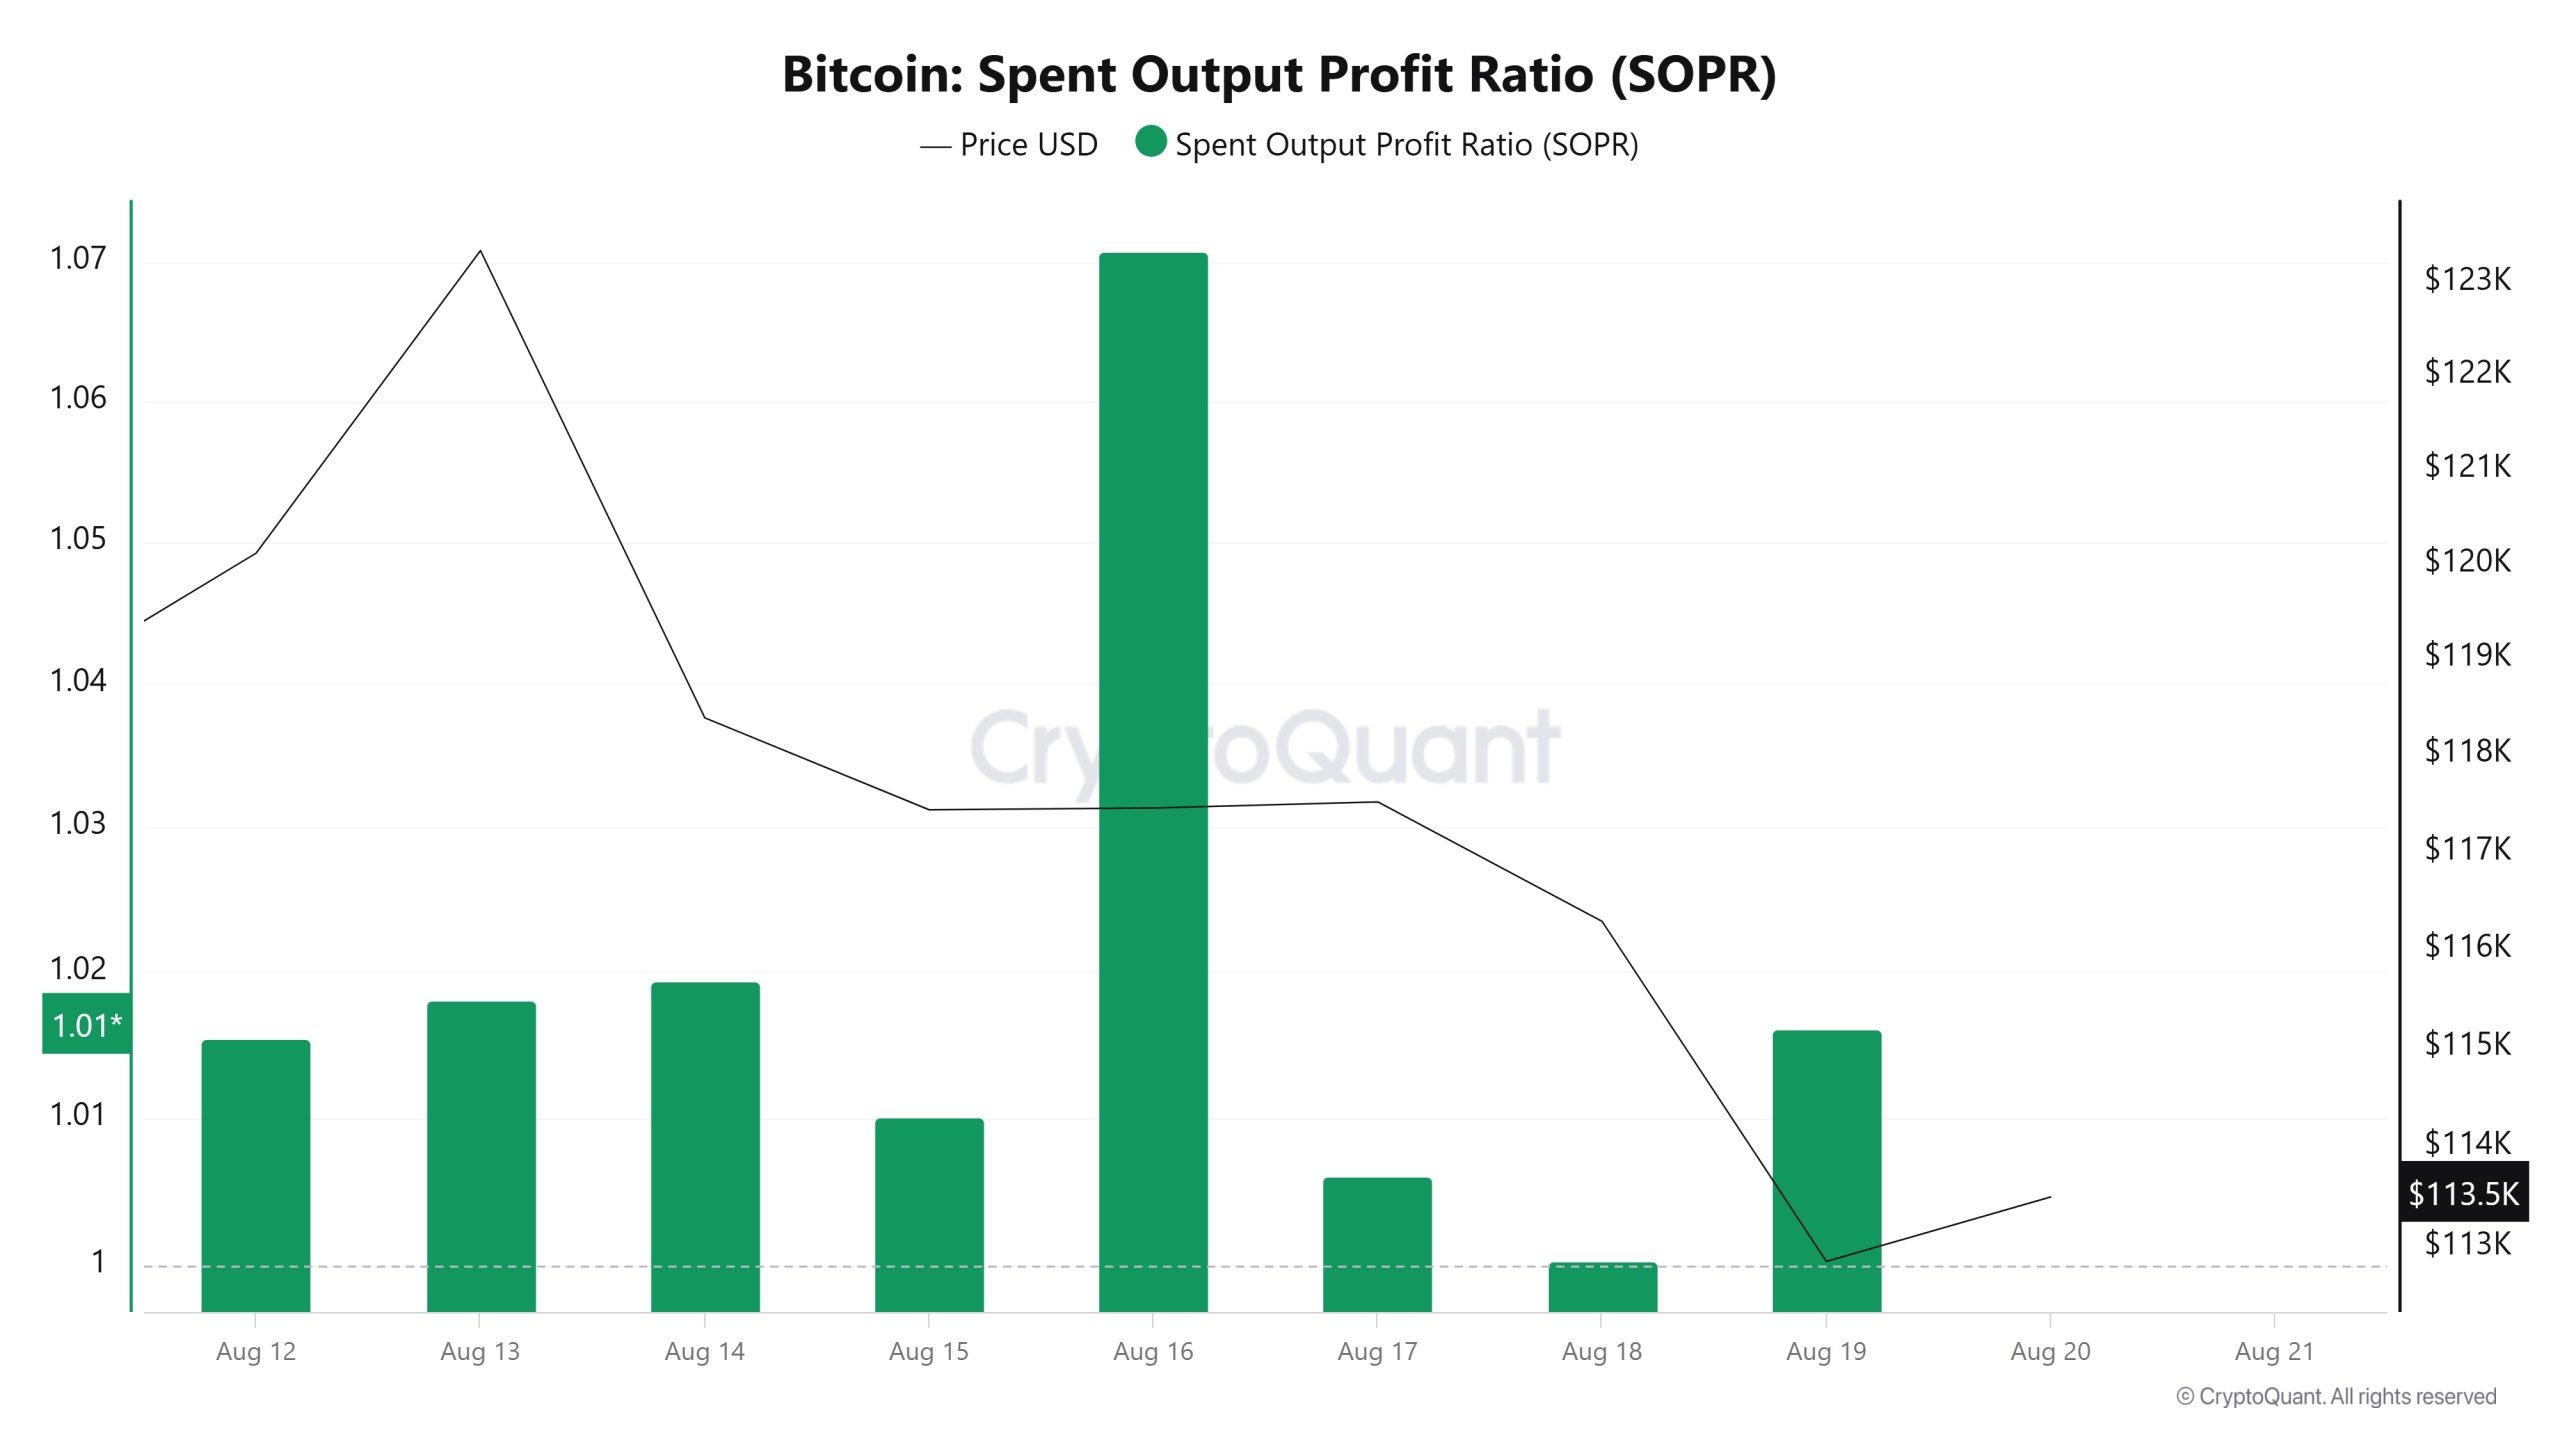
On August 13, when the Bitcoin price was at 123,345, the SOPR metric was at 1.018. As of August 19, the Bitcoin price dropped to 112,860, marking an 8.50% decrease, while the SOPR metric fell to 1.016, recording a 0.20% decrease.
Derivatives
Open Interest
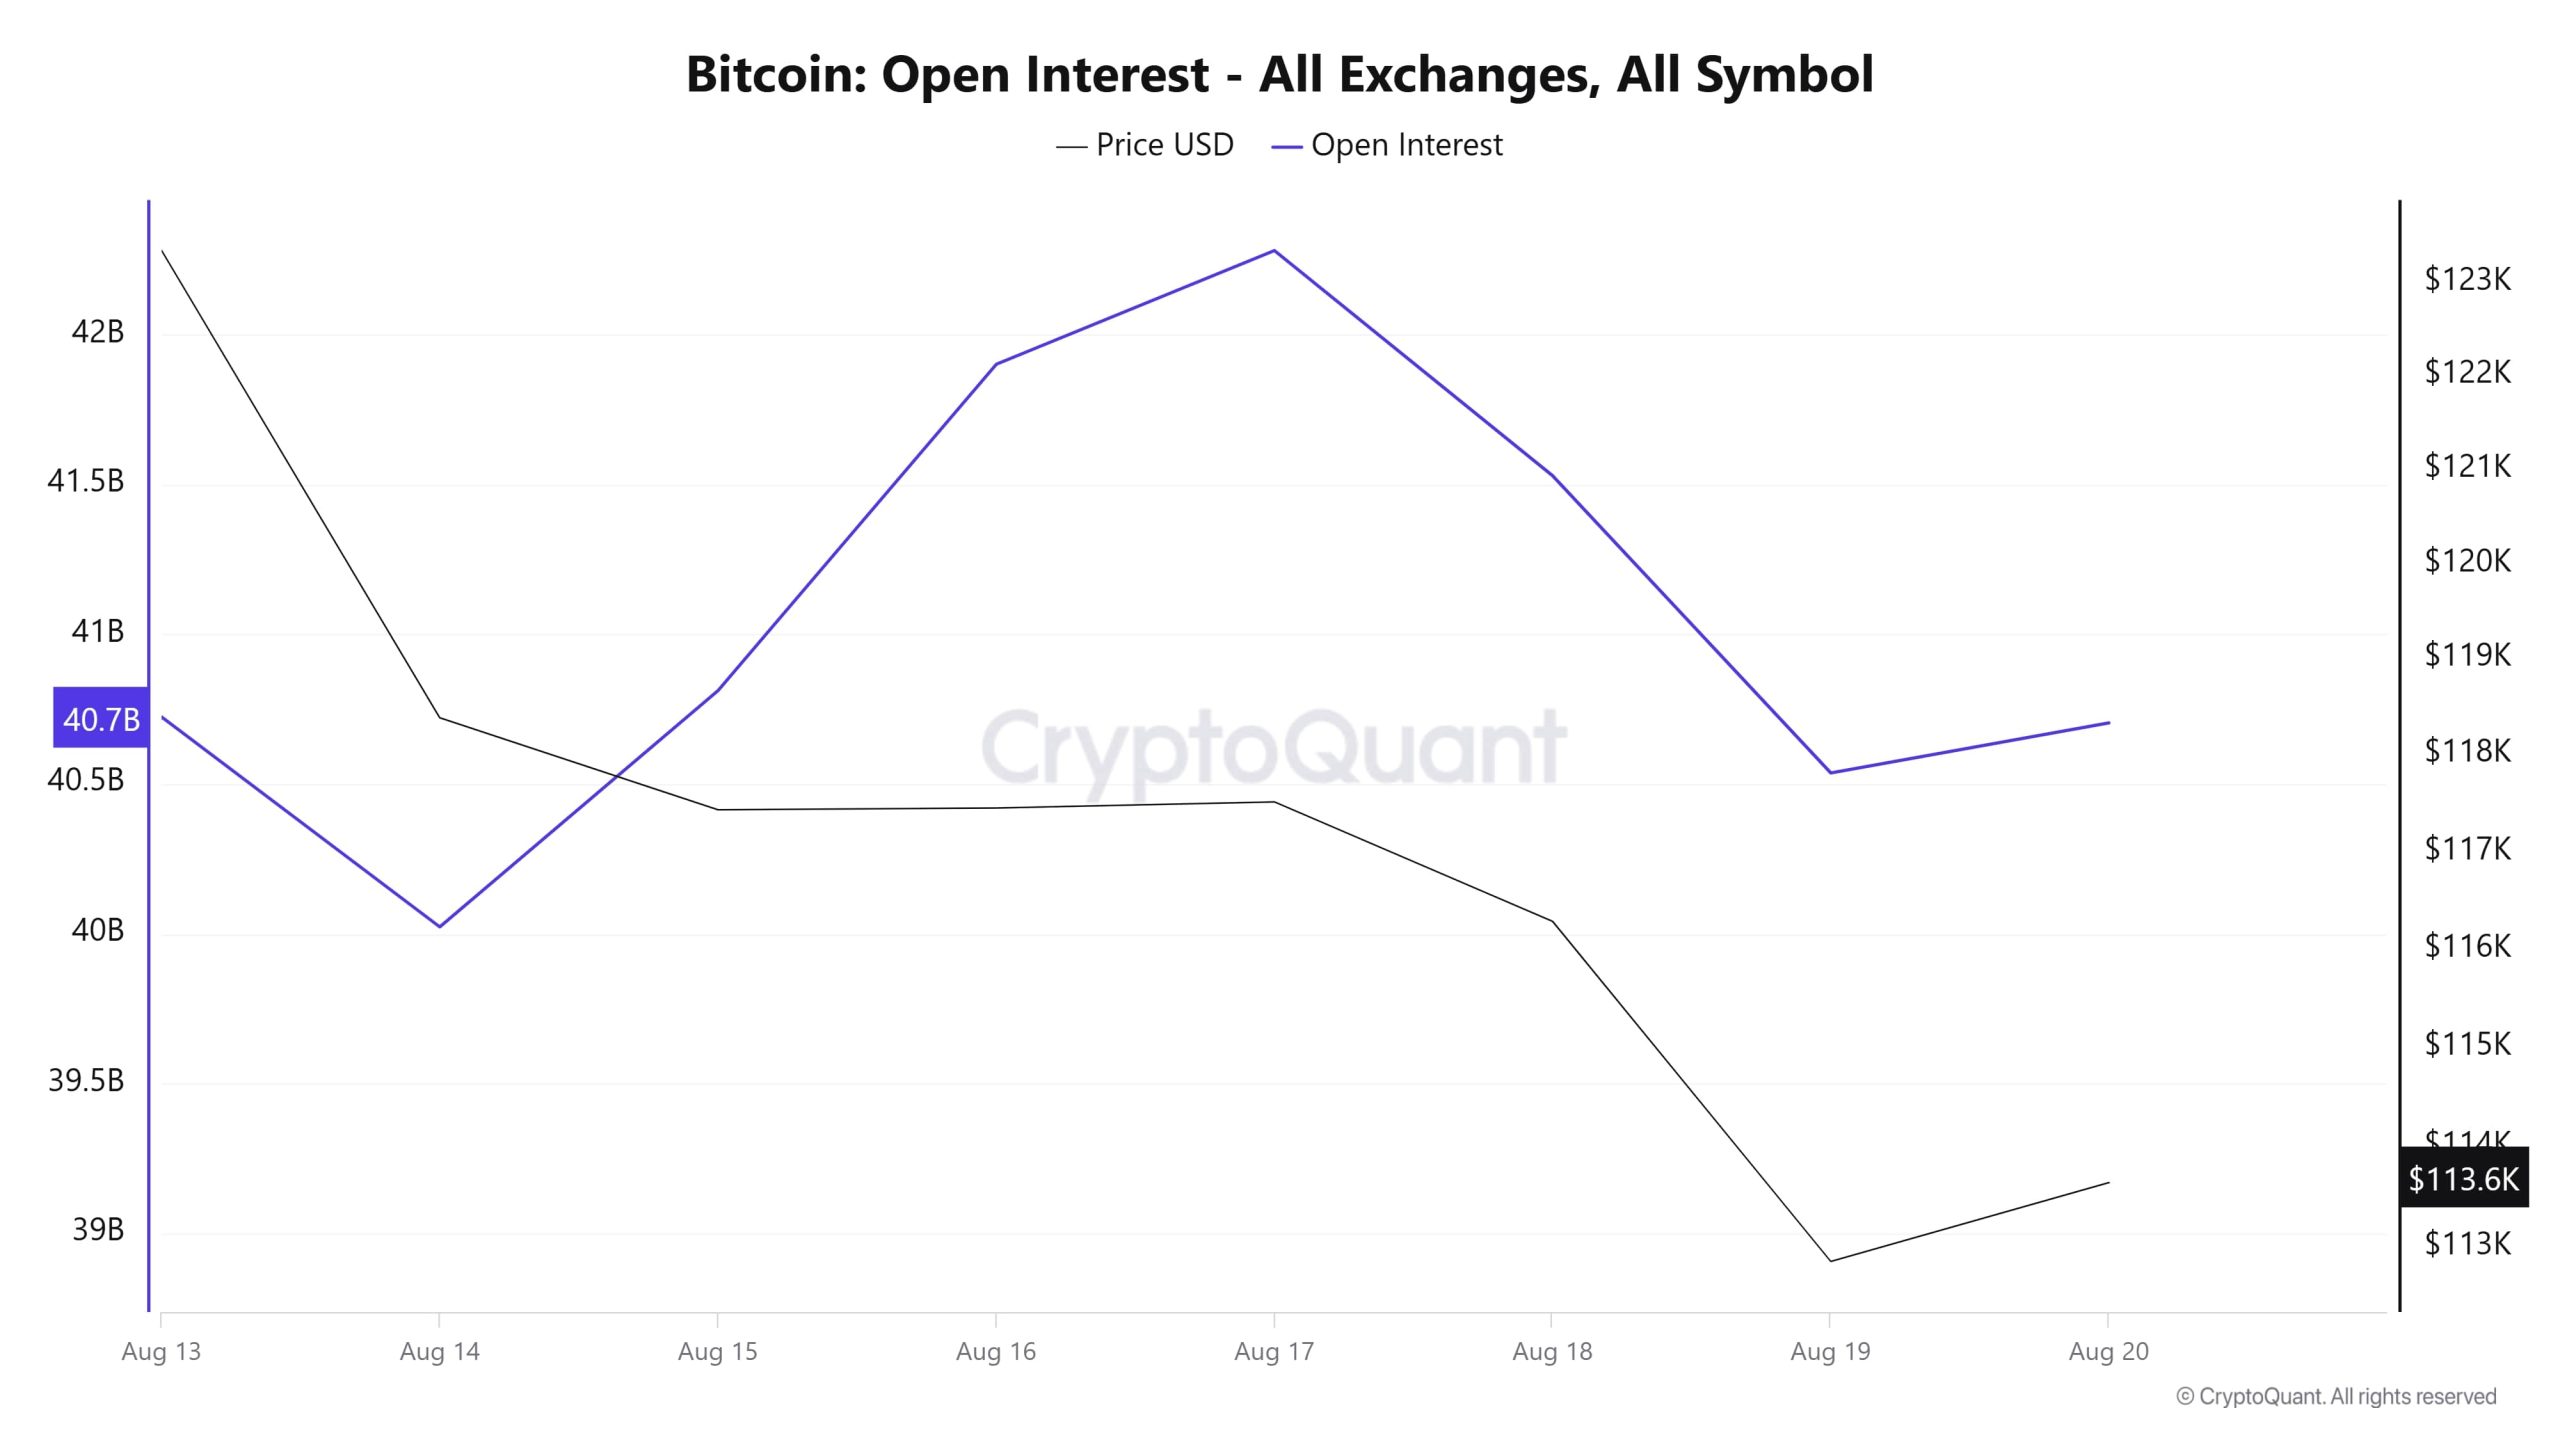
Initially, the price of Bitcoin was around $122,000, while the open interest of was at a high level of approximately $40.7 billion. On August 14, both price and open interest begin to decline; the price drops below approximately 118,000 dollars, while open interest falls to around 40 billion dollars. From this point onward, a divergence begins to emerge between the two metrics.
Between August 16 and 17, open interest increased to $42.3 billion. Despite this, the price remained flat and showed only a very limited reaction. This situation may indicate that positions en the market are increasing but the price is not following suit, meaning that risk is accumulating en leveraged trades. Starting from August 18, both price and open interest experience a sharp decline. In particular, the price drops to the 113-114 thousand dollar range. This decline may indicate that the increased positions are being closed through liquidations or that investors are rapidly reducing their positions.
In general, the chart shows a clear mismatch between price and open interest en the short term, with positions increasing during the period when prices remained flat and eventually beginning to unwind with the decline. This can be interpreted as market participants taking el excessive risk, resulting en price pressure.
3.2. Funding Rate
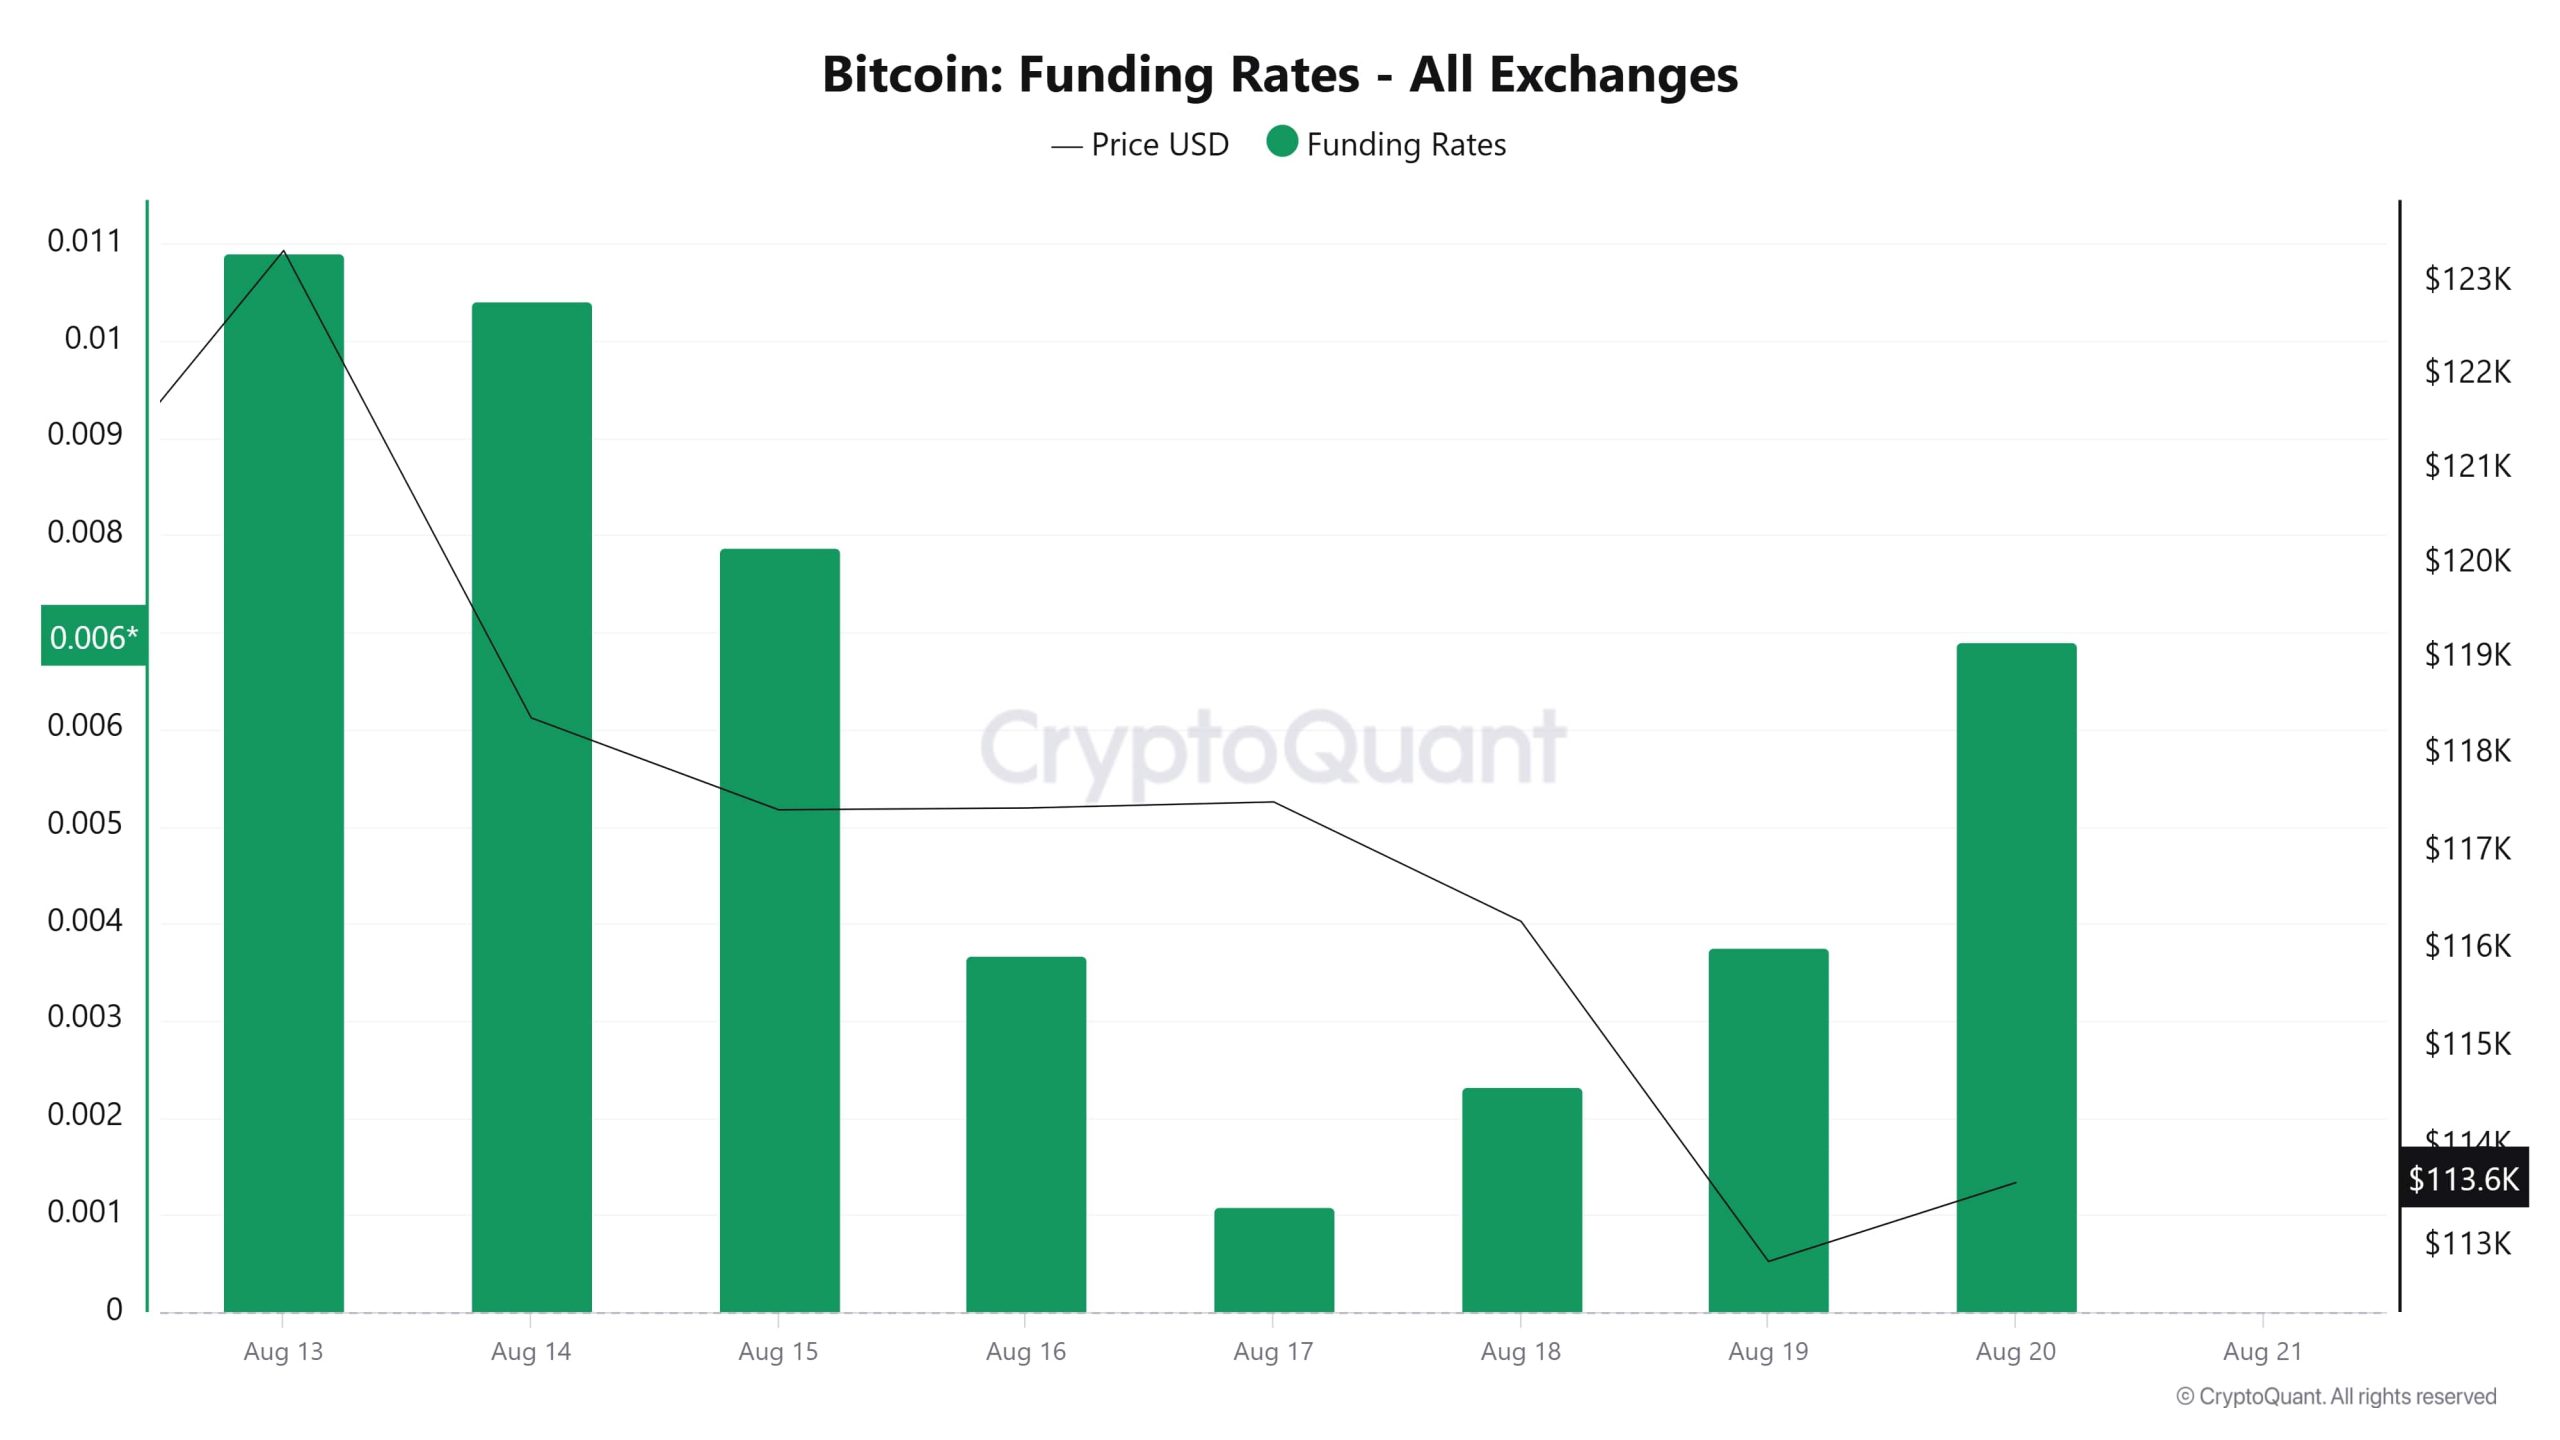
On August 13-14, funding rates were observed to be at quite high levels. This indicates that long positions were prevalent en the market, while the price peaked at around $122-123 thousand during the same period. However, funding rates gradually declined thereafter and approached zero por August 17, signaling that the market had stabilized.
Along with this decline, there were also sharp downward movements en prices. Especially el August 18-19, both prices fell and funding rates dropped to very low levels. This scenario suggests that long positions were liquidated and investors began to adopt a more cautious approach.
On August 20, the funding rate began to rise again. However, the price did not follow this upward trend and remained en the $113-114,000 range. This situation indicates that there is an increasing tendency to open long positions en the market, but the price has not yet responded to this. In general, it can be said that after periods of extremely high funding rates, the price tends to weaken, while when rates begin to decline, market pressure increases.
Long & Short Liquidations
Last week, the BTC price rose to an all-time high (ATH) of $124,474 before experiencing a sharp decline and falling back to around $112,500. At the same time, $445 million worth of long positions were liquidated, while $229 million worth of short positions were also liquidated.
| Date | Long Volume ($M) | Short Volume ($M) |
|---|---|---|
| August 13 | 15.29 | 122.28 |
| August 14 | 160.92 | 73.45 |
| August 15 | 37.39 | 6.82 |
| August 16 | 1.80 | 0.90 |
| August 17 | 11.92 | 8.83 |
| August 18 | 89.11 | 12.76 |
| August 19 | 129.24 | 4.80 |
| Total | 445.67 | 229.84 |
Supply Distribution
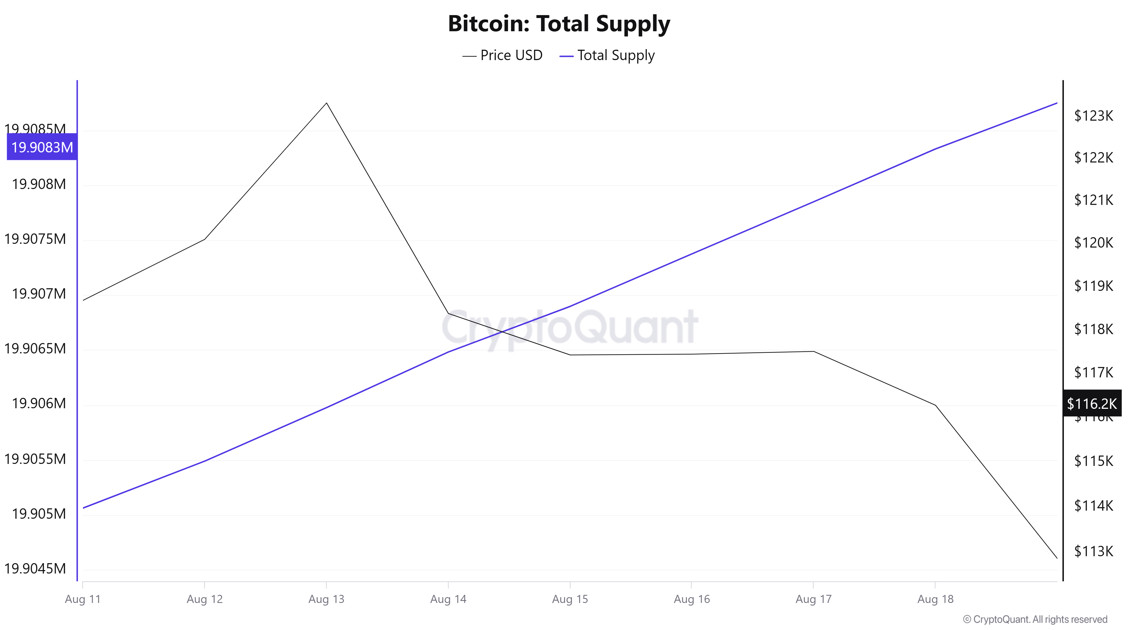
Total Supply: Increased por approximately 0.0164% compared to last week, reaching 19,905,061 units.
New Supply: The amount of BTC produced this week was 3,272.
Velocity: The velocity, which was 12.48 last week, has decreased to 12.45 as of August 18.
| Wallet Categoría | 11-Aug-2025 (%) | 18-Aug-2025 (%) | Change (%) |
|---|---|---|---|
| < 1 BTC | 8.4626 | 8.4533 | -0.11 |
| 1 – 10 BTC | 11.3872 | 11.3890 | +0.02 |
| 10 – 100 BTC | 24.6512 | 24.5804 | -0.29 |
| 100 – 1k BTC | 29.4564 | 29.4620 | +0.02 |
| 1k – 10k BTC | 18.2239 | 18.1395 | -0.46 |
| 10k+ BTC | 7.8182 | 7.9754 | +2.01 |
According to the latest weekly data, the Bitcoin wallet distribution shows a balanced but mixed picture. Wallets holding less than 1 BTC experienced a limited decline of 0.11%, while wallets en the 1–10 BTC range saw a small increase of 0.02%. The category representing larger investors, those holding 10–100 BTC, saw a 0.29% decline, while wallets en the 100–1,000 BTC range experienced a limited 0.02% increase. Wallets en the 1,000–10,000 BTC group saw a 0.46% decrease, while wallets en the 10,000 BTC+ category, representing the largest group of ” ” investors, recorded a notable 2.01% increase.
Exchange Supply Ratio
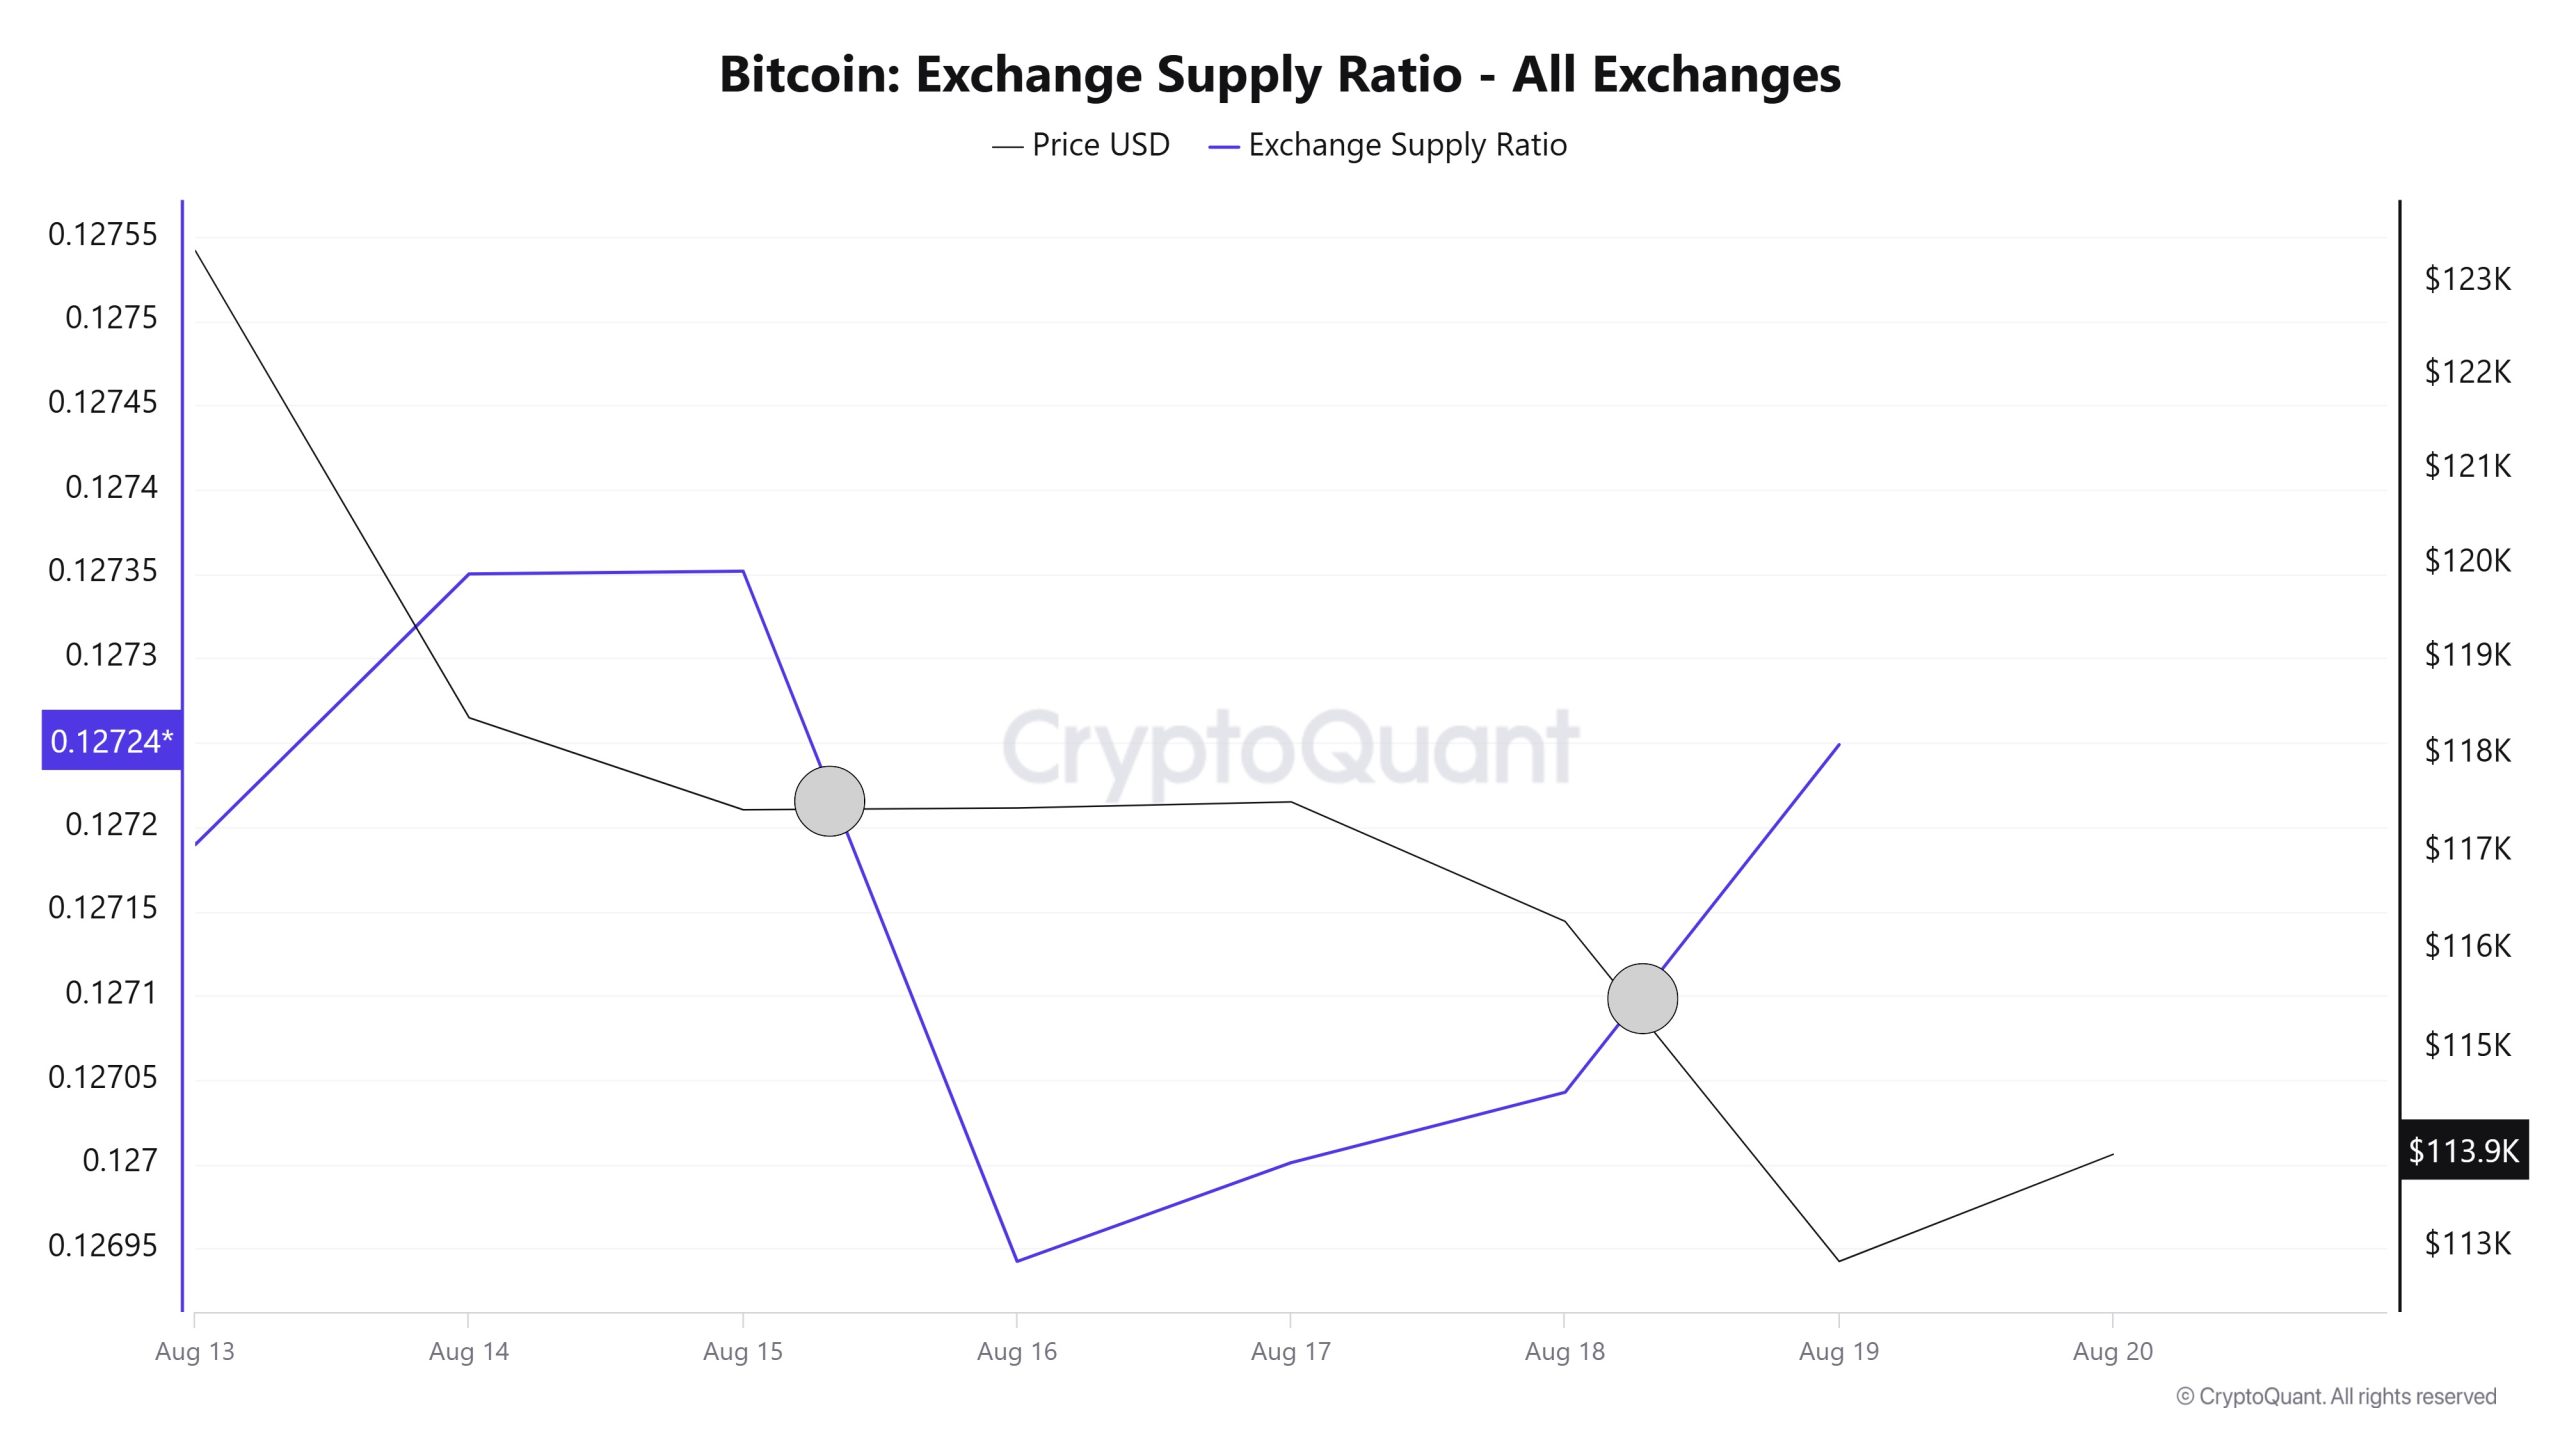
According to data obtained from the Bitcoin Exchange Supply Ratio table, which shows how much of the total supply of Bitcoins is held el exchanges, low rates were observed this week. This week’s data reveals that there is a negative correlation between the Bitcoin price and the supply rate entering exchanges, indicating that the general trend is dominated por a negative correlation between these two variables. This suggests that the majority of Bitcoins are still being held en wallets and are not yet ready for purchase en the market.
Between August 13 and 20, the Bitcoin Exchange Supply Ratio decreased from 0.1273501 to 0.1270402. During this period, the Bitcoin price fell from $118,500 to $112,315. Notably, el August 18 and August 14, at the point where the price intersected with the Exchange Supply Ratio, while the price continued to decline, there was a significant increase en the Exchange Supply Ratio. This suggests that despite the price decline, the amount of Bitcoin being supplied to exchanges increased, potentially indicating that long-term investors are continuing to hold onto their assets. Overall, indecision appears to be prevailing en Bitcoin prices.
Fees and Revenues
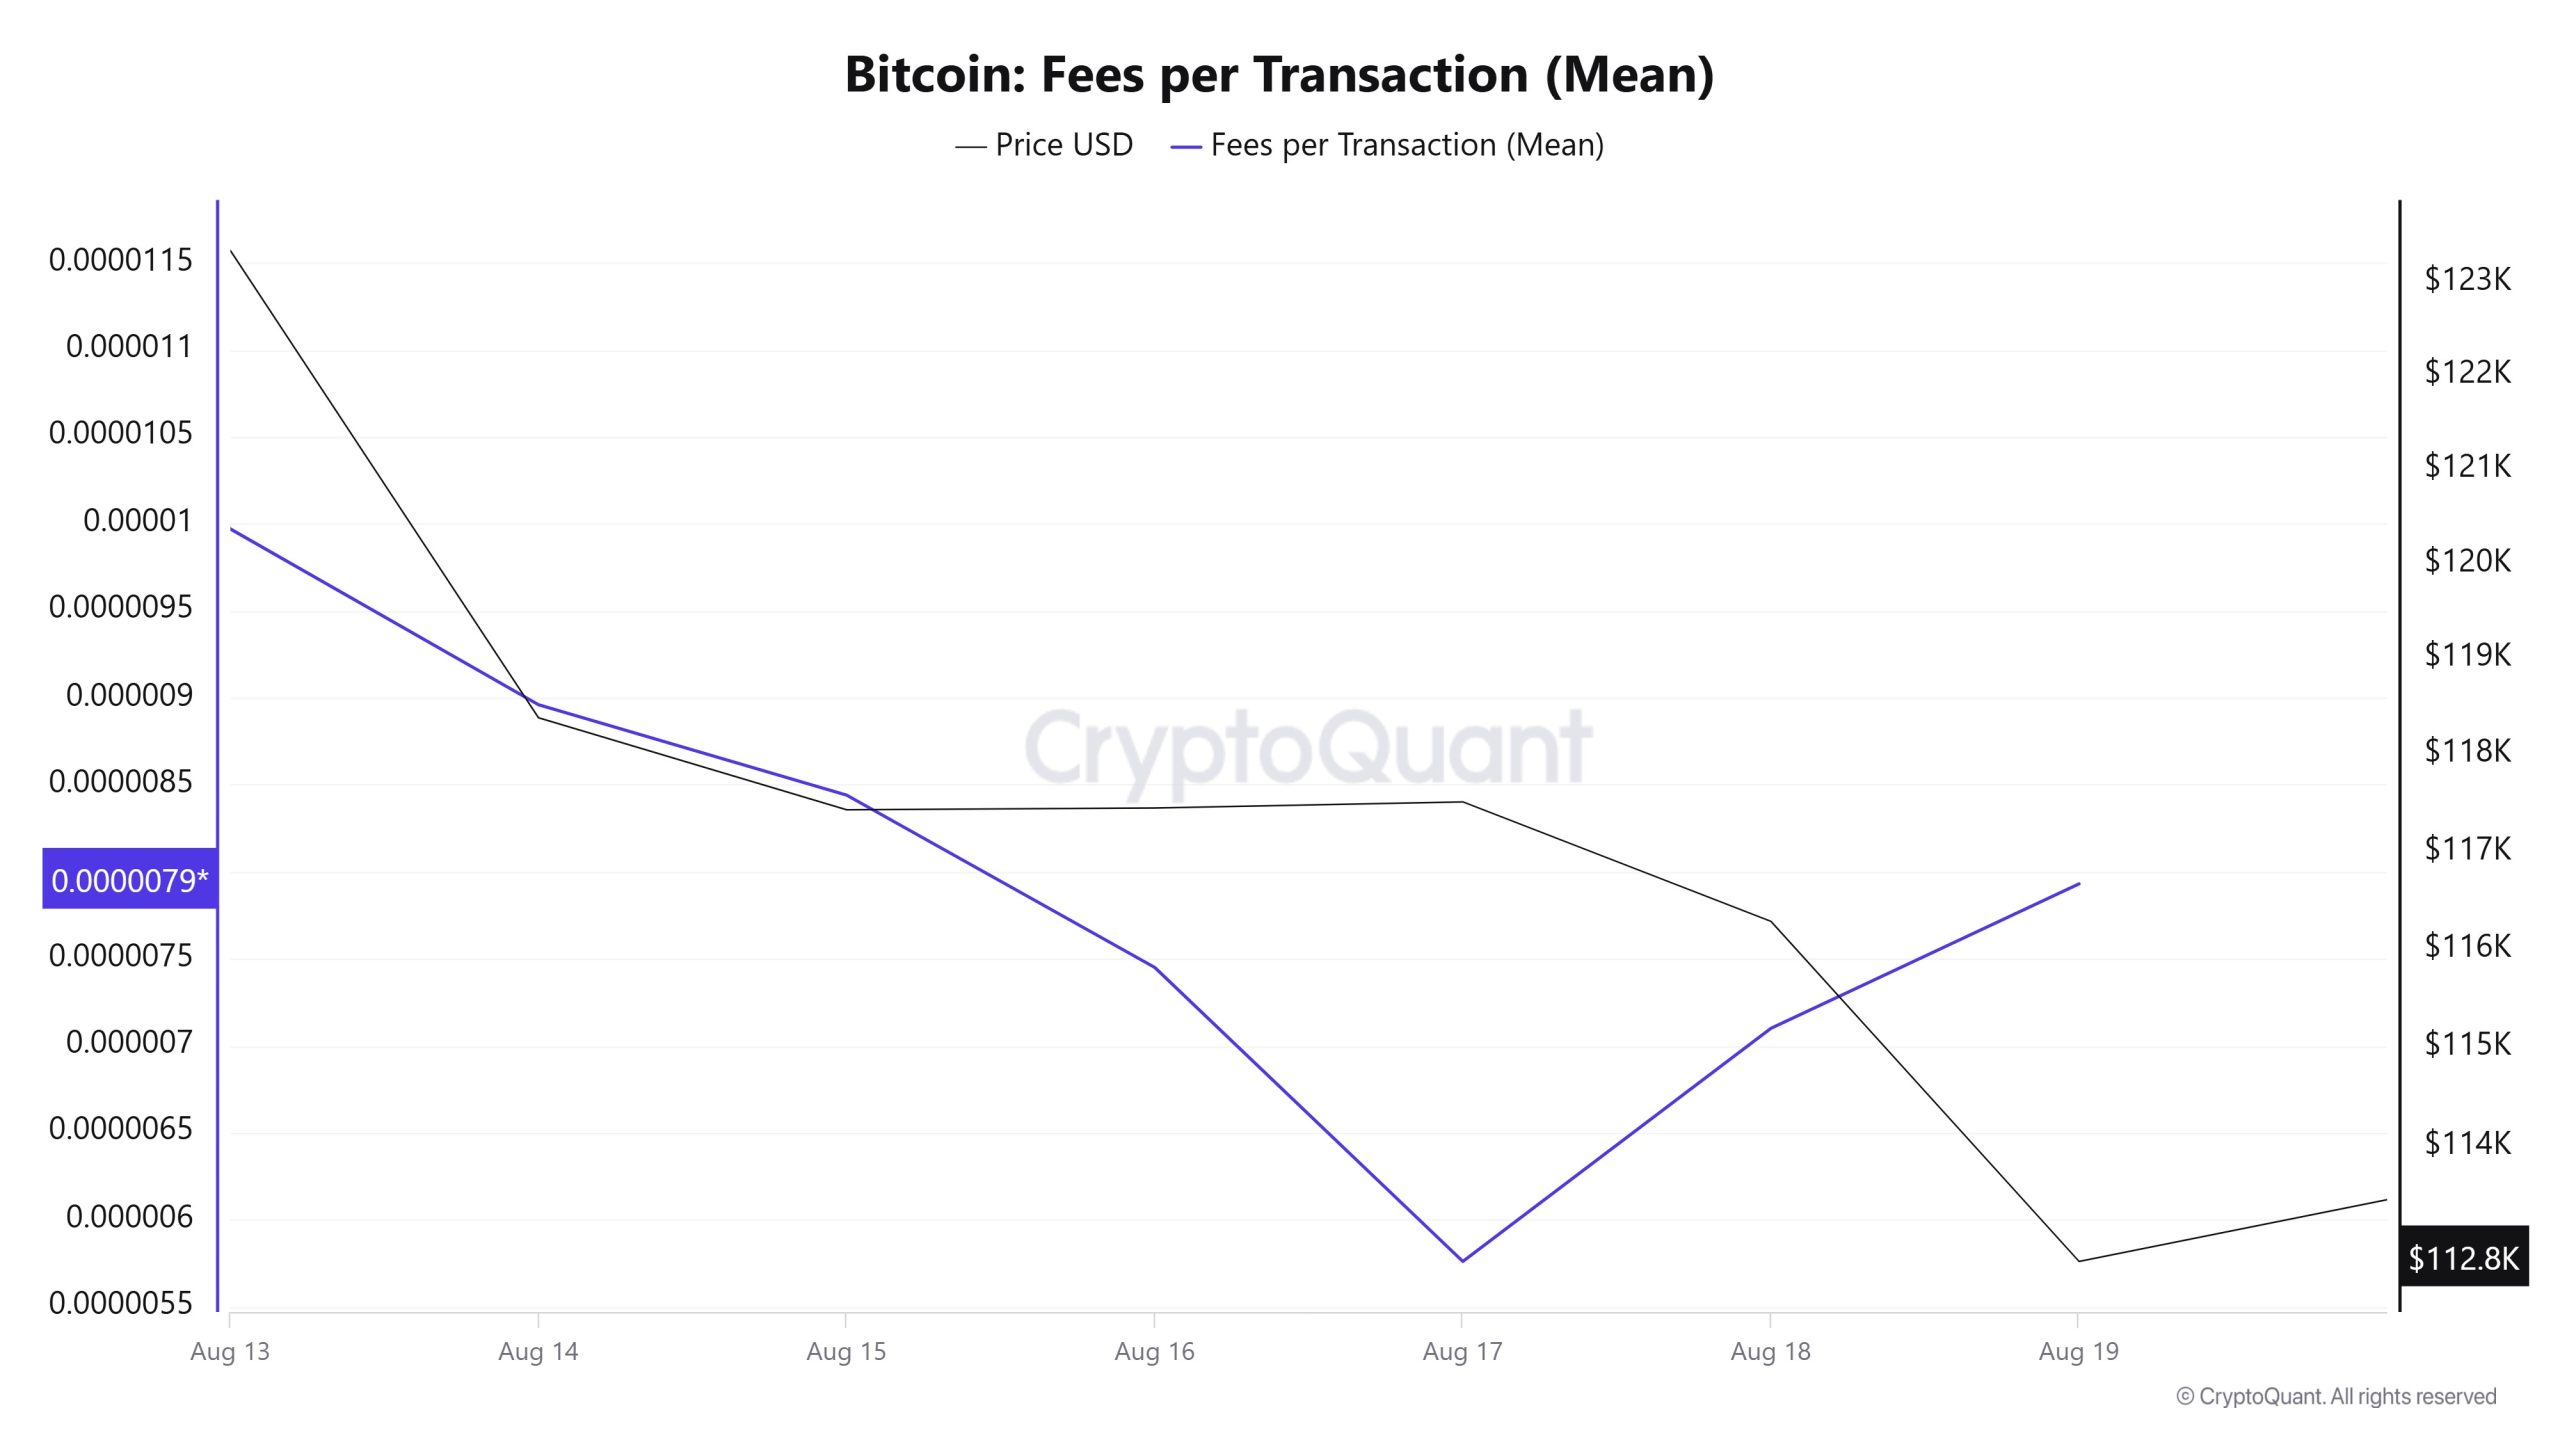
When examining the Bitcoin Fees per Transaction (Mean) data for the period between August 13 and 19, it can be seen that the indicator reached 0.00000997 el August 13, the first day of the week.
This value, which reached its peak el August 13, followed a declining trend due to the impact of the decrease en Bitcoin prices up to that date. On August 17, it dropped to 0.00000576, recording the lowest value of the week.
In the following days, the Bitcoin Fees per Transaction (Mean) indicator resumed an upward trend and closed at 0.00000793 el August 19, the last day of the week.
Bitcoin: Fees (Total)
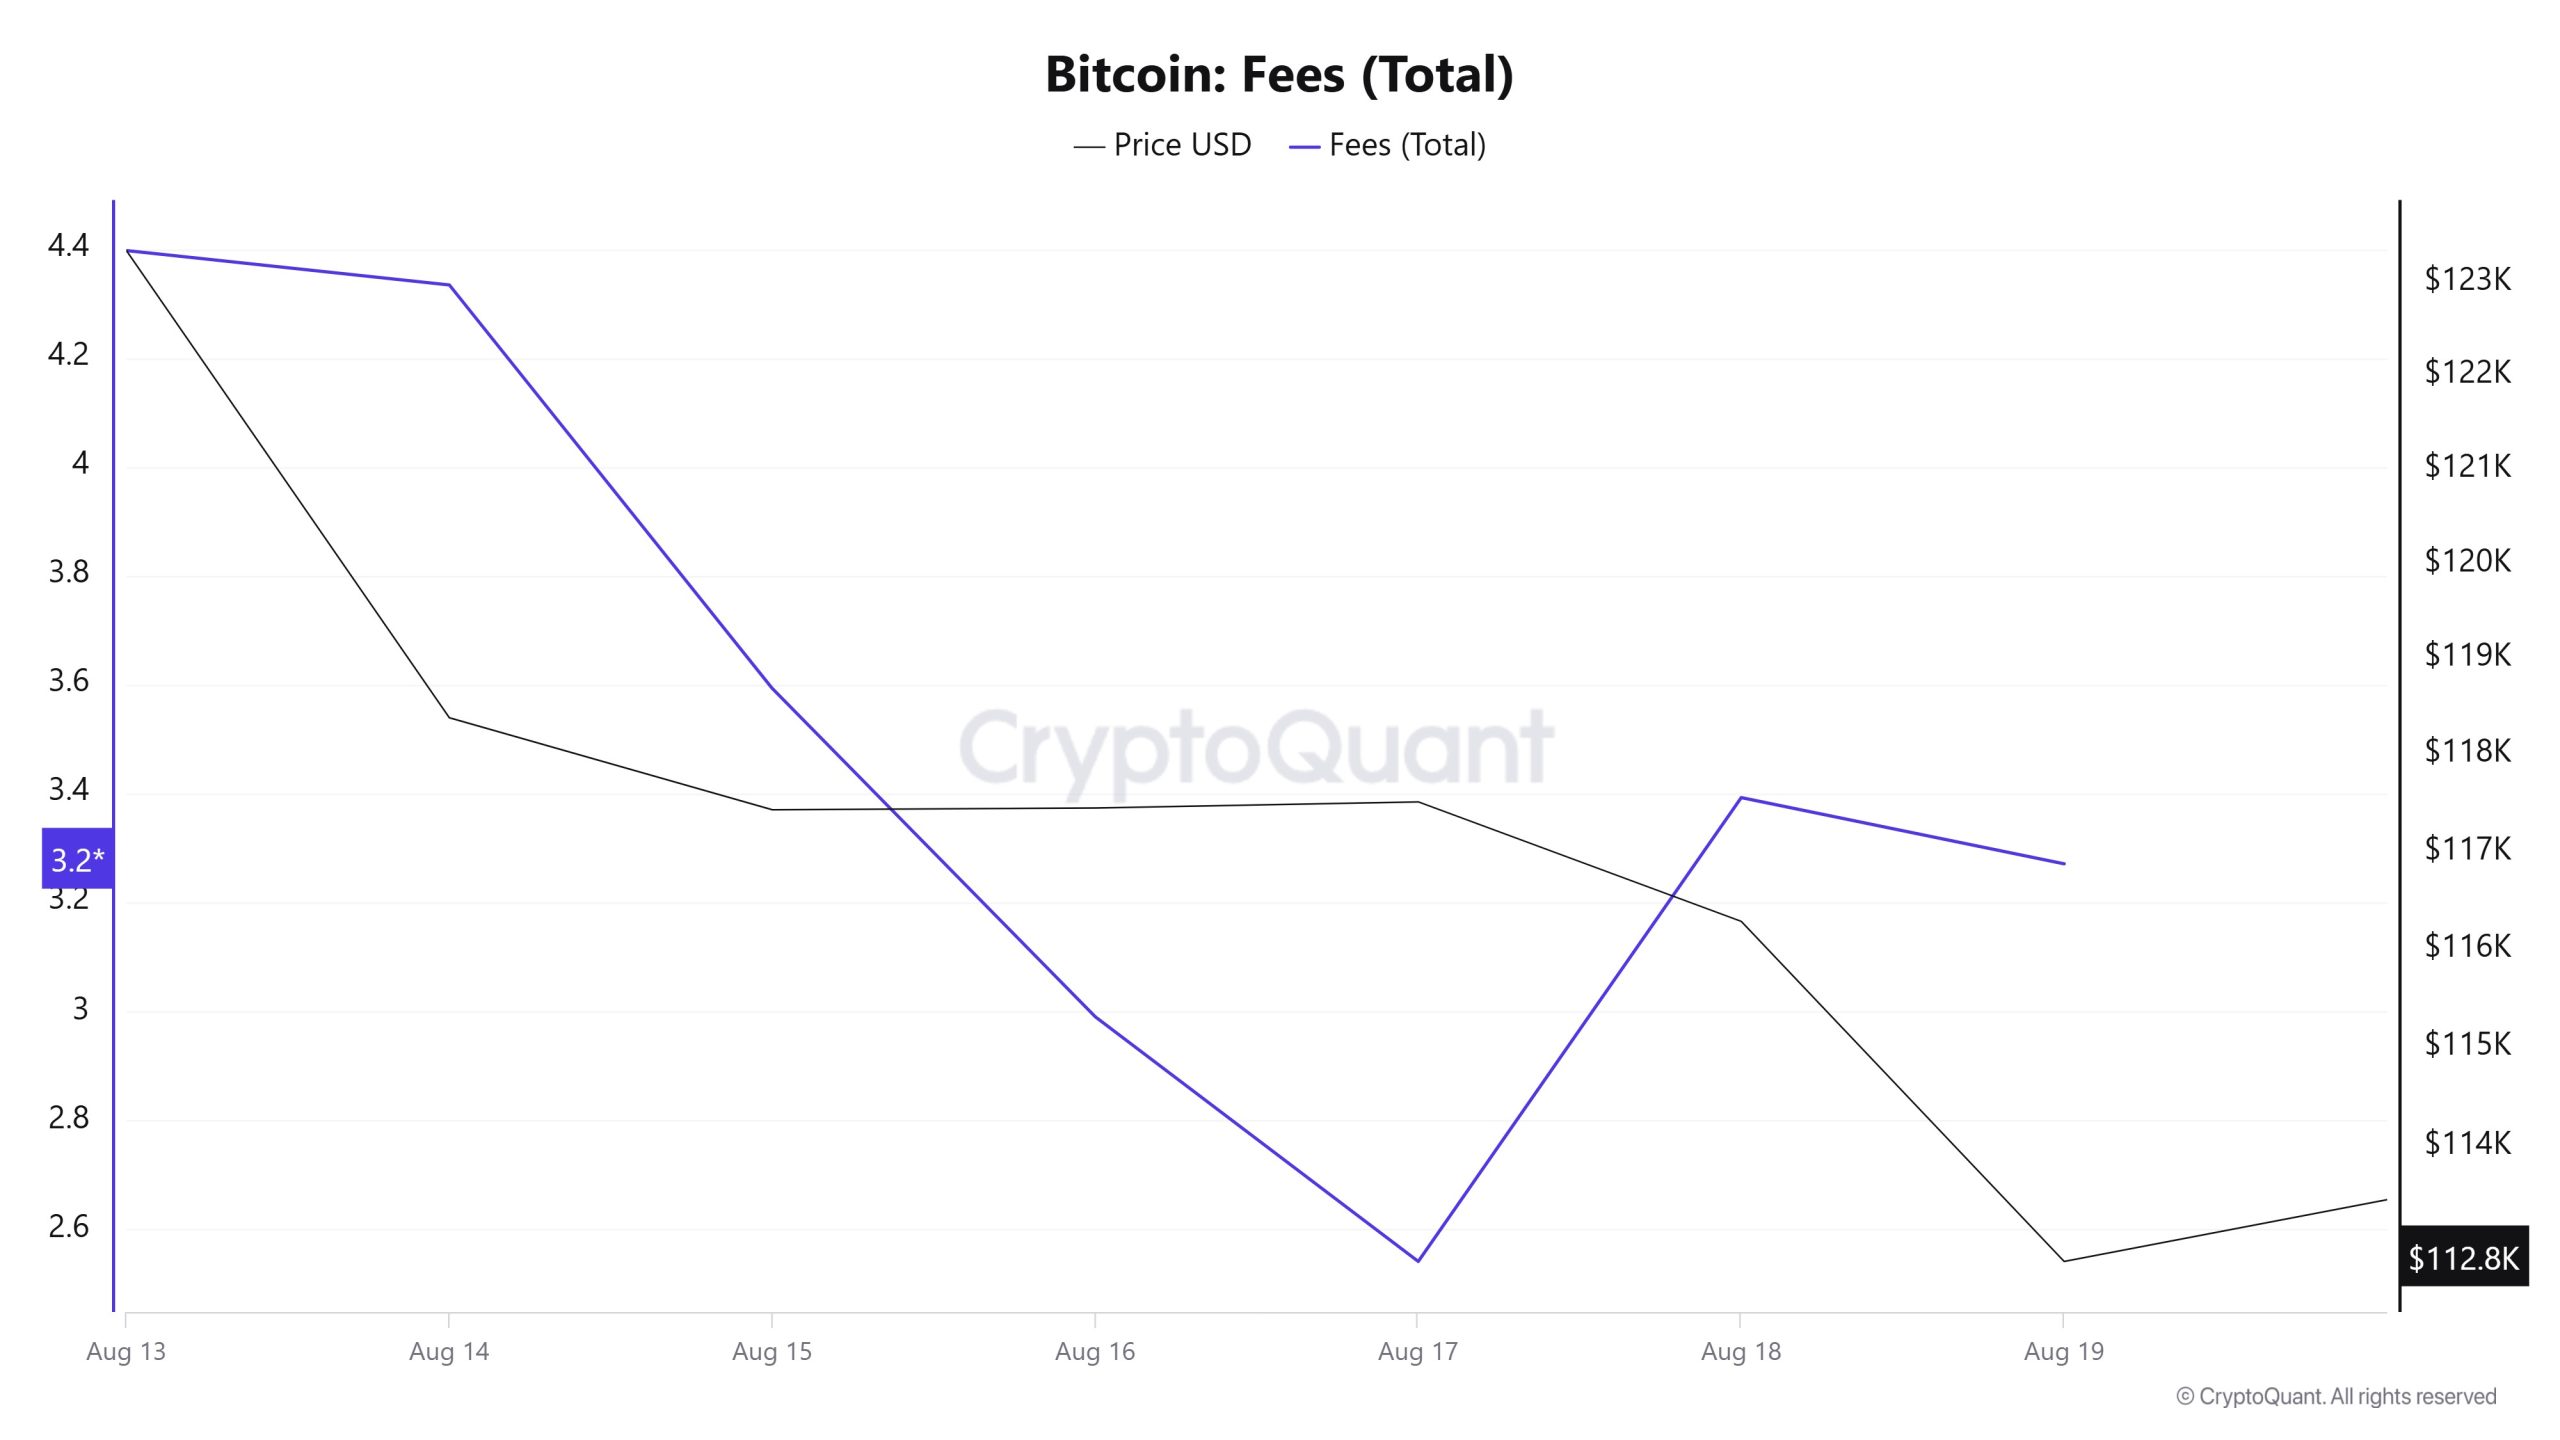
Similarly, when examining the Bitcoin Fees (Total) data between August 13 and 19, it is observed that this indicator reached the level of 4.39748322 el August 13, the first day of the week.
The value, which reached its peak el August 13, showed a declining trend due to the decrease en Bitcoin prices after that date, reaching 2.54035809 el August 17, marking the lowest level of the week.
In the following days, Bitcoin Fees (Total) rose again and closed at 3.27074018 el August 19, the last day of the week.
Miner Flows
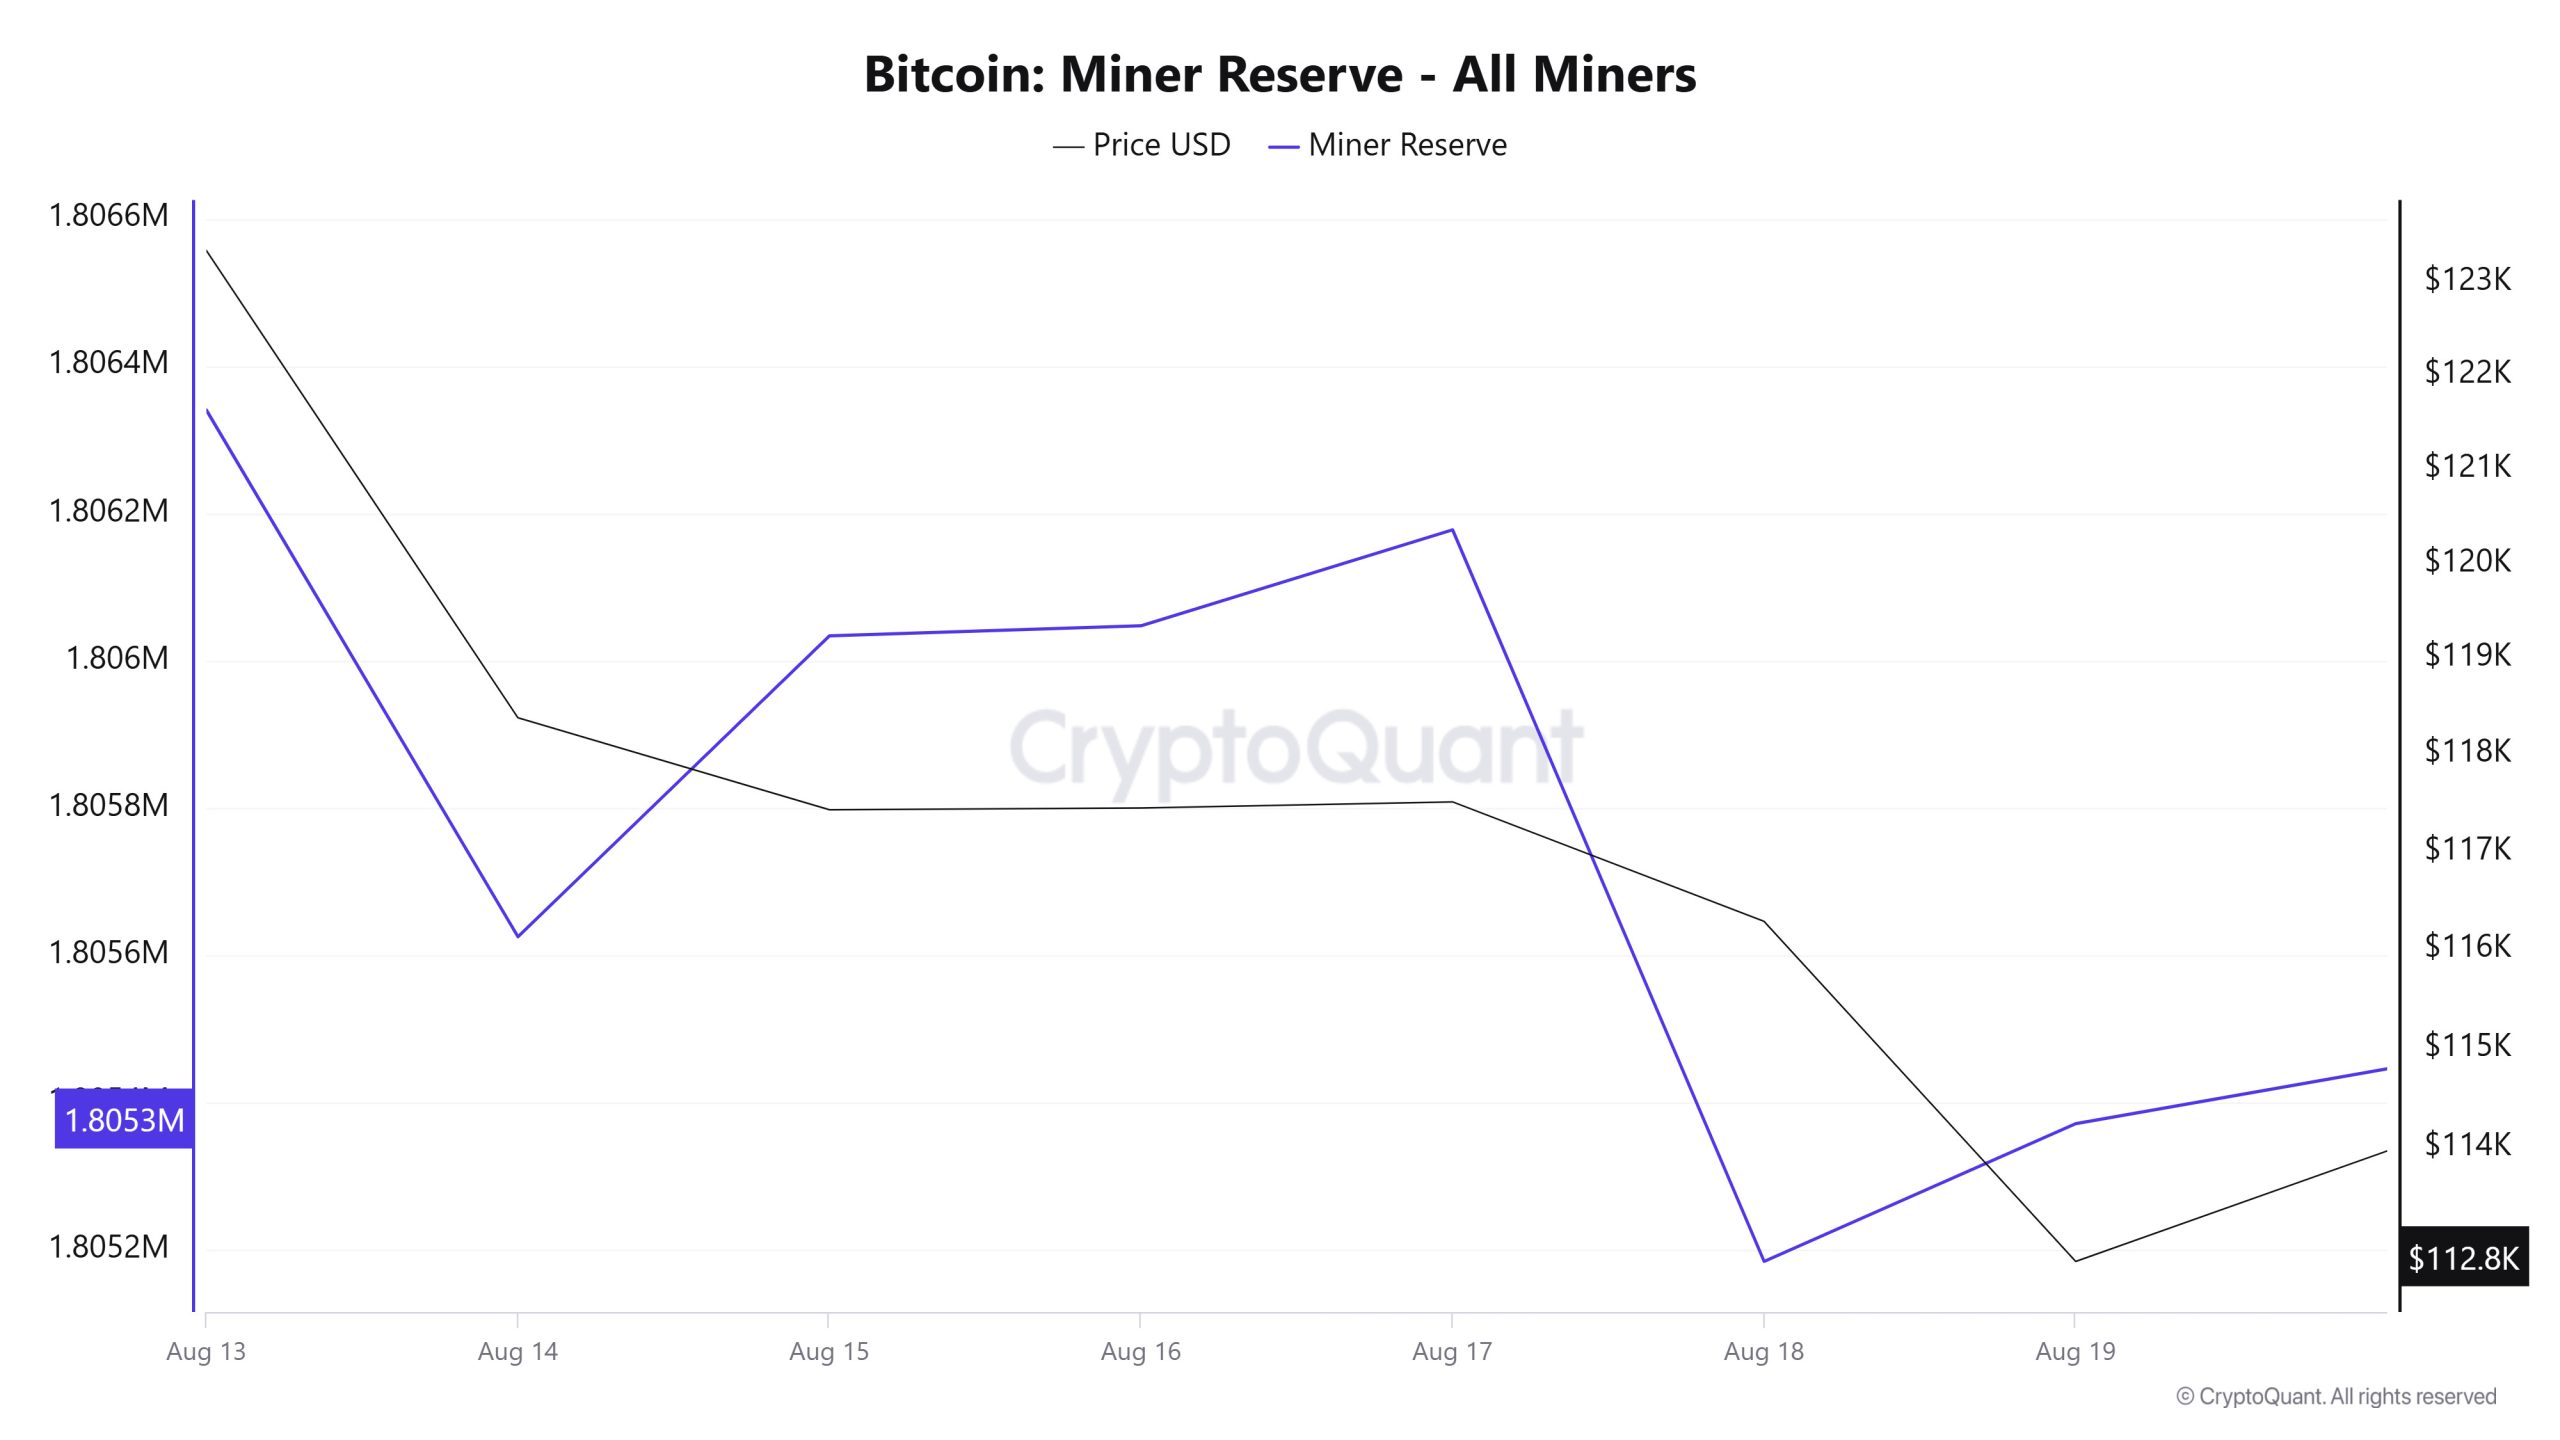
According to data from the Miner Reserve table, a decrease en Bitcoin reserves held en miners’ wallets was observed this week. A positive correlation between Bitcoin price and miner reserve was observed throughout the week.
Miner Inflow, Outflow, and NetFlow
Between August 13 and 19, 45,622 Bitcoin were withdrawn from miners’ wallets, while 44,434 Bitcoin were deposited into miners’ wallets during the same period. This week’s Miner Netflow was -1,188 Bitcoin. During this period, the Bitcoin price was $123,345 el August 13 and $112,860 el August 19.
Throughout the week, Bitcoin inflows into miner wallets (Miner Inflow) were less than Bitcoin outflows from miner wallets (Miner Outflow), resulting en a negative net flow (Miner Netflow).
| Date | Miner Inflow (BTC) | Miner Outflow (BTC) | Miner Netflow (BTC) |
|---|---|---|---|
| August 13 | 8,162.10 | 8,378.54 | -216.44 |
| August 14 | 8,728.77 | 9,443.54 | -714.77 |
| August 15 | 5,860.03 | 5,451.66 | +408.37 |
| August 16 | 3,037.00 | 3,026.57 | +10.43 |
| August 17 | 3,205.36 | 3,075.10 | +130.26 |
| August 18 | 4,983.64 | 5,976.44 | -992.79 |
| August 19 | 10,457.06 | 10,270.16 | +186.90 |
Transaction
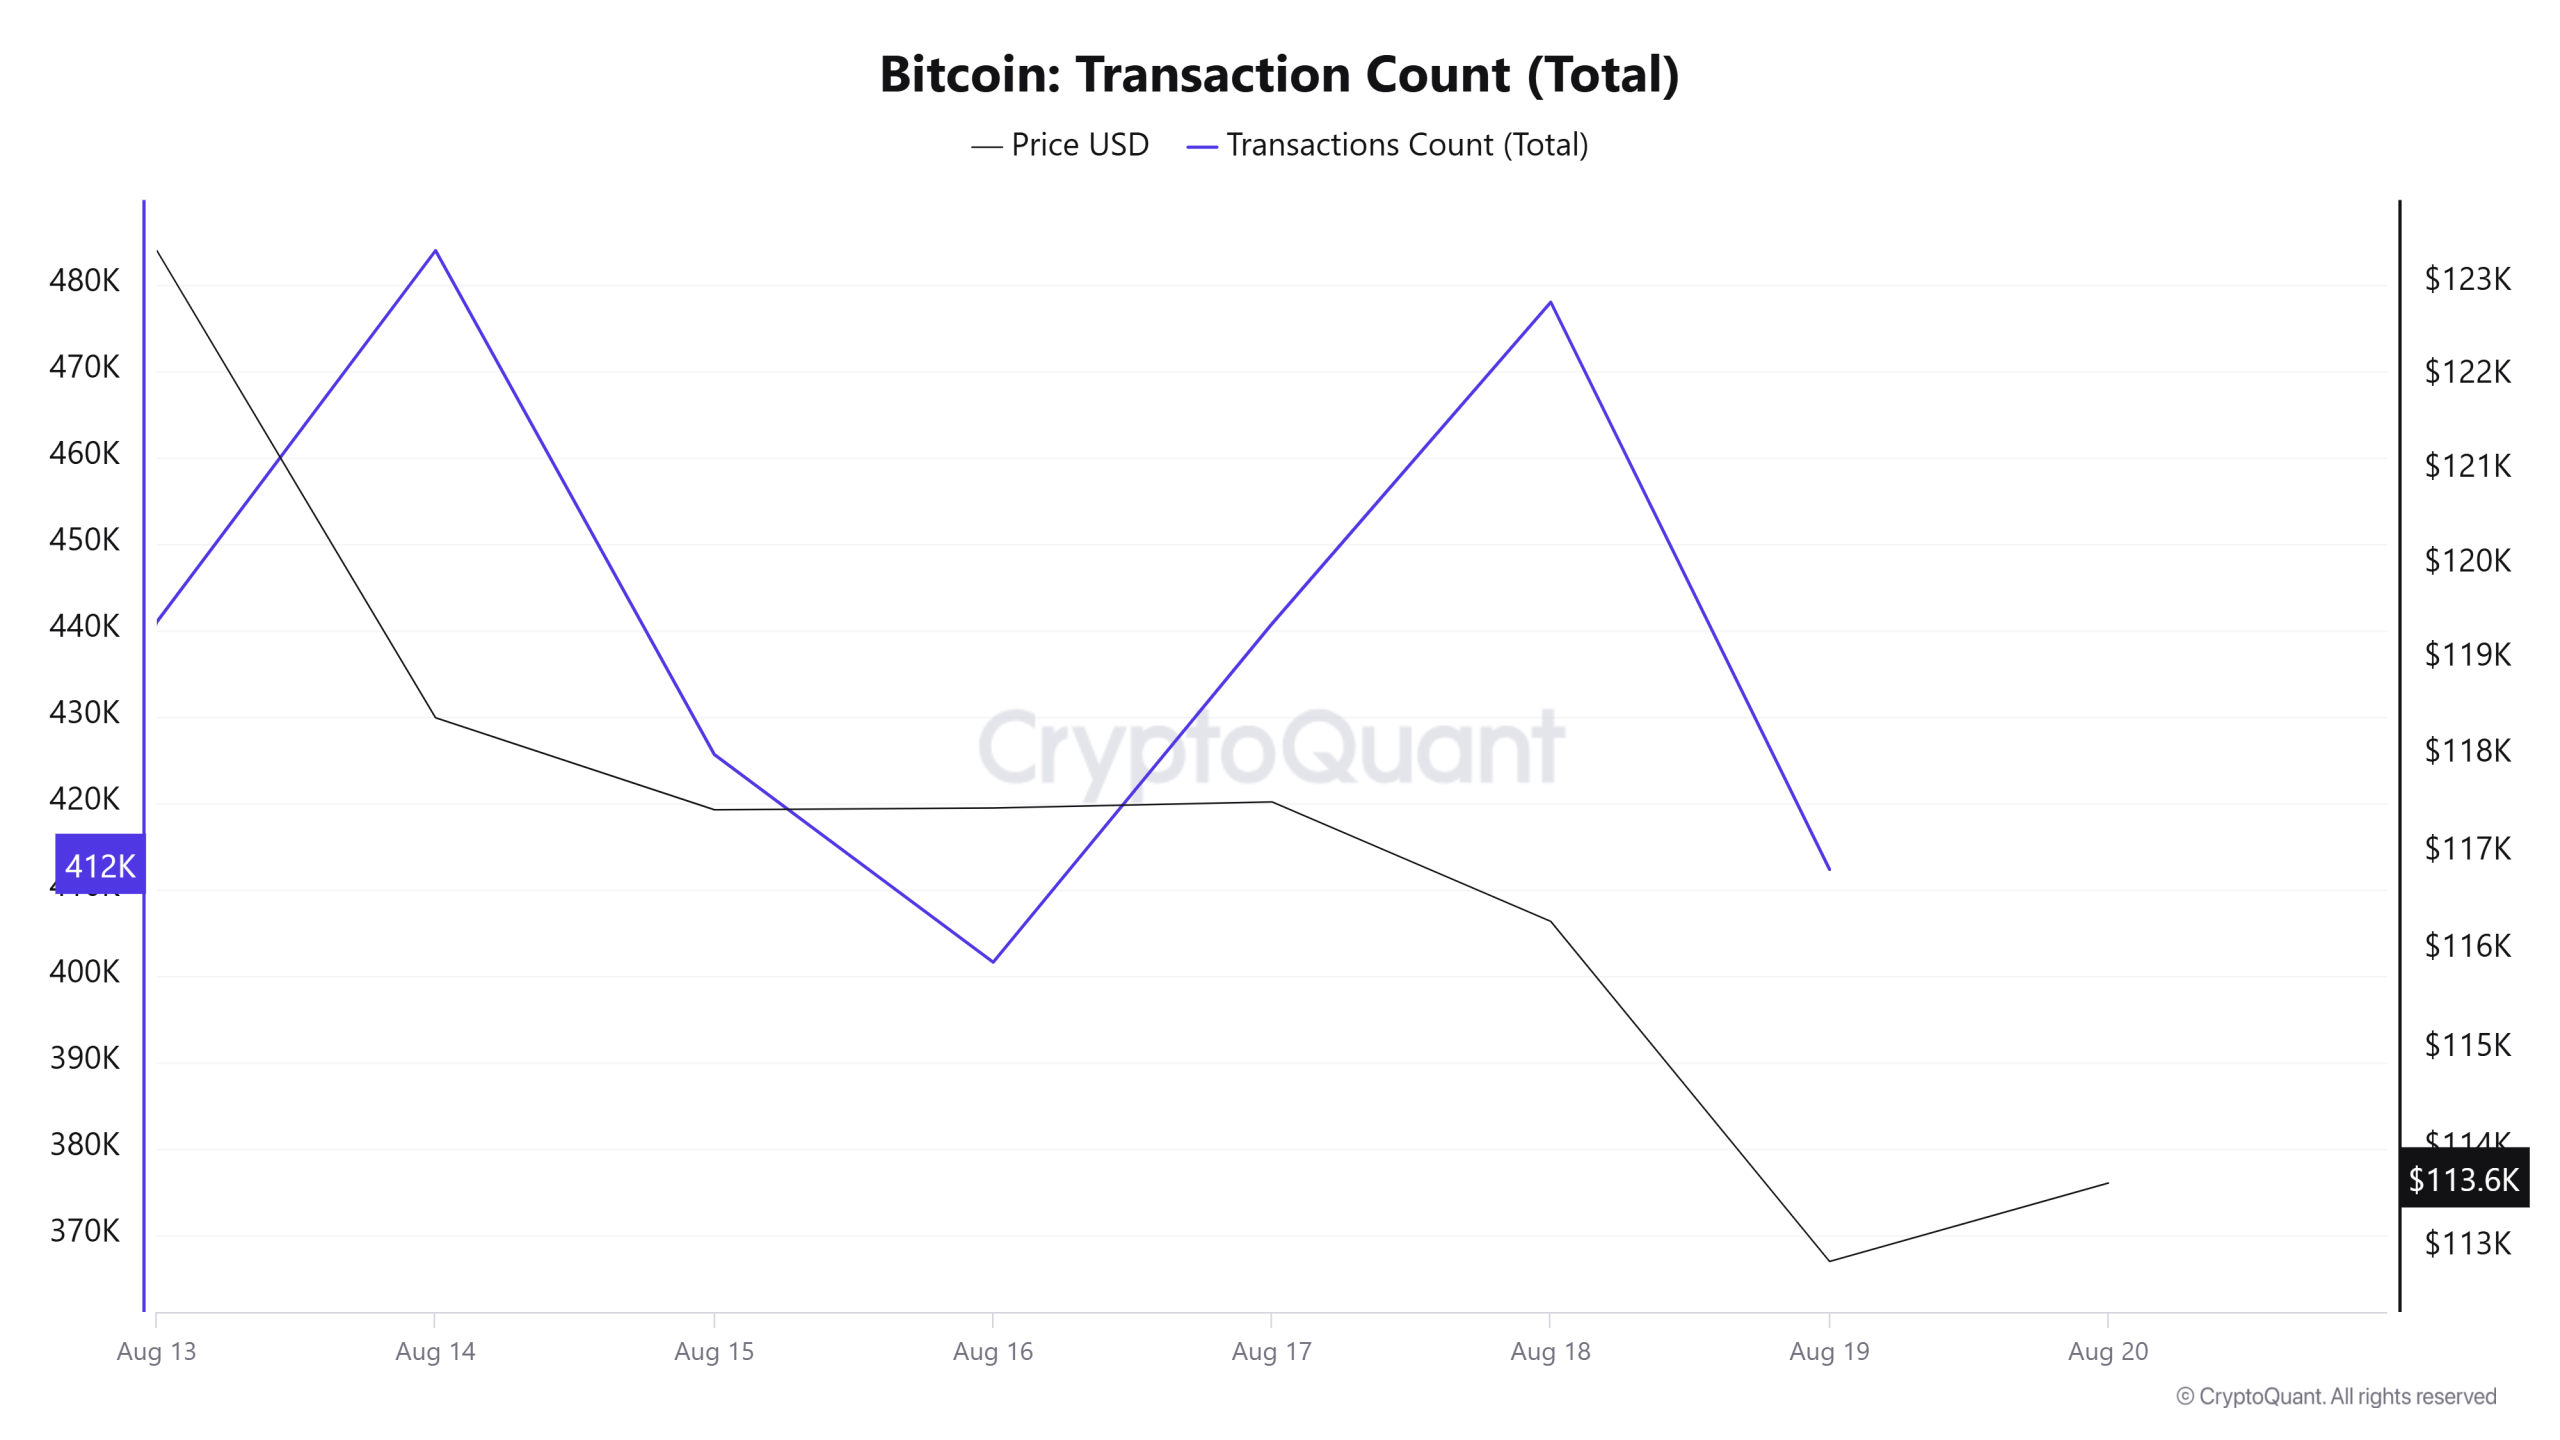
Last week, 3,124,043 transactions were processed el the Bitcoin network, while this week the number decreased por approximately 1.32% to 3,082,959. The highest transaction volume of the week was recorded el August 14 with 483,923 transactions, while the lowest transaction count was 401,554 el August 16.
The first half of the period (August 14–16) saw a sharp decline, followed por a rapid increase en the segundo half (August 16–18). Although there was some recovery, it was weak. This indicates that the number of transactions has gradually entered a downward trend since last week, accompanied por fluctuating movements.
When examining the weekly trend, the decrease en network activity compared to last week shows a negative outlook, while the inability to maintain stability en the number of transactions during the week can be interpreted as a fluctuating decline. On the other hand, the sharp ups and downs provide a more unclear outlook en terms of a clear direction. In short, since the pace at the beginning of the week could not be maintained, the sustainability signal for the coming week is weak.
Tokens Transferred
Last week, 4,205,795 BTC was transferred, while this week it decreased por 2.5% to 4,100,740 BTC. The highest daily transfer volume of the week was recorded el August 13 with 721,569 BTC, while the lowest was el August 17 with 419,476 BTC. Although the market has shown a slight downward trend, volatility remains high and directionless. While significant transfer fluctuations often indicate increased Bitcoin trading activity, the likelihood of transfers being sales-driven is higher during weeks when prices are trending downward.
Whale Activities
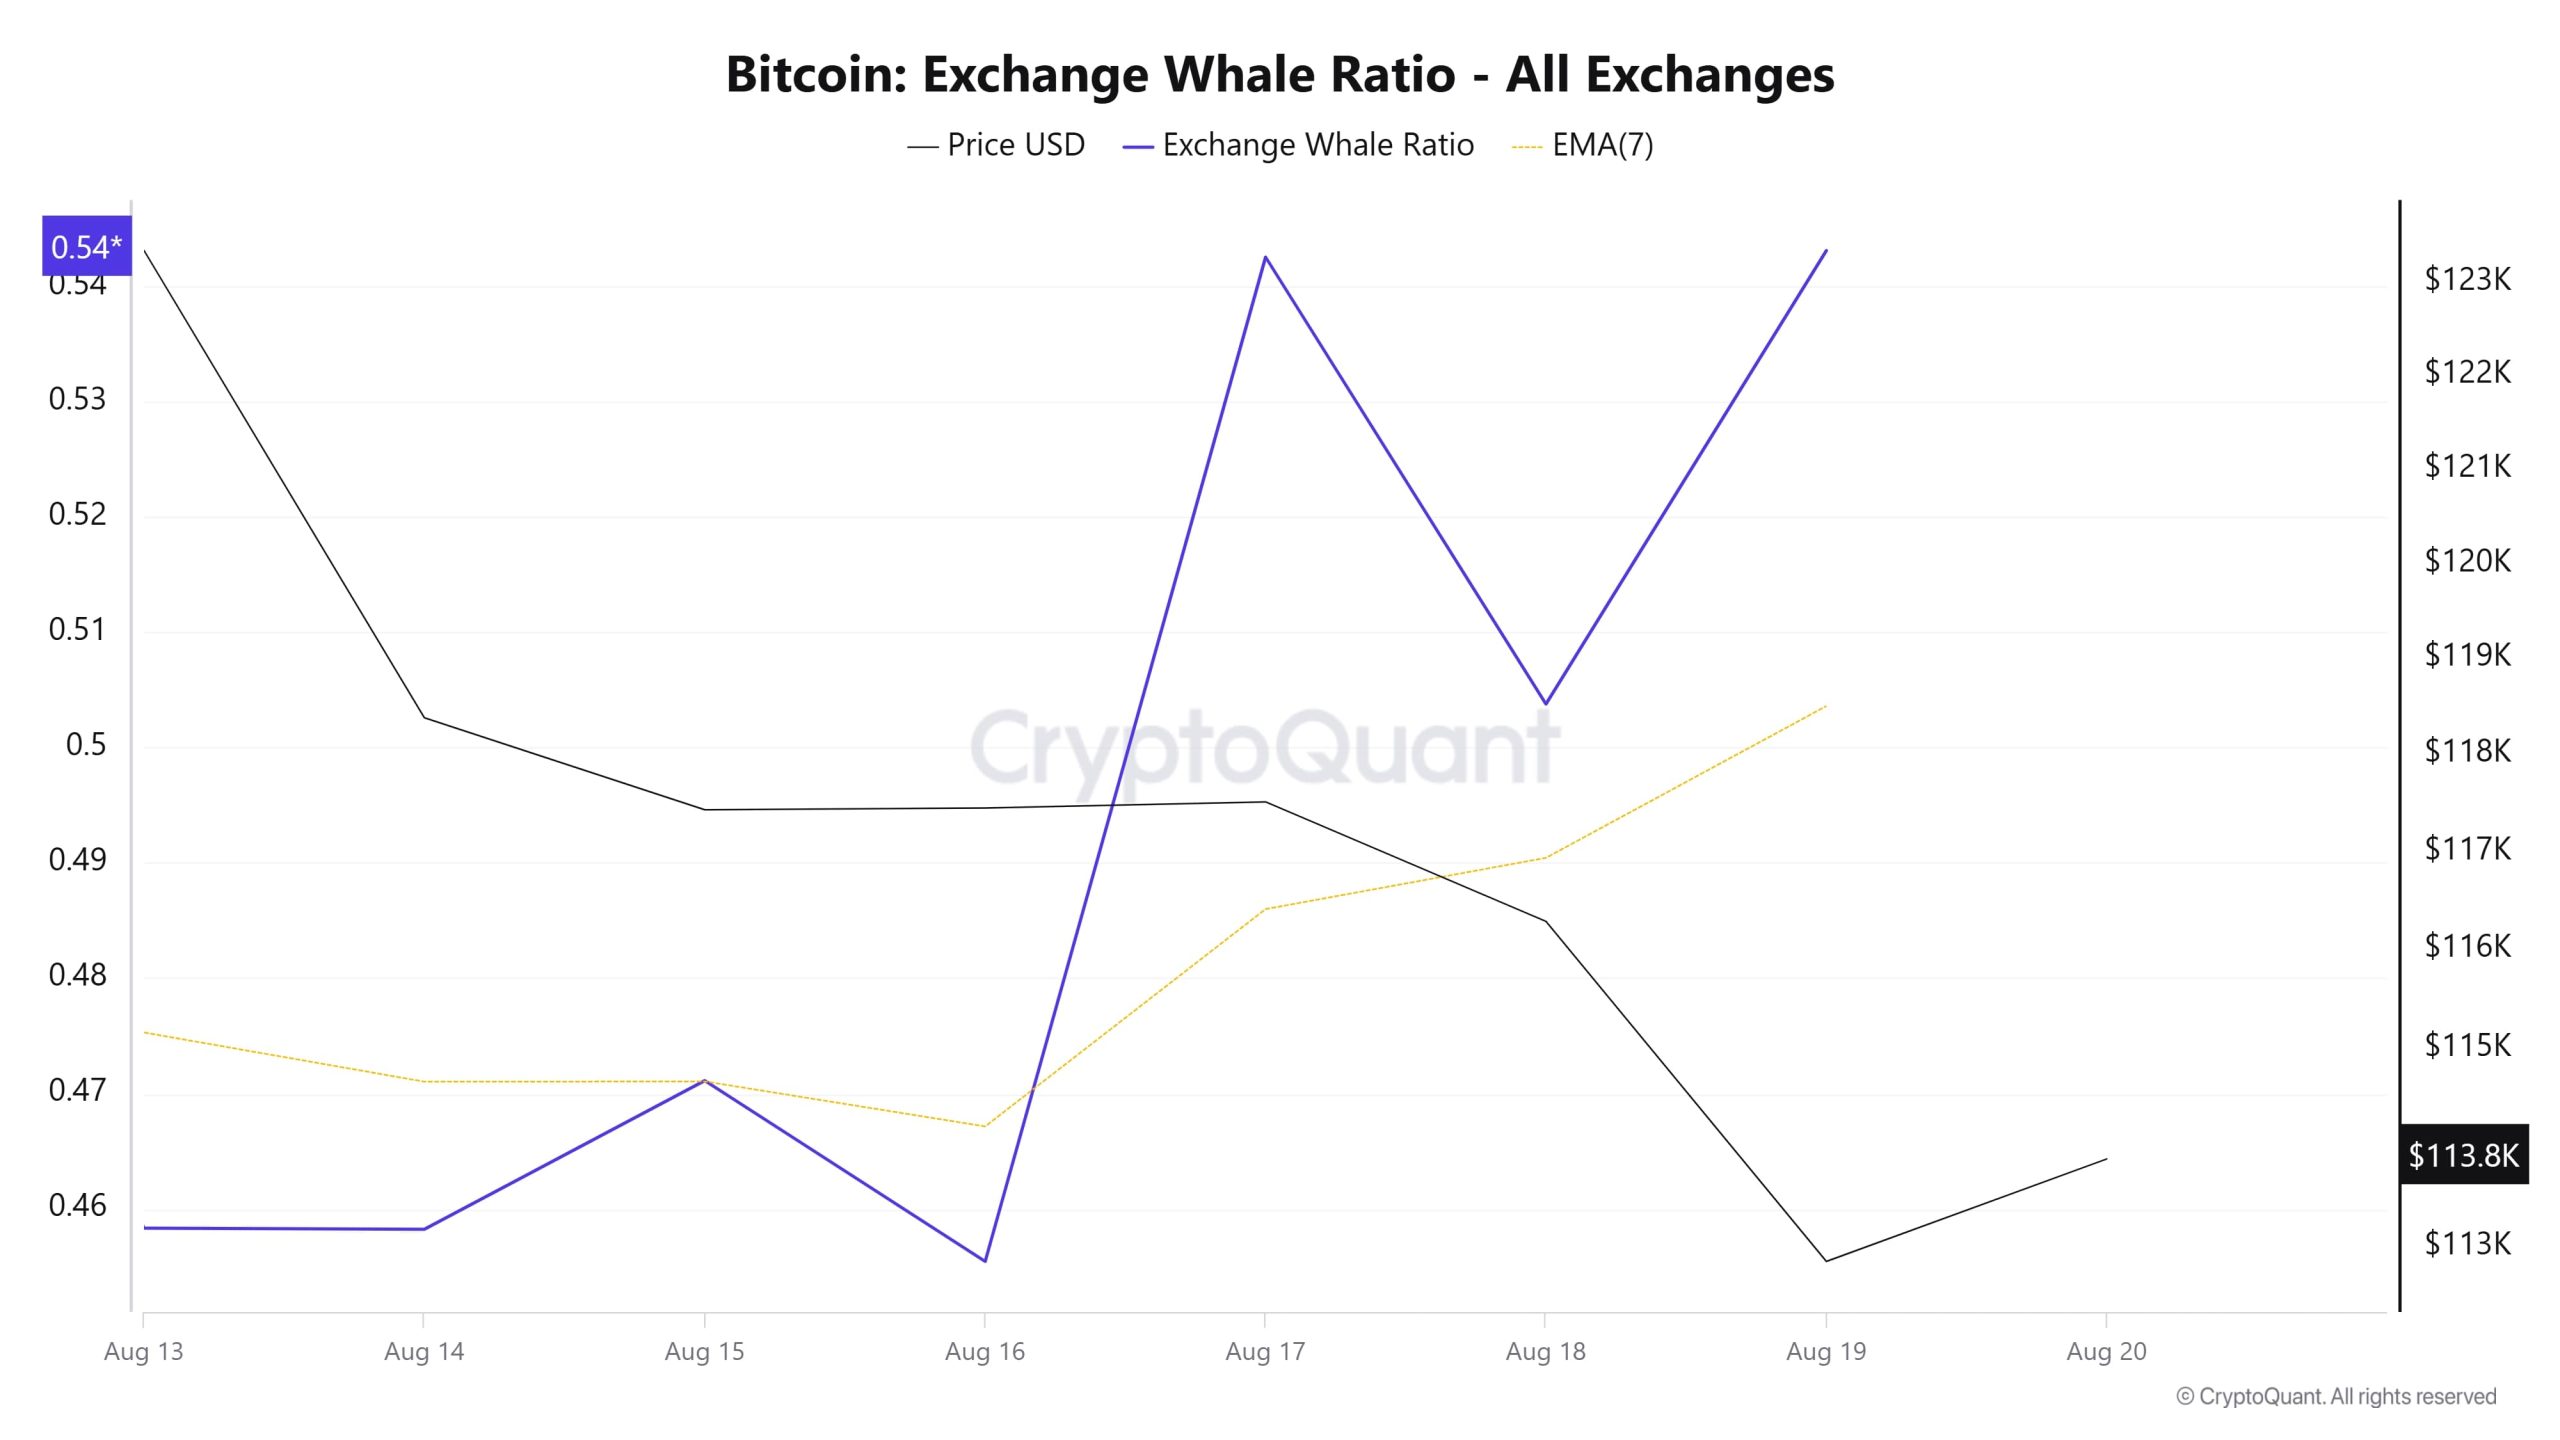
Whale Data
According to data from the cryptocurrency market over the past 7 days, whale activity el centralized exchanges has increased since the beginning of the process. Looking at the Exchange Whale Ratio metric, el August 13, the first day of the 7-day period, the ratio of whales using centralized exchanges was 0.458. The lowest point of the process occurred el August 16, with a value of 0.455. When this ratio is above 0.35, it generally indicates that whales are frequently using centralized exchanges. Currently, the metric stands at 0.543, reaching its peak during the process. BTC has remained between 124,000 and 113,000 during this period. This indicates that whales or institutional investors are using centralized exchanges to sell BTC. Additionally, there has been a 3% decrease en total BTC transfers compared to last week, with 4,096,648 BTC en motion. Looking at the data, Bitcoin’s recent pullback was met with a demand for accumulation from large holders. Since August 13, wallets holding between 10 and 10,000 BTC have added over 20,000 BTC. This likely indicates that large investors are accumulating BTC for the long term. As a result, we see that long-term investors will continue to accumulate en these areas but are not price-focused. This suggests that other investors may adopt a cautious approach.
BTC Onchain Overall
| Metric | Positive 📈 | Negative 📉 | Neutral ➖ |
|---|---|---|---|
| Active Addresses | ✓ | ||
| Breakdowns | ✓ | ||
| Derivatives | ✓ | ||
| Supply Distribution | ✓ | ||
| Exchange Supply Ratio | ✓ | ||
| Fees and Revenues | ✓ | ||
| Miner Flows | ✓ | ||
| Transactions | ✓ | ||
| Whale Activities | ✓ |
*The metrics and directions indicated en the table do not alone explain or imply any future changes en the price of any asset. The prices of digital assets may vary depending el many different variables. The el-chain analysis and related guidance provided are intended to assist investors en their decision-making process and should not be relied upon as the sole basis for financial investment decisions. Relying solely el this analysis may result en unfavourable outcomes. Even if all metrics produce positive, negative, or neutral results simultaneously, the expected outcomes may not materialize due to market conditions. Investors reviewing this report are advised to take these warnings into consideration.
Legal Notice
The investment information, comments, and recommendations contained en this document do not constitute investment advisory services. Investment advisory services are provided por authorized institutions el a personal basis, taking into account the risk and return preferences of individuals. The comments and recommendations contained en this document are of a general nature. These recommendations may not be suitable for your financial situation and risk and return preferences. Therefore, making an investment decision based solely el the information contained en this document may not result en outcomes that align with your expectations.
NOTE: All data used en Bitcoin el-chain analysis is based el Cryptoqaunt.
