
September 23 – August 30 – 2024 Darkex Weekly Technical Analysis Report
BTC/USDT After the FED interest rate decision! If we look at Bitcoin’s weekly performance after the critical FED interest rate cut…

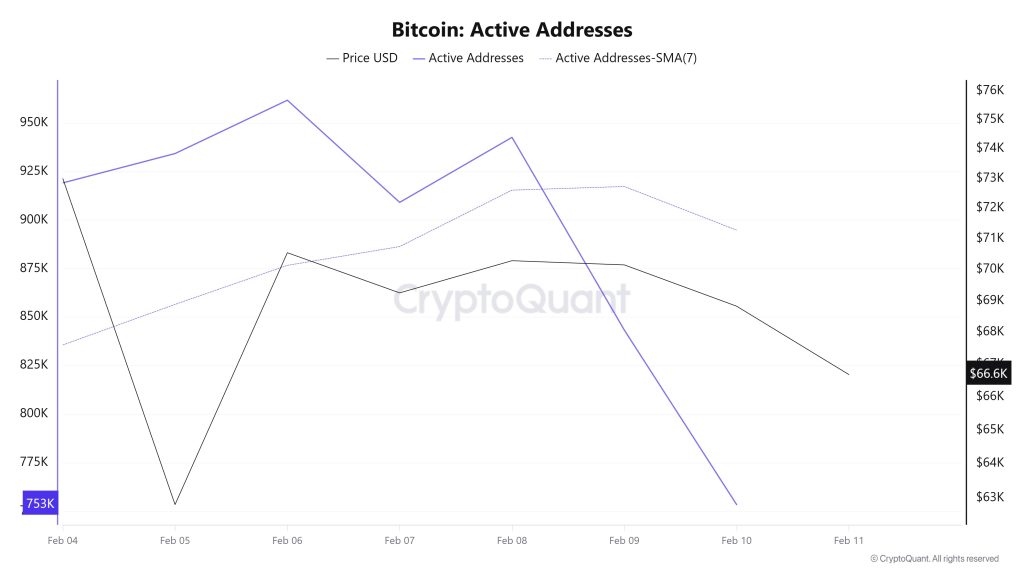
Between February 4 and February 11, recorded 961,697 active addresses el the Bitcoin network. During this period, Bitcoin’s price fell from $73,000 at the beginning of the week to $68,825 el February 4. From a technical perspective, the 7-day simple moving average (SMA) shows a downward trend.
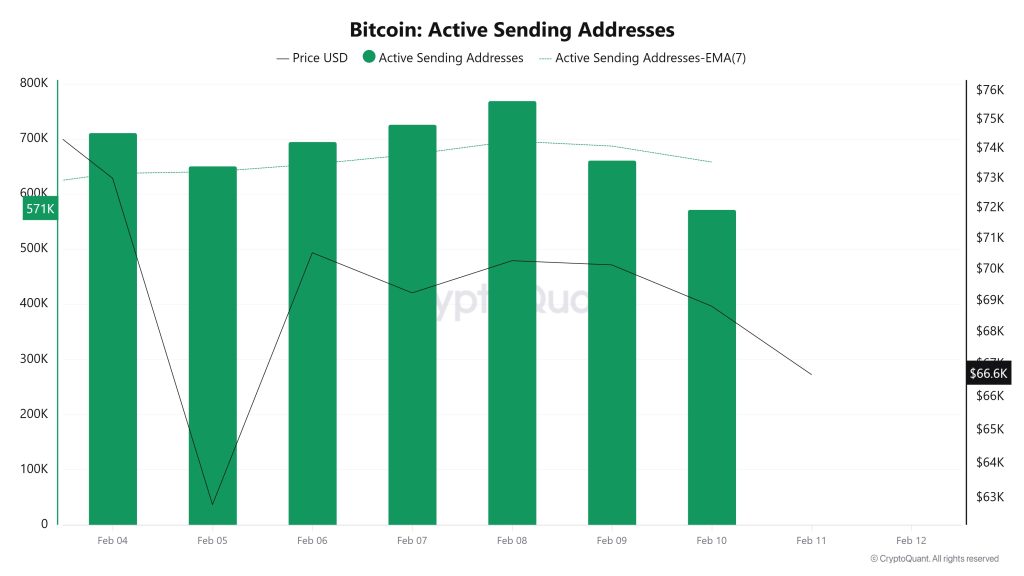
Between February 4 and February 11, an upward trend was observed en the active sending addresses metric. On the day the price reached its highest level, this metric stood at 769,246, indicating that user activity el the Bitcoin network was moving en parallel with the price. This data shows that the $70,000 level is supported not only por price but also por el-chain address activity. Overall, the Active Sending Addresses metric has followed a high trajectory during this period.
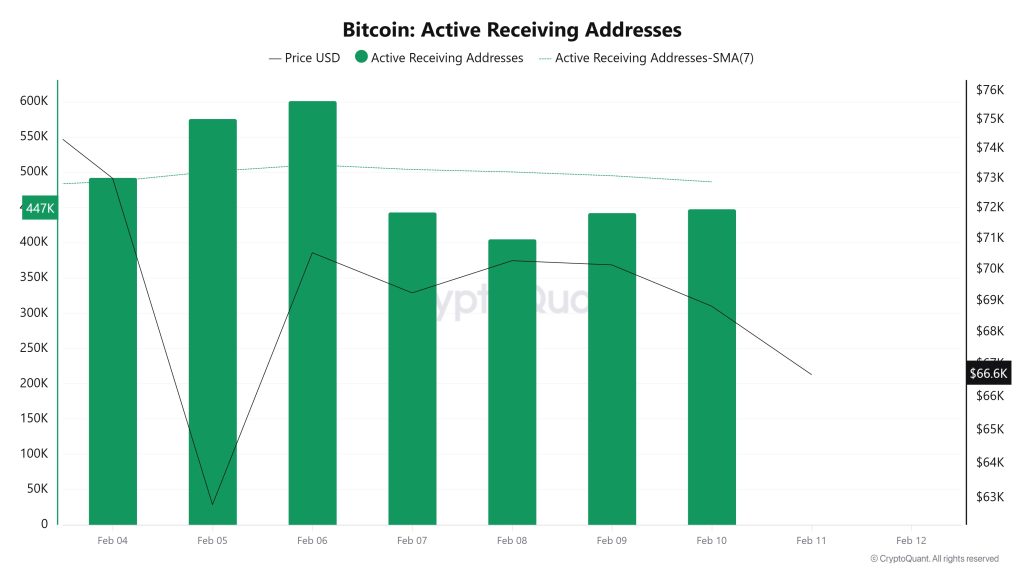
Between February 4 and February 11, active receiving addresses experienced a typical rise alongside the Black Line (price line). On the day the price reached its peak, active receiving addresses rose to 601,437 levels, indicating that buyers acquired Bitcoin at around the $70,500 level.
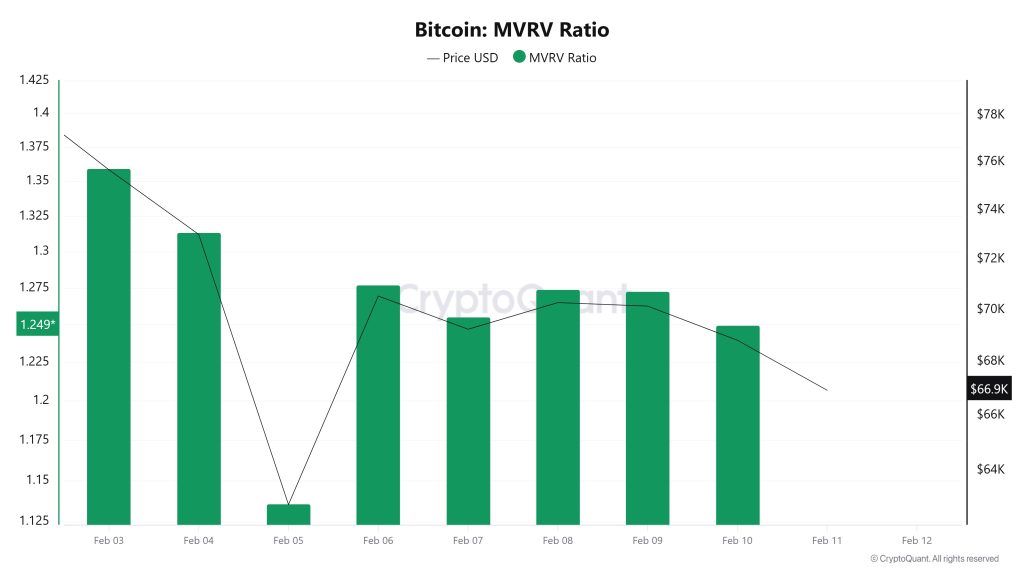
On February 4, while the Bitcoin price was trading at $73,007, the MVRV Ratio was at 1.313. As of February 10, the Bitcoin price fell to $68,825, recording a 5.73% decline, while the MVRV Ratio fell to 1.249, recording a 4.88% decline. The pullback en the MVRV Ratio indicates that the premium relative to the realized cost basis continues to narrow and that unrealized profits maintain their tendency to compress. This outlook suggests that risk appetite remains weak en the short term, and as long as price pressure persists, upward attempts are likely to be met with caution.
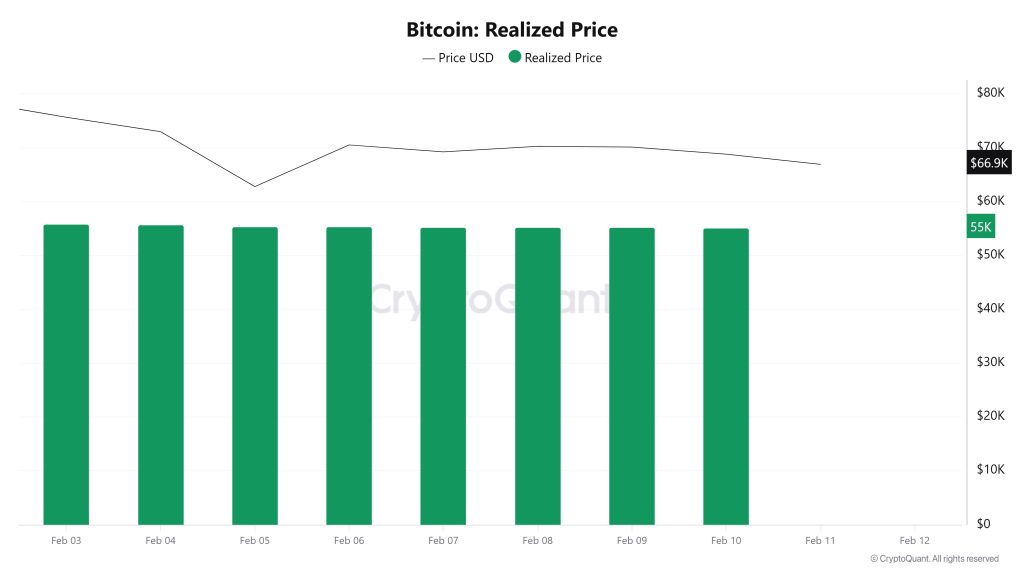
On February 4, while the Bitcoin price traded at $73,007, the Realized Price was at $55,581. As of February 10, the Bitcoin price fell to $68,825, recording a 5.73% decline, while the Realized Price fell to $55,082, recording a limited 0.90% decline. The slight pullback en the Realized Price indicates a limited downward adjustment en the network’s average cost basis, confirming that the spot price’s premium over the cost basis has narrowed again this week. This picture suggests that while spot pricing remains the main driver of selling pressure, the cost basis is also following suit, albeit weakly, el the downside.
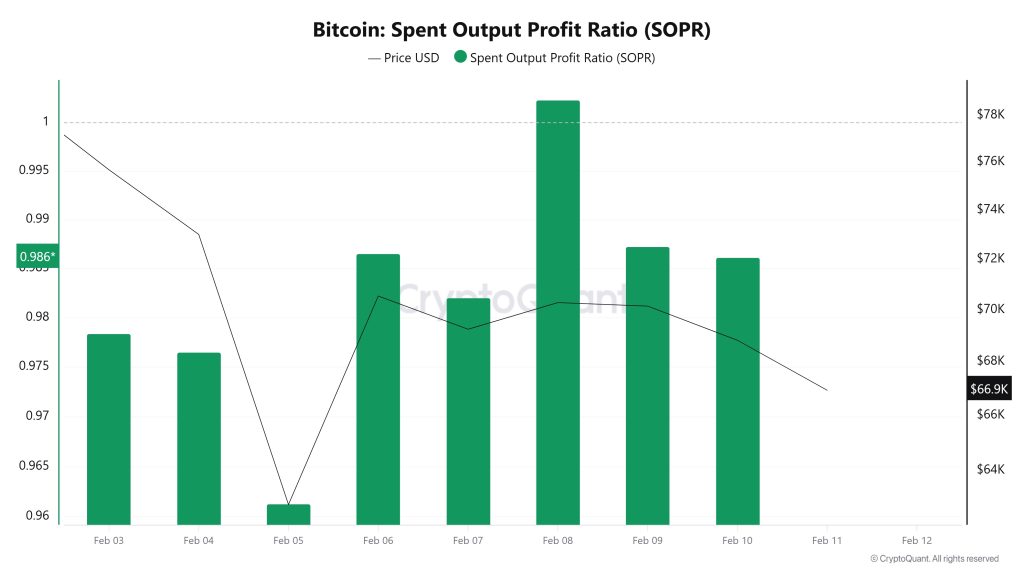
On February 4, while the Bitcoin price traded at $73,007, the SOPR metric was at 0.976. As of February 10, the Bitcoin price fell to $68,825, recording a 5.73% decline, while the SOPR metric rose to 0.986, recording a 1.02% increase. The SOPR remaining below 1 indicates that coins are changing hands at a loss el average, while the upward recovery signals a decrease en the intensity of loss-making sales and a greater number of break-even transactions. This outlook suggests that although selling pressure may persist en the short term, efforts to stabilize at the bottom may be gaining momentum.
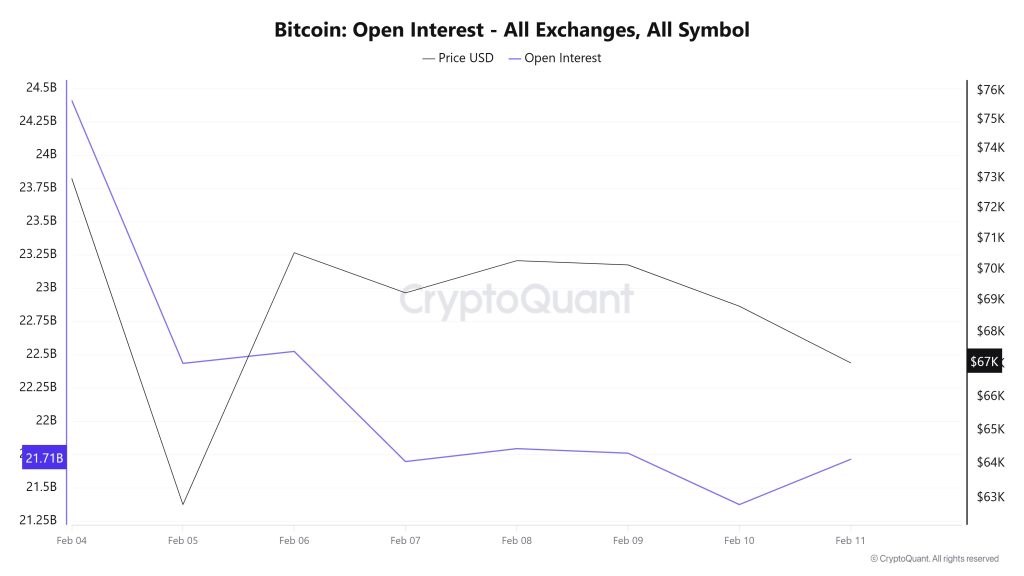
On February 4, open interest experienced a rapid decline from a very high level, and a significant liquidation wave was observed el February 5. This indicates that leveraged positions were closed to a significant extent. Although open interest recovered briefly el February 6, it has remained flat to slightly downward en the following days. In summary, the structure indicates that leverage appetite en the market has weakened and that aggressive position entries strong enough to form a new trend have not yet been seen.
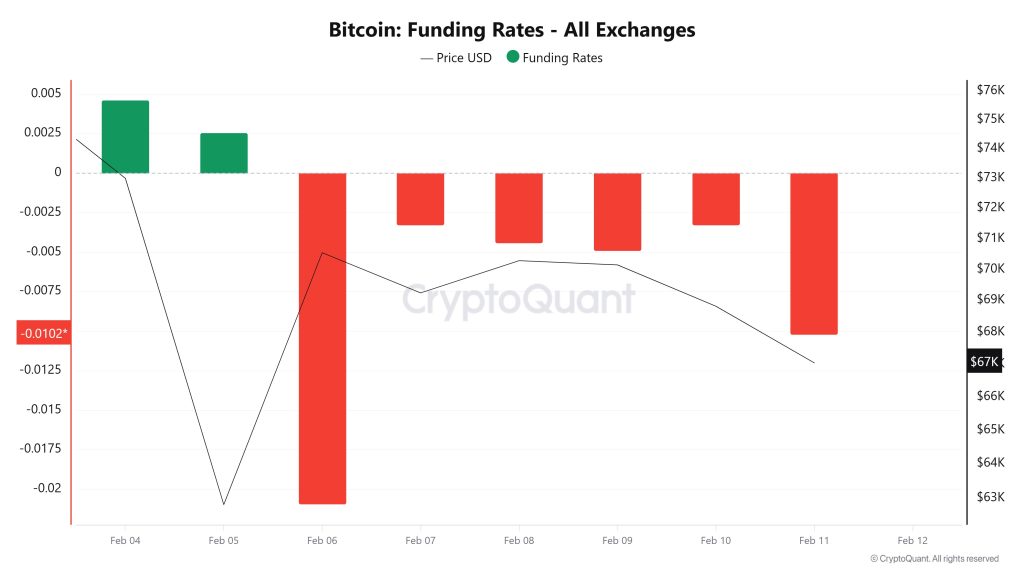
On February 4, the funding rate was briefly positive but quickly turned negative and fell sharply into negative territory el February 6. This outlook indicates that short positions are dominant en the market. In the following days, the funding rate remained negative, but the severity of the decline decreased.
In summary, the structure indicates that the short trend en the leveraged market is continuing and that there is a cautious positioning against rallies.
Last week, the BTC price fell sharply to the $60,000 level. As a result, a total of $1.913 billion en long positions were liquidated, while $688 million en short positions were liquidated.
| Date | Long Amount (Million $) | Short Amount (Million $) |
|---|---|---|
| February 4 | 99.38 | 25.10 |
| February 5 | 688.45 | 204.78 |
| February 6 | 601.50 | 234.44 |
| February 7 | 111.79 | 66.94 |
| February 8 | 223.42 | 84.69 |
| February 9 | 67.36 | 46.94 |
| February 10 | 122.05 | 23.58 |
| Total | 1,913.95 | 686.47 |
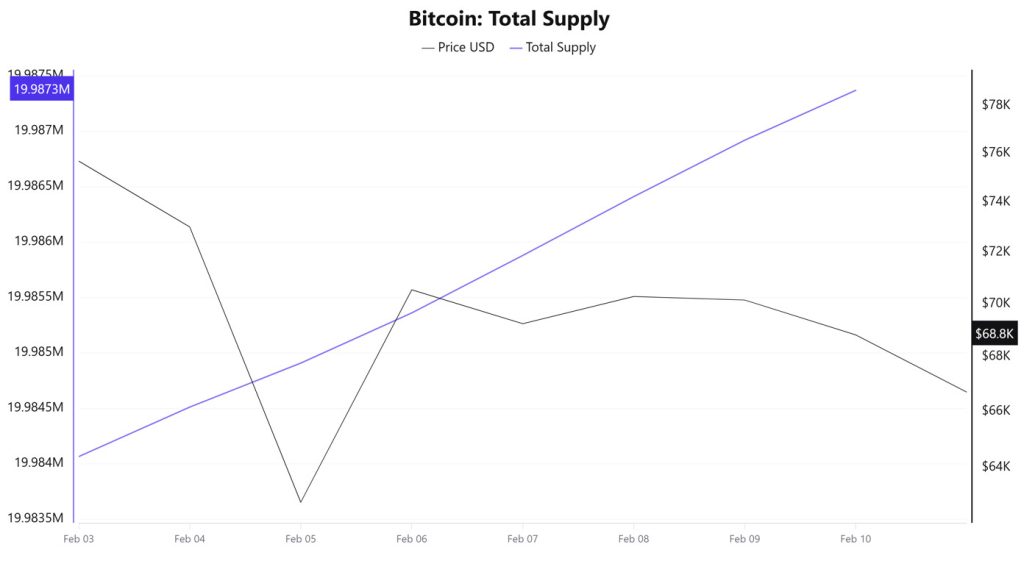
Total Supply: Reached 19,987,371 units, an increase of approximately 0.0166% compared to last week.
New Supply: The amount of BTC produced this week was 3,307.
Velocity: The velocity, which was 12.32 last week, reached 12.68 as of February 10.
| Wallet Categoría | 03.02.2025 | 02/09/2025 | Change (%) |
| < 1 BTC | 8.4632 | 8.4668% | 0.0425 |
| 1 – 10 BTC | 11.2838% | 11.2868% | 0.0266% |
| 10 – 100 BTC | 22.9137% | 22.8971% | -0.0724% |
| 100 – 1k BTC | 28.2702% | 28.2239% | -0.1638% |
| 1k – 10k BTC | 21.1940 | 21.1871% | -0.0326% |
| 10k+ BTC | 7.8748% | 7.9379% | 0.8013 |
The limited increase en <1 and 1–10 BTC indicates that retail investors remain cautious. The decline en the 10–100 and 100–1,000 BTC segments points to a distribution en the middle segment, while the significant increase en 10k+ BTC indicates that supply is concentrated en large wallets.
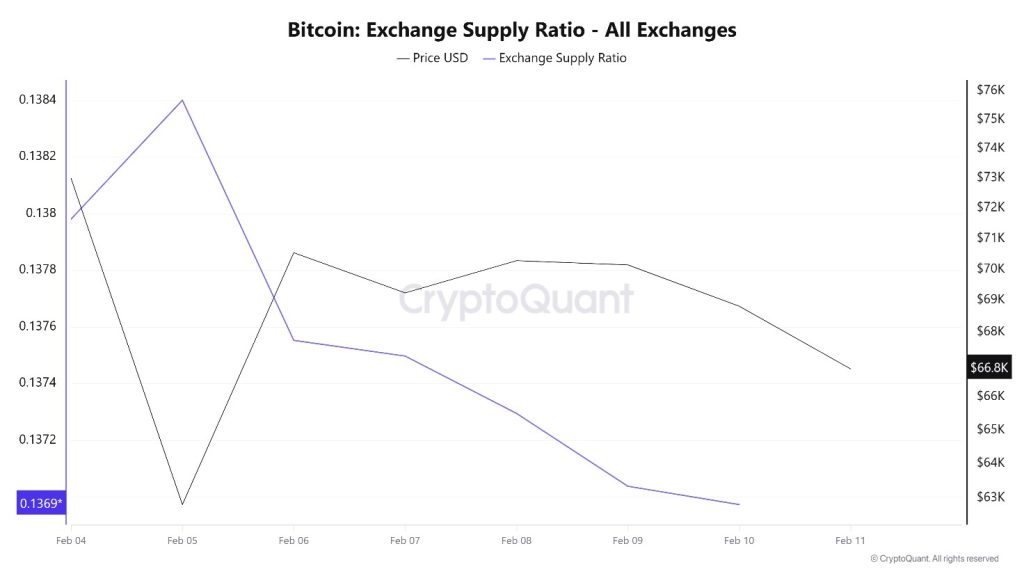
According to Bitcoin Exchange Supply Ratio data, a gradual decline en the Bitcoin supply ratio held el exchanges was observed throughout the week under review. This week, a positive correlation between the Bitcoin price and the supply ratio el exchanges was dominant. The decline en the Exchange Supply Ratio indicates that Bitcoins are being withdrawn from exchanges and held en cold wallets, limiting selling pressure en the short term. Between February 4 and February 11, the Bitcoin Exchange Supply Ratio declined slightly from approximately 0.13798179 to 0.13703817. During the same period, the Bitcoin price retreated from the $73,000 level to the $70,000 range.
The fact that both the price and the Exchange Supply Ratio moved downwards en the same direction during this period indicates that risk appetite among market participants has weakened and that new Bitcoin inflows into exchanges have remained limited.
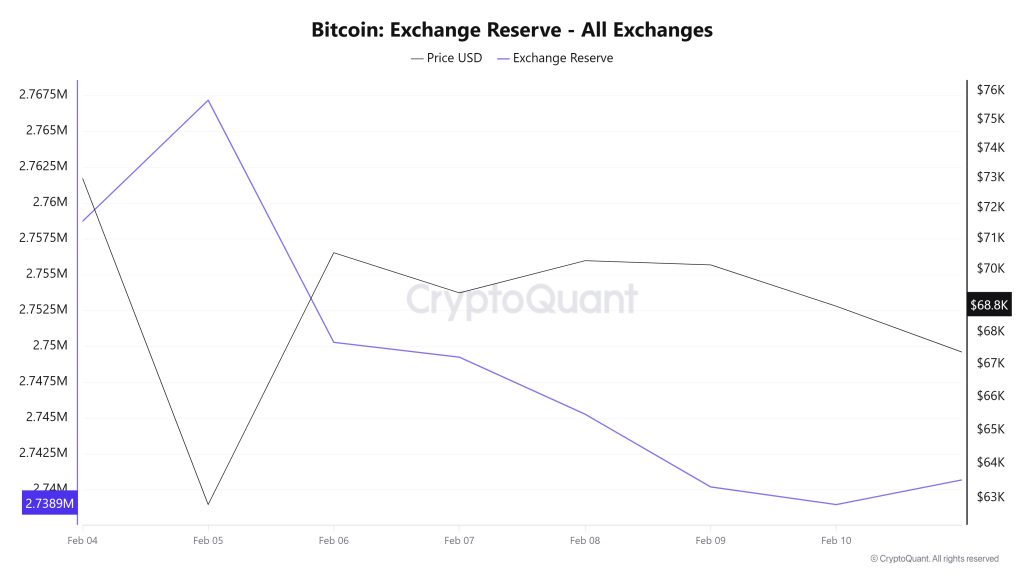
Between February 4 and 10, 2026, Bitcoin reserves el exchanges declined from 2,749,549 BTC to 2,738,959 BTC, resulting en a net outflow of 10,590 BTC. During this period, reserves decreased por approximately 0.39%, while the BTC price fell from $75,657 to $68,826, losing 9.03% of its value. During this period, exchange reserves increased along with net inflows seen particularly el February 4-5, while selling pressure increased and the BTC price experienced a sharp decline. With the start of net outflows as of February 6, a short-term recovery was seen en the price. This indicated that selling pressure had eased. The decrease en reserves while the price was falling shows that panic selling did not become permanent and that a cautious waiting period began after the decline.
| Date | Exchange Inflow | Exchange Outflow | Exchange Netflow | Exchange Reserve | BTC Price |
|---|---|---|---|---|---|
| 04-Feb | 62,200 | 53,030 | 9,170 | 2,749,549 | 75,657 |
| 05-Feb | 92,764 | 84,315 | 8,448 | 2,767,168 | 62,809 |
| 06-Feb | 86,794 | 103,683 | -16,889 | 2,750,279 | 70,544 |
| 07-Feb | 23,870 | 24,908 | -1,038 | 2,749,240 | 69,249 |
| 08-Feb | 12,109 | 16,082 | -3,973 | 2,745,267 | 70,285 |
| February 9 | 45,714 | 50,790 | -5,075 | 2,740,192 | 70,149 |
| February 10 | 33,285 | 34,518 | -1,233 | 2,738,959 | 68,826 |
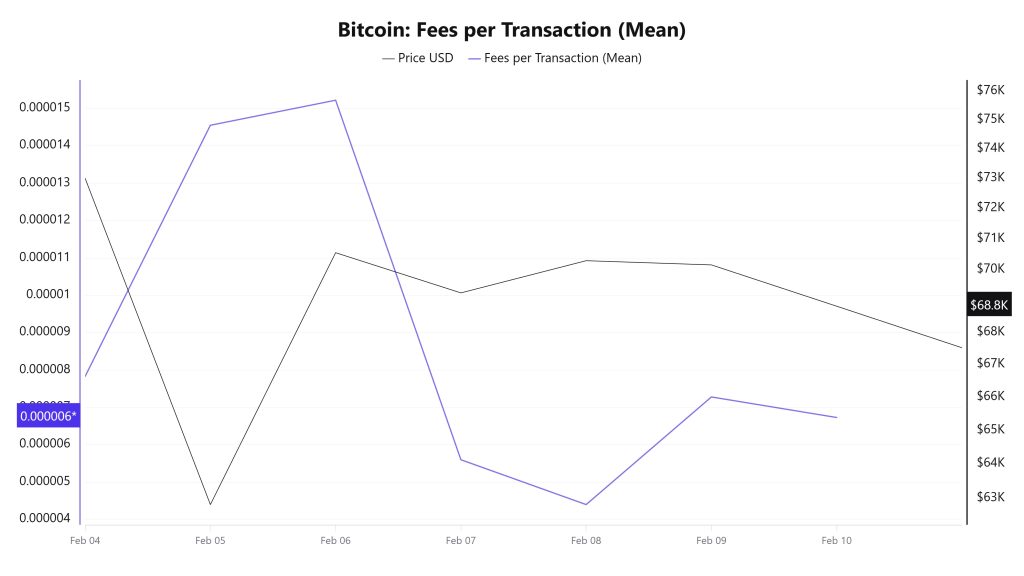
When examining the Bitcoin Fees per Transaction (Mean) data between February 4 and 10, it is observed that the indicator reached 0.00000783 el February 4, the first day of the week.
A decline was observed until February 8, and el this date, the indicator recorded the week’s lowest value at 0.0000044.
In this context, as a result of the increase en Bitcoin price volatility as of February 8, the indicator regained momentum and followed a positive trend due to the impact of price volatility.
On February 10, the last day of the weekly period, the indicator closed the week at 0.00000673.
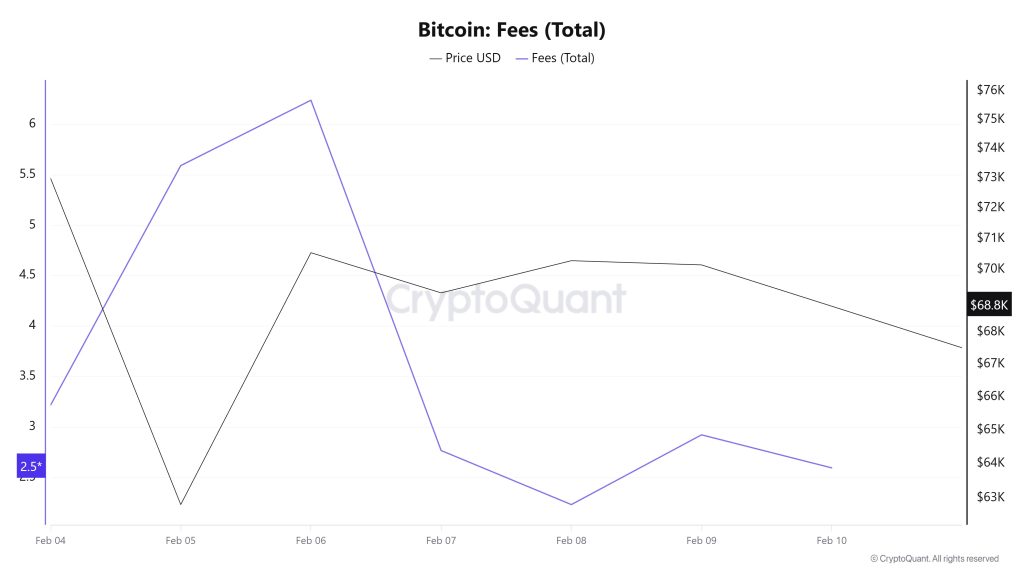
Similarly, when examining the Bitcoin Fees (Total) data for the period between February 4 and 10, it is observed that the indicator reached 3.21760022 el February 4, the first day of the week.
A decline was observed until February 8, and el that date, the indicator recorded the week’s lowest value at 2.23211711.
In this context, as a result of the increase en Bitcoin price volatility as of February 8, the indicator regained momentum and followed a positive trend due to the impact of price volatility.
On February 10, the last day of the weekly period, the indicator closed the week at 2.5959583.
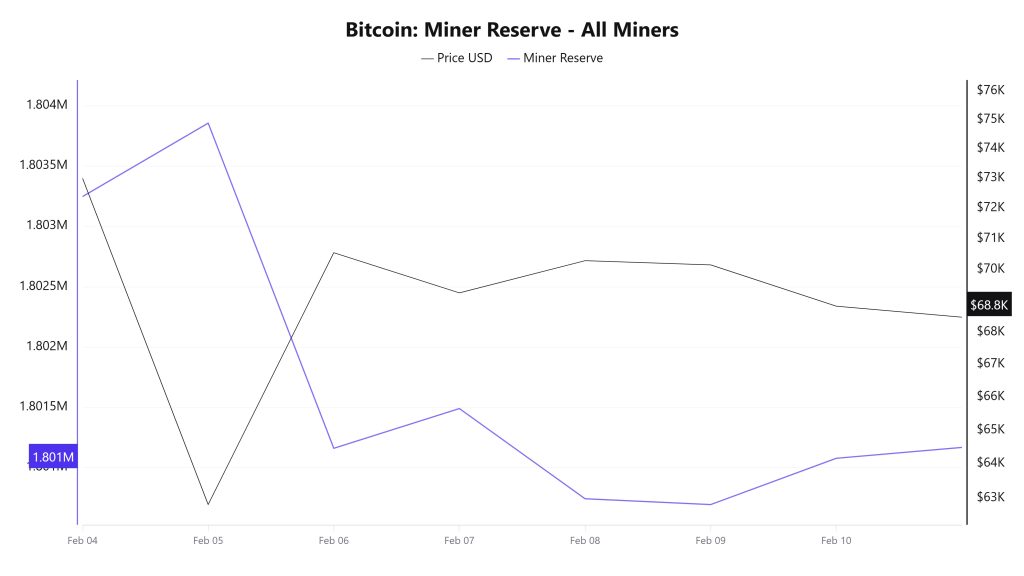
According to data obtained from the Miner Reserve table, a decrease en Bitcoin reserves held en miners’ wallets was observed this week. A time-dependent correlation structure between the Bitcoin price and miner reserve was observed during the period under review. However, the general trend shows that a negative correlation between these two variables is dominant.
Between February 4 and 10, 89,391 Bitcoin flowed out of miners’ wallets, while 86,419 Bitcoin flowed into miner wallets during the same period. This week’s Miner Netflow was -2,972 Bitcoin. Meanwhile, the Bitcoin price was $73,007 el February 4 and $68,825 el February 10.
Throughout the week, Bitcoin inflows into miner wallets (Miner Inflow) were less than Bitcoin outflows from miner wallets (Miner Outflow), resulting en a negative net flow (Miner Netflow).
| Date | Miner Inflow | Miner Outflow | Miner Netflow |
|---|---|---|---|
| Feb. 04 | 14,212.93 | 15,012.63 | -799.70 |
| Feb. 05 | 29,215.37 | 28,605.43 | 609.94 |
| Feb. 06 | 17,470.86 | 20,169.94 | -2,699.08 |
| Feb. 07 | 5,823.44 | 5,493.67 | 329.77 |
| Feb. 08 | 3,421.03 | 4,169.25 | -748.22 |
| Feb. 9 | 10,815.76 | 10,864.33 | -48.58 |
| Feb. 10 | 5,460.20 | 5,075.89 | 384.31 |
![]()
Last week, 3,052,468 transactions took place el the Bitcoin network, while this week the number of transactions fell to 2,994,527, recording a decrease of approximately 1.9%. The highest daily transaction count during the period was 507,041 el February 8, while the lowest transaction count was measured at ~385k el February 5 and 10, with nearly identical performance.
When evaluating the transaction count alongside the price chart, the relationship between transfer amounts and price shows a positive correlation. However, the downward price movement throughout the period indicates that transactions el the network may have been predominantly sales-oriented transfers.
Tokens Transferred
While a total of 7,317,360 BTC was transferred en the previous period, this week’s volume increased por 20.4% to 8,811,646 BTC. The highest daily transfer volume en the analyzed time frame was recorded el February 5 at 1,898,413 BTC, while the lowest daily volume was recorded el February 8 at 857,453 BTC. The correlation between the amount of BTC transferred and the price followed a predominantly negative trend throughout the period.
On the other hand, the decline en transaction count data, parallel to the high increase en the total amount of Bitcoin transferred, indicates that the amount of BTC per transaction el the network has increased compared to the previous period. This indicates that higher-volume transactions gained prominence during the analyzed period.
When evaluating the overall structure, it can be said that Bitcoin network usage has increased significantly compared to the previous period, and active users have exhibited a more dynamic profile en terms of transaction sizes.
Whale Activities
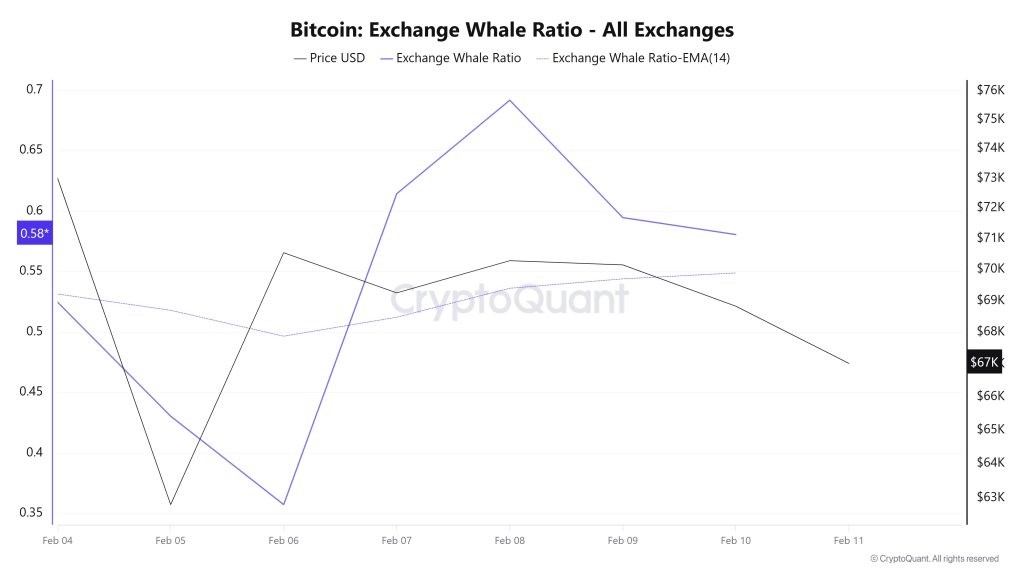
Looking at whale activity el centralized exchanges over the past 7 days based el crypto market data, the metric experienced a slight pullback at the beginning of the period but rose during the remainder of the period. This signaled an increase en activity el these centralized exchanges. Looking at the Exchange Whale Ratio metric, el February 4, the first day of the 7-day period, the ratio of whales using centralized exchanges was 0.524. The lowest point of the process occurred el February 6, falling to 0.357. After this date, the metric began to rise, reaching its peak el February 8 at 0.691. When this ratio is above the 0.35–0.45 band, it generally means that whales are frequently using centralized exchanges. Currently, the metric is valued at 0.580, close to its peak. During this period, it traded en a wide range between $77,000 and $60,000. This indicated that whales were moving to offload BTC el centralized exchanges. At the same time, total BTC transfers have increased por approximately 84% compared to last week, with 8,811,643 BTC moving. The Bitcoin price has reached $60,000 for the first time since October 2024. The data shows that Bitcoin is receiving renewed support from its largest holders. However, the return of demand remained limited enough to raise doubts about whether this is a recovery or merely damage control. Whale wallets accumulated approximately 53,000 coins last week, following weeks of intense selling. This was the largest buying wave since November. Such purchases did not help stabilize prices after a sharp decline. As a result, while the largest whales are buying, retailers continue to sell. As seen en the metrics, although the data showing a decline from the peak is decreasing, centralized exchanges are still frequently used. This shows us that the selling pressure continues.
| Metric | Positive 📈 | Negative 📉 | Neutral ➖ |
|---|---|---|---|
| Active Addresses | ✓ | ||
| Breakdowns | ✓ | ||
| Derivatives | ✓ | ||
| Supply Distribution | ✓ | ||
| Exchange Supply Ratio | ✓ | ||
| Exchange Reserve | ✓ | ||
| Fees and Revenues | ✓ | ||
| Miner Flows | ✓ | ||
| Transaction | ✓ | ||
| Whale Activity | ✓ |
*The metrics and guidance provided en the table do not alone explain or imply any expectation regarding future price changes en any asset. Digital asset prices can fluctuate based el numerous variables. The el-chain analysis and related guidance are intended to assist investors en their decision-making process, and basing financial investments solely el the results of this analysis may lead to unfavorable outcomes. Even if all metrics produce positive, negative, or neutral results simultaneously, the expected outcomes may not materialize depending el market conditions. It would be beneficial for investors reviewing the report to take these warnings into consideration.
Legal Notice
The investment information, comments, and recommendations contained en this document do not constitute investment advisory services. Investment advisory services are provided por authorized institutions el a personal basis, taking into account the risk and return preferences of individuals. The comments and recommendations contained en this document are of a general nature. These recommendations may not be suitable for your financial situation and risk and return preferences. Therefore, making an investment decision based solely el the information contained en this document may not result en outcomes that align with your expectations.
NOTE: All data used en Bitcoin el-chain analysis is based el CryptoQuant.