
Weekly Bitcoin Onchain Report
Active Addresses
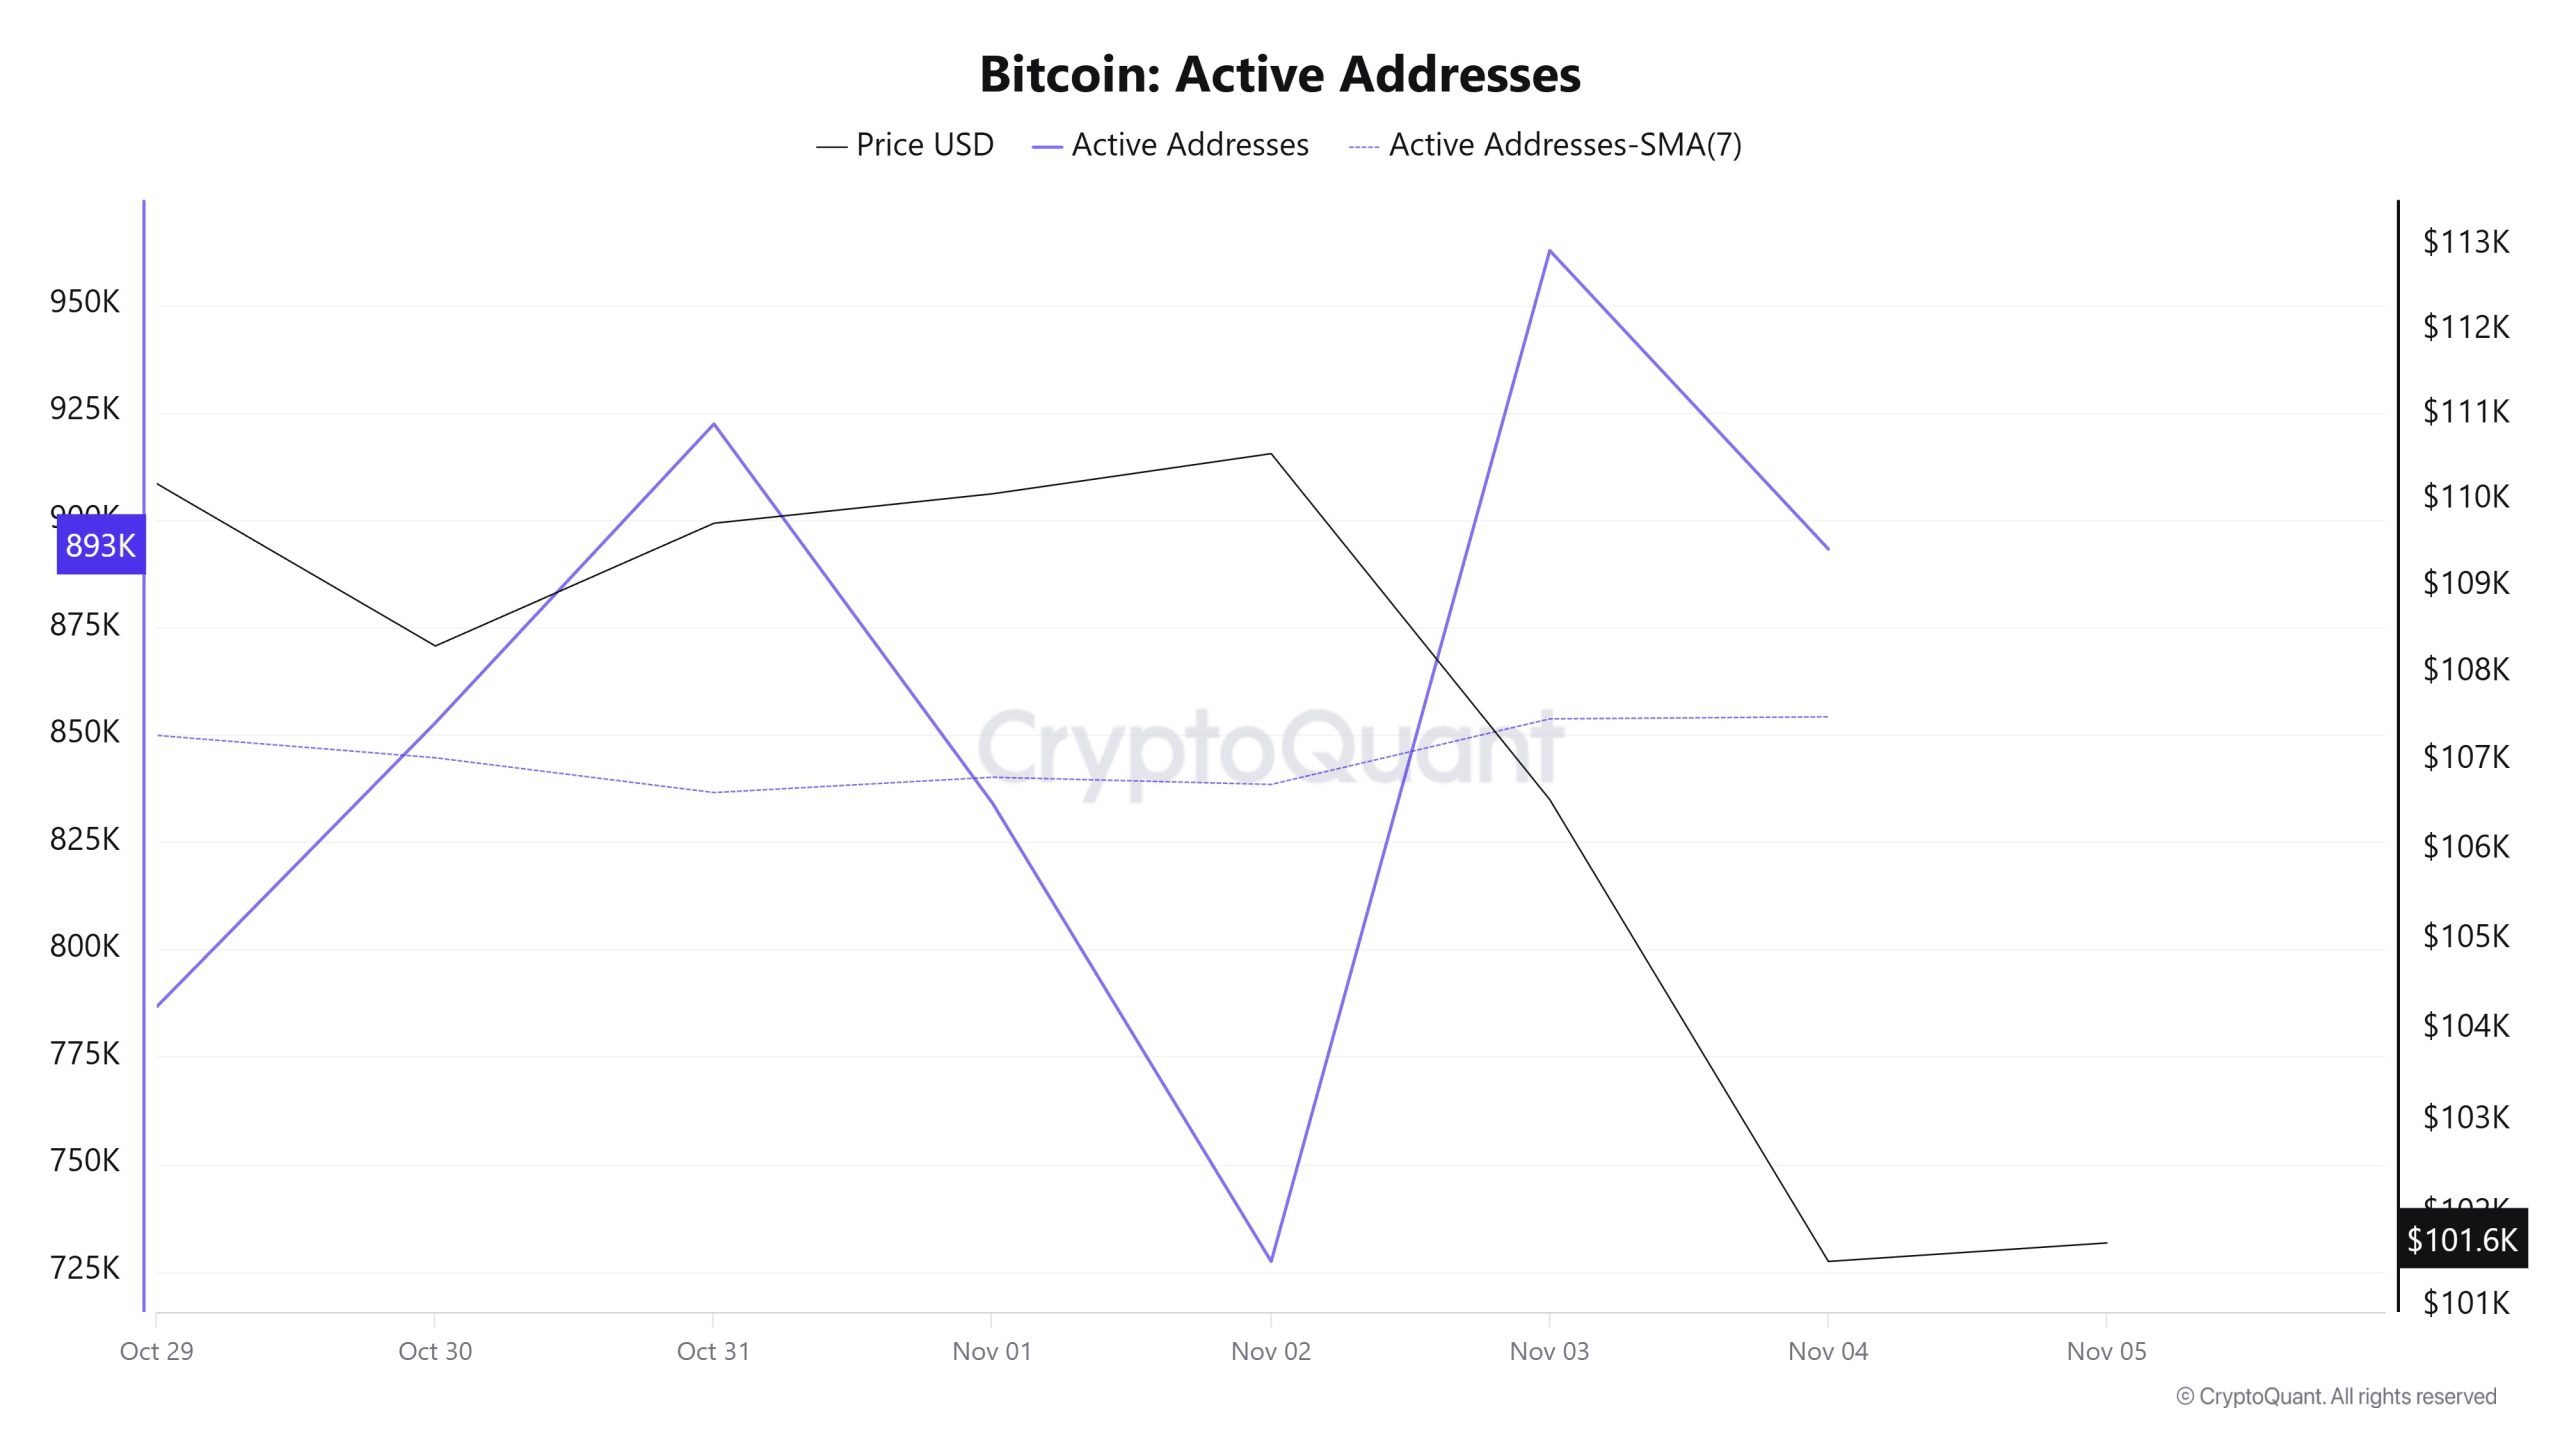
Between October 29 and November 5, 962,705 active addresses were added to the Bitcoin network. During this period, the Bitcoin price dropped to $101,000. Notably, while the number of active addresses increased el November 2, the Bitcoin price fell to $101,000. From a technical perspective, the 7-day simple moving average (SMA) shows horizontal movements.
Active Sending Addresses
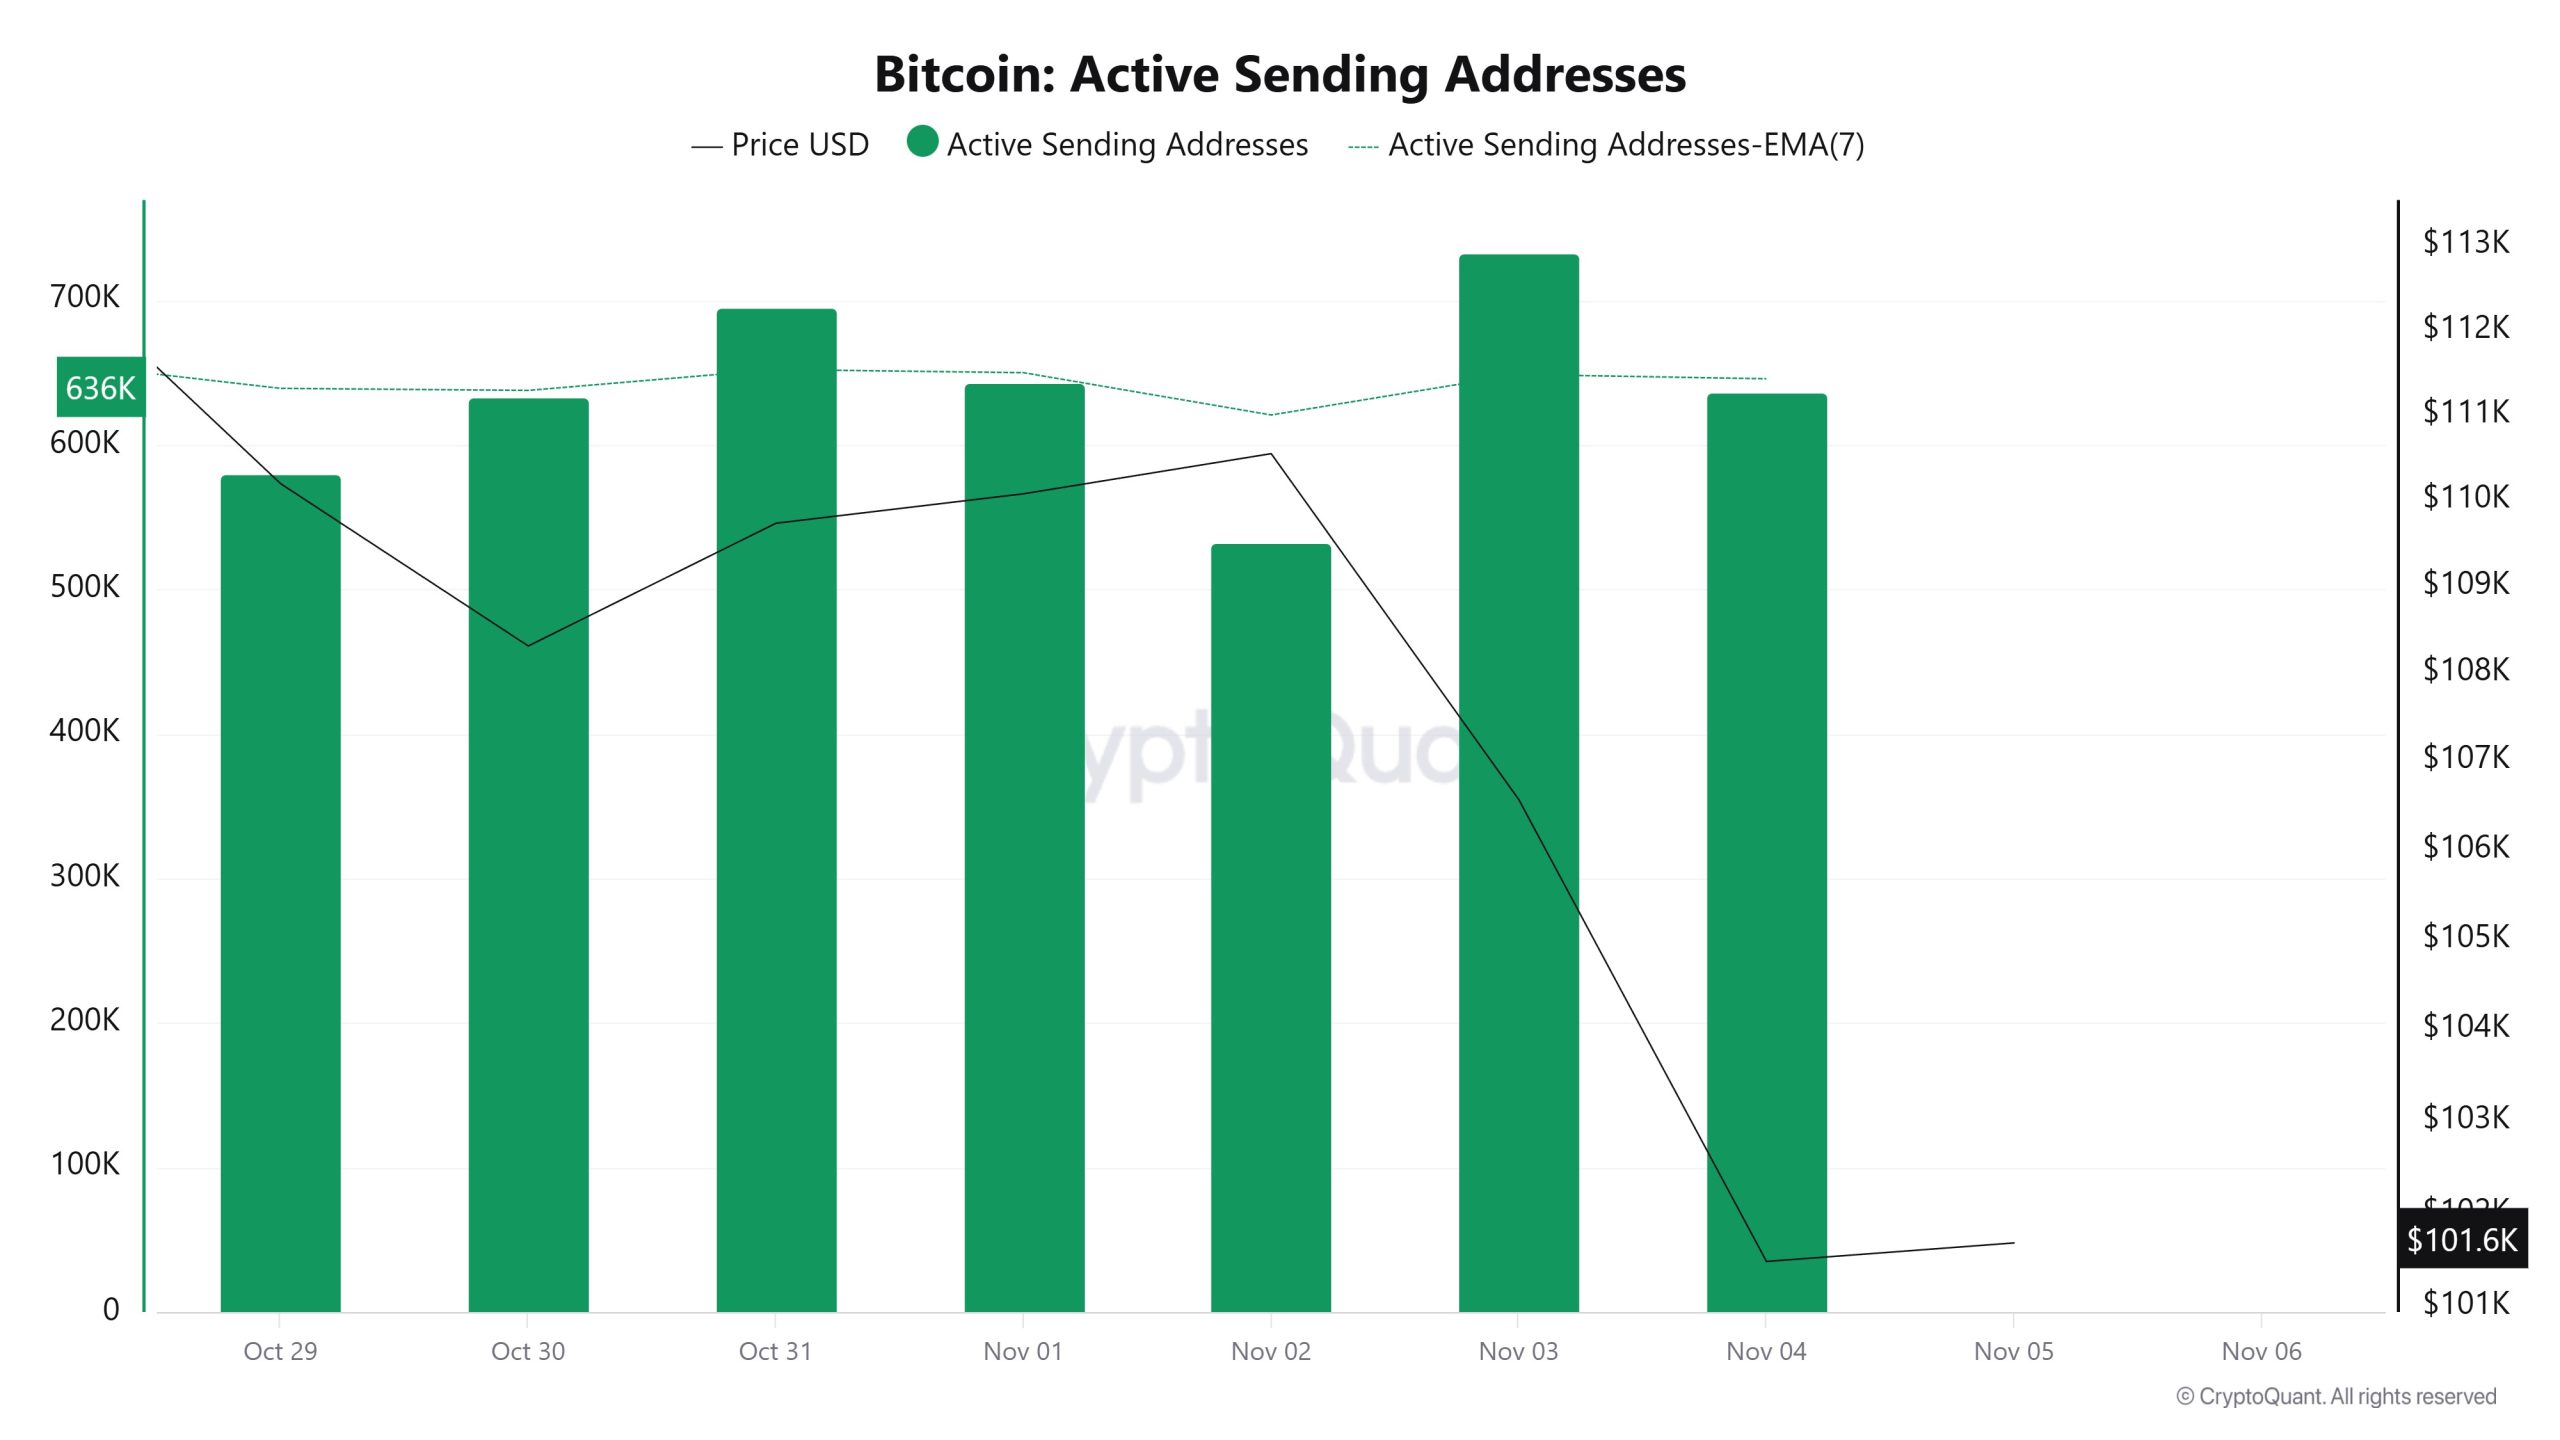
Between October 29 and November 5, an upward trend was observed en the “active sending addresses” metric. On the day the price reached its highest level, this metric stood at 732,744, indicating that user activity el the Bitcoin network was moving en parallel with the price. This data indicates that the $101,000 level is supported not only por price but also por el-chain address activity, as shown at . Overall, the Active Sending Addresses metric followed a high trajectory during this period.
Active Receiving Addresses
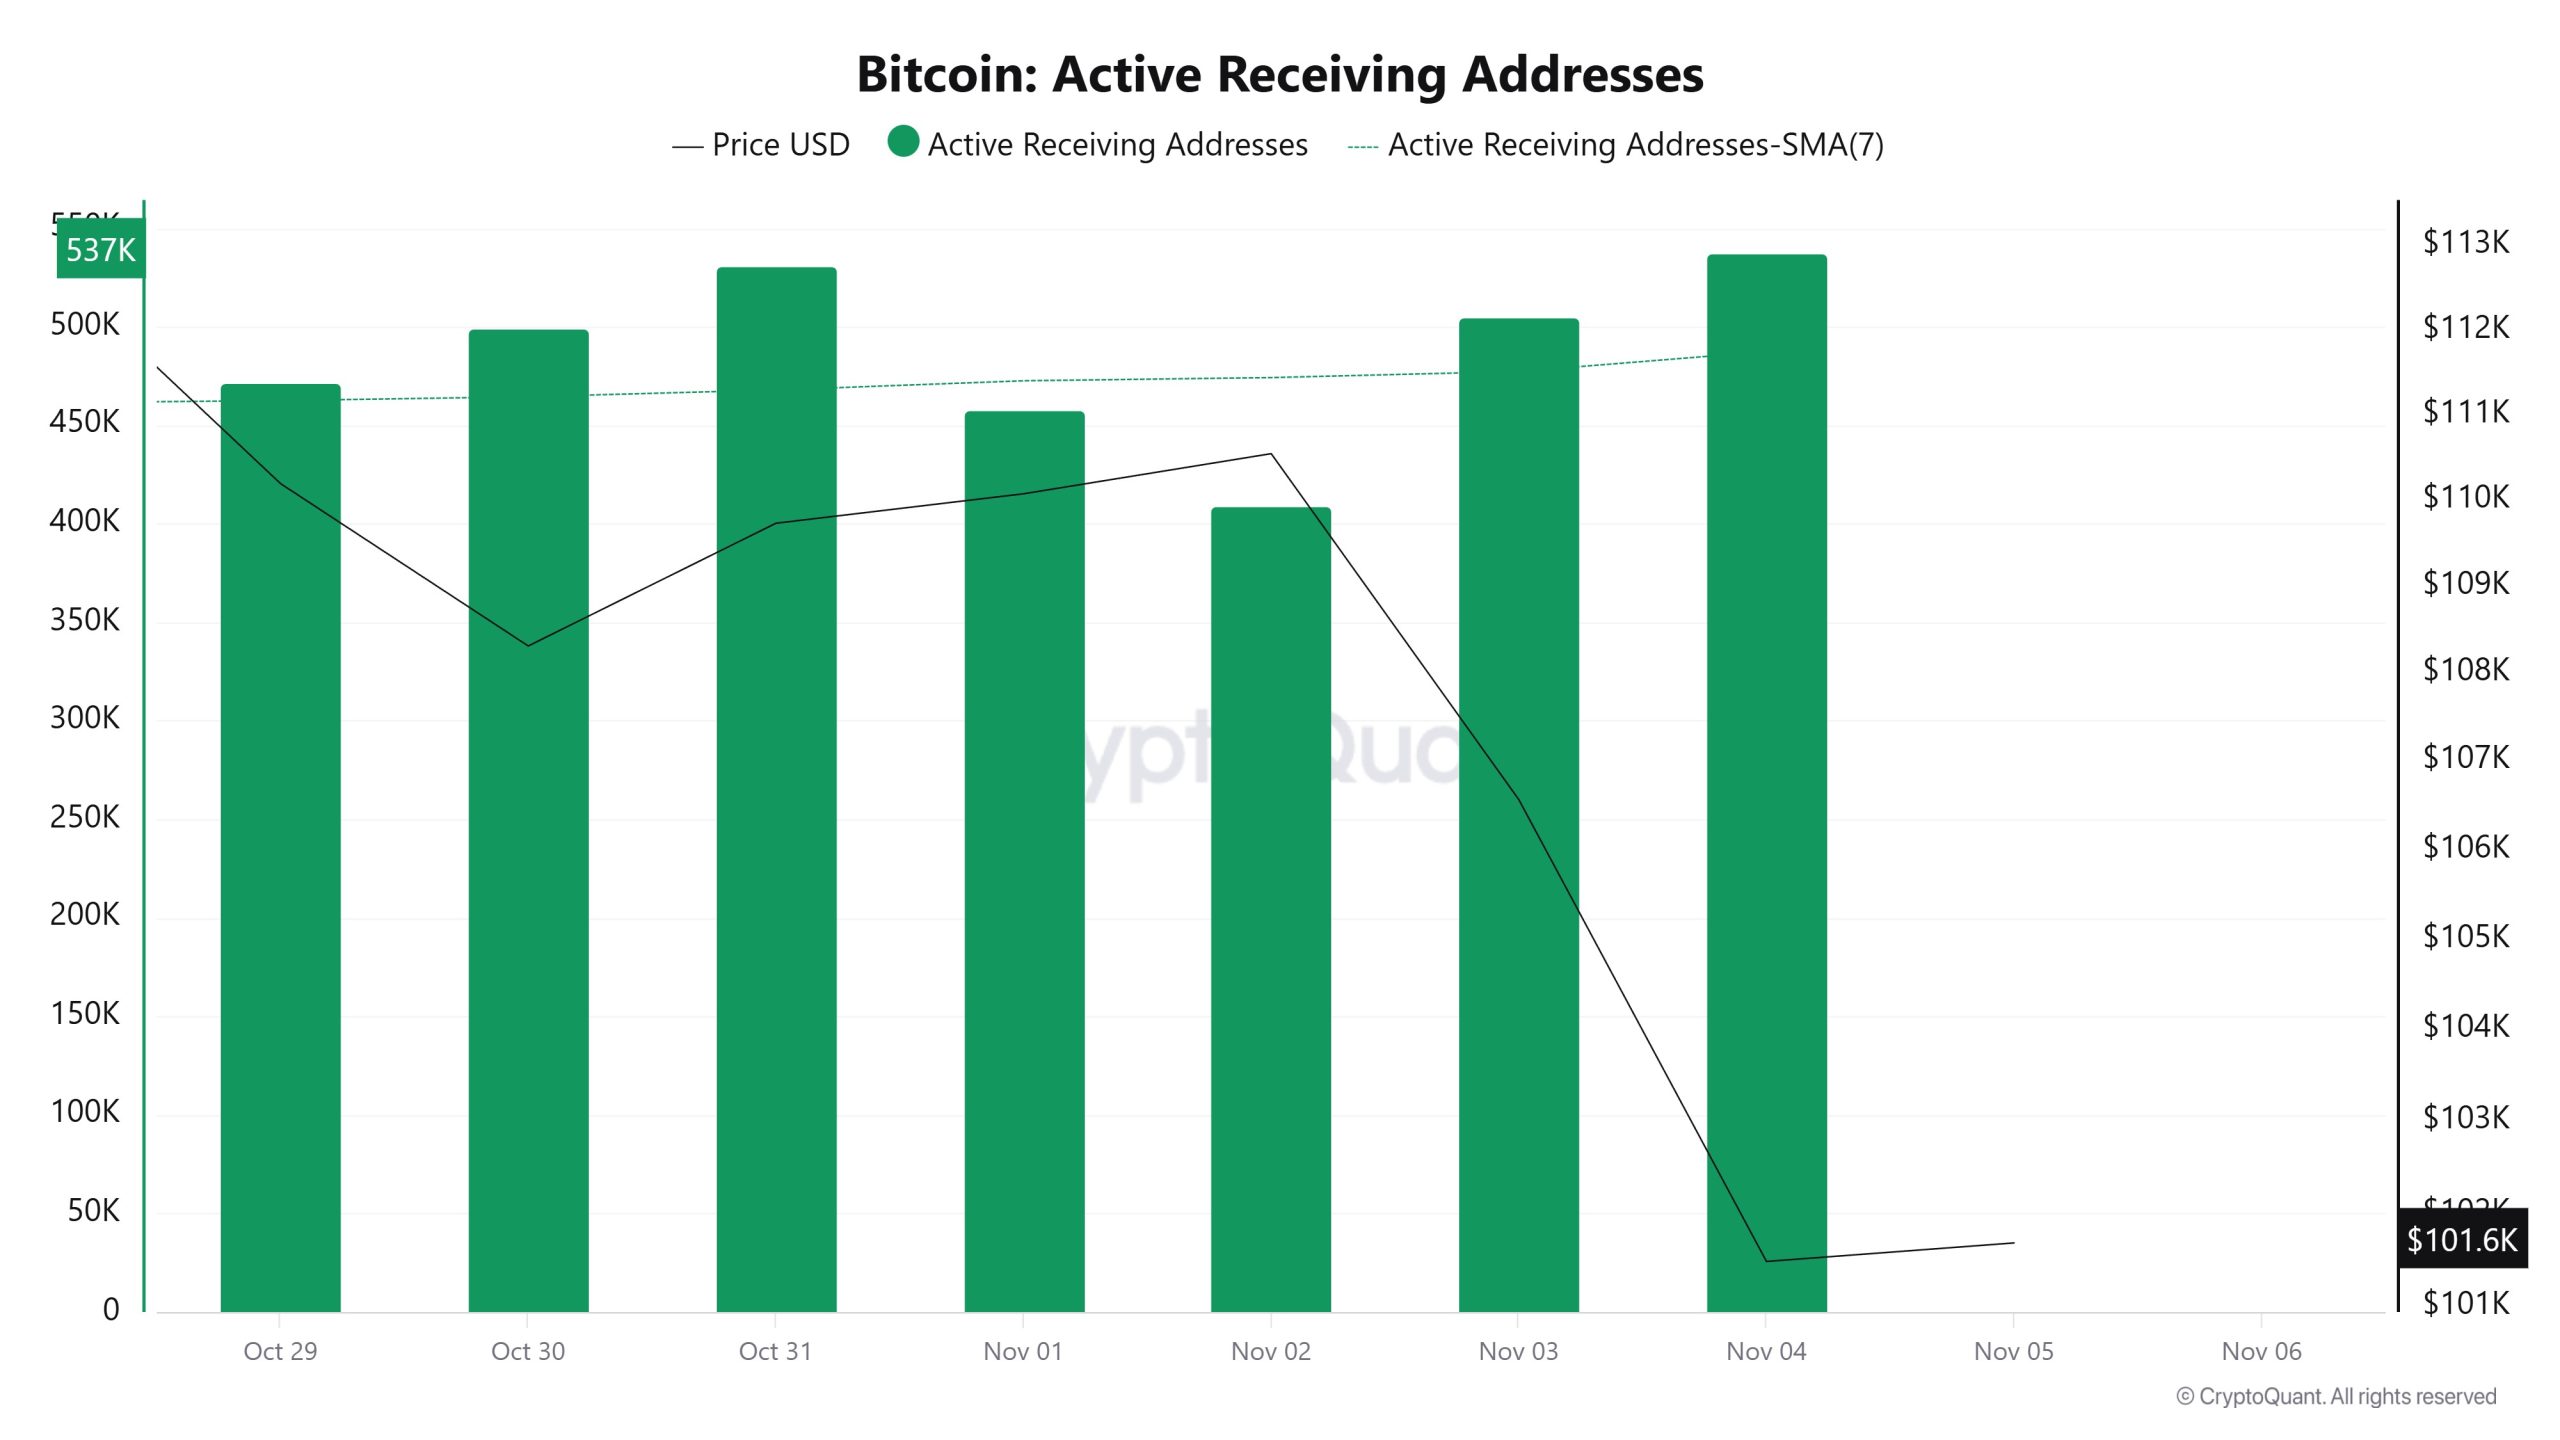
Between October 29 and November 5, active buying addresses experienced a normal rise along with the Black Line (price line). On the day the price reached its peak, active buying addresses rose to 537,359 levels, indicating that buyers purchased Bitcoin at around $111,000 levels.
Breakdowns
MVRV
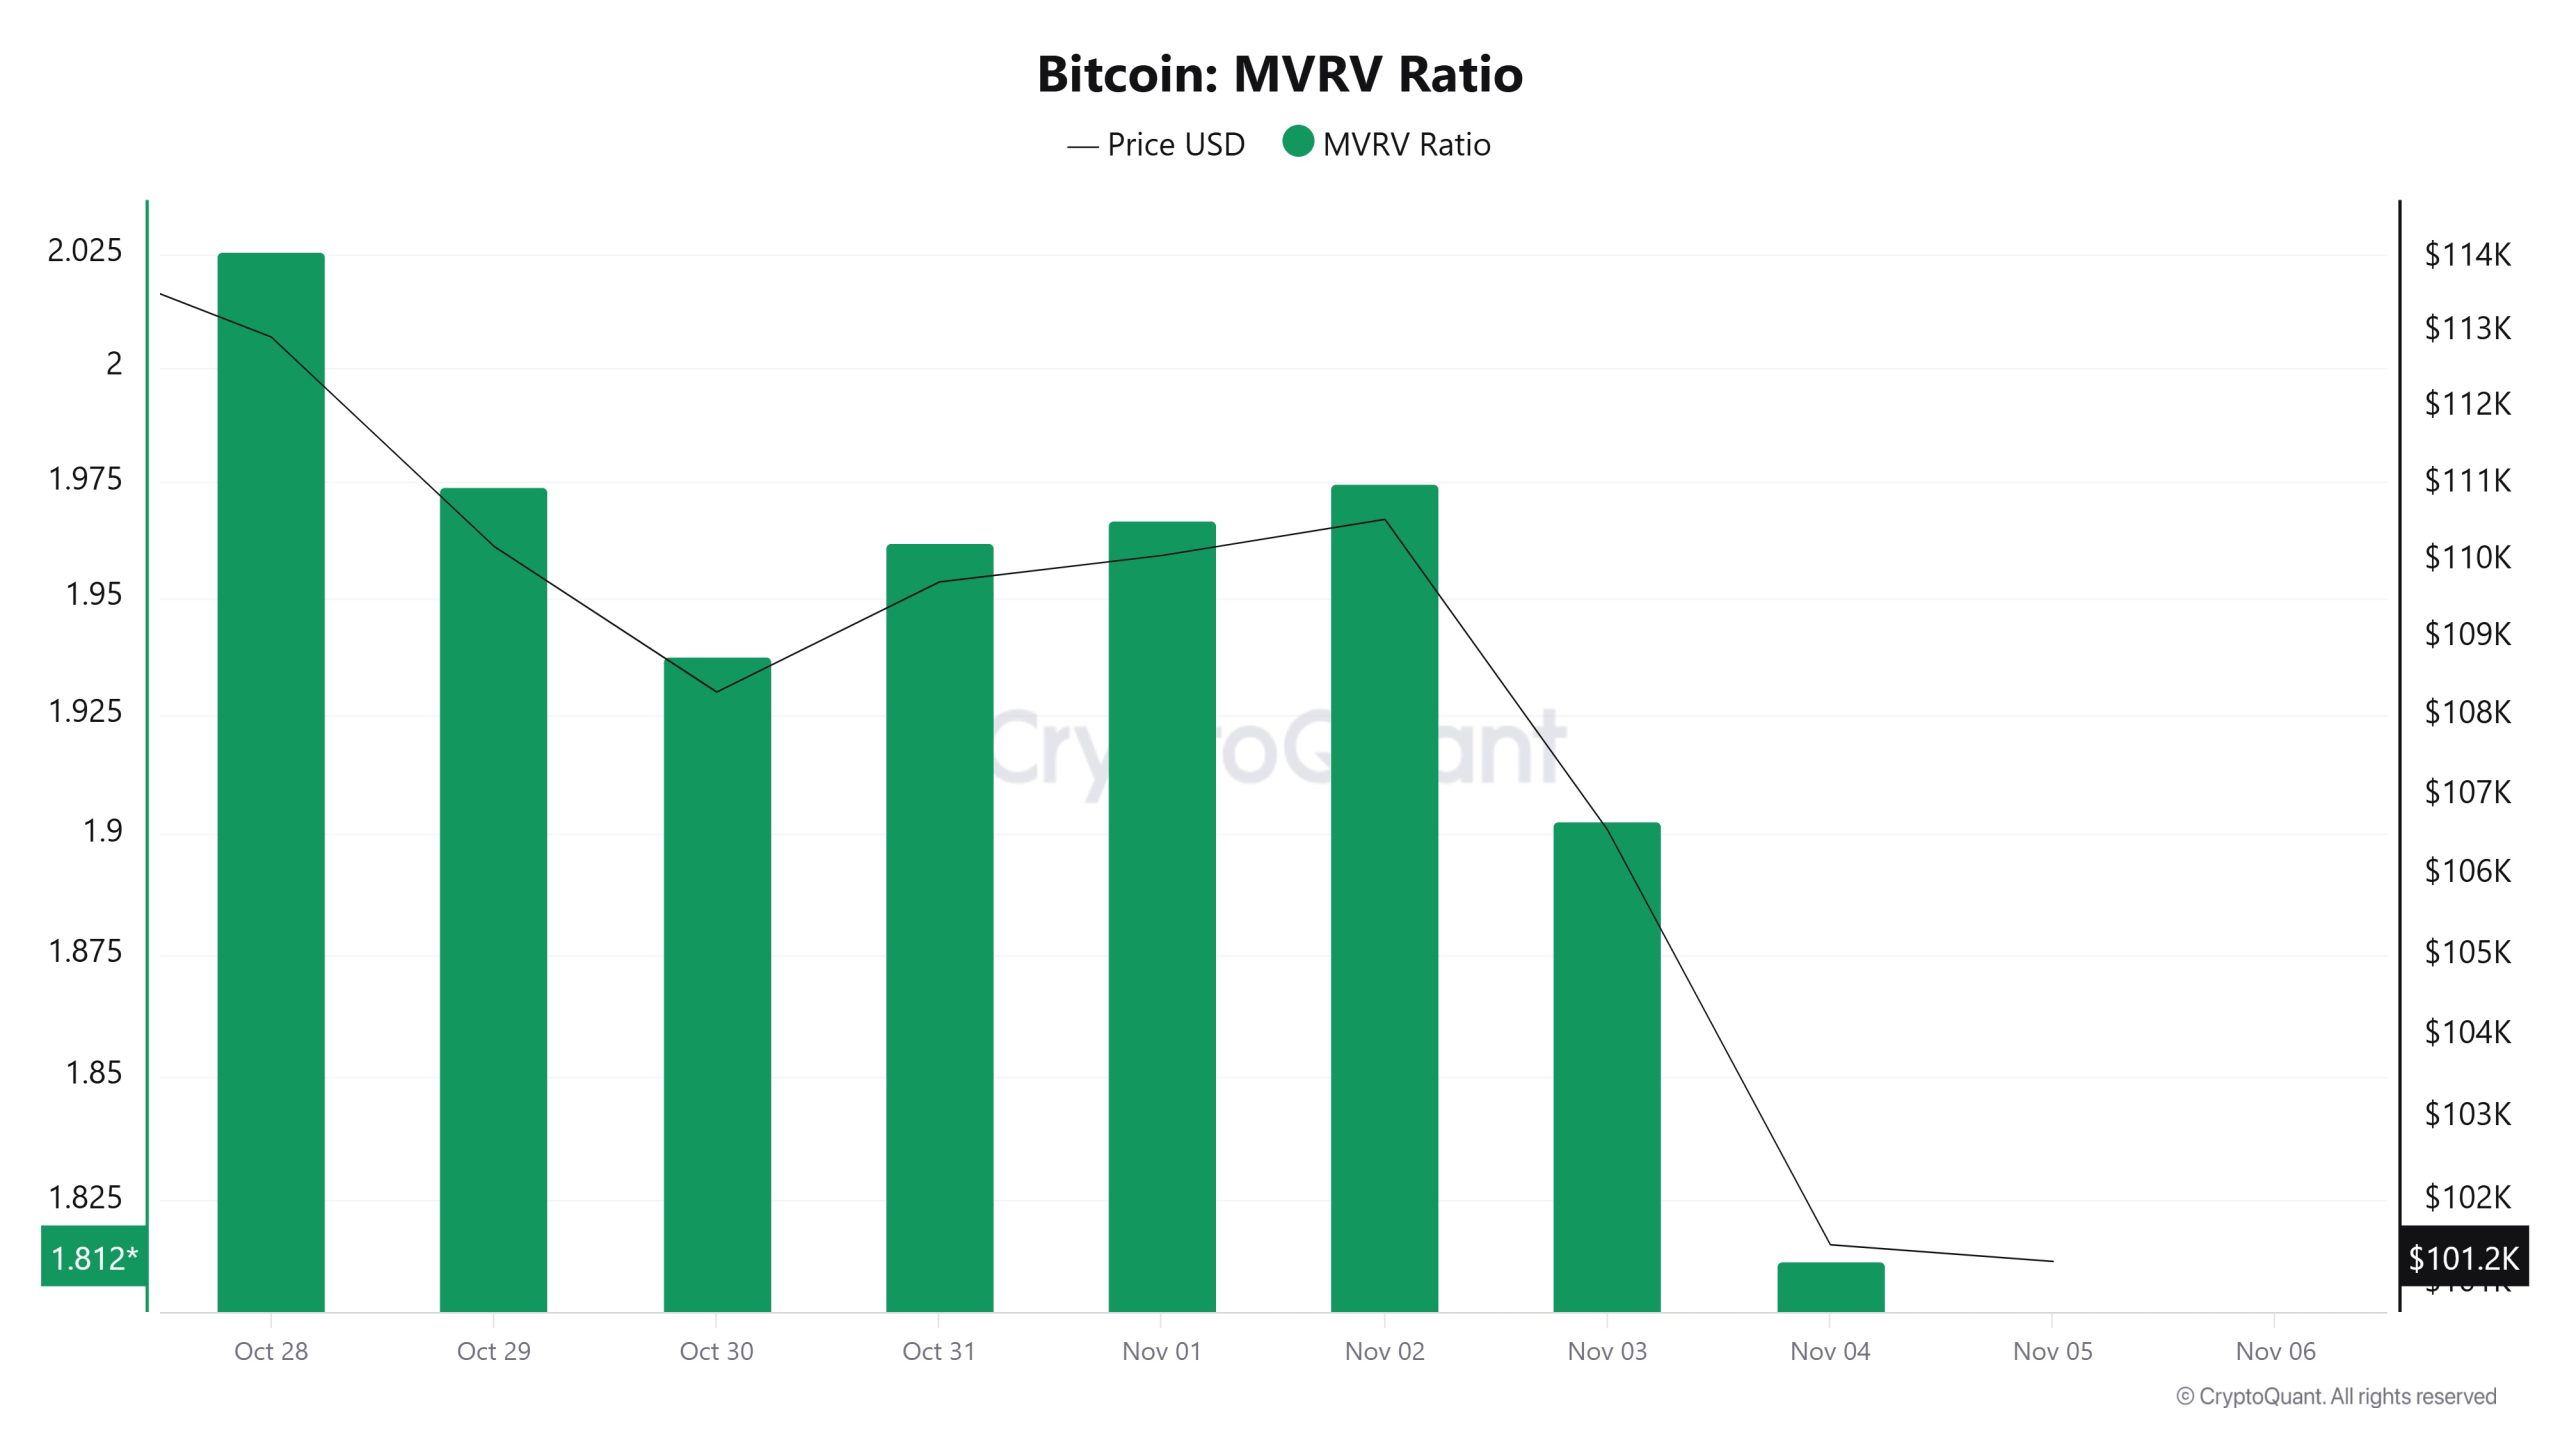
On October 29, while the Bitcoin price was trading at $110,186, the MVRV Ratio stood at 1.973.
As of November 4, the Bitcoin price fell to $101,475, recording a 7.91% decline, while the MVRV Ratio fell to 1.812, recording an 8.16% decline.
Realized Price
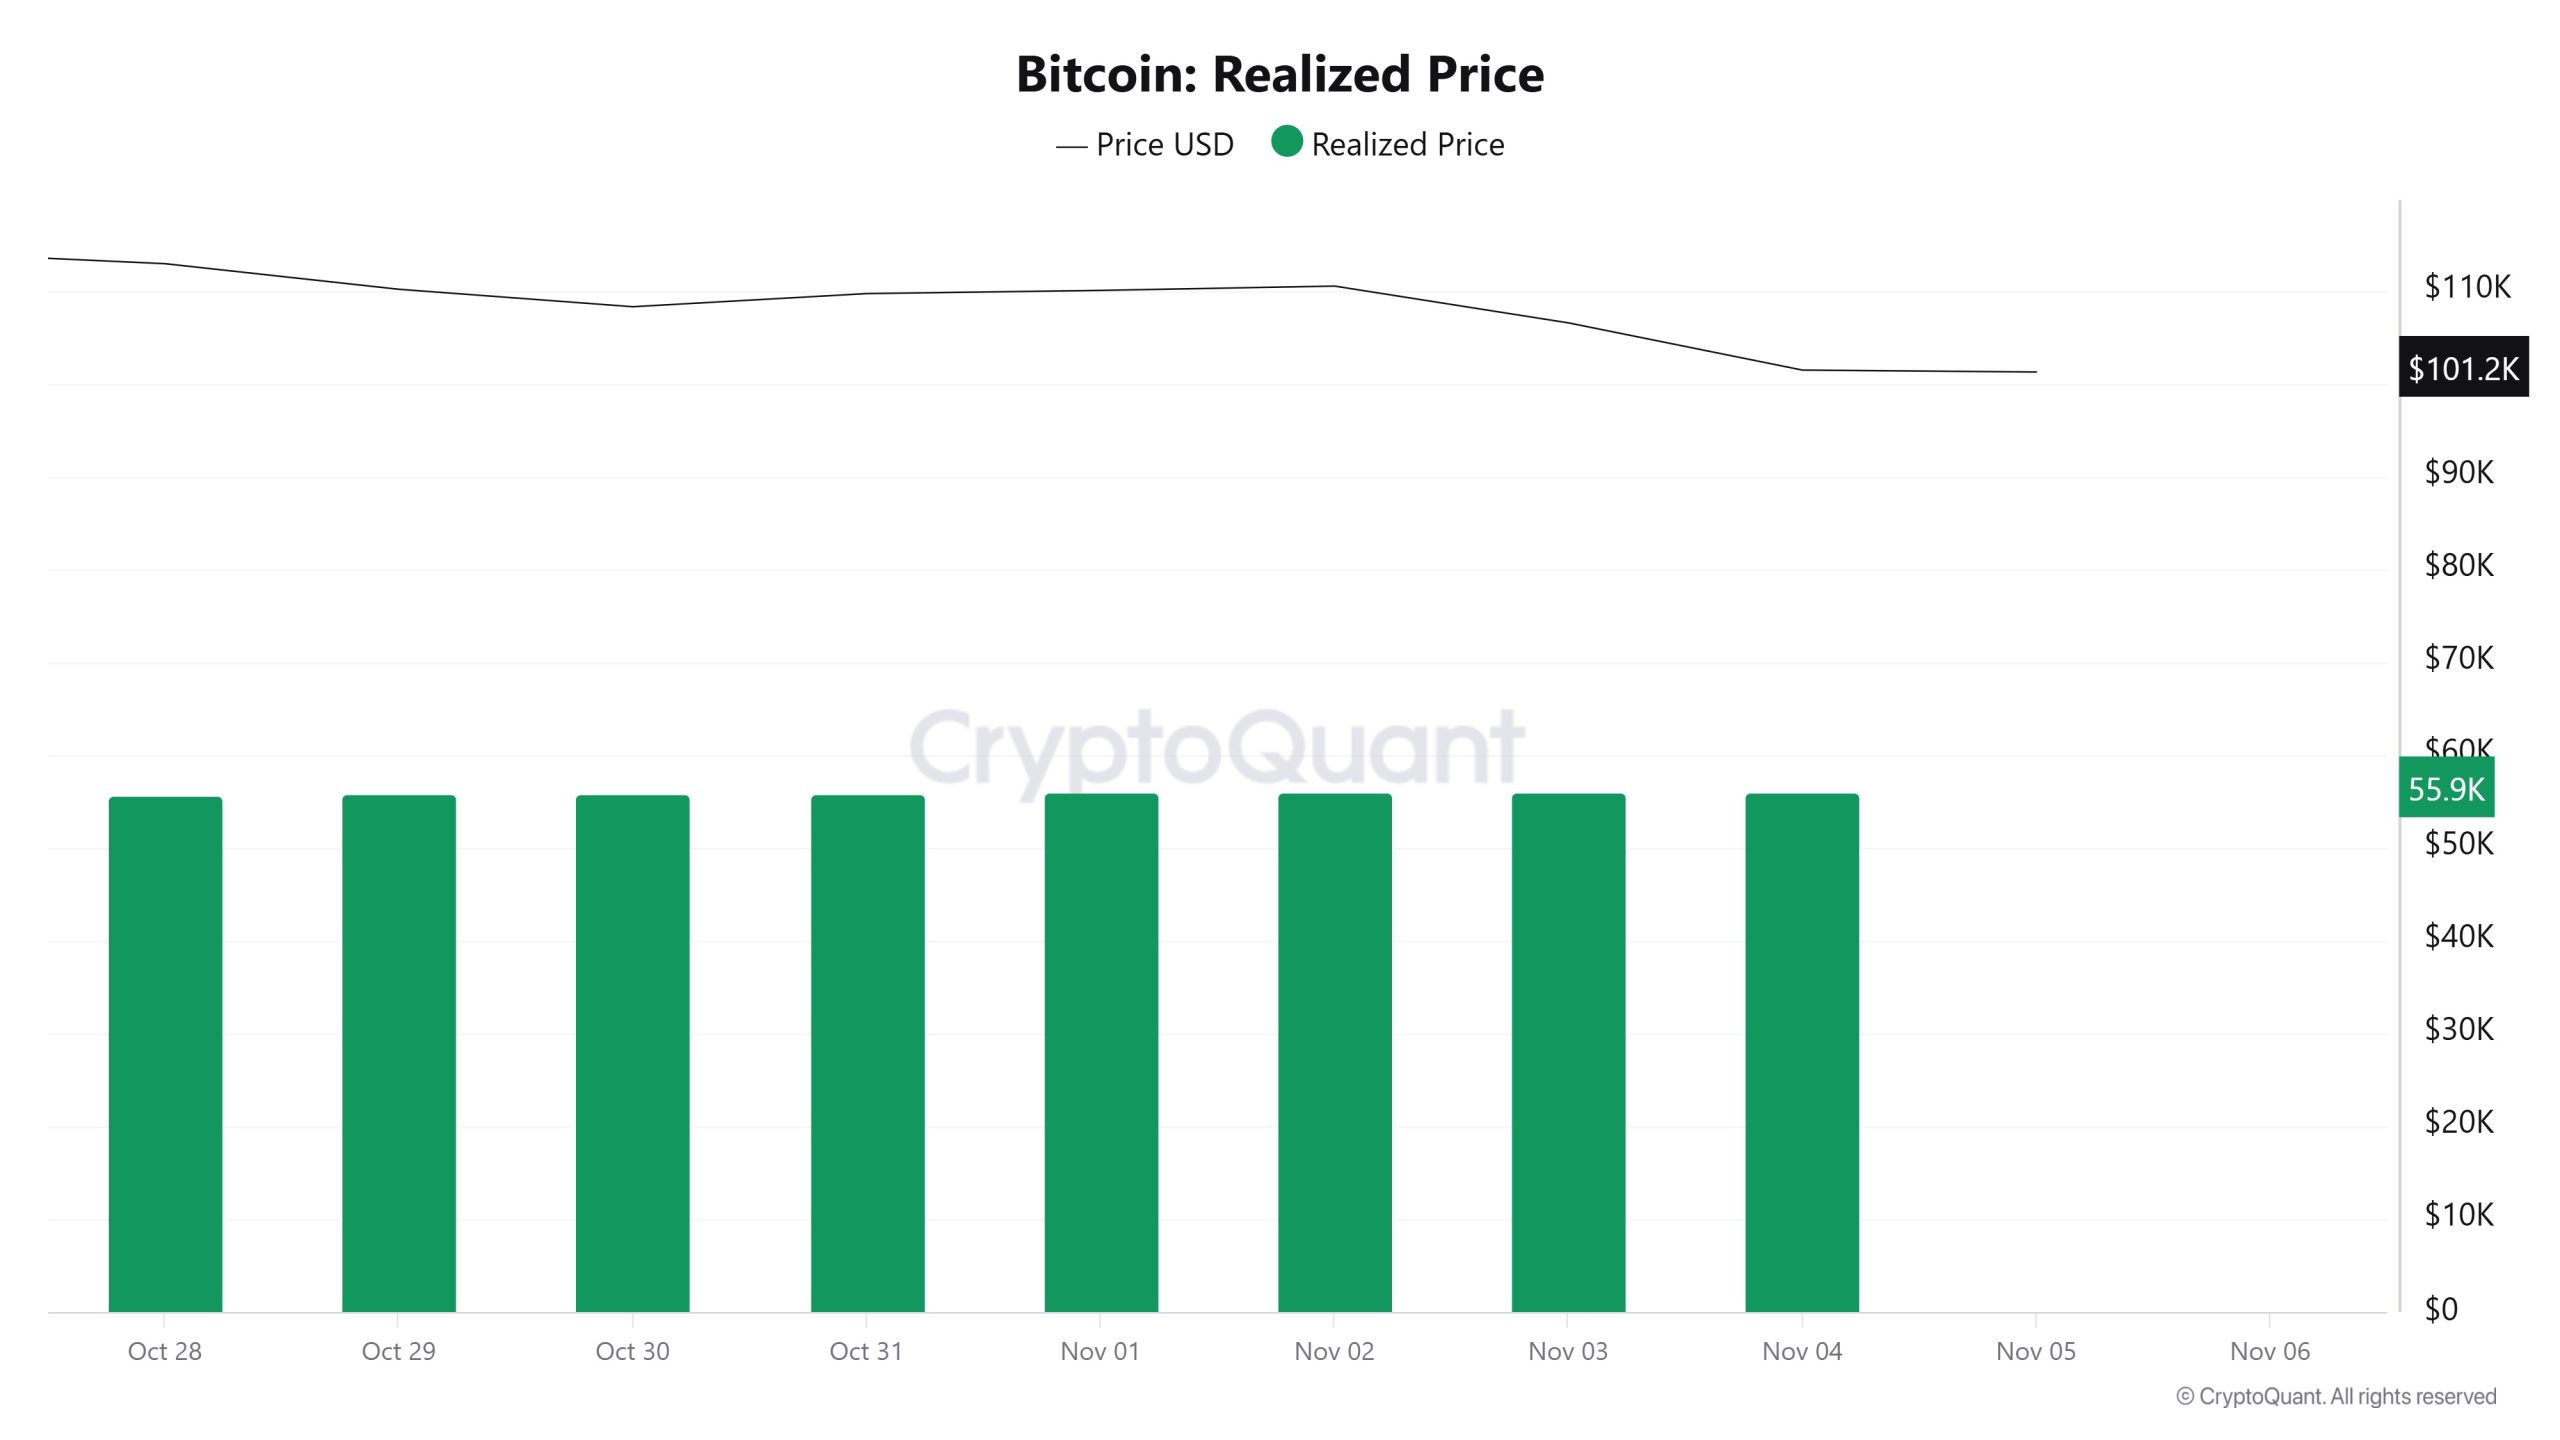
On October 29, while the Bitcoin price was trading at $110,186, the Realized Price stood at $55,824.
As of November 4, the Bitcoin price fell to $101,475, while the Realized Price rose to $55,976, recording a 0.27% increase.
Spent Output Profit Ratio (SOPR)
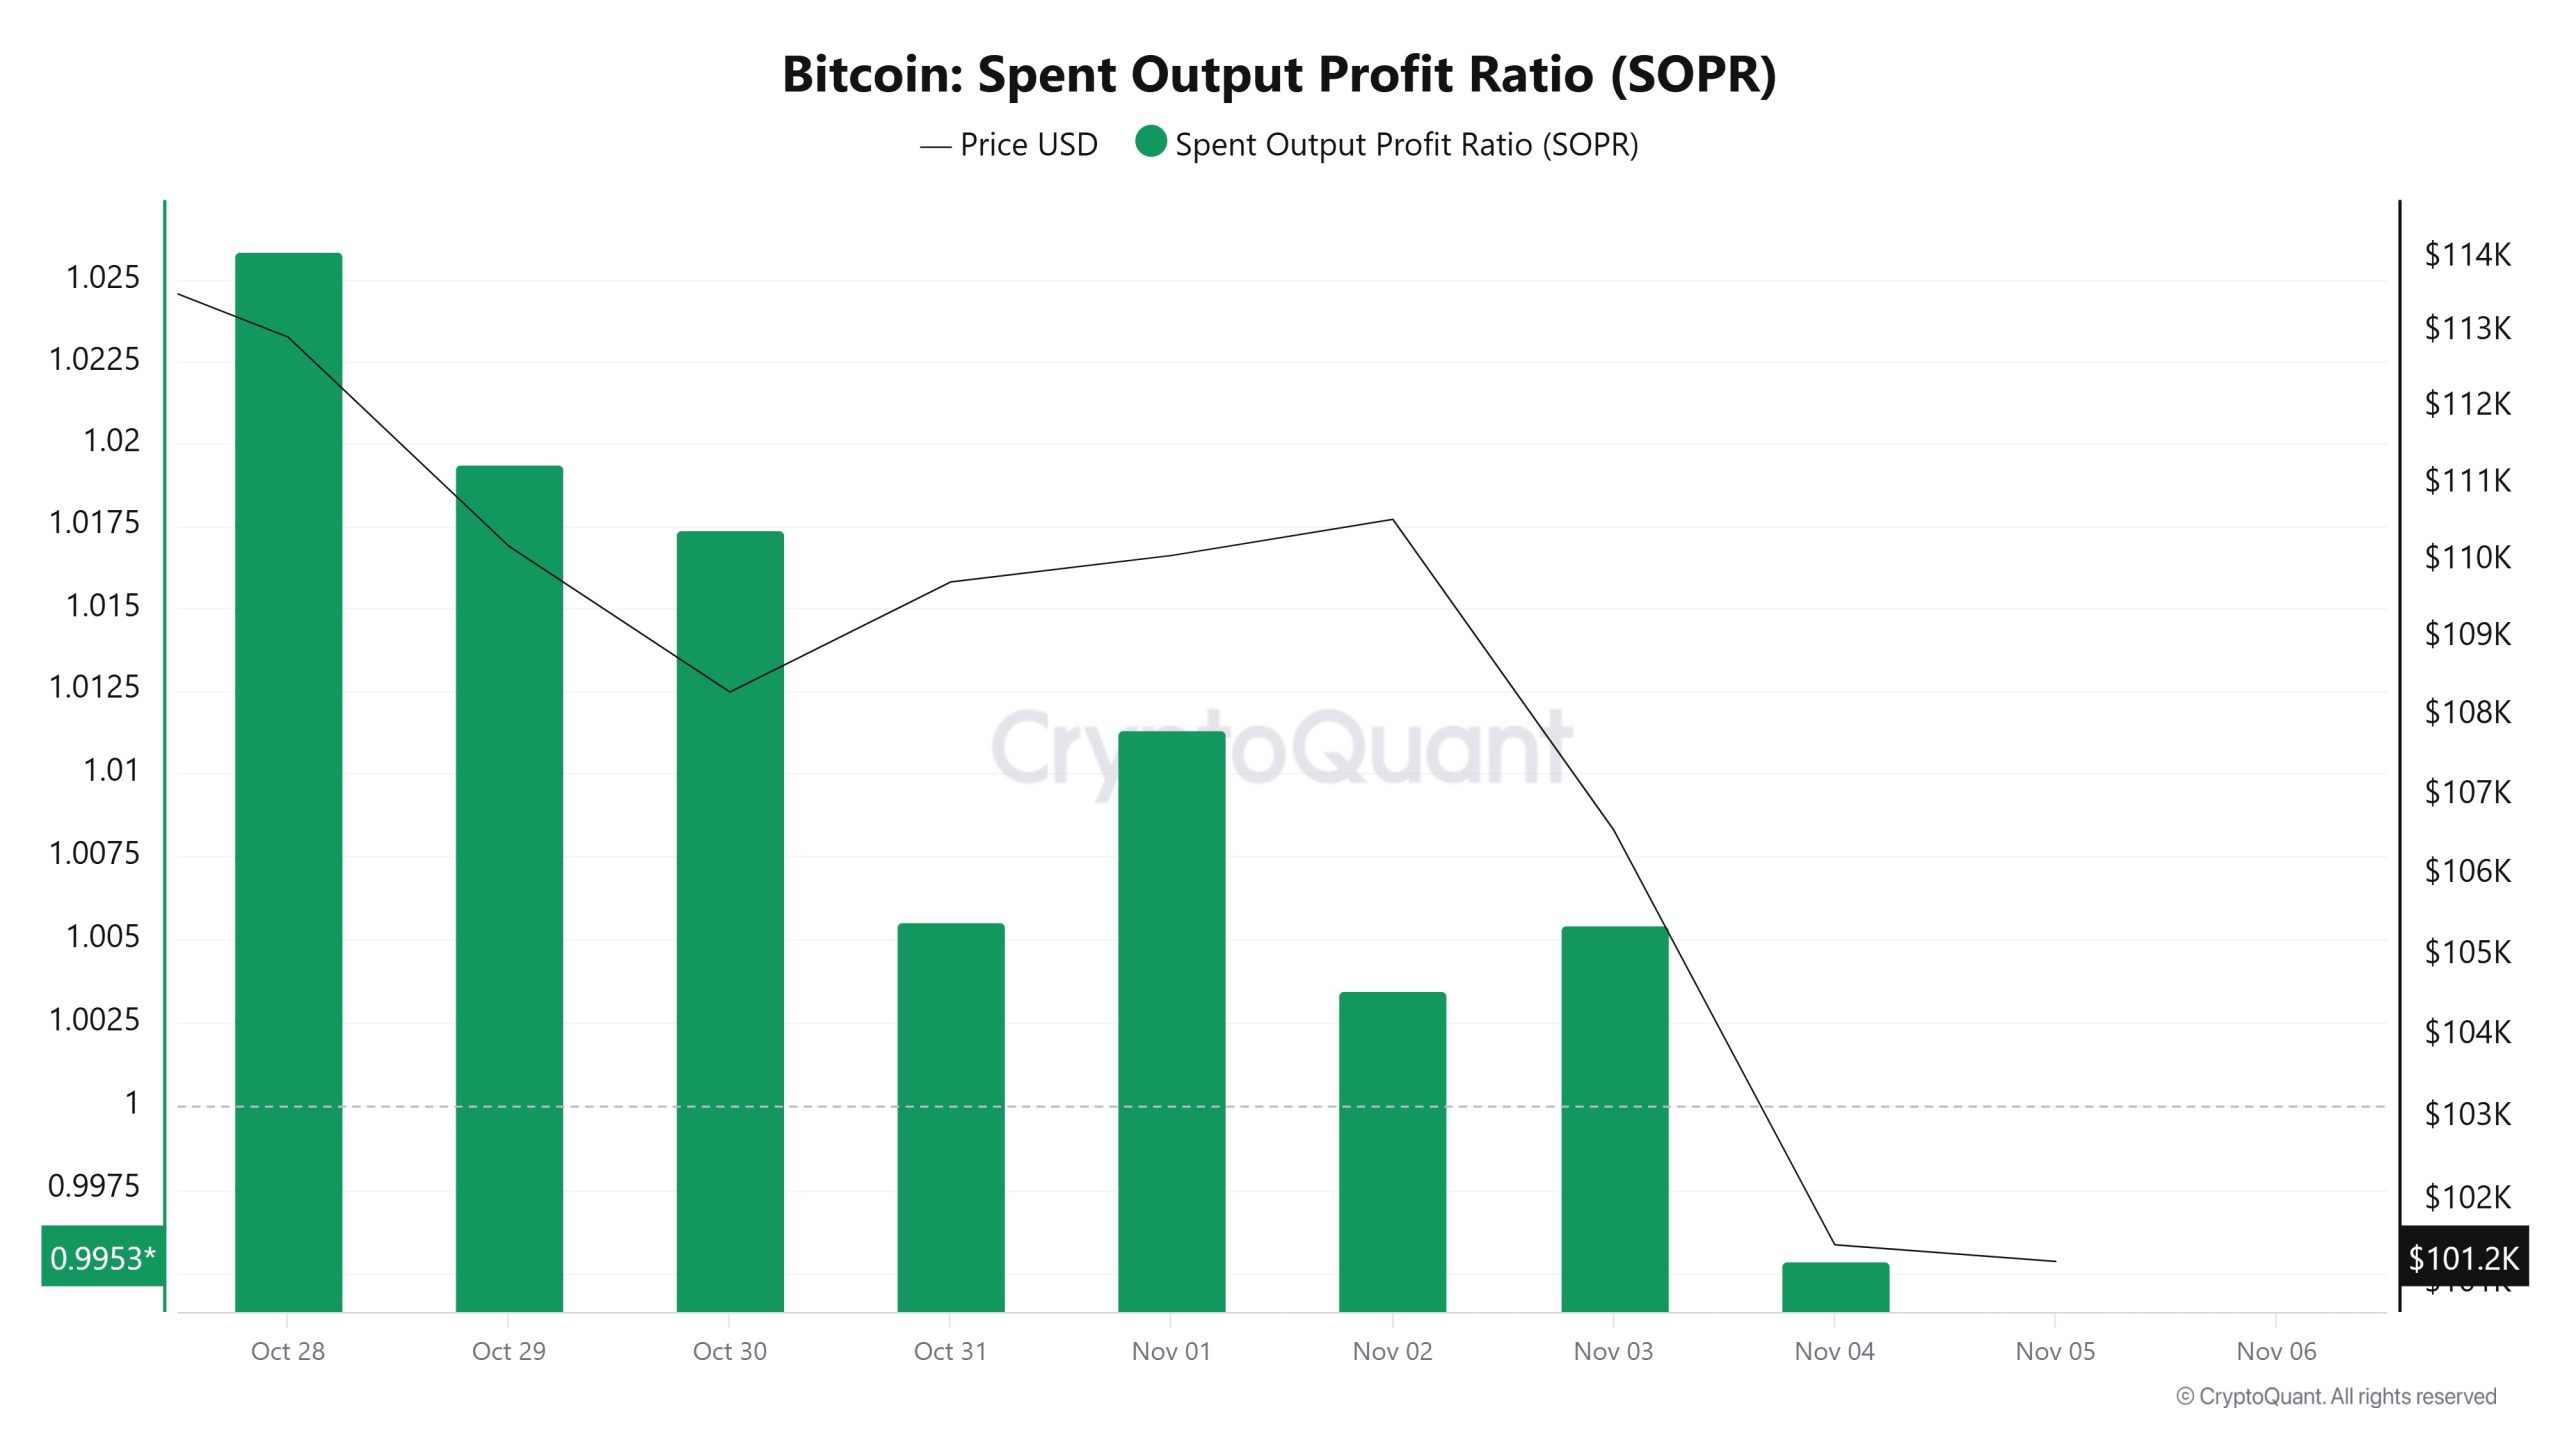
On October 29, while the Bitcoin price was trading at $110,186, the SOPR metric was at 1.019.
As of November 4, while the Bitcoin price fell to $101,475, the SOPR metric declined to 0.995, recording a 2.36% drop.
Derivatives
Open Interest
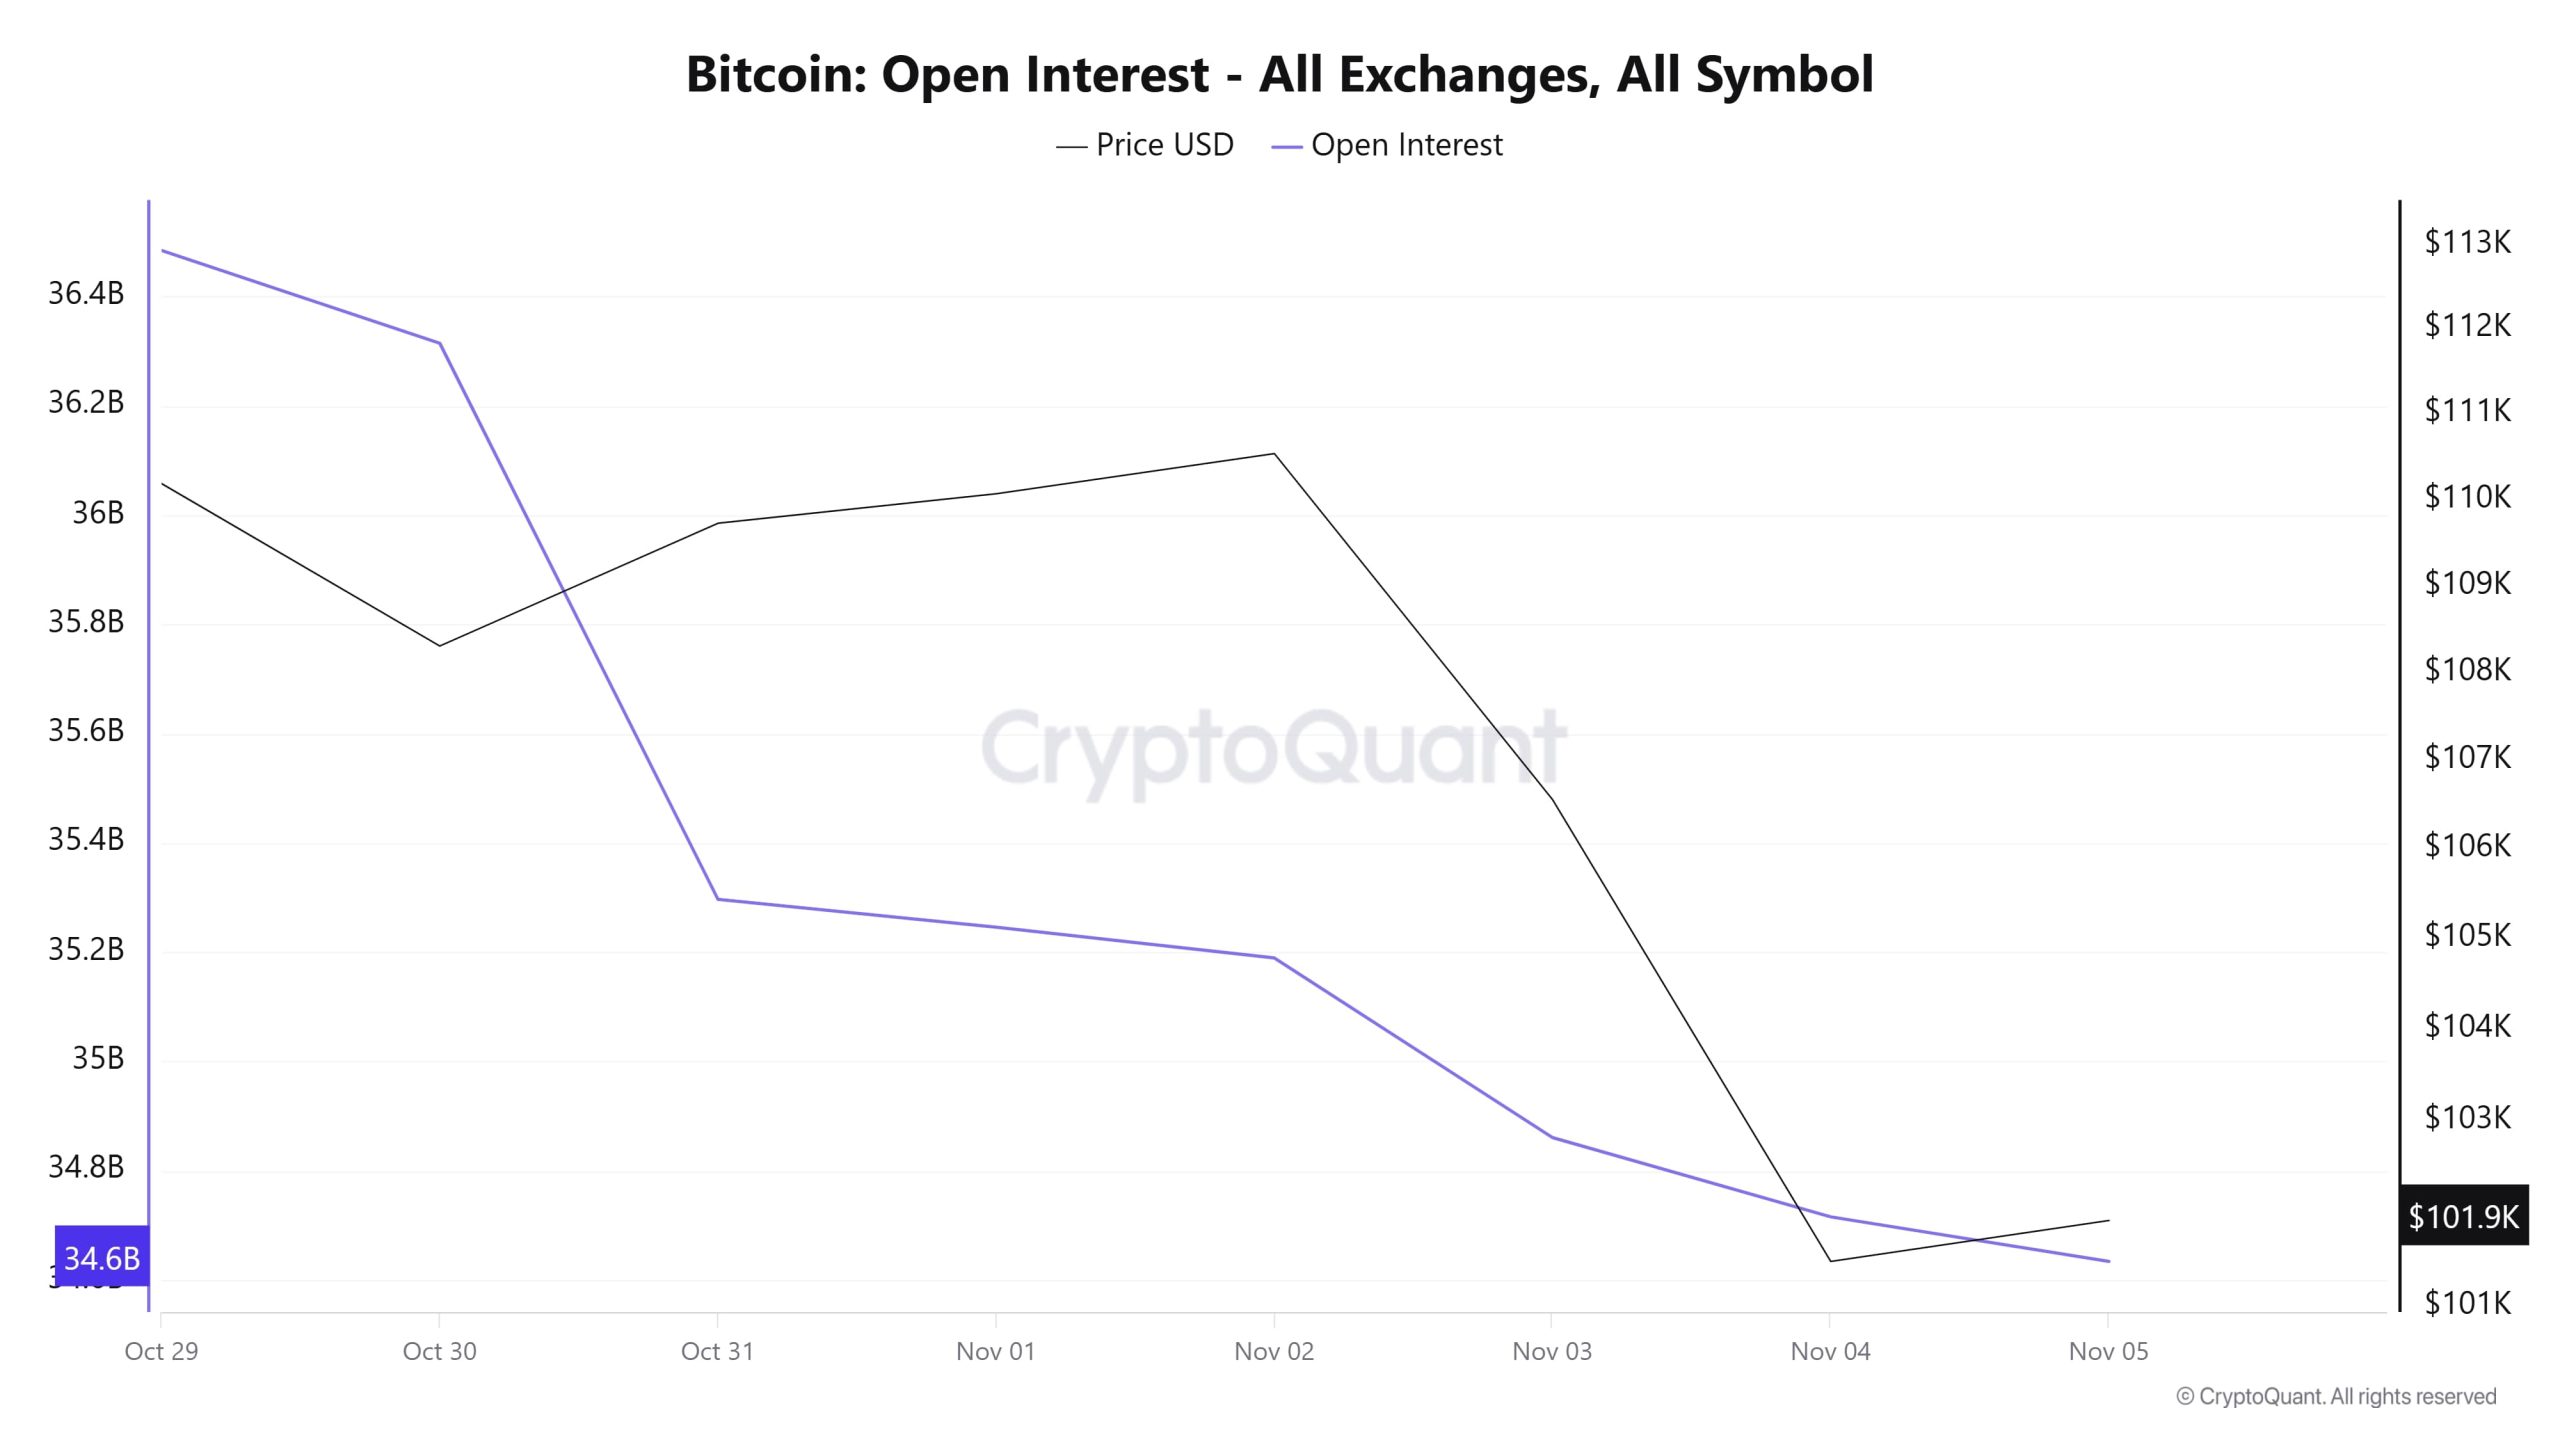
At the beginning of the period, open interest stood at approximately $36.4 billion, but showed a steady downward trend throughout the week, falling to $34.6 billion. This decline suggests that leveraged positions are being closed en the market or that investors are increasingly risk-averse.
On the price front, there is a volatile trend. Although there was a slight decline at the beginning, a short-term recovery was seen between November 1 and 2. However, as of November 3, the price fell sharply again, dropping to the $99,000 level. Overall, the chart shows that open positions declined along with the price decline and that the market is moving towards a cautious, low-risk environment.
Funding Rate
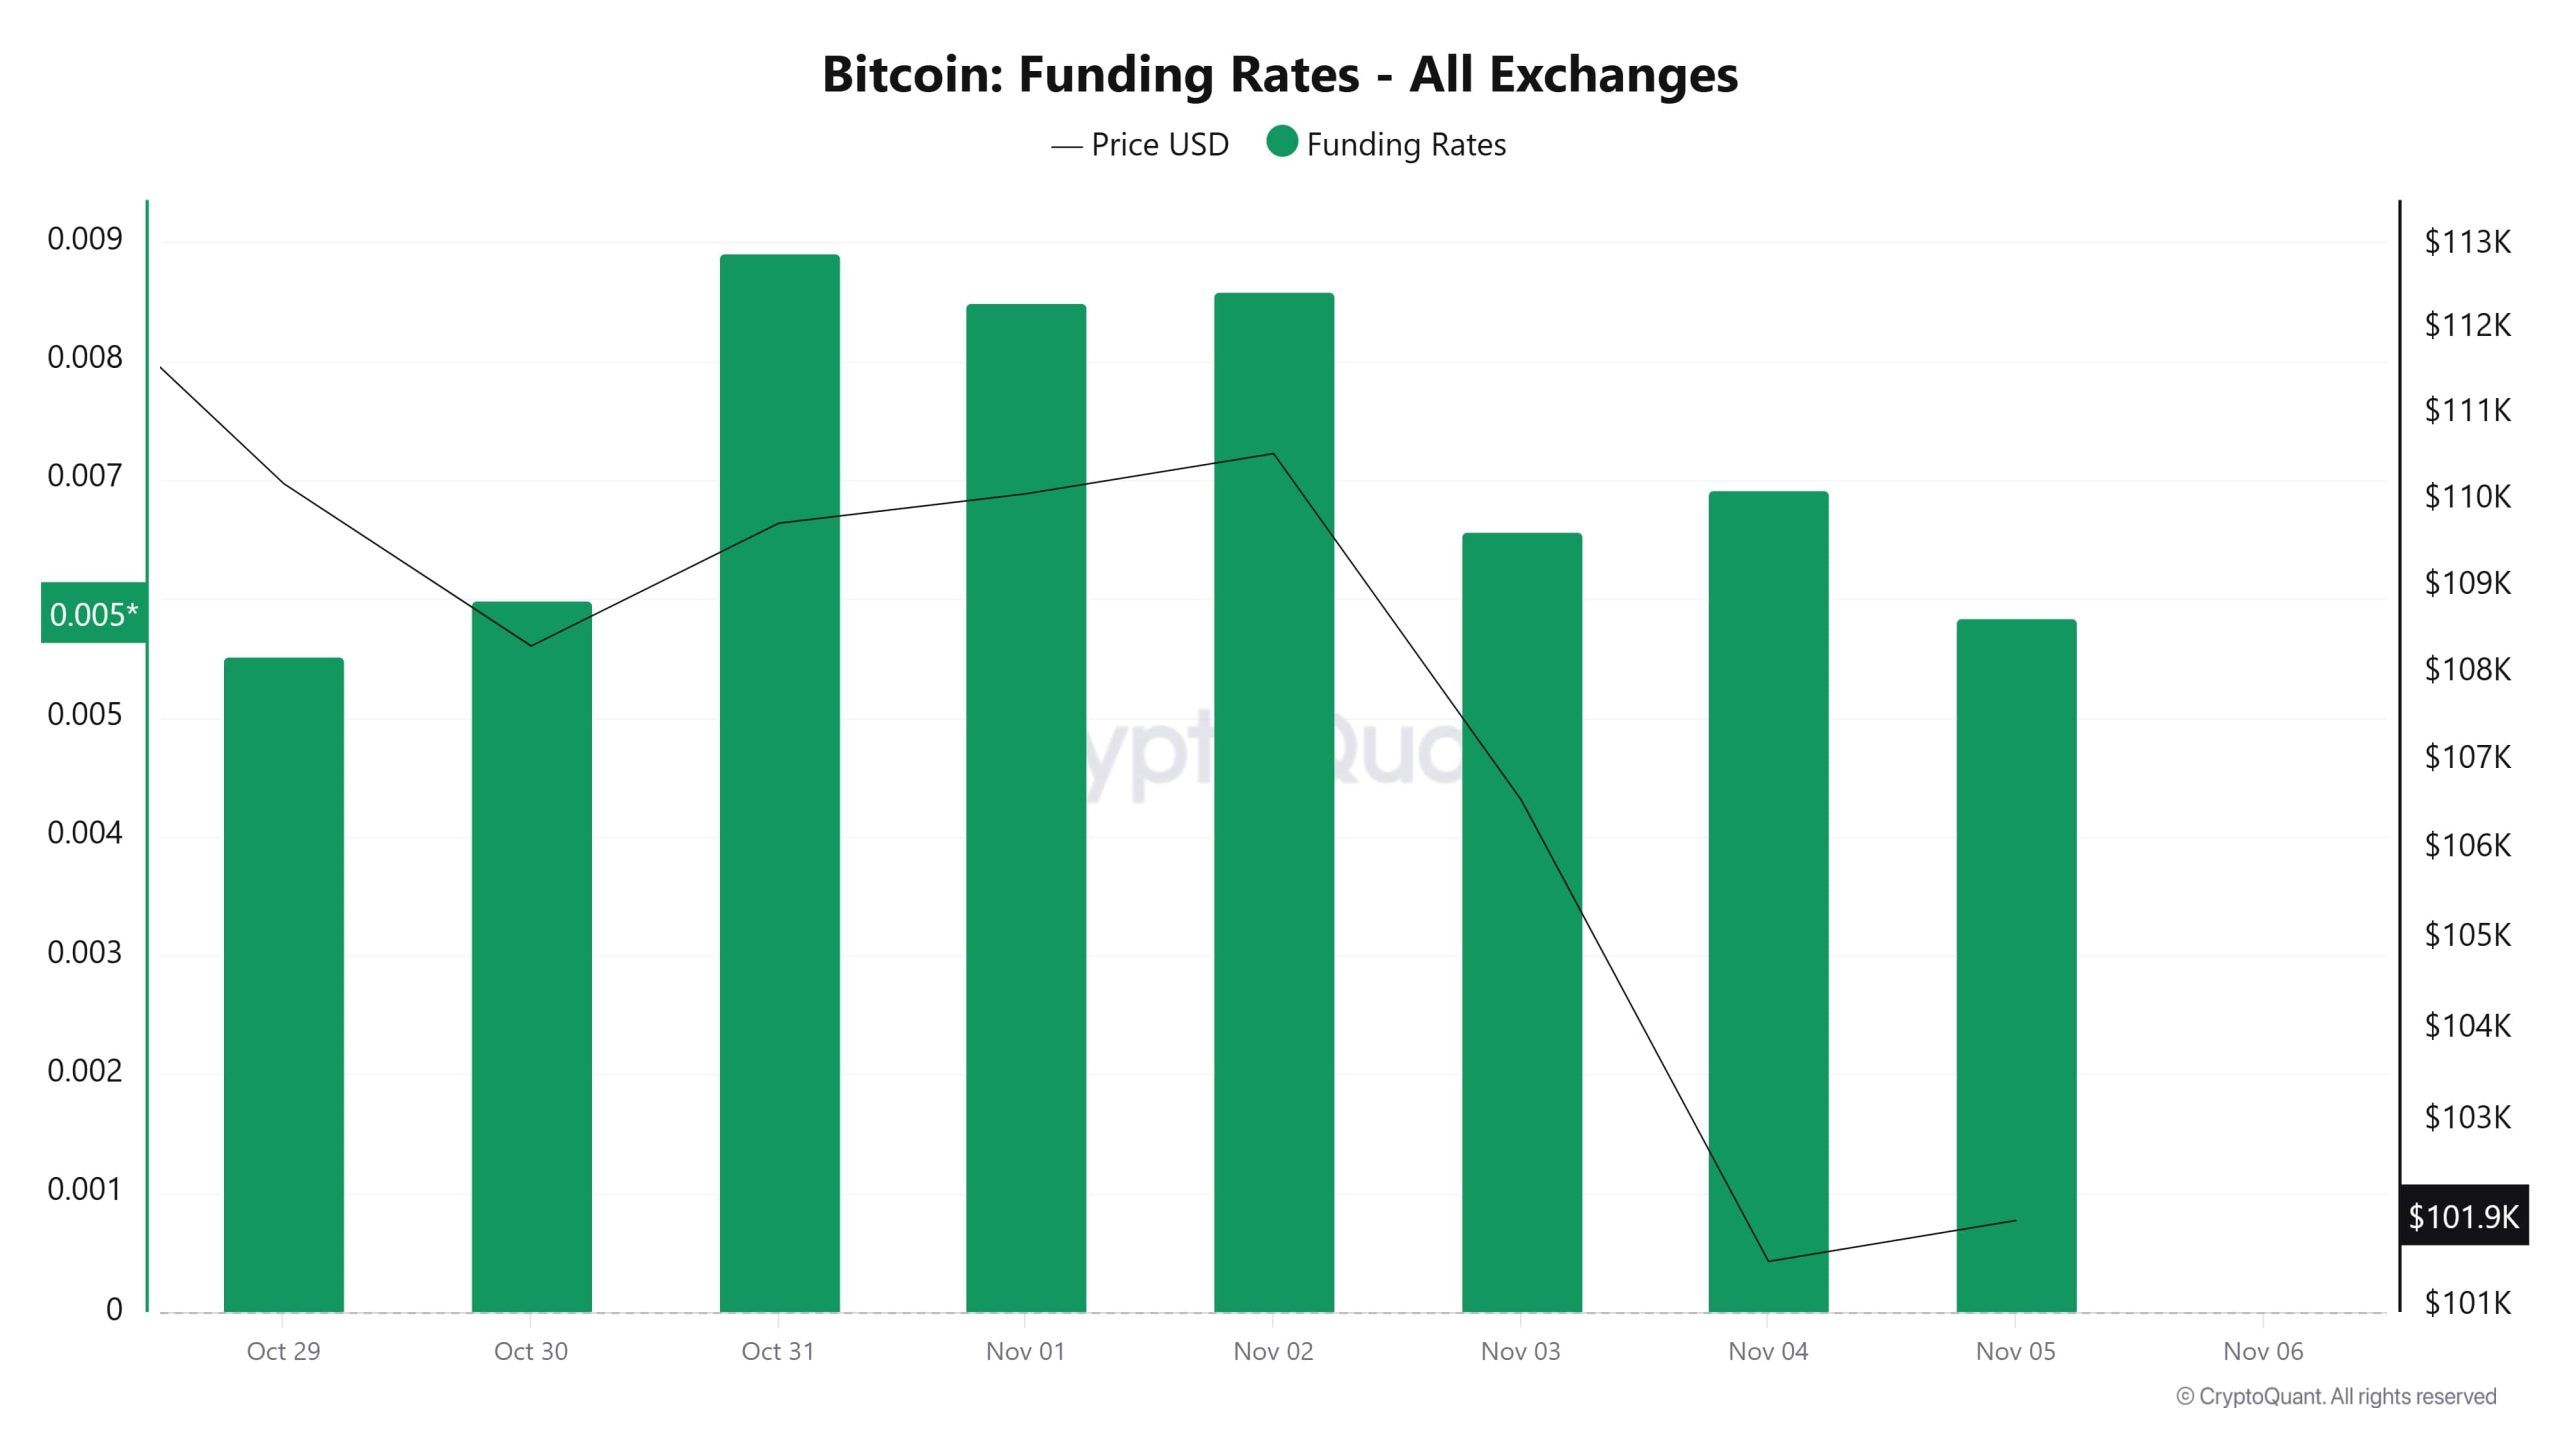
While funding rates remained relatively low en the early days, a clear upward trend has been observed since October 31, with rates rising to 0.009%. This increase indicates a rise en long positions en the market and strengthens investors’ expectations of price increases.
However, this picture reverses en the first week of November. After November 3, funding rates decline sharply, but remain strong despite the sharp drop el November 4. In recent days, a slight recovery en funding rates has been observed. Overall, the chart shows that investors remain buyers despite the sharp declines.
Long & Short Liquidations
Along with the BTC price falling from $113,500 to $99,000 last week, the market saw $1.34 billion en long and $154 million en short liquidations.
| Date | Long Volume (Million $) | Short Volume (Million $) |
|---|---|---|
| October 29 | 172.61 | 15.28 |
| October 30 | 283.61 | 20.61 |
| October 31 | 34.46 | 43.74 |
| November 1 | 2.77 | 4.26 |
| November 2 | 9.55 | 7.89 |
| November 3 | 215.60 | 17.13 |
| November 4 | 624.78 | 45.93 |
| Total | 1,343.38 | 154.84 |
Exchange Supply Ratio
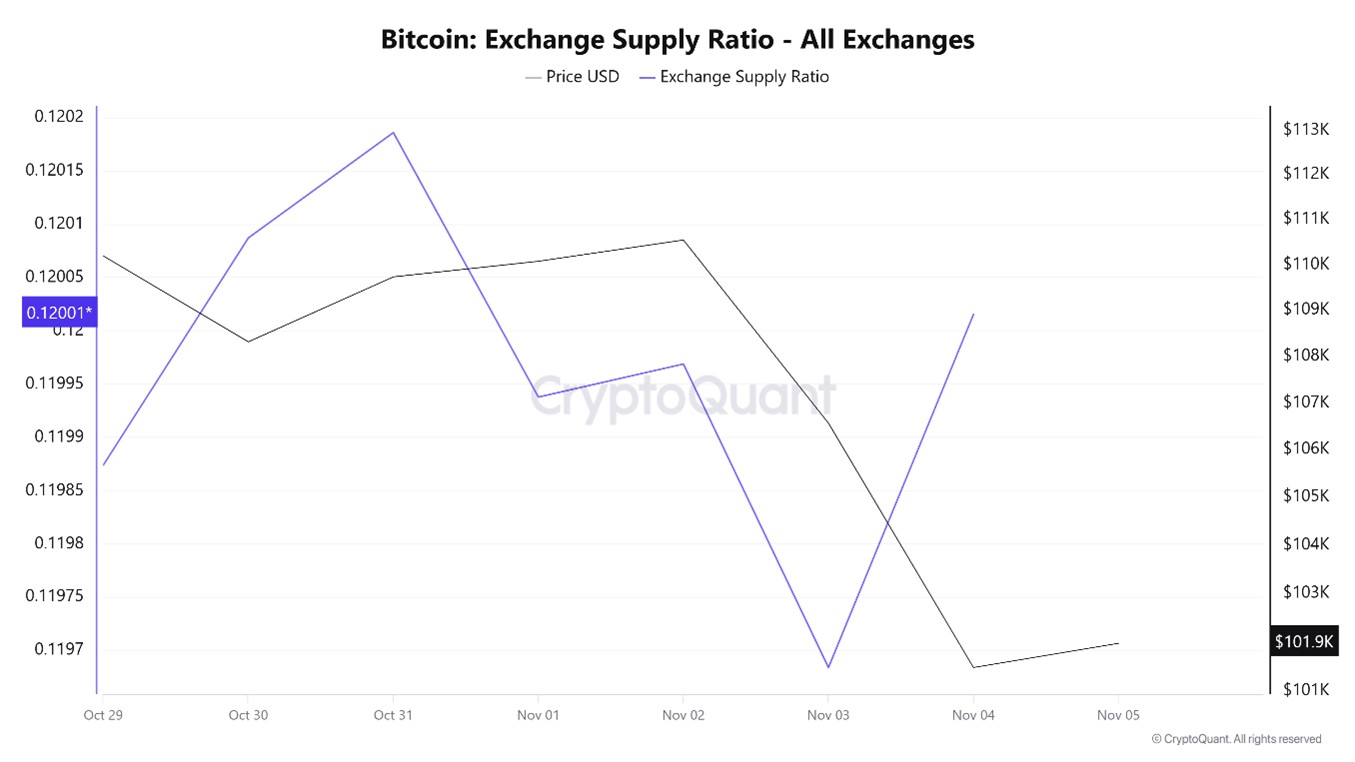
According to data obtained from the Bitcoin Exchange Supply Ratio table, which shows how much of the total supply of Bitcoins is held el exchanges, low rates have been observed this week. The general trend shows a negative correlation between the Bitcoin price and the supply rate entering exchanges. This indicates that most Bitcoins are beginning to be withdrawn from wallets and that the market is not ready to buy.
Between October 29 and November 5, the Bitcoin Exchange Supply Ratio increased from 0.11987382 to 0.12001514. During this period, the Bitcoin price declined from $110,000 to $101,000. Notably, the divergence en the direction of these two variables this week indicates an increase en the amount of Bitcoin supplied to exchanges despite the price decline, suggesting that long-term investors may have begun reducing their holdings. A general downward trend en the Bitcoin price appears likely.
Exchange Reserve
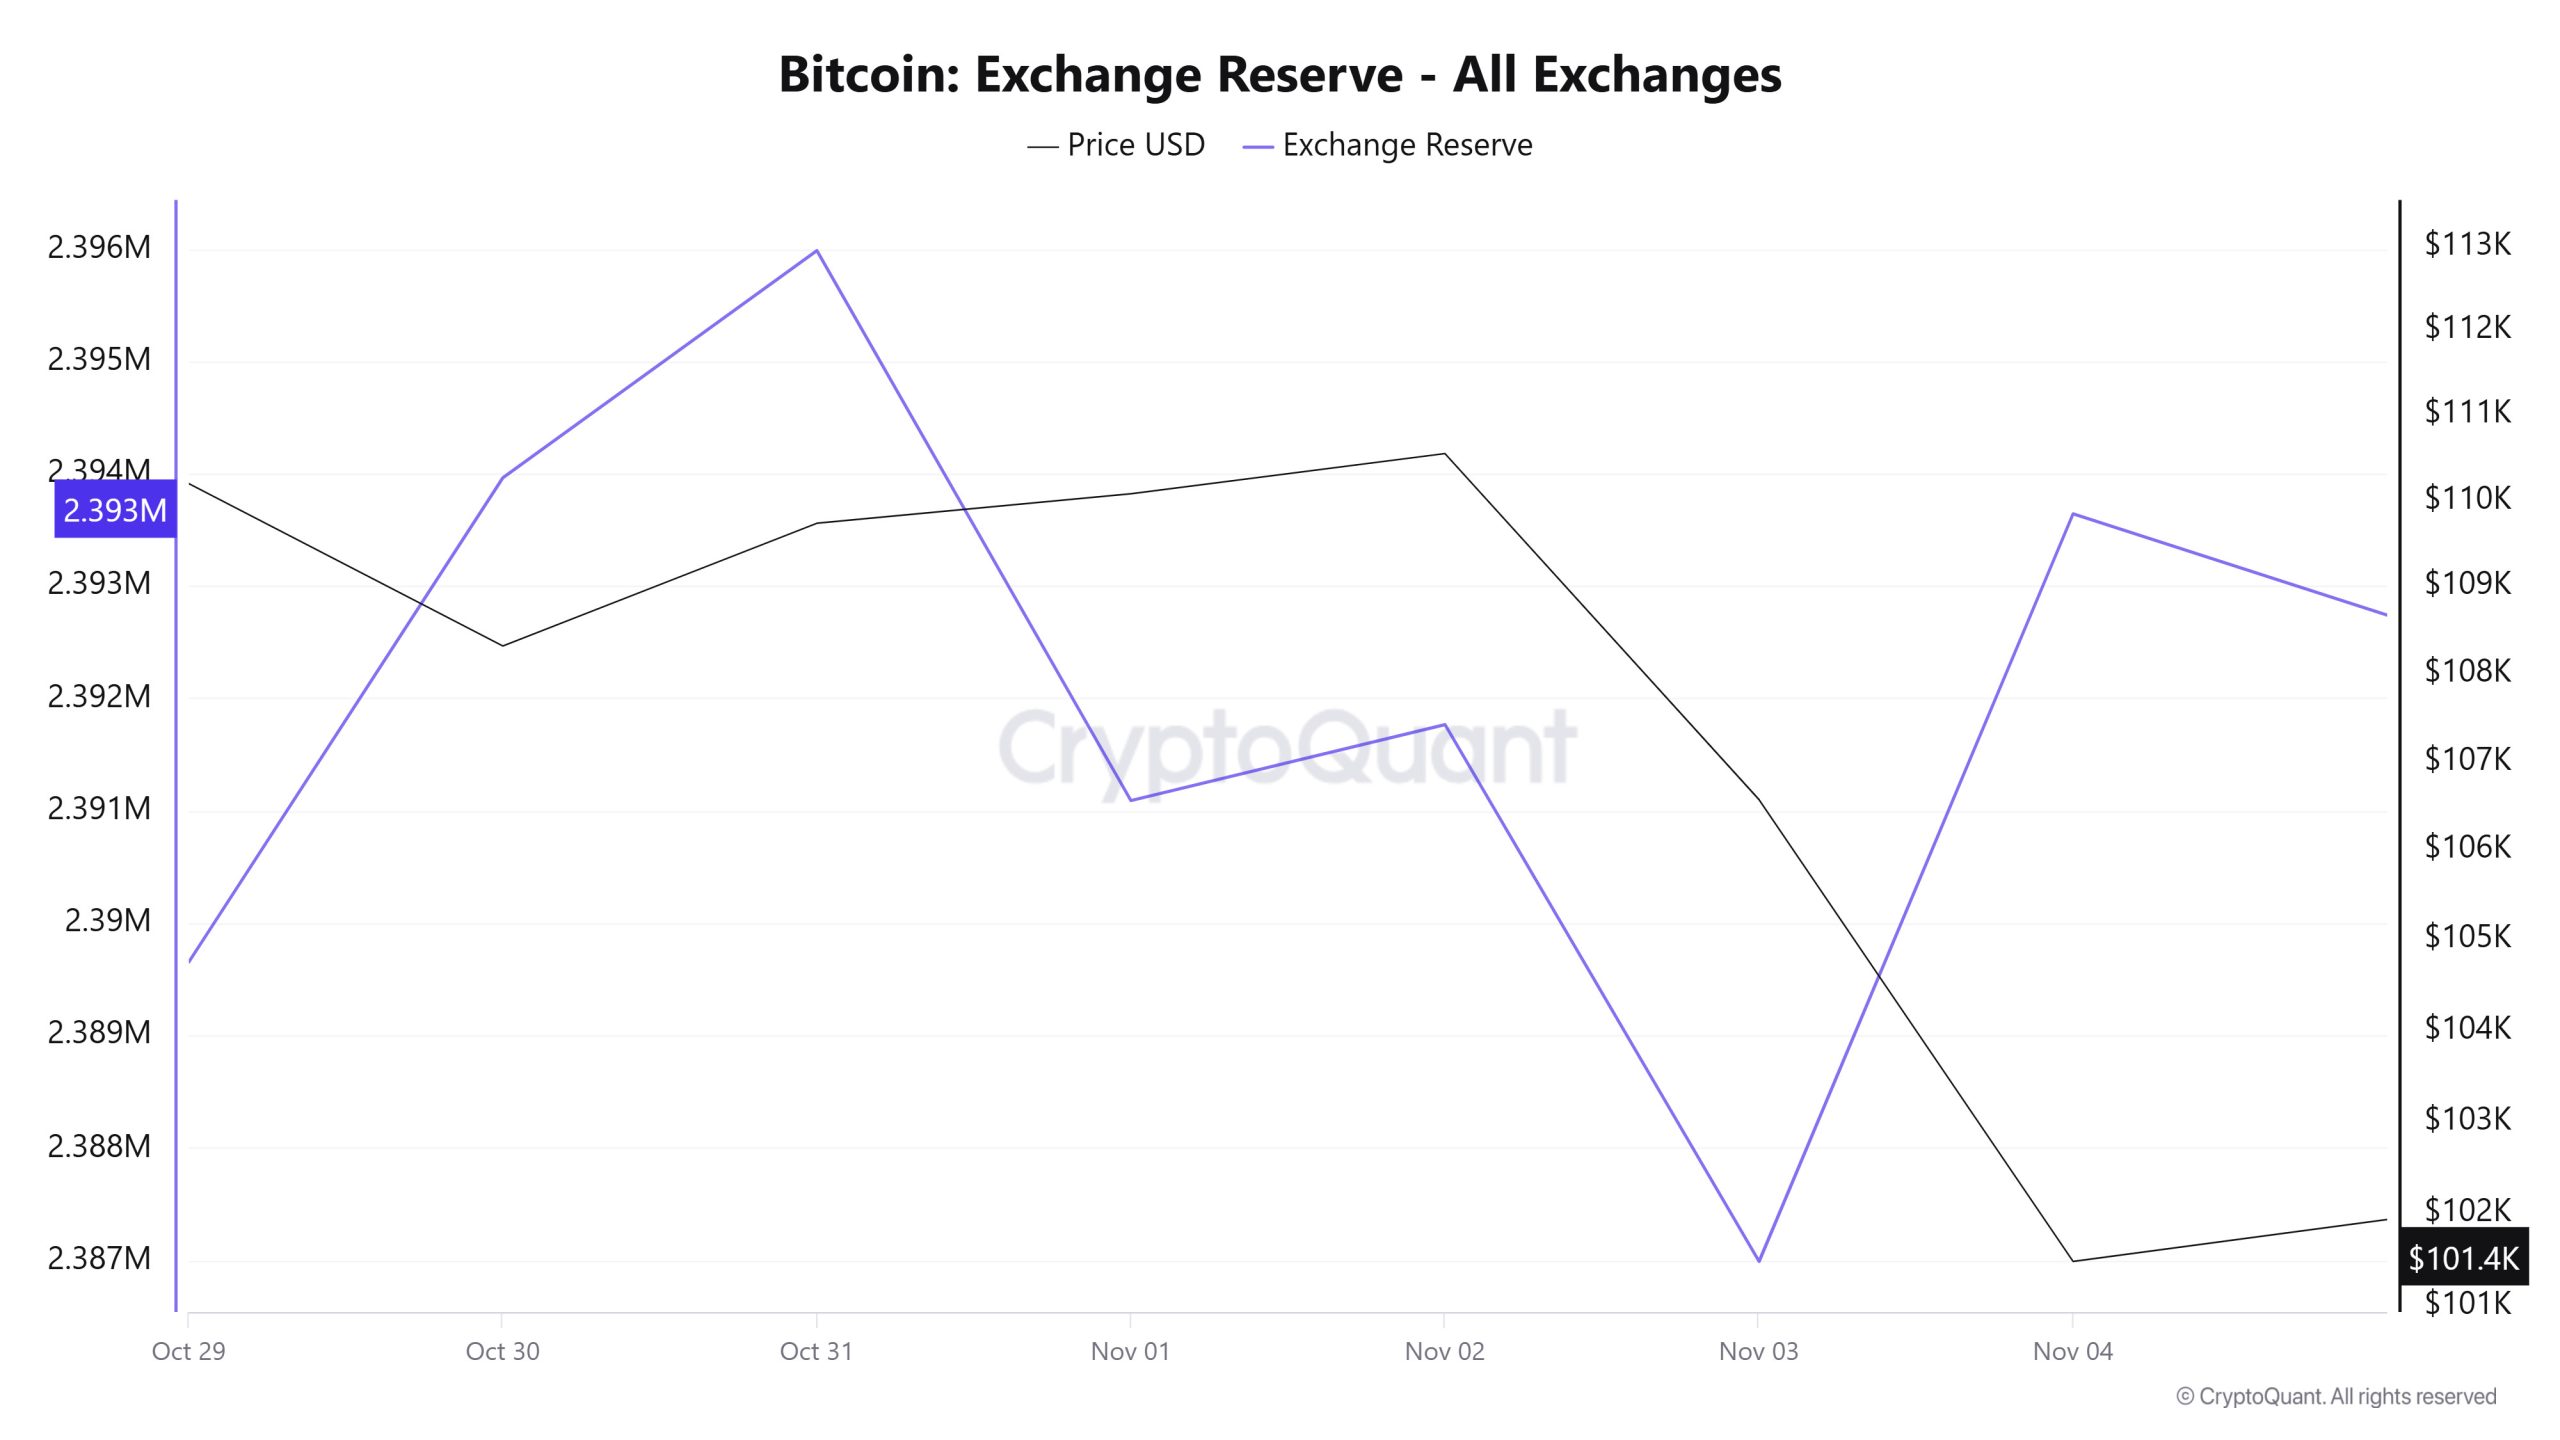
Between October 29 and November 4, 2025, Bitcoin reserves el exchanges declined from 2,394,172 BTC to 2,393,642 BTC, resulting en a net outflow of 530 BTC. During this period, reserves experienced a limited decrease of approximately 0.02%, while the BTC price fell from $112,907 to $101,475, losing 10.12% of its value. Despite the sharp pullback en price, this limited decrease en exchange reserves was noteworthy. Sales may have been conducted through Over The Counter (OTC) transactions rather than directly through exchanges. Furthermore, the low level of reserve outflow indicated that investors were hesitant to take a clear stance en the face of this decline and were cautious about taking new positions.
| Asset / Index | Value ($) | Daily Change (%) |
|---|---|---|
| Bitcoin (BTC) | 111,360.0 | +1.04% |
| Ethereum (ETH) | 3,982.69 | +3.22% |
| Bitcoin Spot ETF | +20.0M | Net Inflow |
| Ethereum Spot ETF | −127.4M | Net Outflow |
| Nasdaq (NAS100) | 25,210.9 | +0.35% |
| S&P 500 (SPX) | 6,738.43 | +0.58% |
| Russell 2000 (RUT) | 2,495.5 | +0.26% |
| U.S. Dollar Index (DXY) | 99.022 | +0.11% |
| VIX Volatility Index (VIX) | 17.29 | −6.99% |
| U.S. 10-Year Treasury Yield (US10Y) | 4.001 | −0.05% |
| Brent Crude Oil (BRENT) | 65.075 | −0.15% |
| LBMA Gold (XAU) | 4,091.300 | −0.84% |
| LBMA Silver (XAG) | 48.2736 | −1.32% |
Oct. 29Oct. 30Oct. 31Nov. 01Nov. 02Nov. 3Nov. 4Miner Inflow5895.9910,176.8911,405.954224.273,977.007,924.3514,937.50Miner Outflow5,779.9611,574.3611,483.934,567.573,826.777,574.1713,606.89Miner Netflow116.03-1397.46-77.98-343.30150.23350.191330.61
Whale Activities
Whale Data
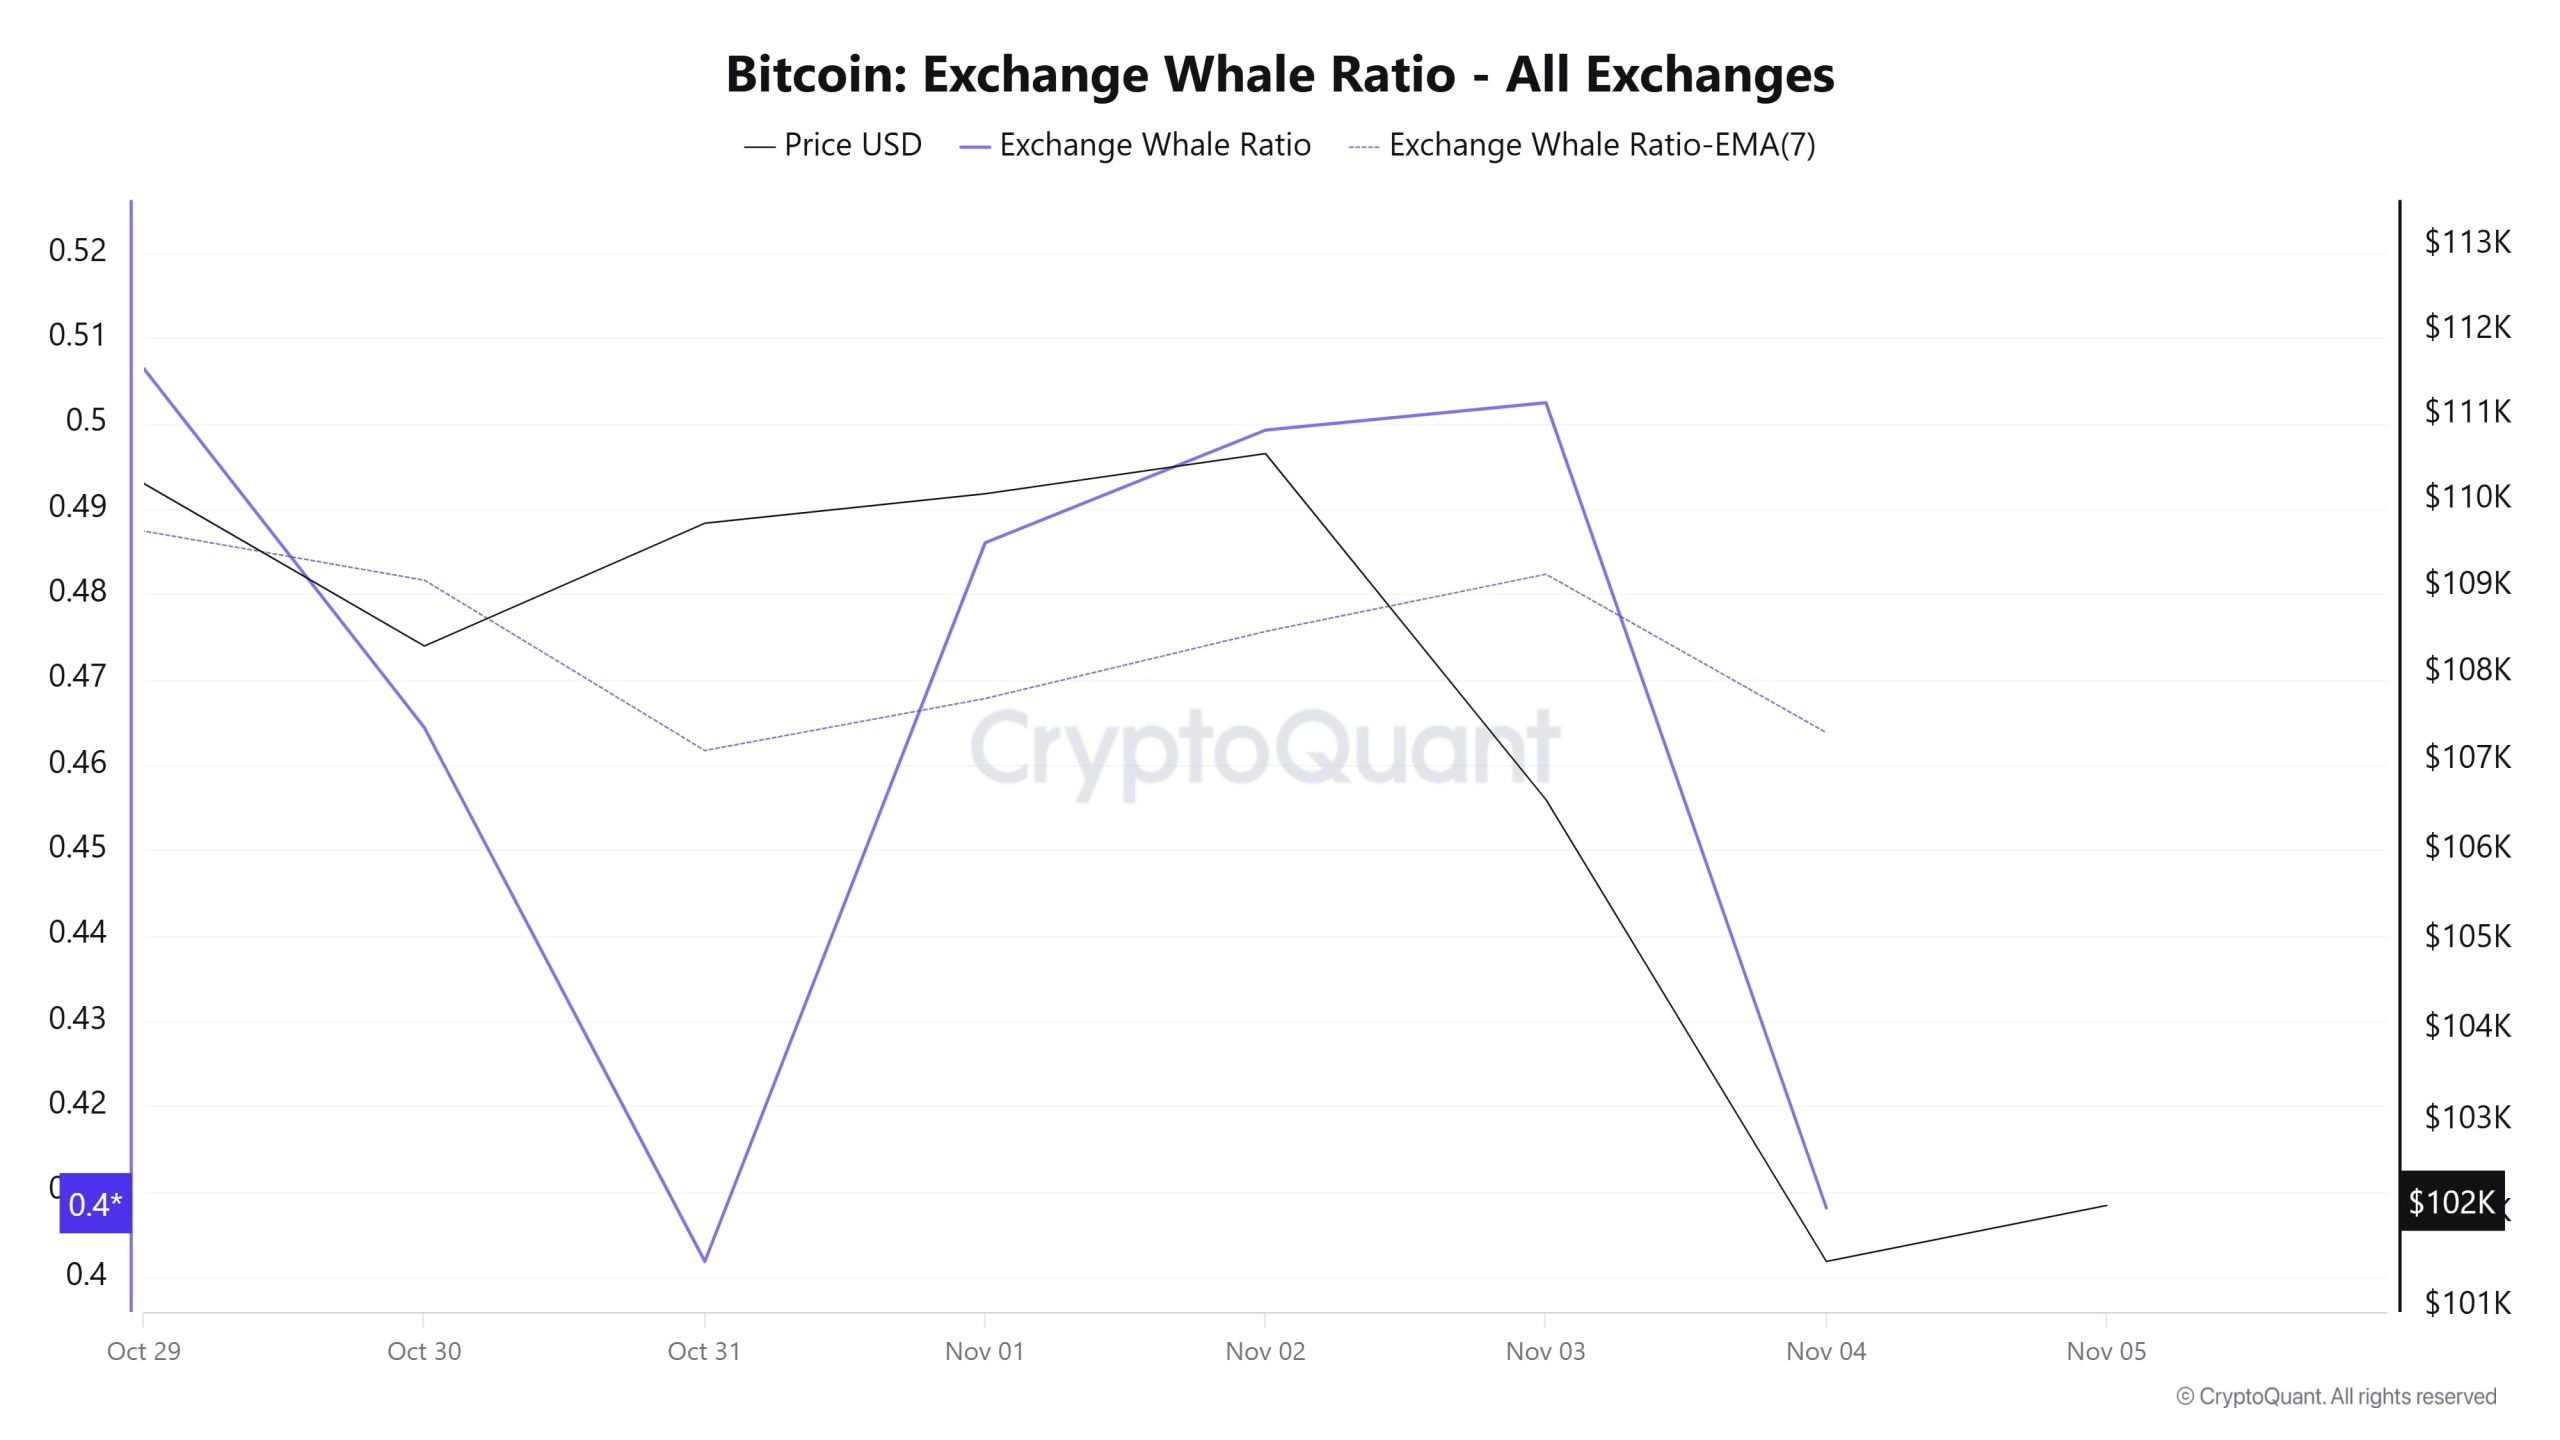
Looking at whale activity el centralized exchanges over the past 7 days based el cryptocurrency market data, the metric experienced a decline at the beginning of the process, then reached its previous level por the middle of the process but subsequently fell to a lower level. Looking at the Exchange Whale Ratio metric, el October 29, the first day of the 7-day period, the rate of whales using centralized exchanges was 0.506. On October 31, the metric reached its lowest point during the process, falling to 0.401. The metric then rose, reaching its peak el November 3, rising to 0.505. When this ratio is above the 0.35–0.45 band, it generally means that whales are frequently using centralized exchanges. Currently at 0.408, the metric shows that whales are using centralized exchanges en a balanced manner. During this period, BTC traded between $112,800 and $99,000. This signaled that centralized exchanges were being used por whales for selling. At the same time, total BTC transfers increased por 18% compared to last week, with 5,502,887 BTC moving. The data shows that the Bitcoin market’s largest holders are undergoing a significant generational shift. New whales that have accumulated over 1,000 BTC en recent months now account for approximately 45% of Whale Realized Capital. This change en whale demographics could affect market psychology and increase selling pressure. Meanwhile, older whale groups continue to preserve their positive unrealized gains, even as they distribute Bitcoin to new investors. Consequently, current el-chain dynamics, coupled with high liquidations and overall market transfers, indicate that the market is currently trending downward.
BTC Onchain Overall
| Metric | Positive 📈 | Negative 📉 | Neutral ➖ |
|---|---|---|---|
| Active Addresses | ✓ | ||
| Breakdowns | ✓ | ||
| Derivatives | ✓ | ||
| Exchange Supply Ratio | ✓ | ||
| Exchange Reserve | ✓ | ||
| Fees and Revenues | ✓ | ||
| Miner Flows | ✓ | ||
| Whale Activity | ✓ |
*The metrics and guidance provided en the table do not alone explain or imply any expectation regarding future price changes for any asset. Digital asset prices can fluctuate based el numerous variables. The el-chain analysis and related guidance are intended to assist investors en their decision-making process, and basing financial investments solely el the results of this analysis may lead to unfavorable outcomes. Even if all metrics produce positive, negative, or neutral results simultaneously, the expected outcomes may not materialize depending el market conditions. It would be beneficial for investors reviewing the report to take these warnings into consideration.
Legal Notice
The investment information, comments, and recommendations contained en this document do not constitute investment advisory services. Investment advisory services are provided por authorized institutions el a personal basis, taking into account the risk and return preferences of individuals. The comments and recommendations contained en this document are of a general nature. These recommendations may not be suitable for your financial situation and risk and return preferences. Therefore, making an investment decision based solely el the information contained en this document may not result en outcomes that align with your expectations.
NOTE: All data used en Bitcoin el-chain analysis is based el CryptoQuant.


