
Weekly Bitcoin Onchain Report
Breakdowns
MVRV
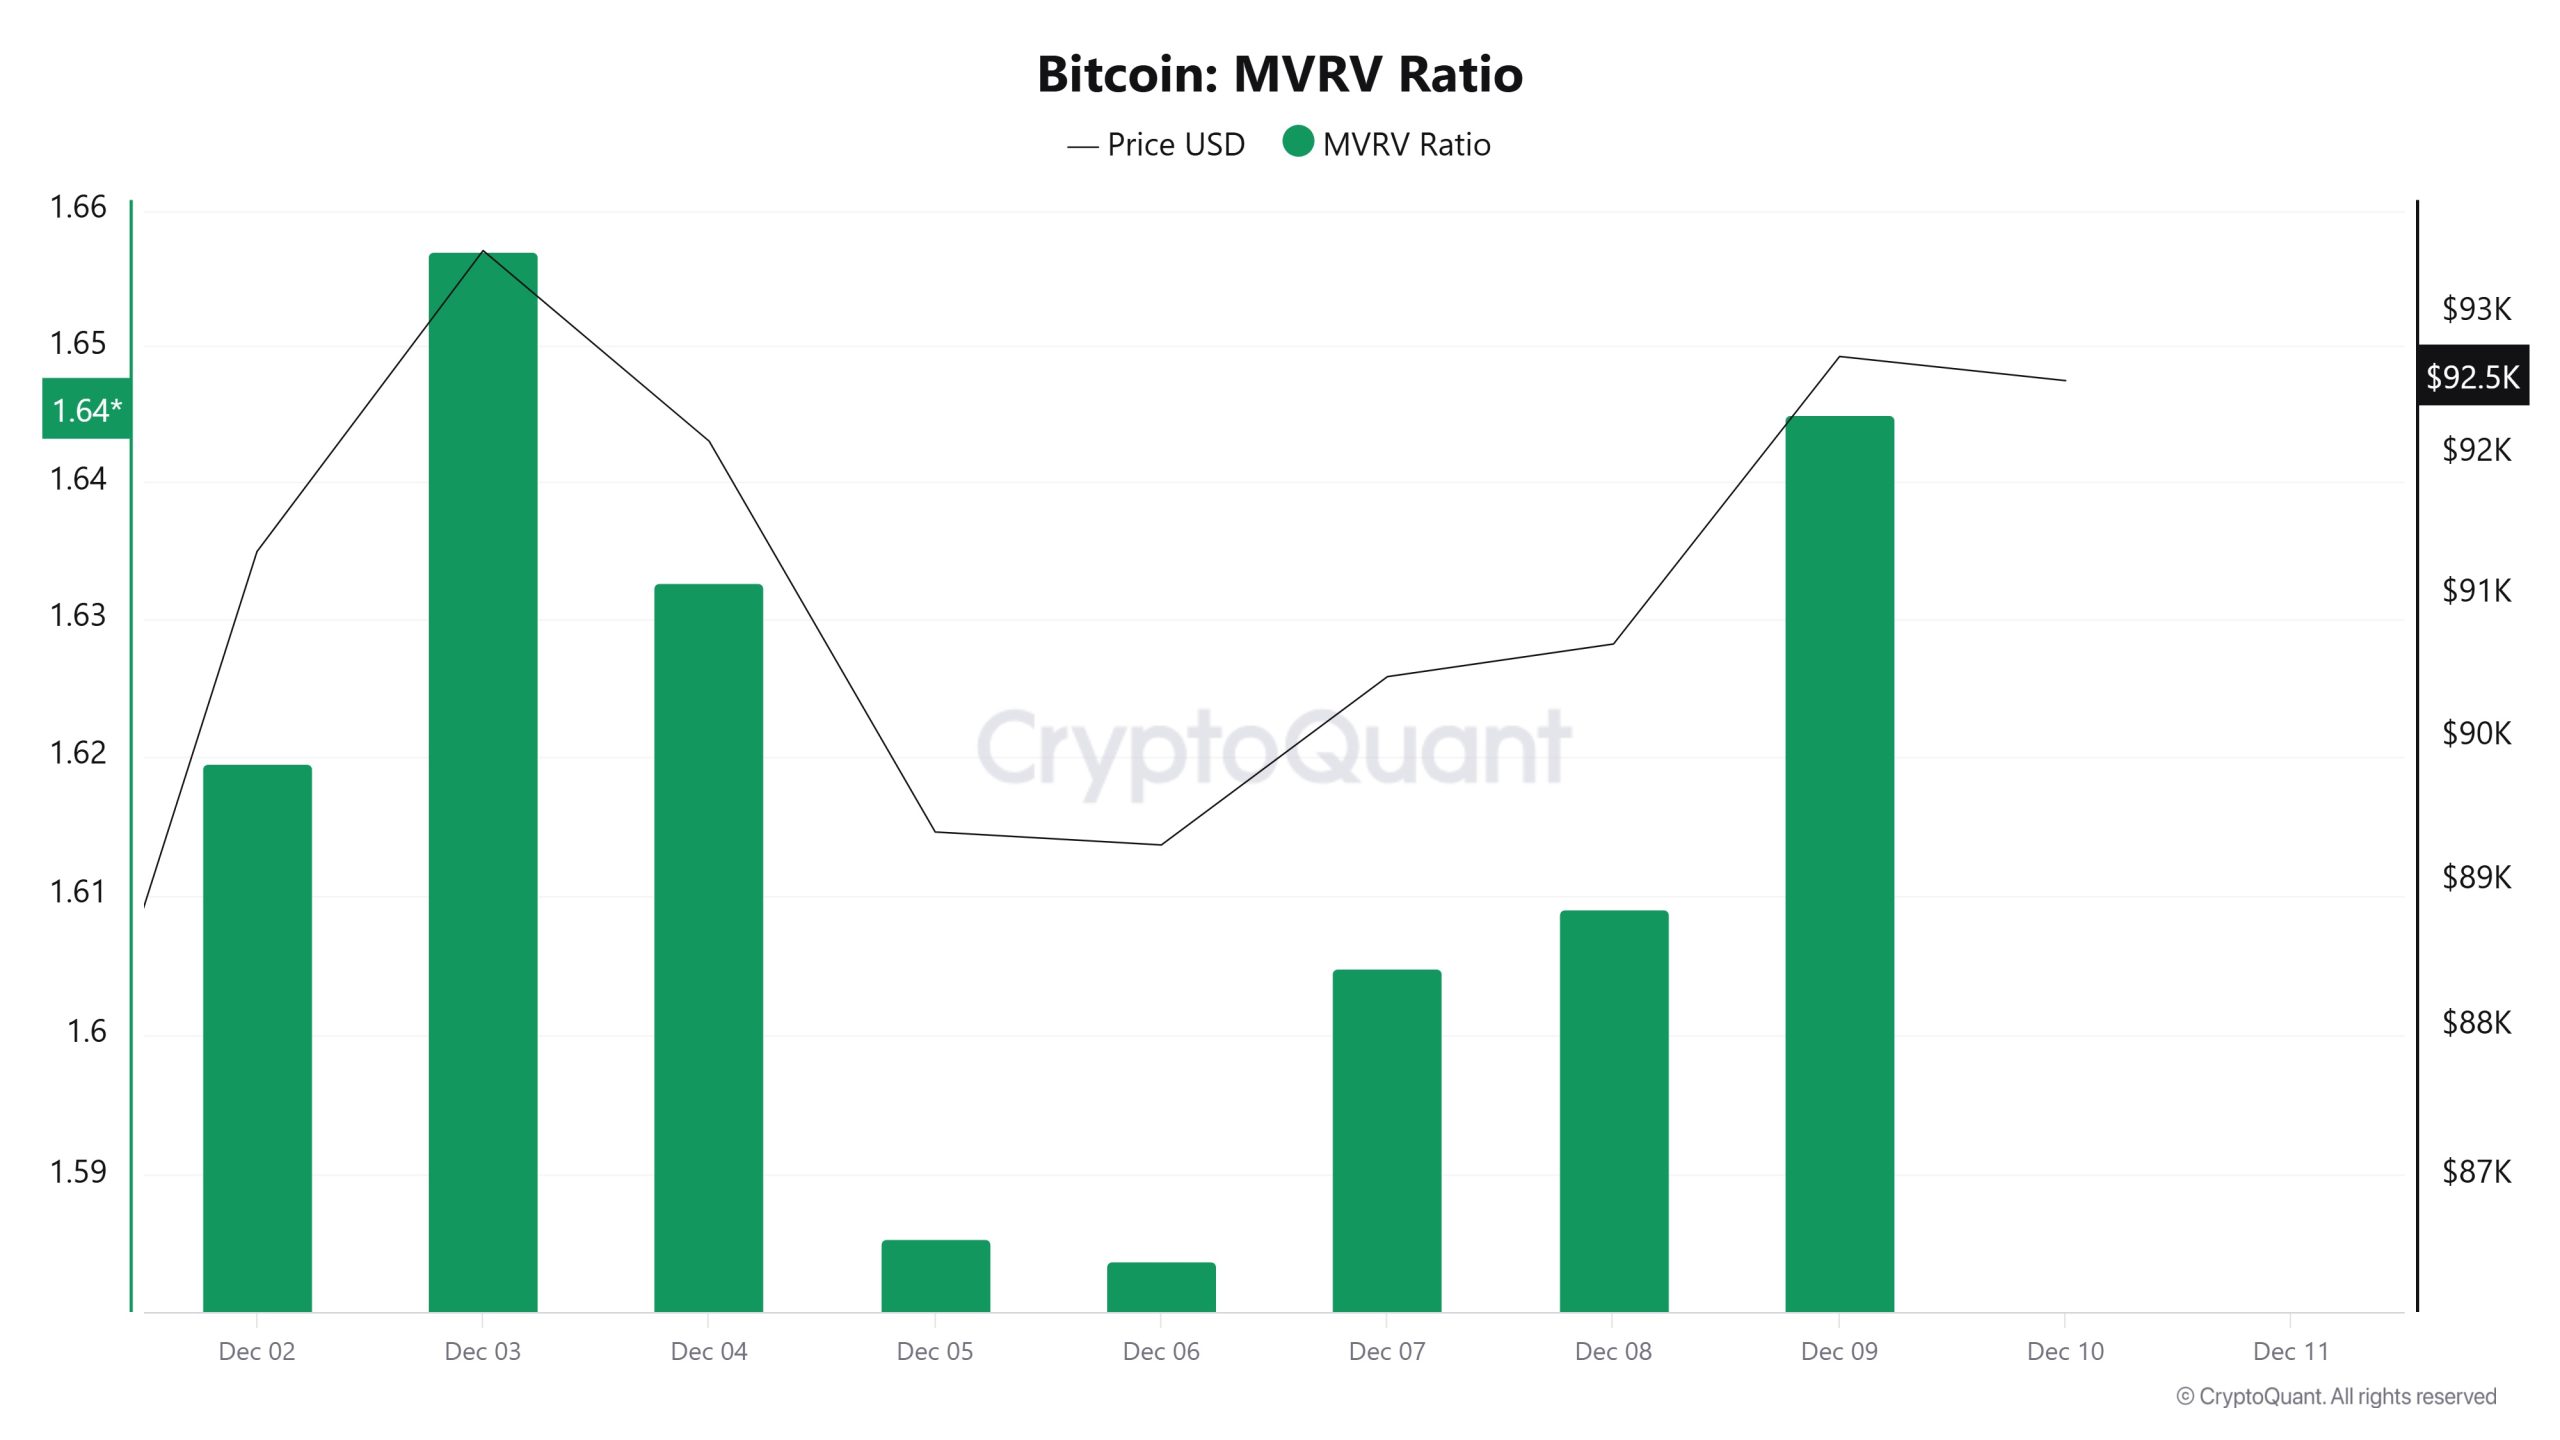
On December 3, while the Bitcoin price was trading at $93,453, the MVRV Ratio stood at 1.657.
As of December 9, the Bitcoin price fell to $92,690, recording a 0.82% decline, while the MVRV Ratio fell to 1.645, recording a 0.72% decline.
Realized Price
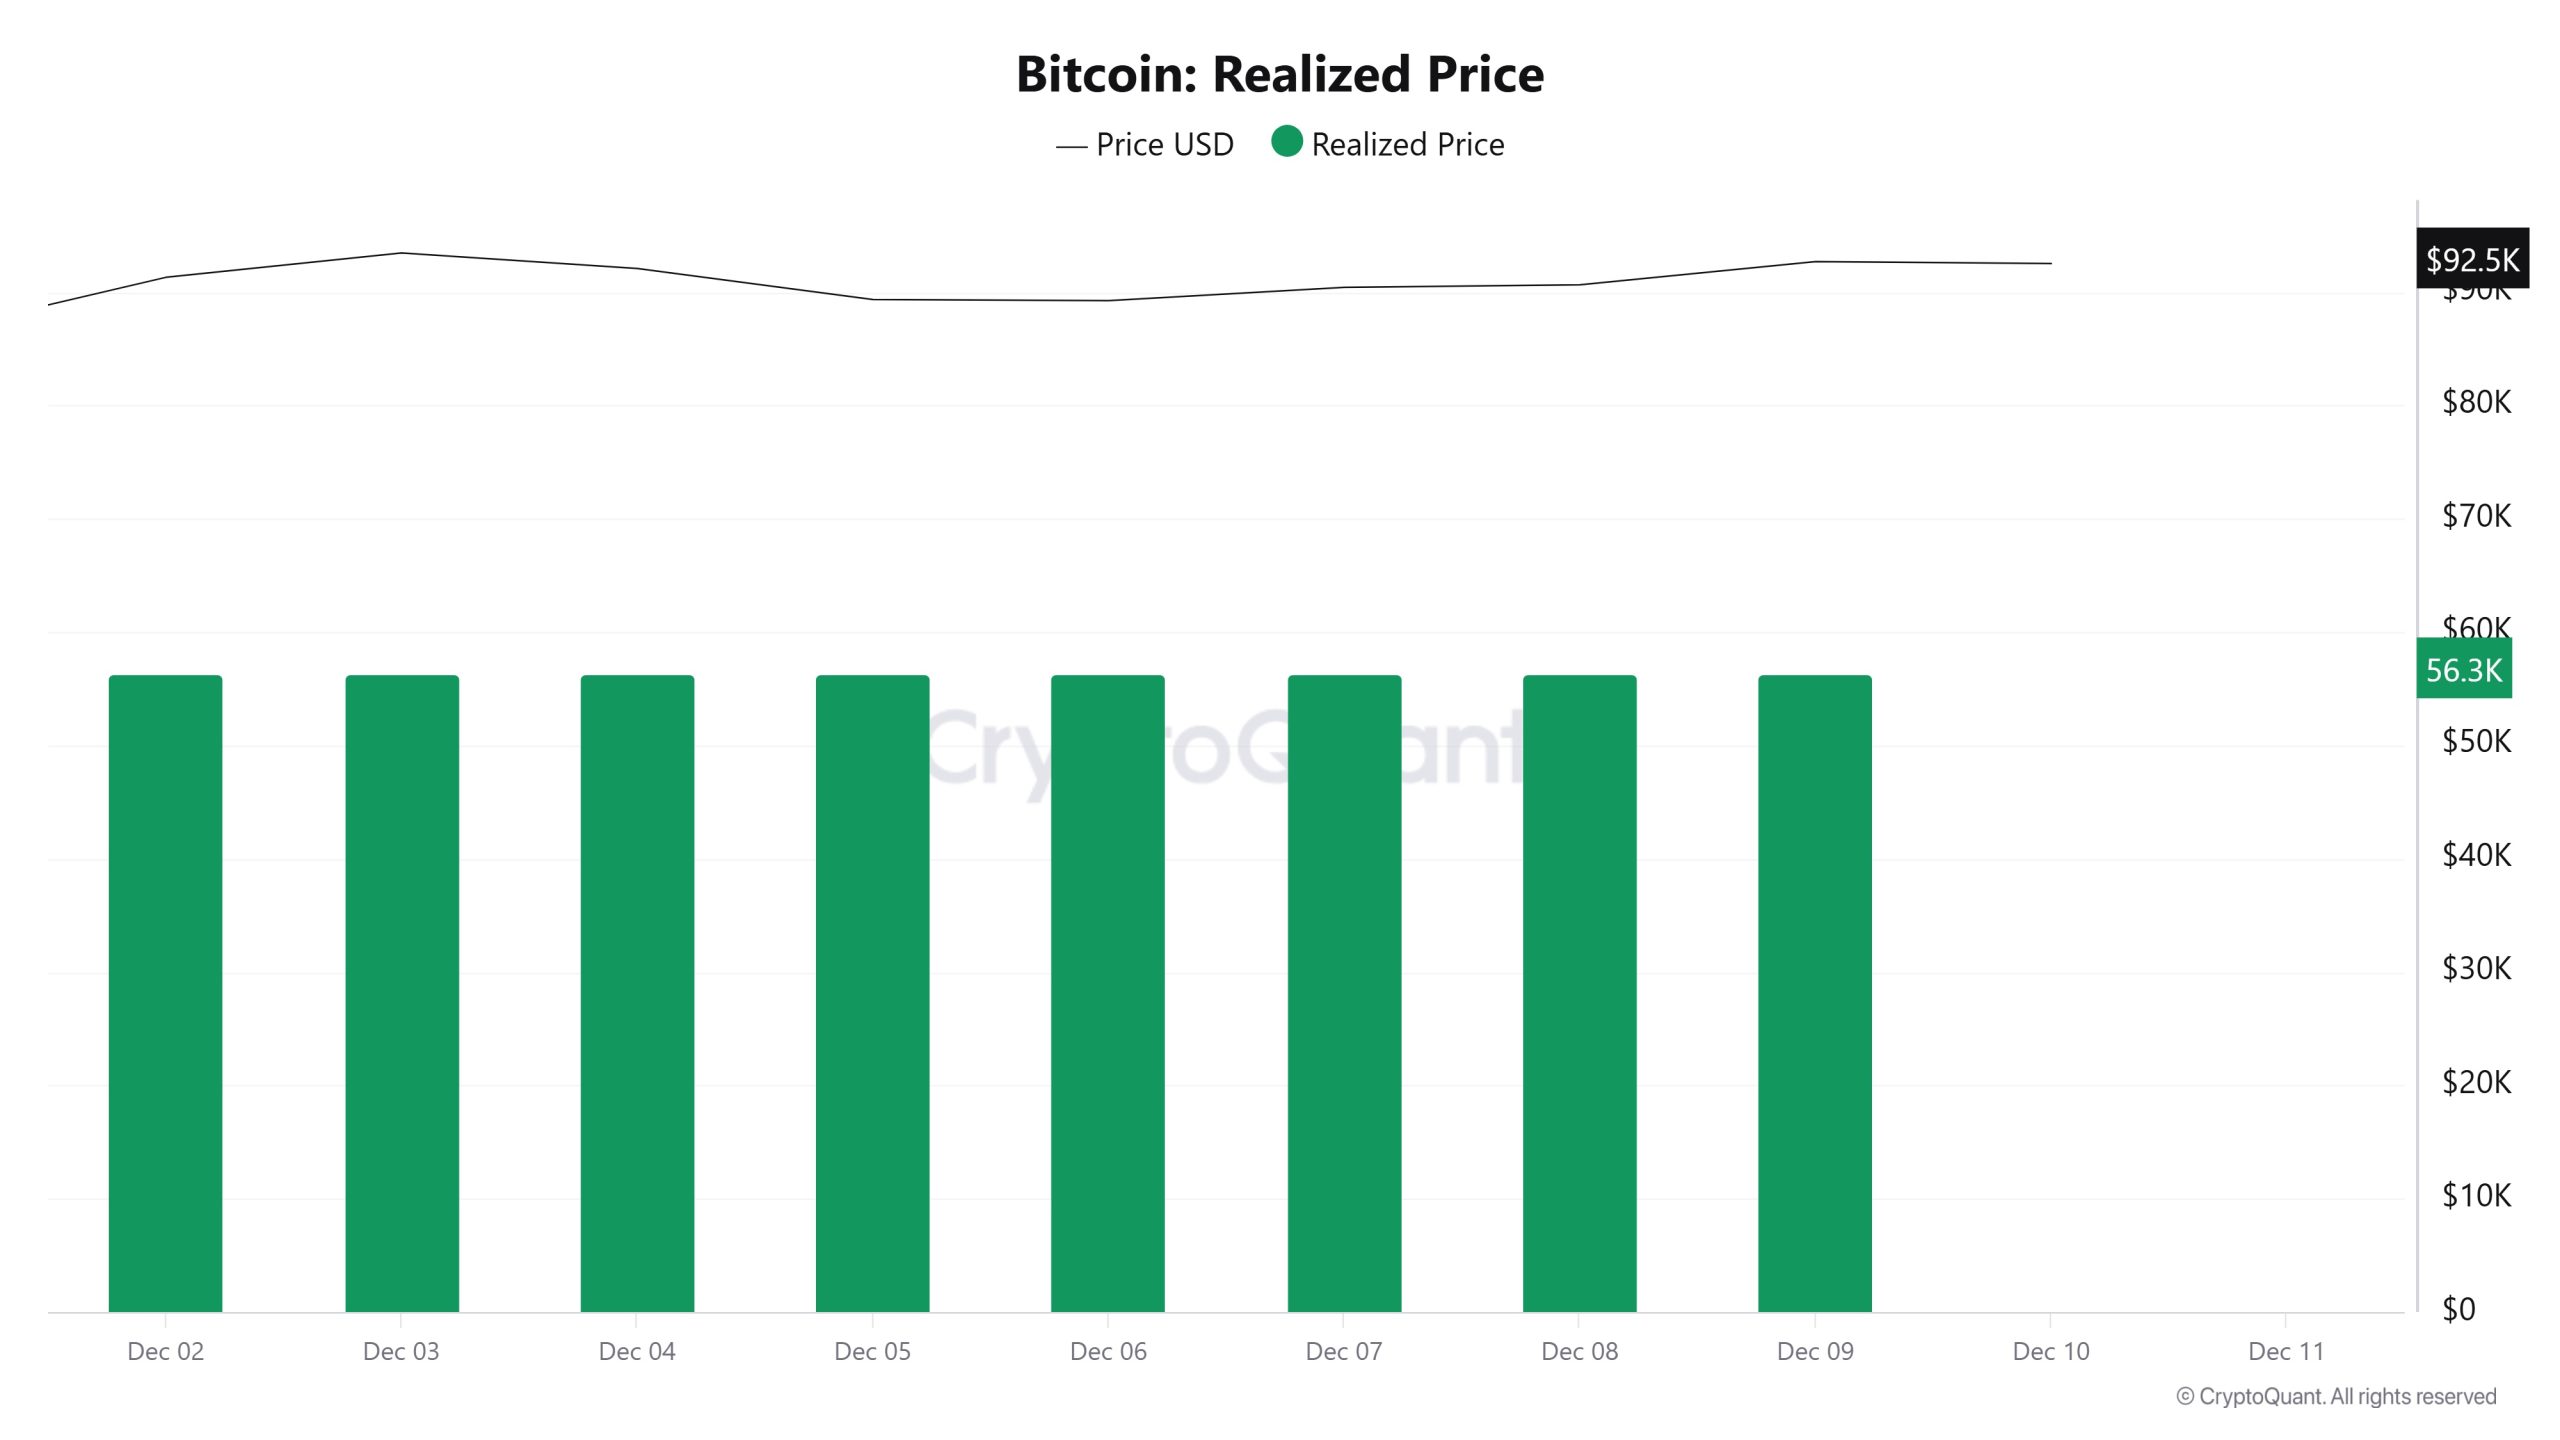
On December 3, Bitcoin was trading at $93,453, while the Realized Price stood at 56,396.
As of December 9, the Bitcoin price fell to $92,690, while the Realized Price declined to $56,346, recording a 0.09% drop.
Spent Output Profit Ratio (SOPR)
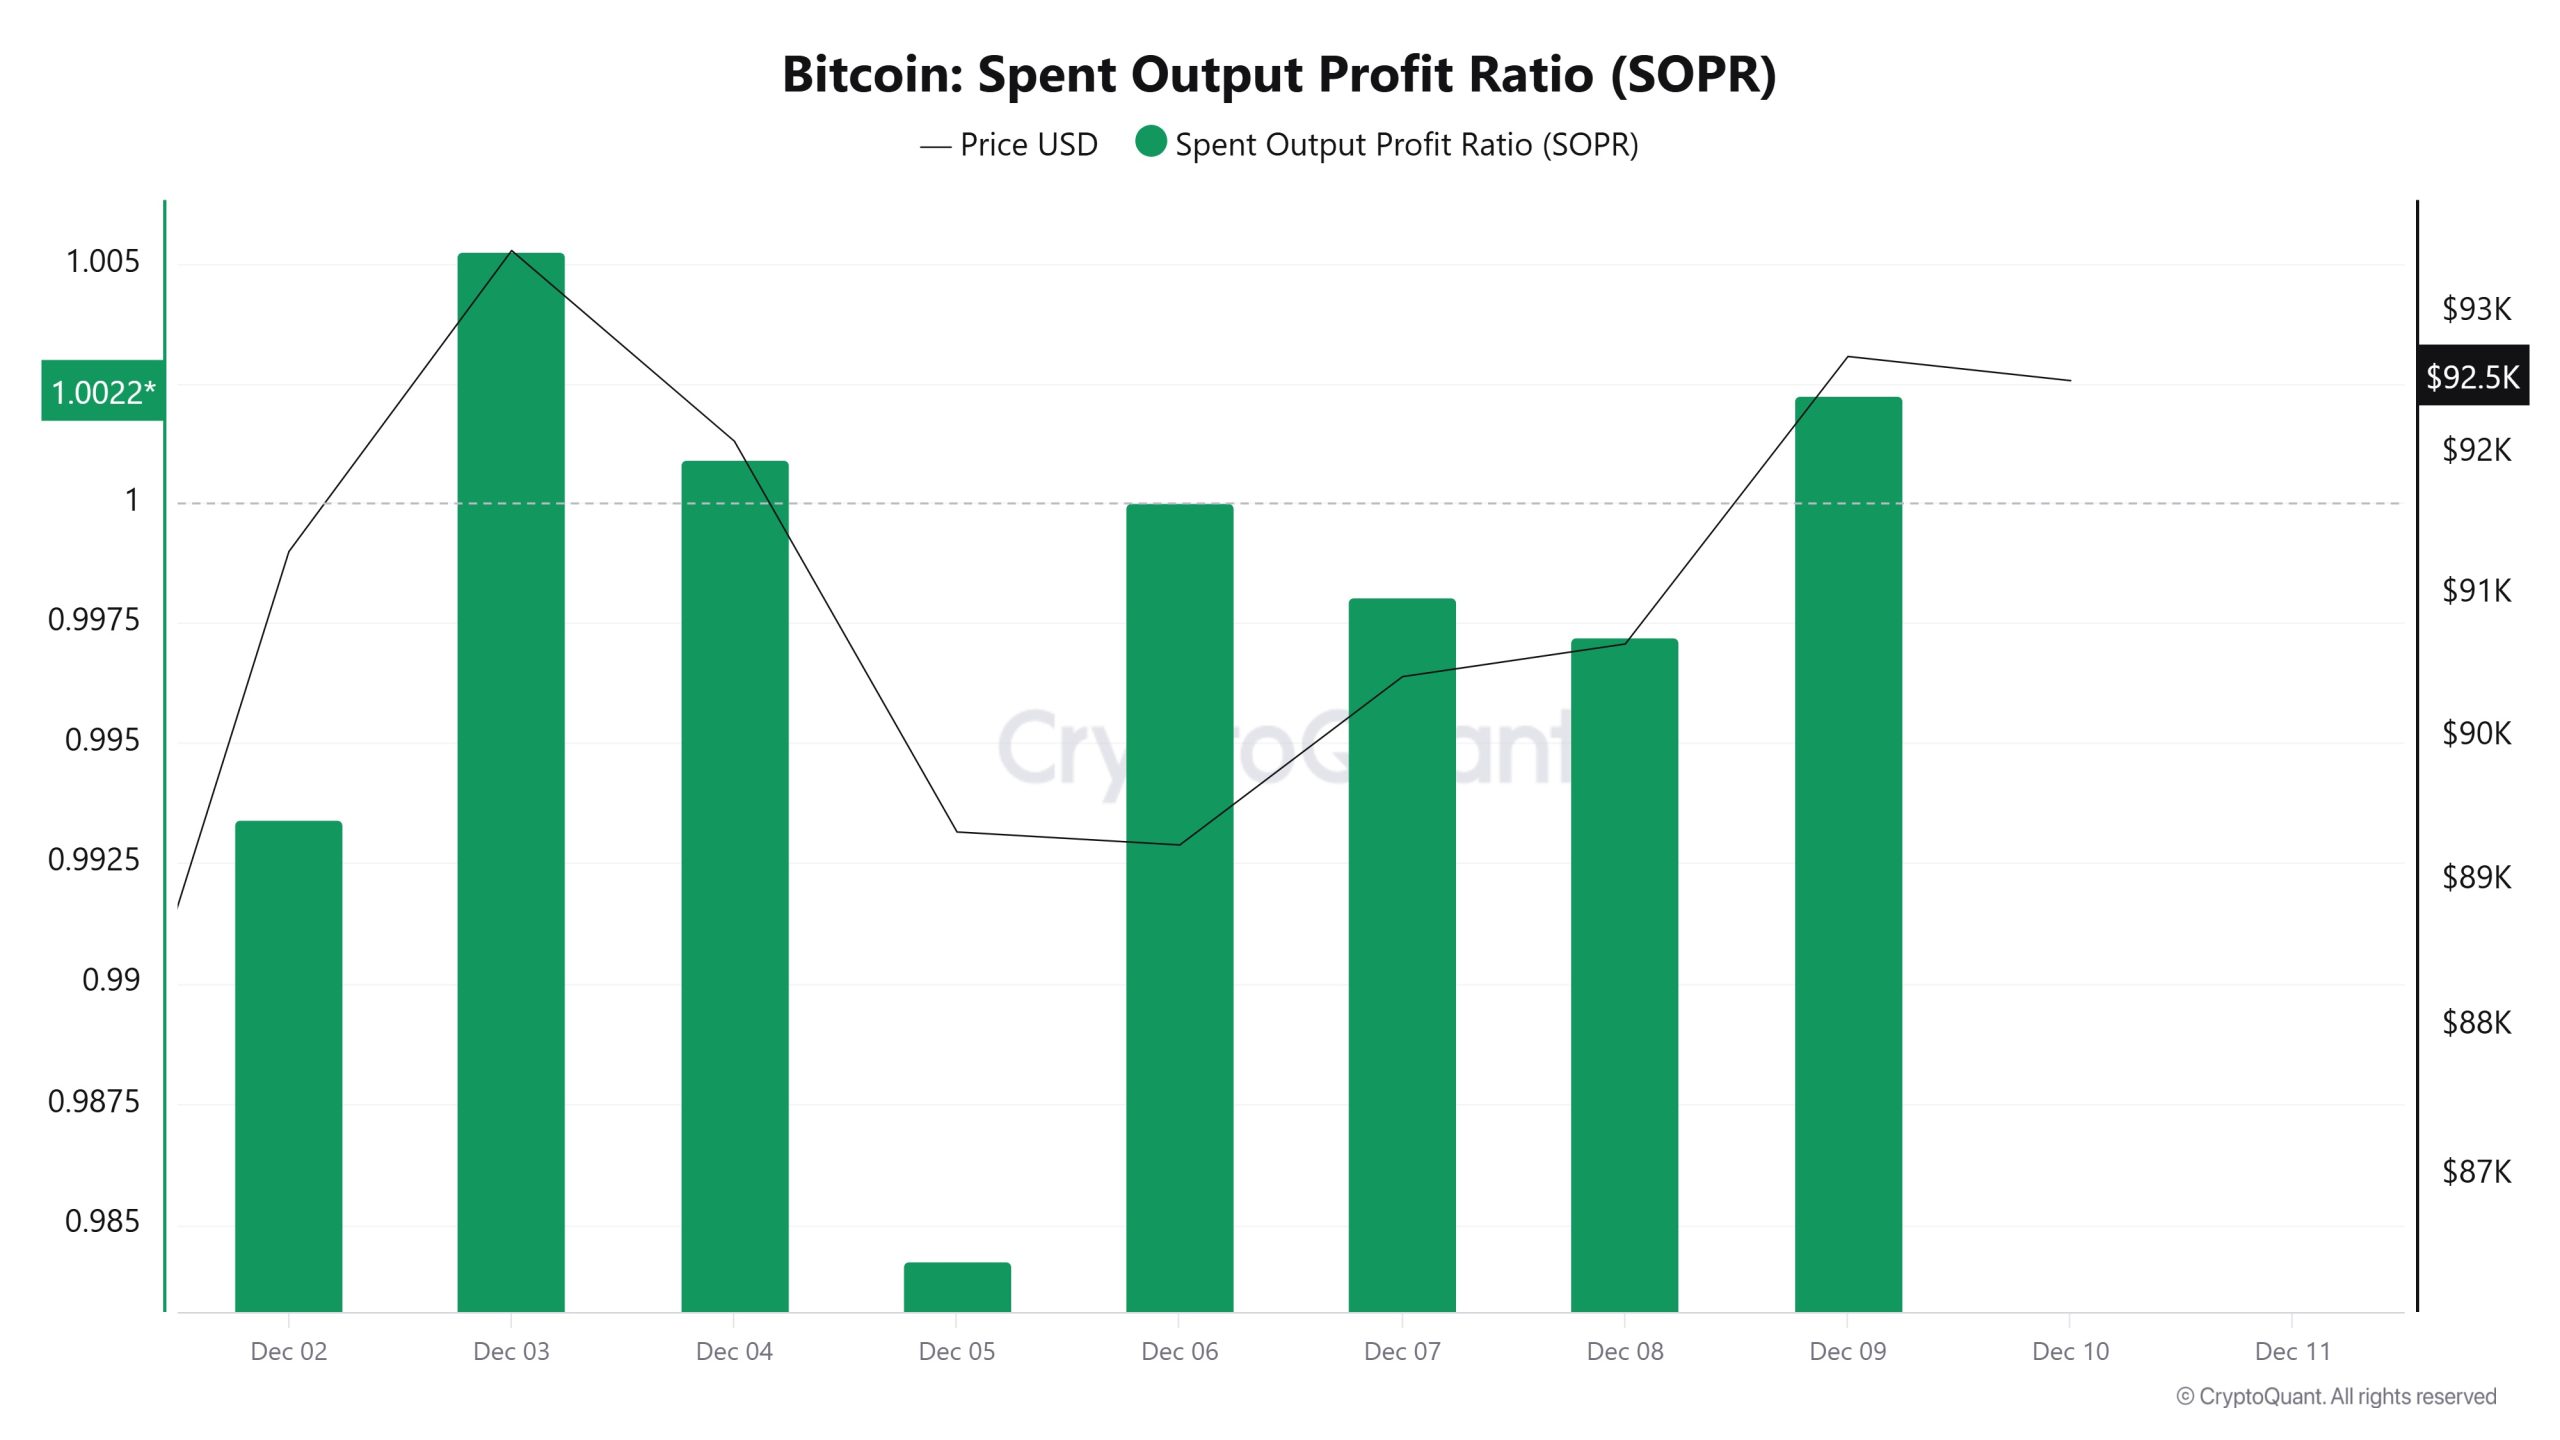
On December 3, while the Bitcoin price was trading at $93,453, the SOPR metric stood at 1.005.
As of December 9, the Bitcoin price fell to $92,690, while the SOPR metric declined to 1.002, recording a 0.30% drop.
Derivatives
Open Interest
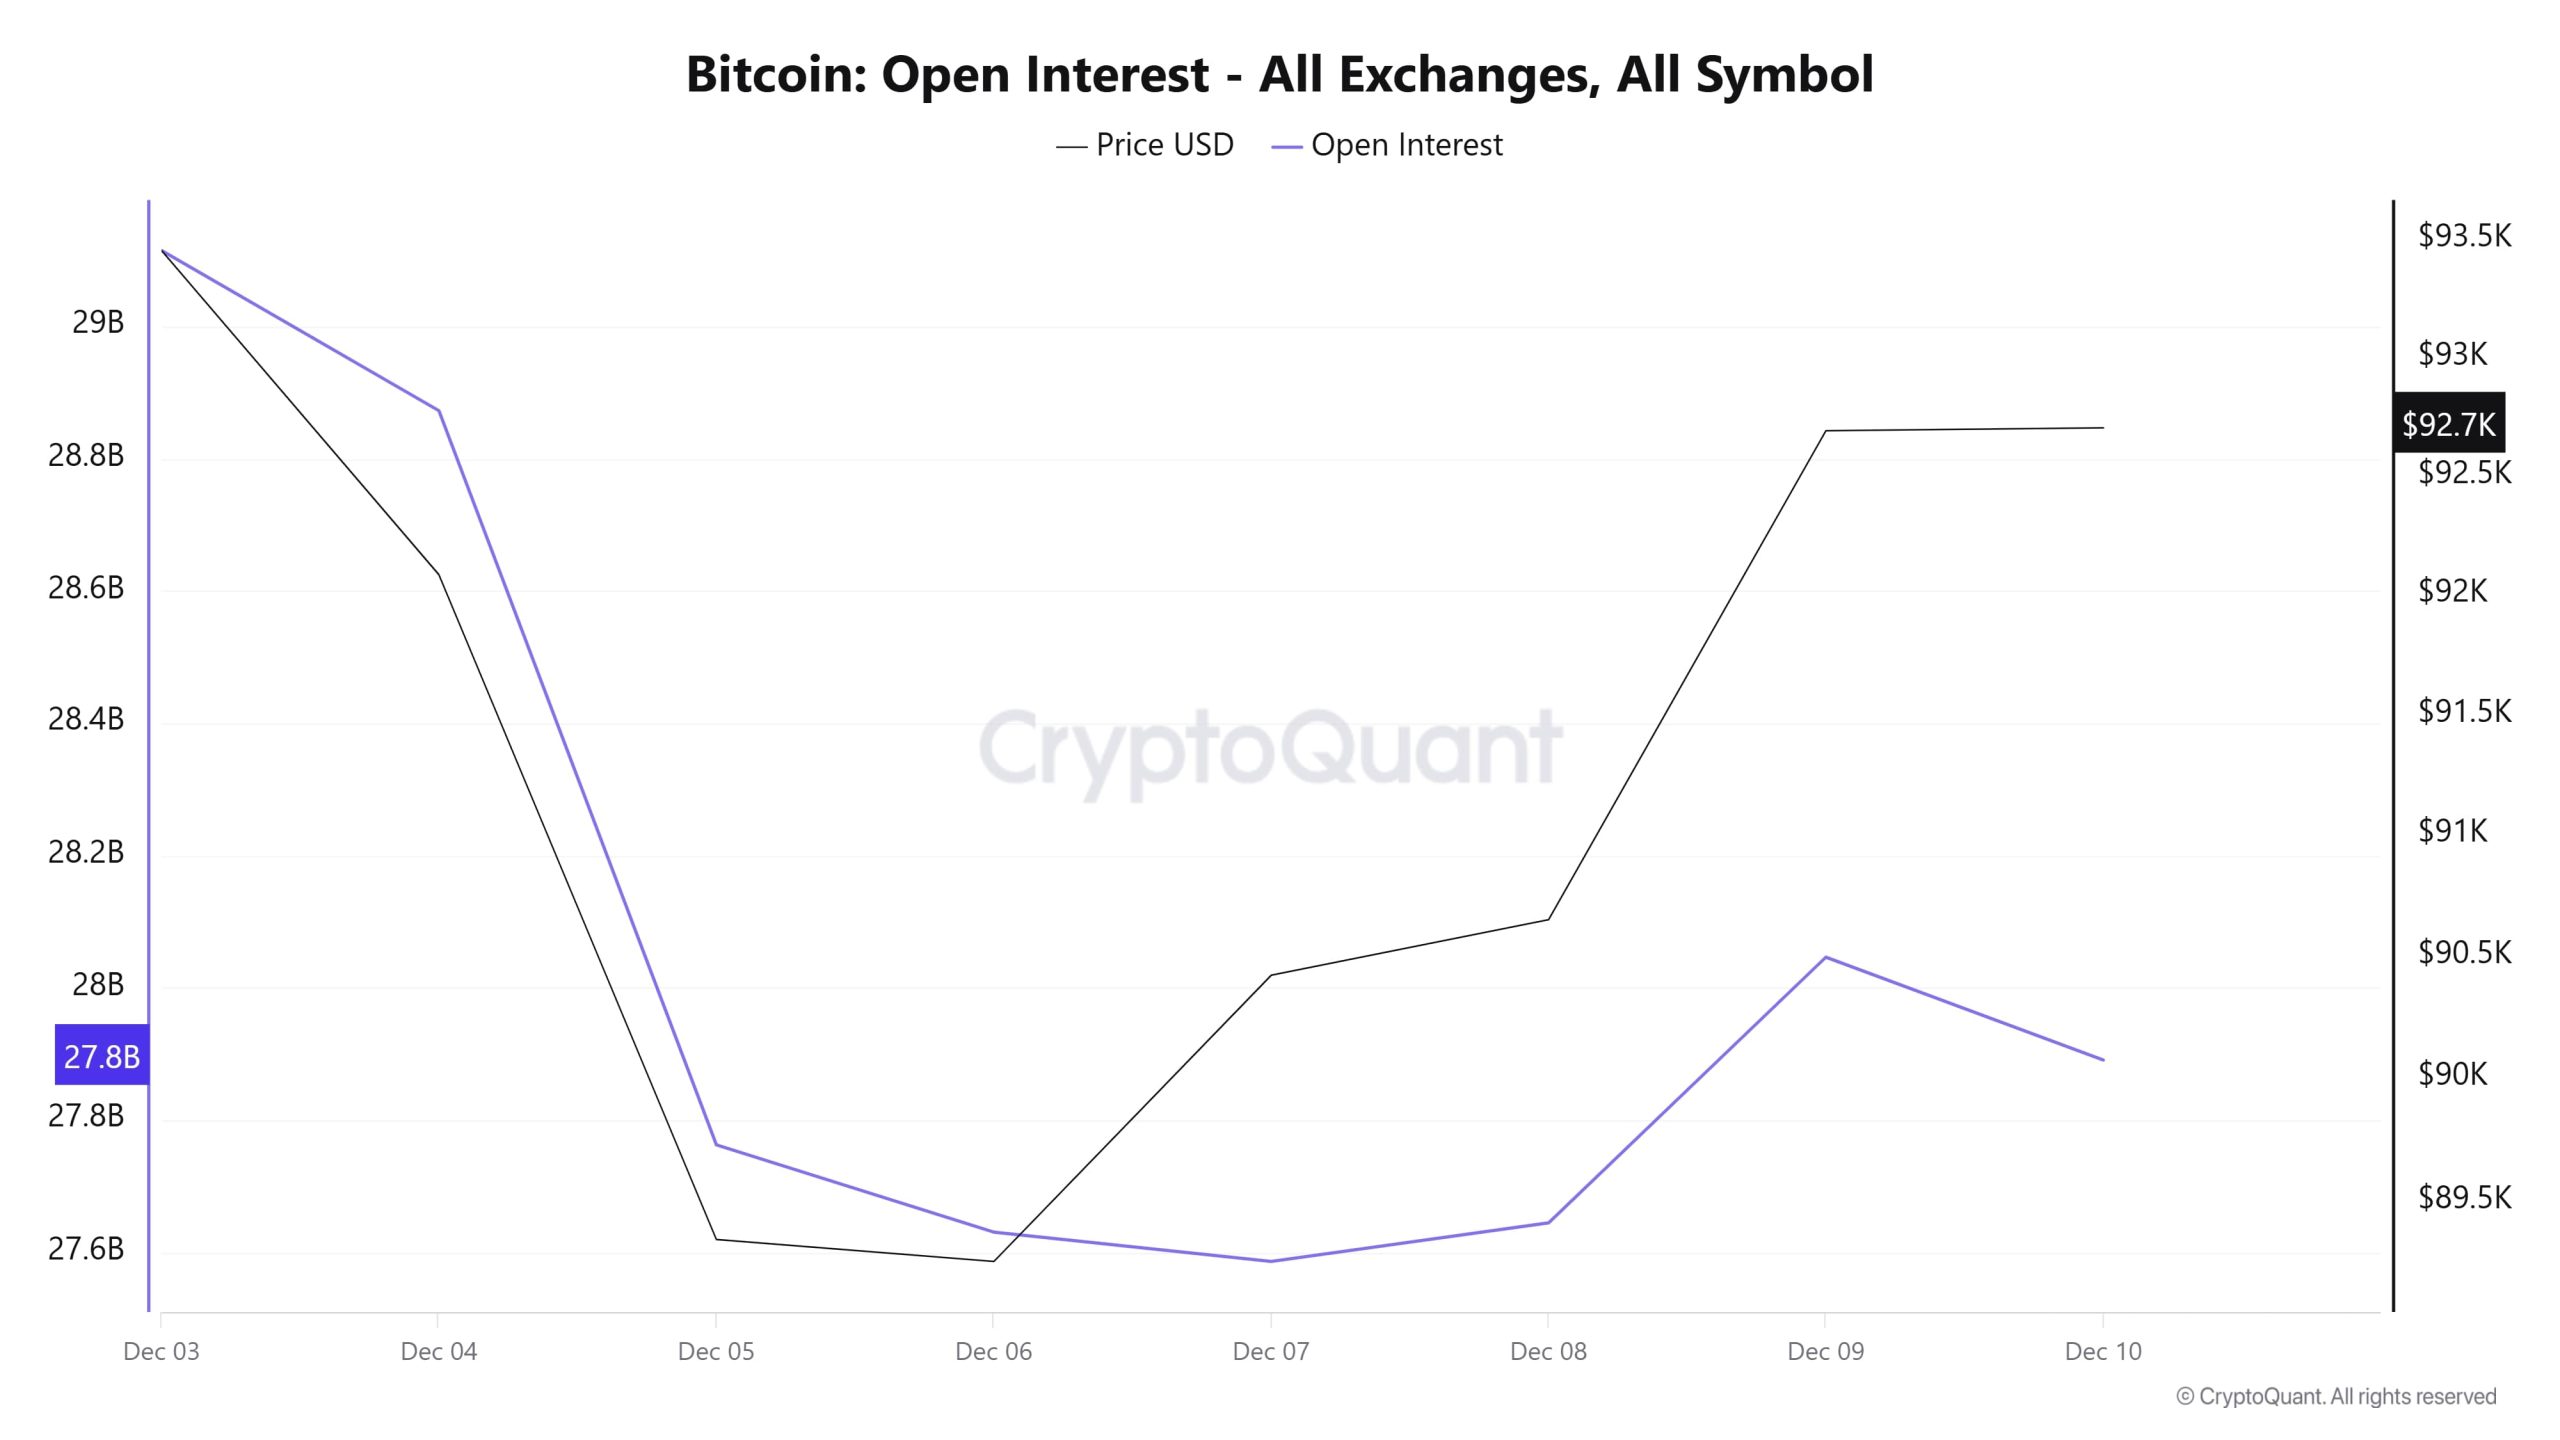
In the Bitcoin futures market, open positions are first experiencing a rapid pullback, followed por an attempt at recovery. The chart shows that both the price and open interest initially declined, indicating that leveraged positions were closed and investors moved away from risk en the short term. Following this weakening, the price regained strength, and a gradual recovery is also seen el the futures side. The fact that open interest is not fully supporting price movements indicates that a cautious stance is still being maintained. In particular, as the price approaches the $92,000 range again, the failure of open positions to increase at the same pace suggests that the rise is not being driven por strong leverage support.
The overall outlook indicates that there is a recovery trend en the Bitcoin futures market, but confidence has not fully returned. The fact that open interest data has gained stronger momentum along with the price is the most important factor that could support the bullish scenario.
Funding Rate
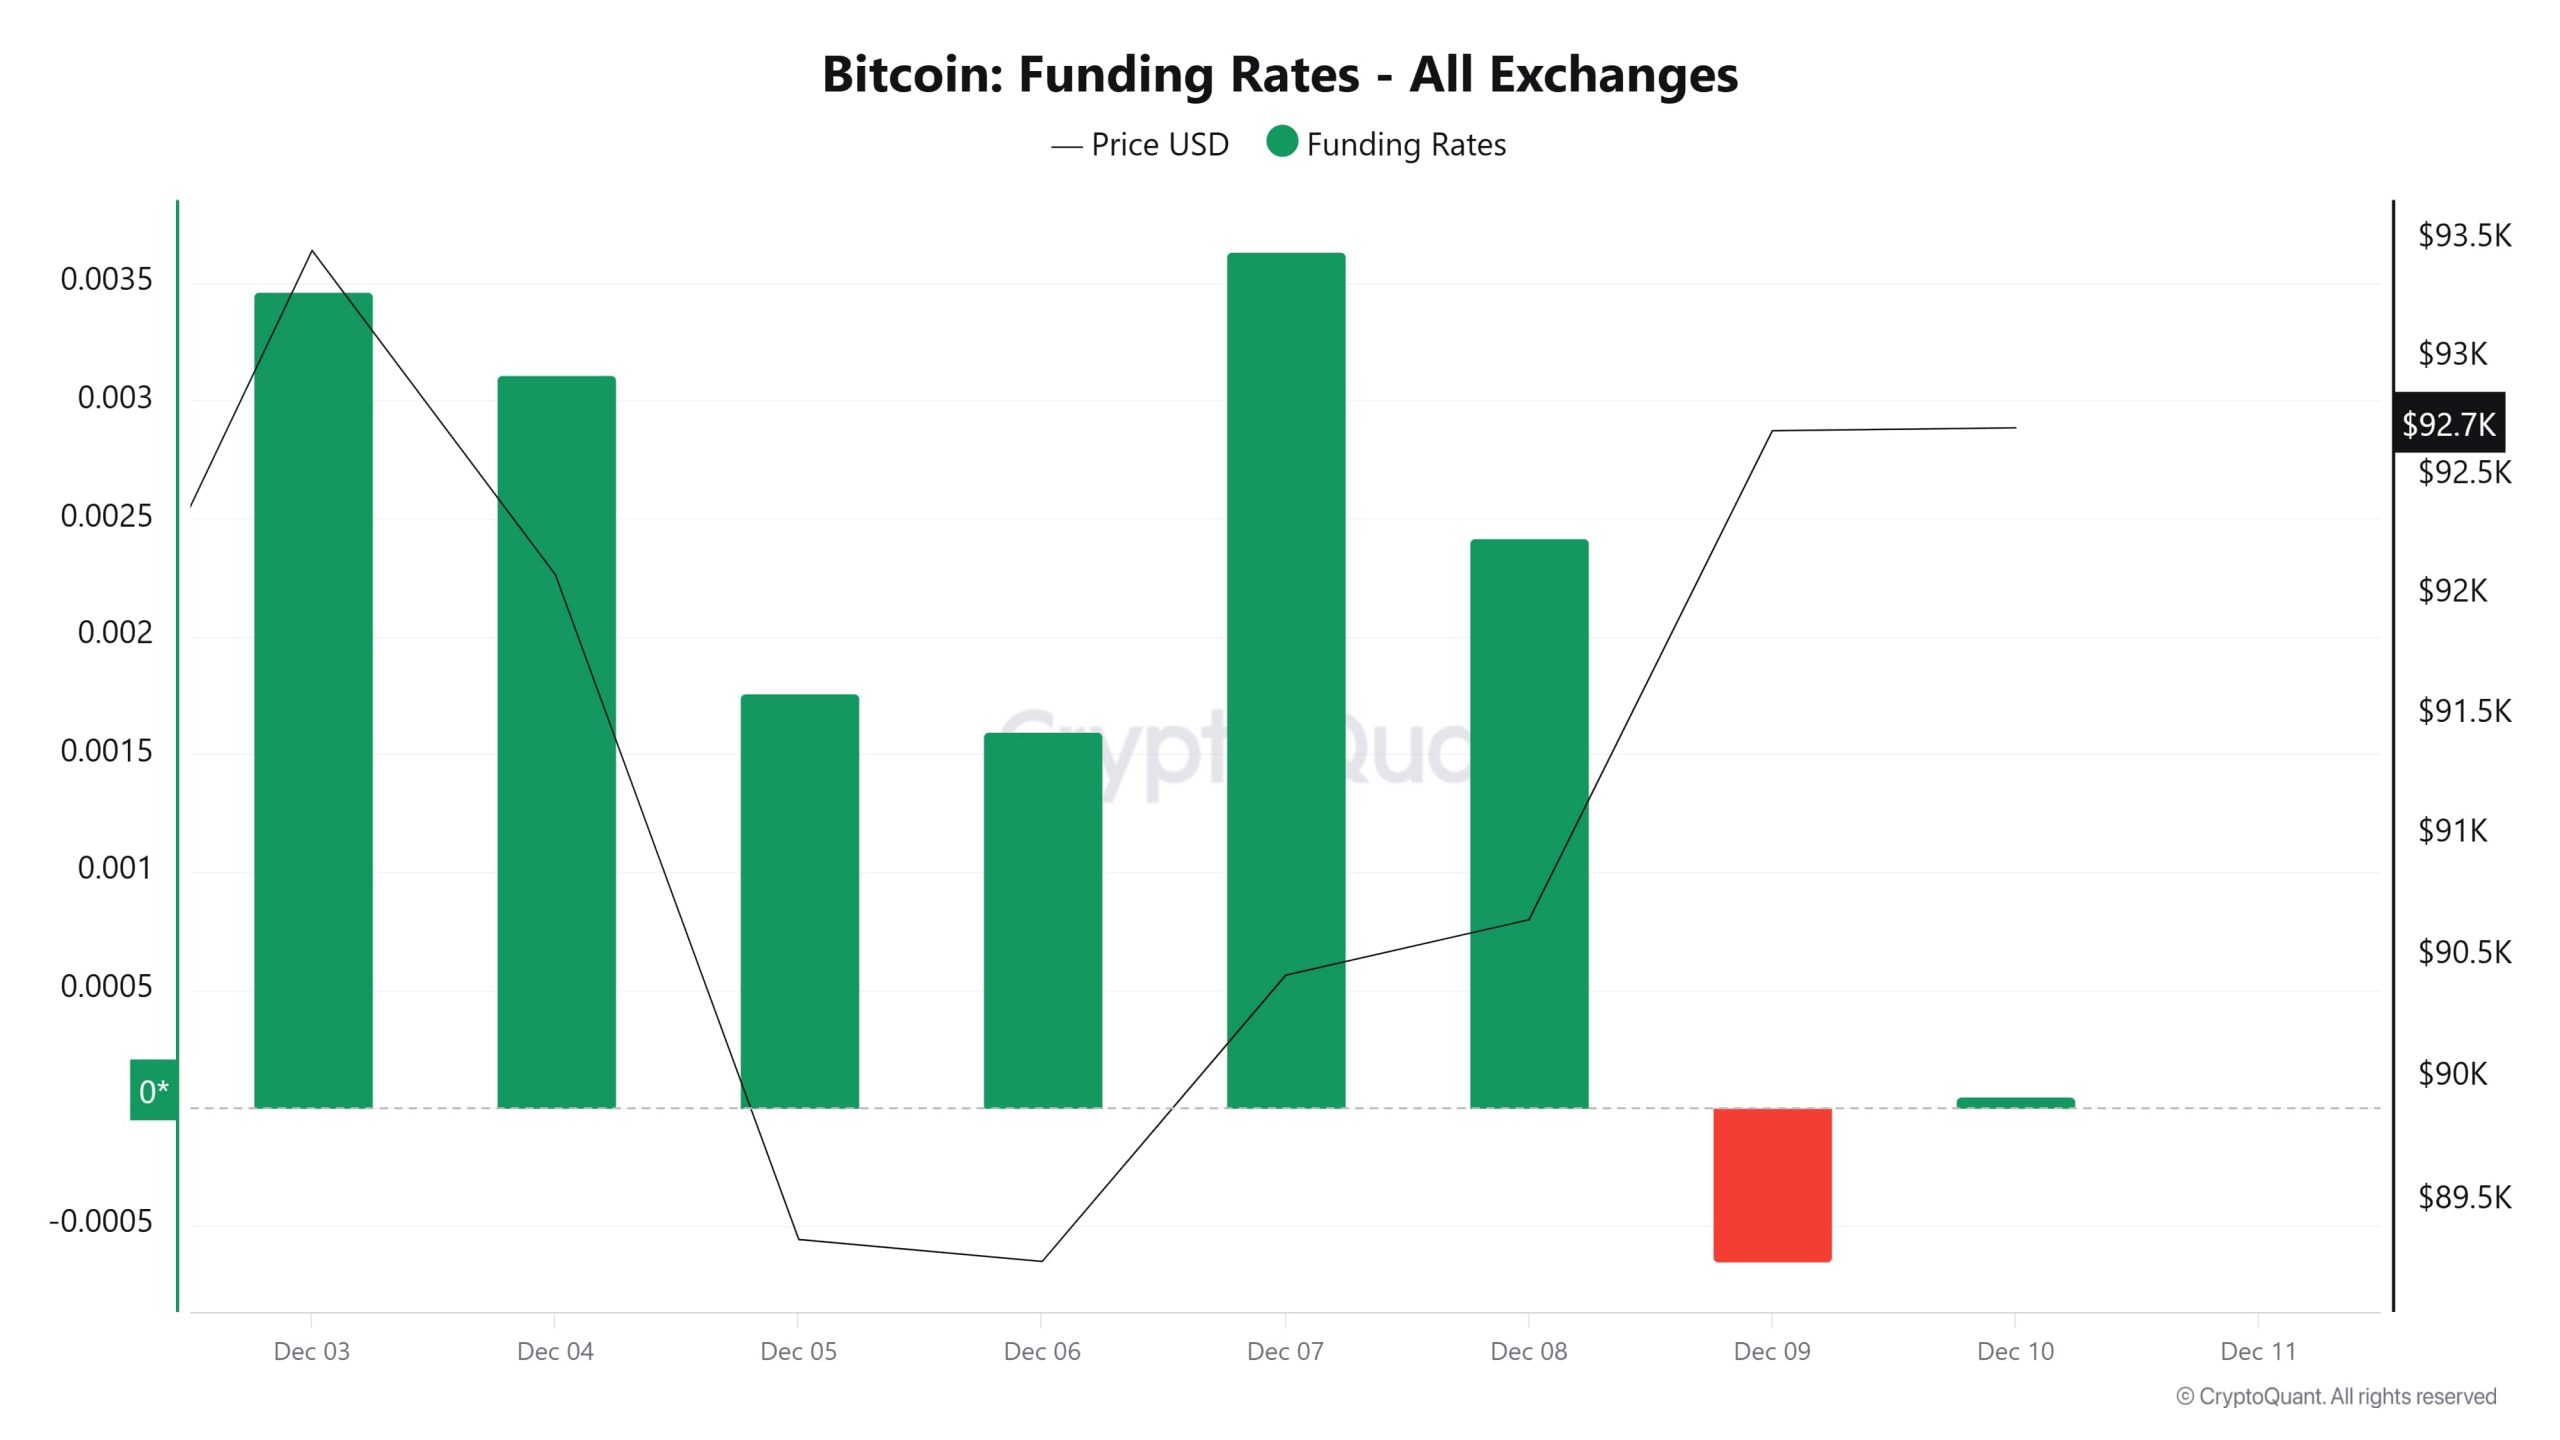
Bitcoin funding rate data reveals that trader sentiment has been quite volatile. Rates, which have mostly remained en positive territory, indicate that long positions continue to dominate. However, it is noteworthy that the funding rate turned negative el the day the price rose. This movement signals that short-term sell positions have come into play. The strong positive jump el December 7 indicates a renewed appetite for risk en the futures market, while the subsequent decline suggests that the market is still uncertain about a definitive direction. The funding rate’s recovery as the price approached the $92,000 range supports the view that the upward trend has not completely disappeared.
The overall picture shows that short-term sentiment en the Bitcoin market is changing rapidly, but as long as the positive funding structure continues, the upward trend will remain dominant.
Long & Short Liquidations
Last week, the BTC price rose from $86,000 to $94,500, resulting en a total of $716 million en long liquidations and $866 million en short liquidations.
| Date | Long Volume (Million $) | Short Volume (Million $) |
|---|---|---|
| December 3 | 37.01 | 66.59 |
| December 4 | 36.30 | 25.66 |
| December 5 | 243.94 | 16.13 |
| December 6 | 6.93 | 7.48 |
| December 7 | 186.00 | 68.95 |
| December 8 | 23.66 | 25.75 |
| December 9 | 182.32 | 656.32 |
| Total | 716.16 | 866.88 |
Supply Distribution

Total Supply: Reached 19,957,258 units, an increase of approximately 0.013% compared to last week.
New Supply: The amount of BTC produced this week was 2,659.
Velocity: The velocity, which was 12.35 last week, reached 12.29 as of December 9.
| Wallet Categoría | 12/03/2025 | 12/09/2025 | Change (%) |
|---|---|---|---|
| < 1 BTC | 8.4471% | 8.4455% | -0.0190% |
| 1 – 10 BTC | 11.3201% | 11.3190% | -0.0097% |
| 10 – 100 BTC | 23.1906% | 23.1525% | -0.1642% |
| 100 – 1k BTC | 27.9950% | 28.0888% | 0.3354% |
| 1k – 10k BTC | 21.0479% | 20.9261% | -0.5790% |
| 10k+ BTC | 7.9989% | 8.0677% | 0.8601% |
Recent weekly data indicates a selective divergence en Bitcoin wallet distribution. While slight declines were observed en the <1 BTC, 1–10 BTC, and 10–100 BTC groups, the increase en the share of the 100–1,000 BTC band highlights a trend toward accumulation en this segment. A notable decline is seen en the 1,000–10,000 BTC range, while the increase en wallets holding 10,000 BTC and above signals that large investors are beginning to reposition themselves.
Exchange Supply Ratio
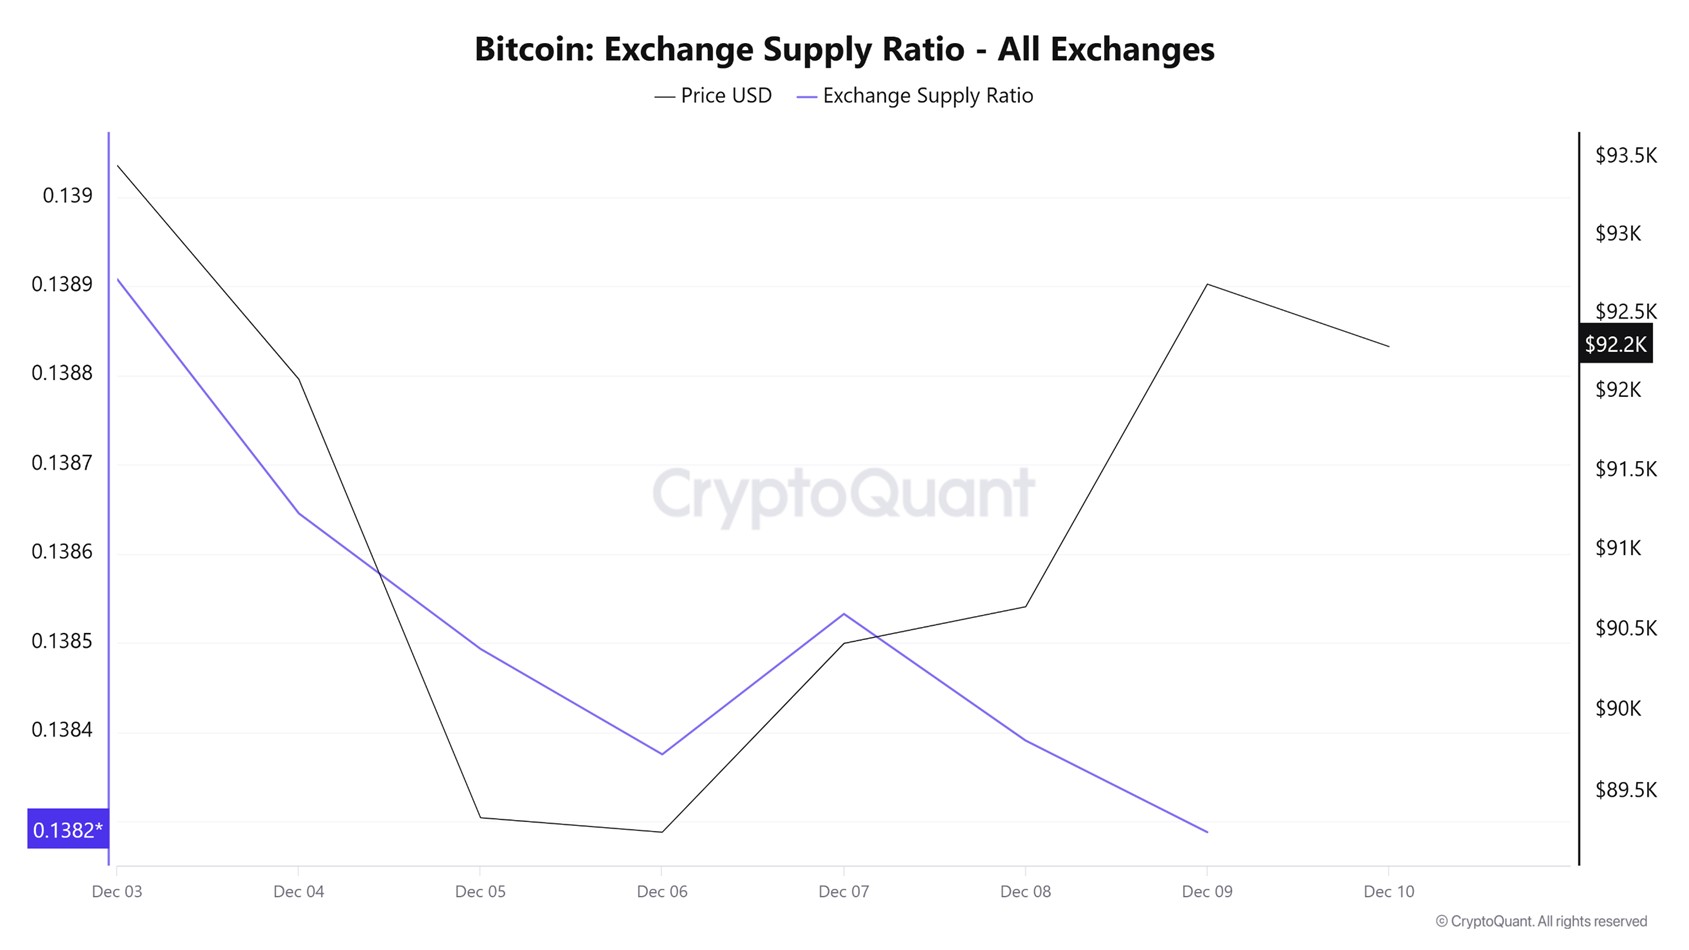
According to data obtained from the Bitcoin Exchange Supply Ratio table, which shows how much of the total Bitcoin supply is held el exchanges, low ratios were observed this week. The general trend indicates a positive correlation between the Bitcoin price and the supply ratio entering exchanges as of December 3. As of December 6, a negative divergence has occurred between the supply ratio and the price. This suggests that most Bitcoins are beginning to be withdrawn from wallets and that the market is not ready to buy.
Between December 3 and December 10, the Bitcoin Exchange Supply Ratio decreased from 0.1389083 to 0.13828765. During this period, the Bitcoin price fell from $93,000 to $85,000. Notably, the fact that both variables moved en the same direction this week indicates a slight increase en the amount of Bitcoin supplied to exchanges despite the price decline, suggesting that long-term investors may have begun to increase their holdings here. In terms of the Bitcoin price, uncertainty is likely to prevail overall.
Exchange Reserve
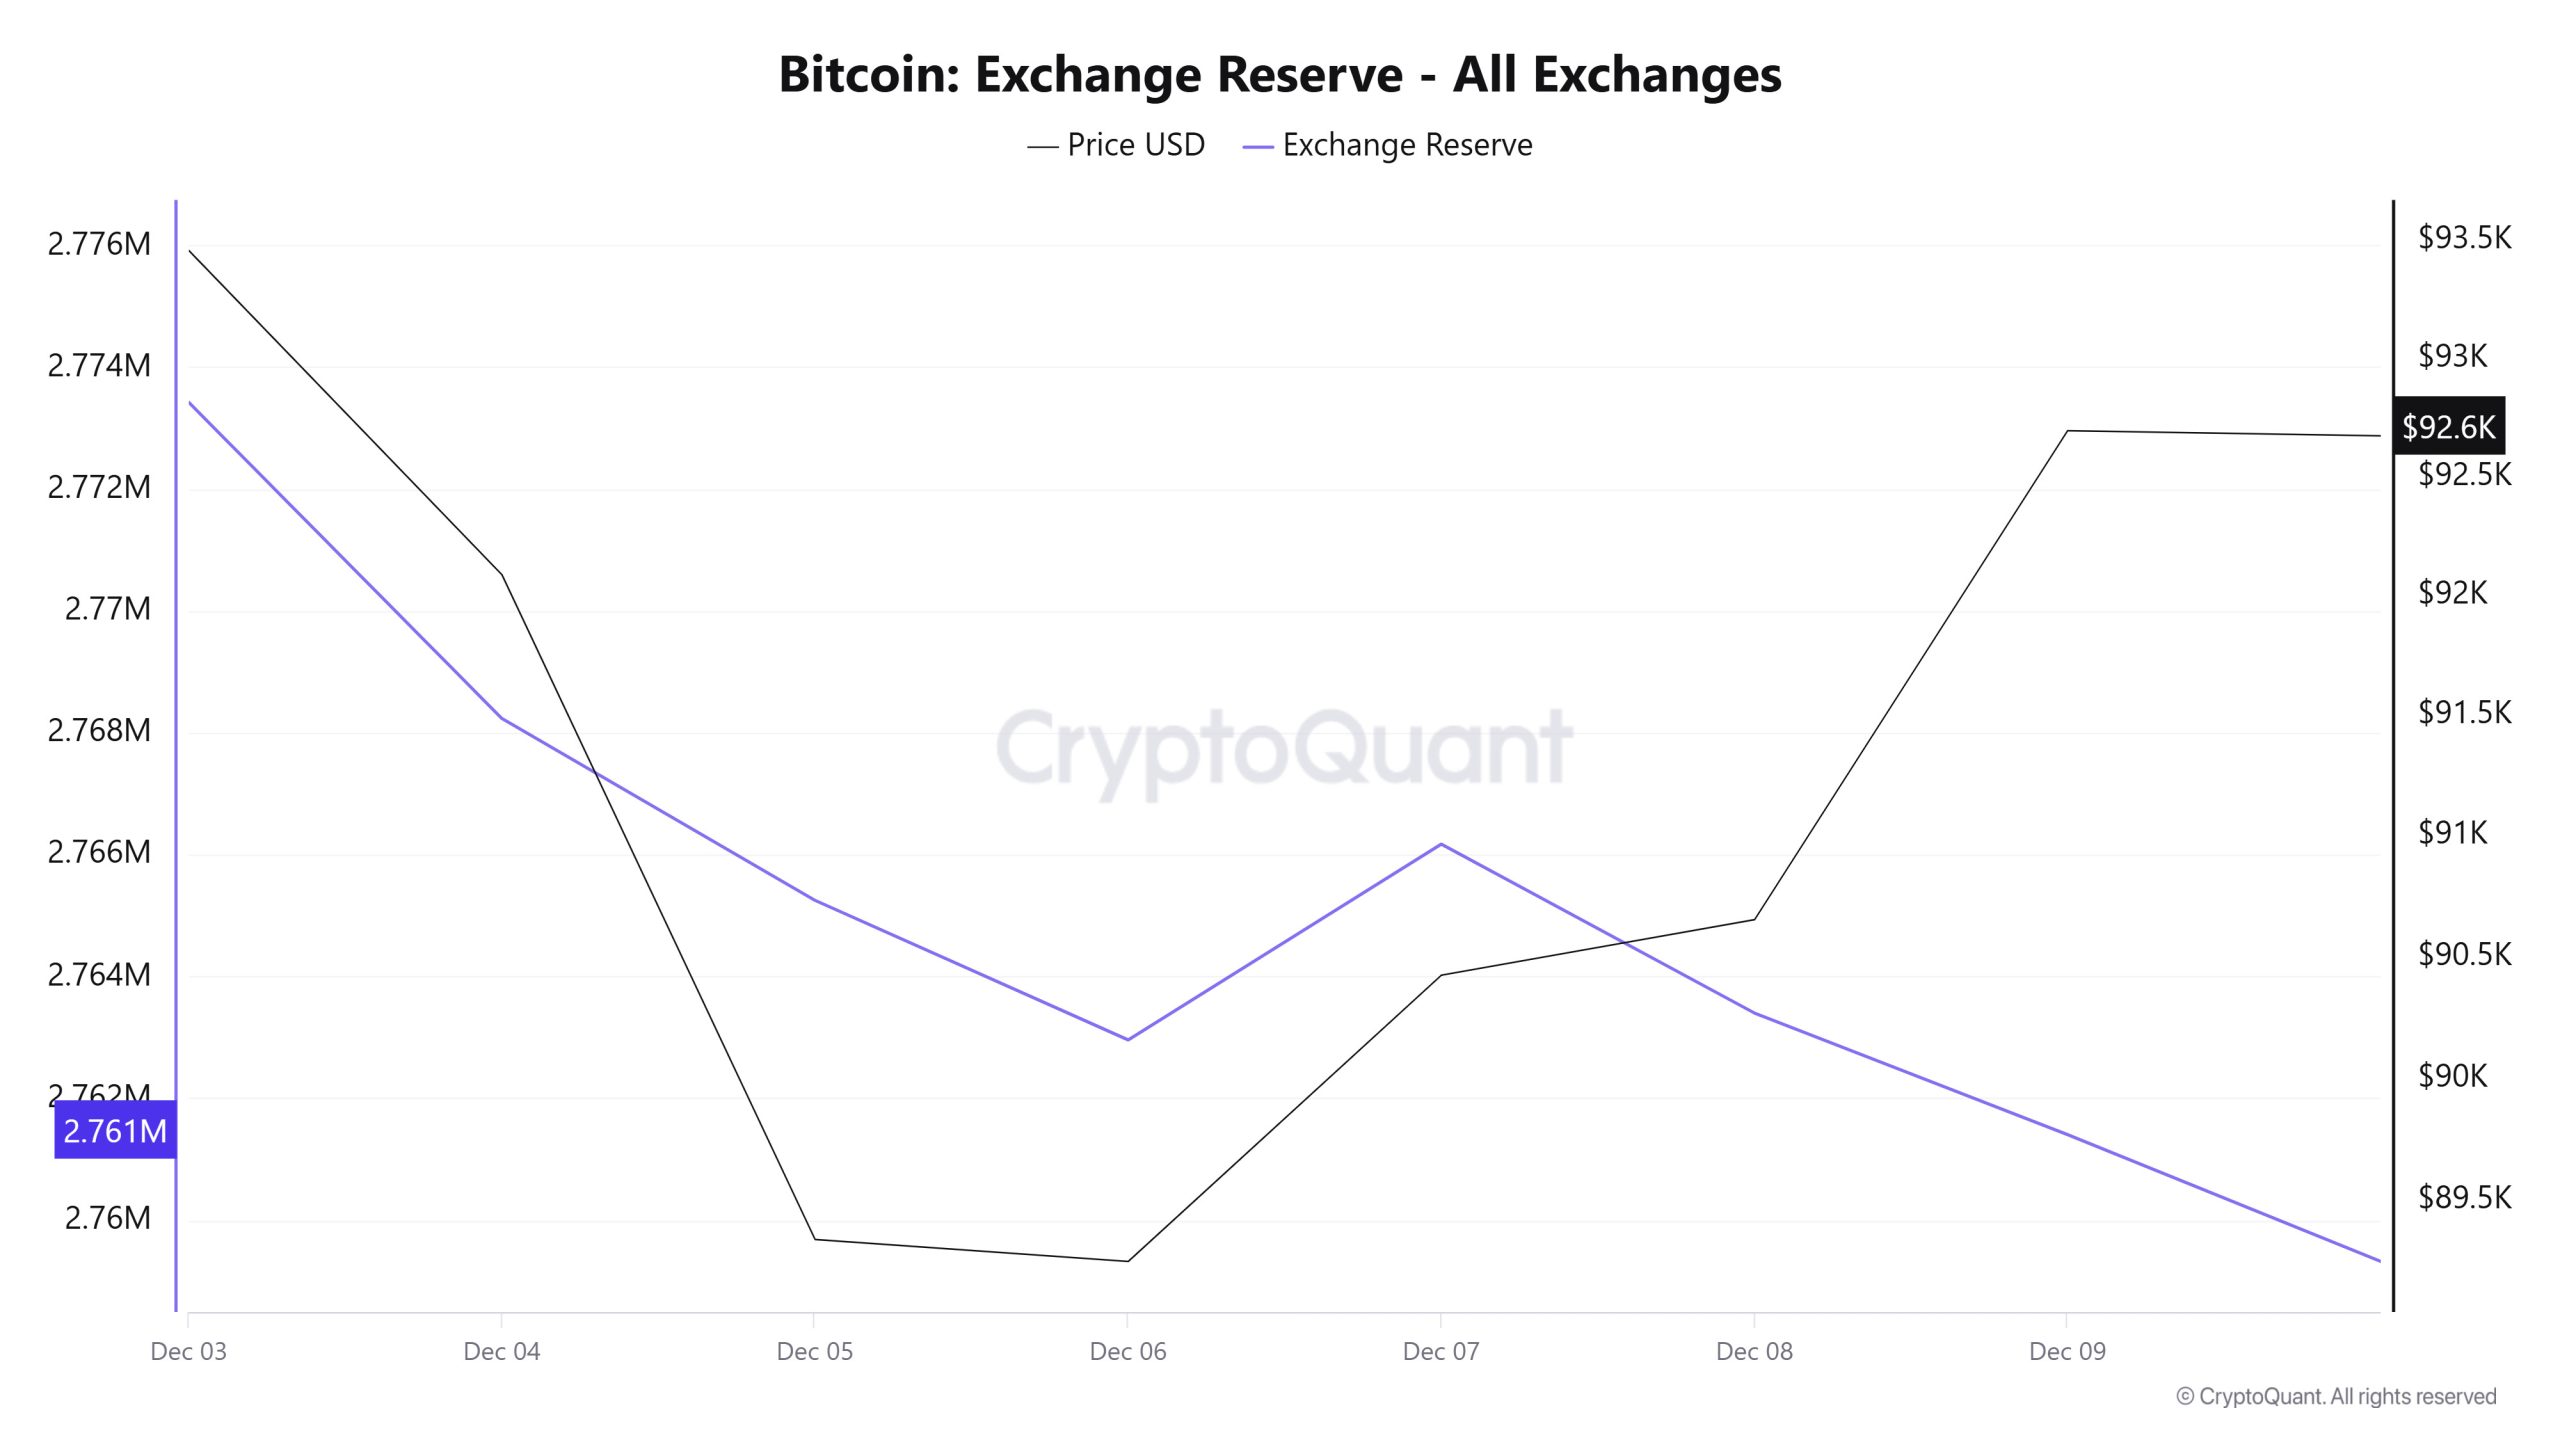
Between December 3 and 9, 2025, Bitcoin reserves el exchanges fell from 2,775,913 BTC to 2,761,403 BTC, resulting en a net outflow of 14,511 BTC. During this period, reserves decreased por approximately 0.52%, while the BTC price rose from $91,329 to $92,690, gaining 1.49% en value. The decrease en reserves while the price moved upward showed that investors continued to withdraw their BTC from exchanges rather than selling el the rise, adopting a more cautious, long-term approach. Price movements may remain volatile en the short term, but continued outflows from exchanges could create a slight tightening el the supply side, supporting the price.
| Date | 03-Dec | 04-Dec | 05-Dec | 06-Dec | 07-Dec | 08-Dec | 09-Dec |
|---|---|---|---|---|---|---|---|
| Exchange Inflow | 38,540 | 27,920 | 30,374 | 14,354 | 15,395 | 27,333 | 35,517 |
| Exchange Outflow | 41,032 | 33,109 | 33,358 | 16,645 | 12,181 | 30,106 | 37,513 |
| Exchange Netflow | -2,492 | -5,189 | -2,984 | -2,290 | 3,214 | -2,773 | -1,996 |
| Exchange Reserve | 2,773,421 | 2,768,232 | 2,765,248 | 2,762,958 | 2,766,171 | 2,763,398 | 2,761,403 |
| BTC Price | 91,329 | 92,084 | 89,339 | 89,250 | 90,421 | 90,649 | 92,690 |
Fees and Revenues
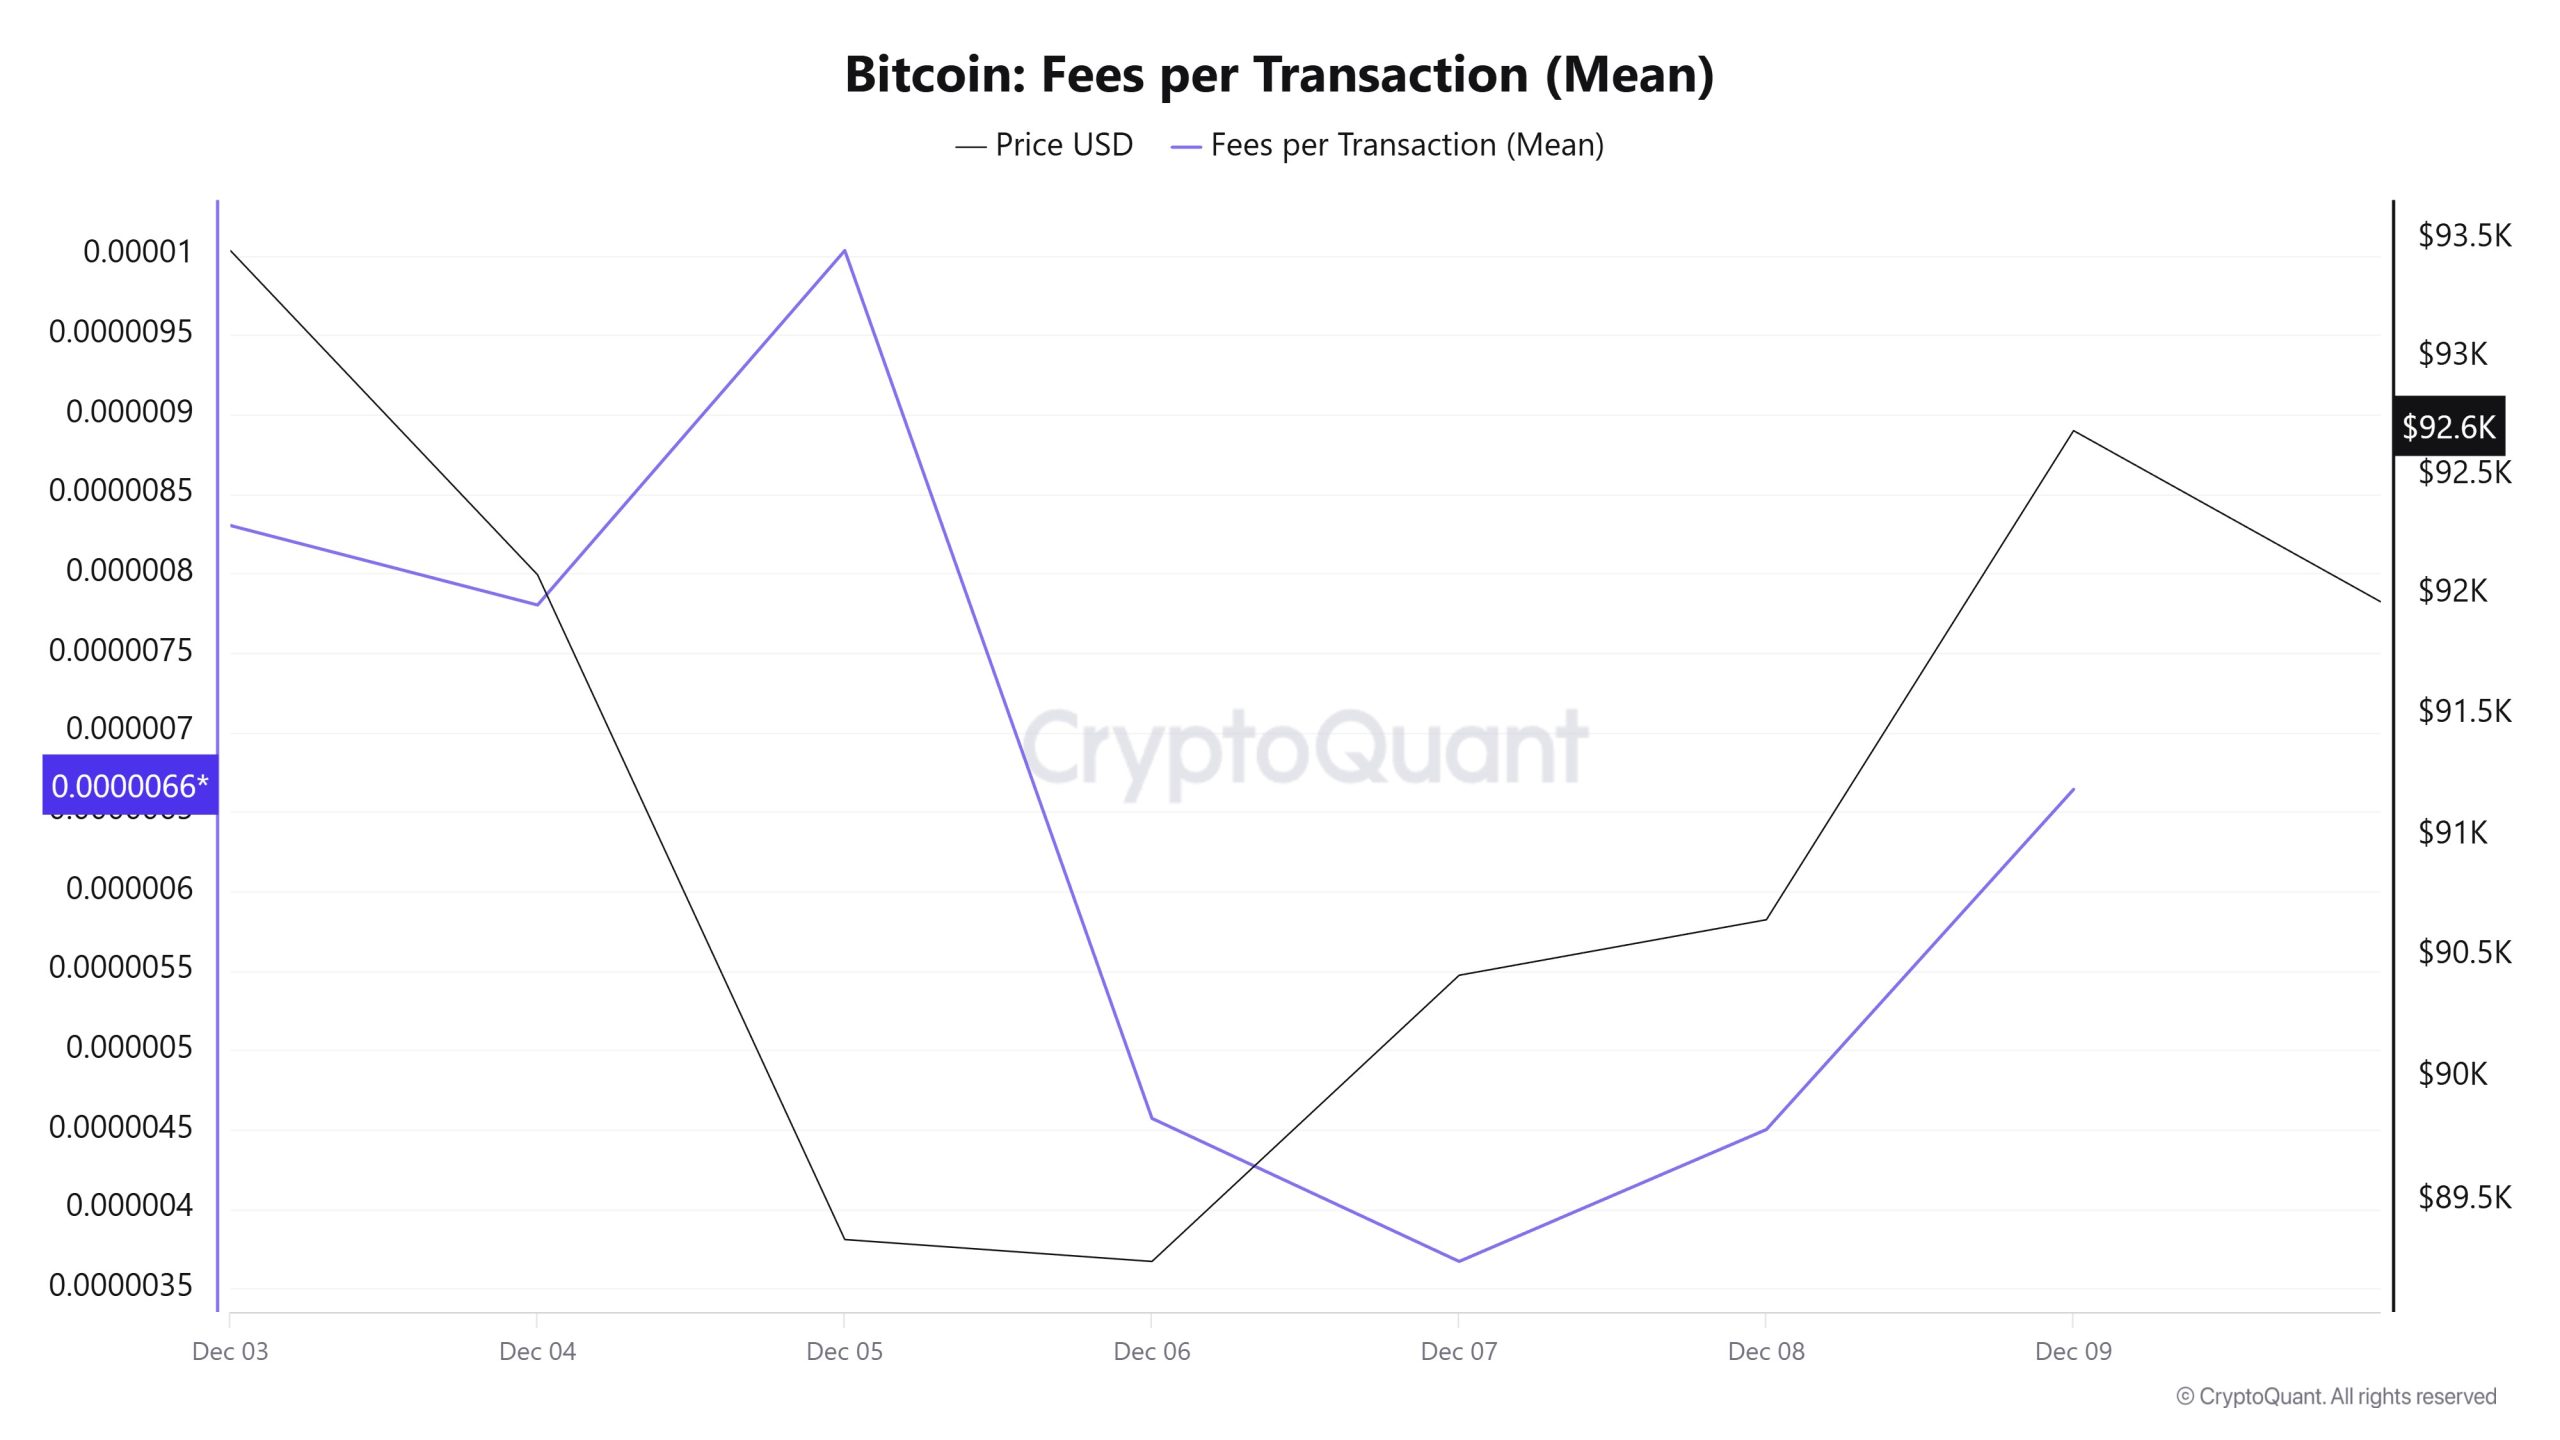
When examining the Bitcoin Fees per Transaction (Mean) data between December 3 and 9, it is observed that the indicator reached 0.0000083 el December 3, the first day of the week.
A fluctuating trend was observed until December 7, and el this date, the indicator recorded the week’s lowest value at 0.00000367.
In this context, as of December 7, the indicator regained momentum as a result of increased Bitcoin price volatility and followed a positive trend due to the impact of price volatility.
On December 9, the last day of the weekly period, the indicator closed the week at 0.00000664 .
Bitcoin: Fees (Total)
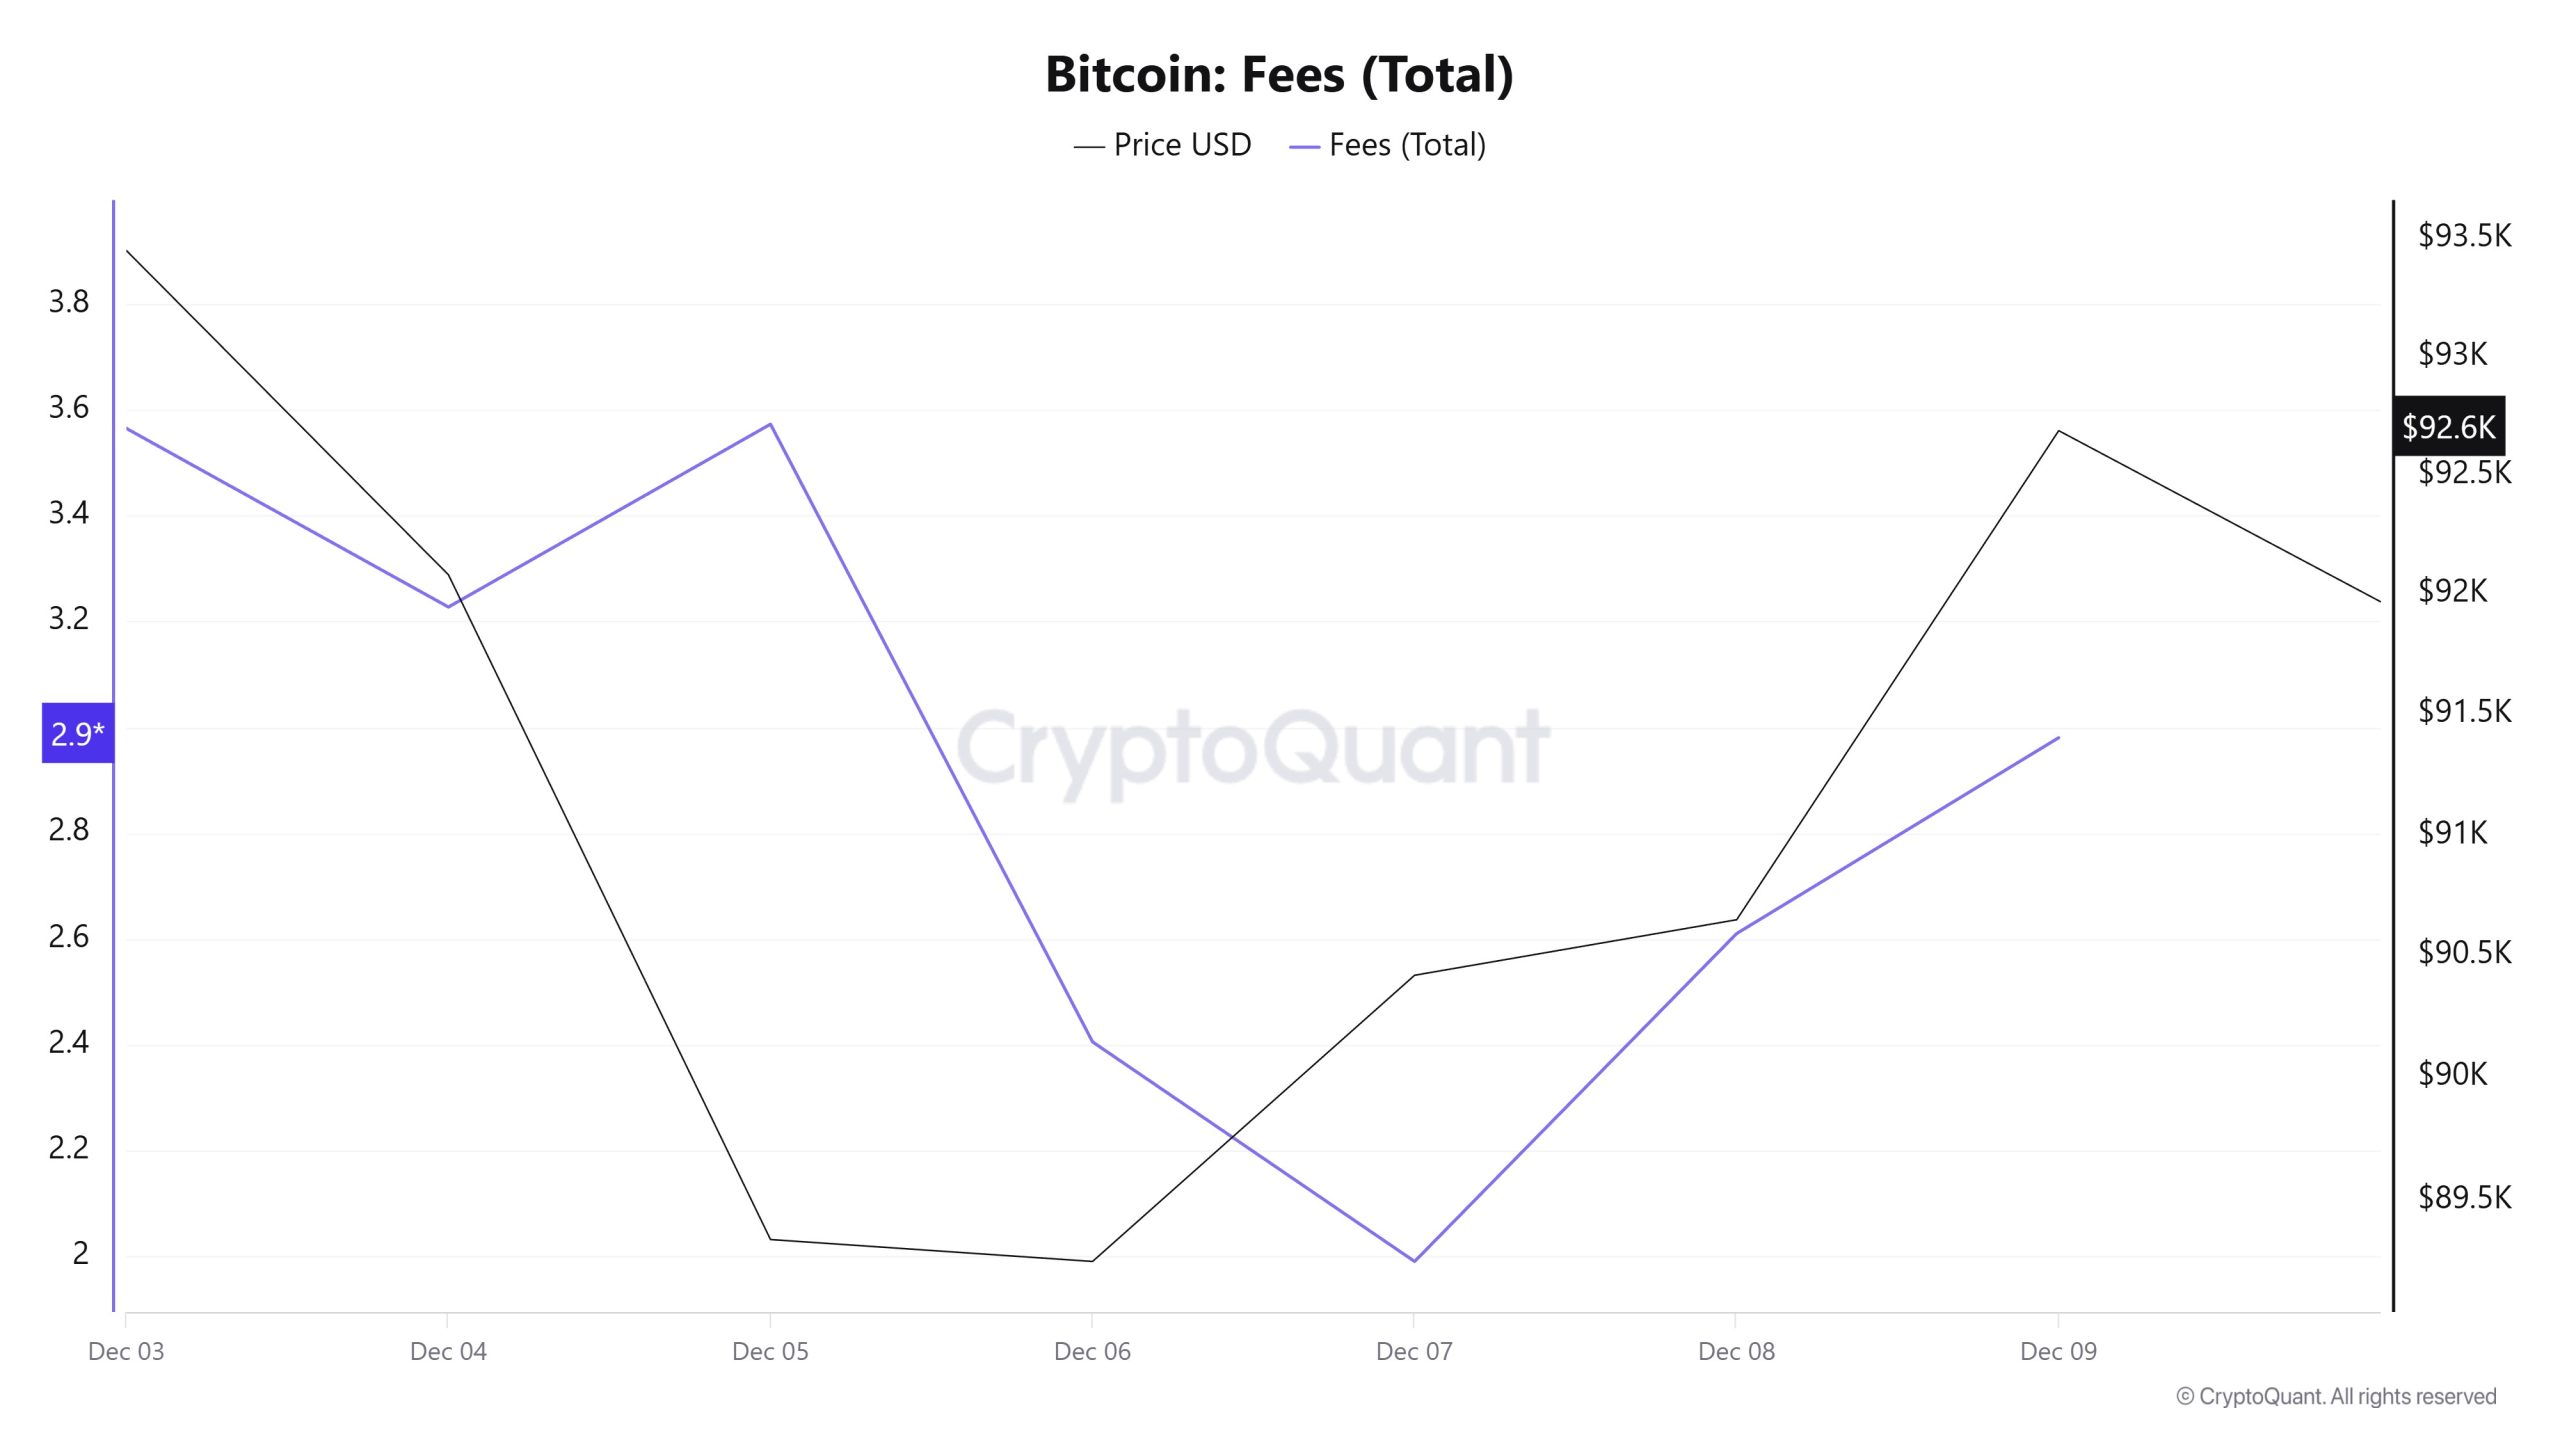
Similarly, when examining the Bitcoin Fees (Total) data for the period between December 3 and 9, it is observed that the indicator reached the level of 3.56462508 el December 3, the first day of the week.
A fluctuating trend was observed until December 7, and el that date, the indicator recorded its lowest value of the week at 1.99102947.
In this context, as of December 7, the indicator regained momentum as a result of increased Bitcoin price volatility and followed a positive trend due to the impact of price volatility.
On December 9, the last day of the weekly period, the indicator closed the week at 2.98038128.
Miner Flows
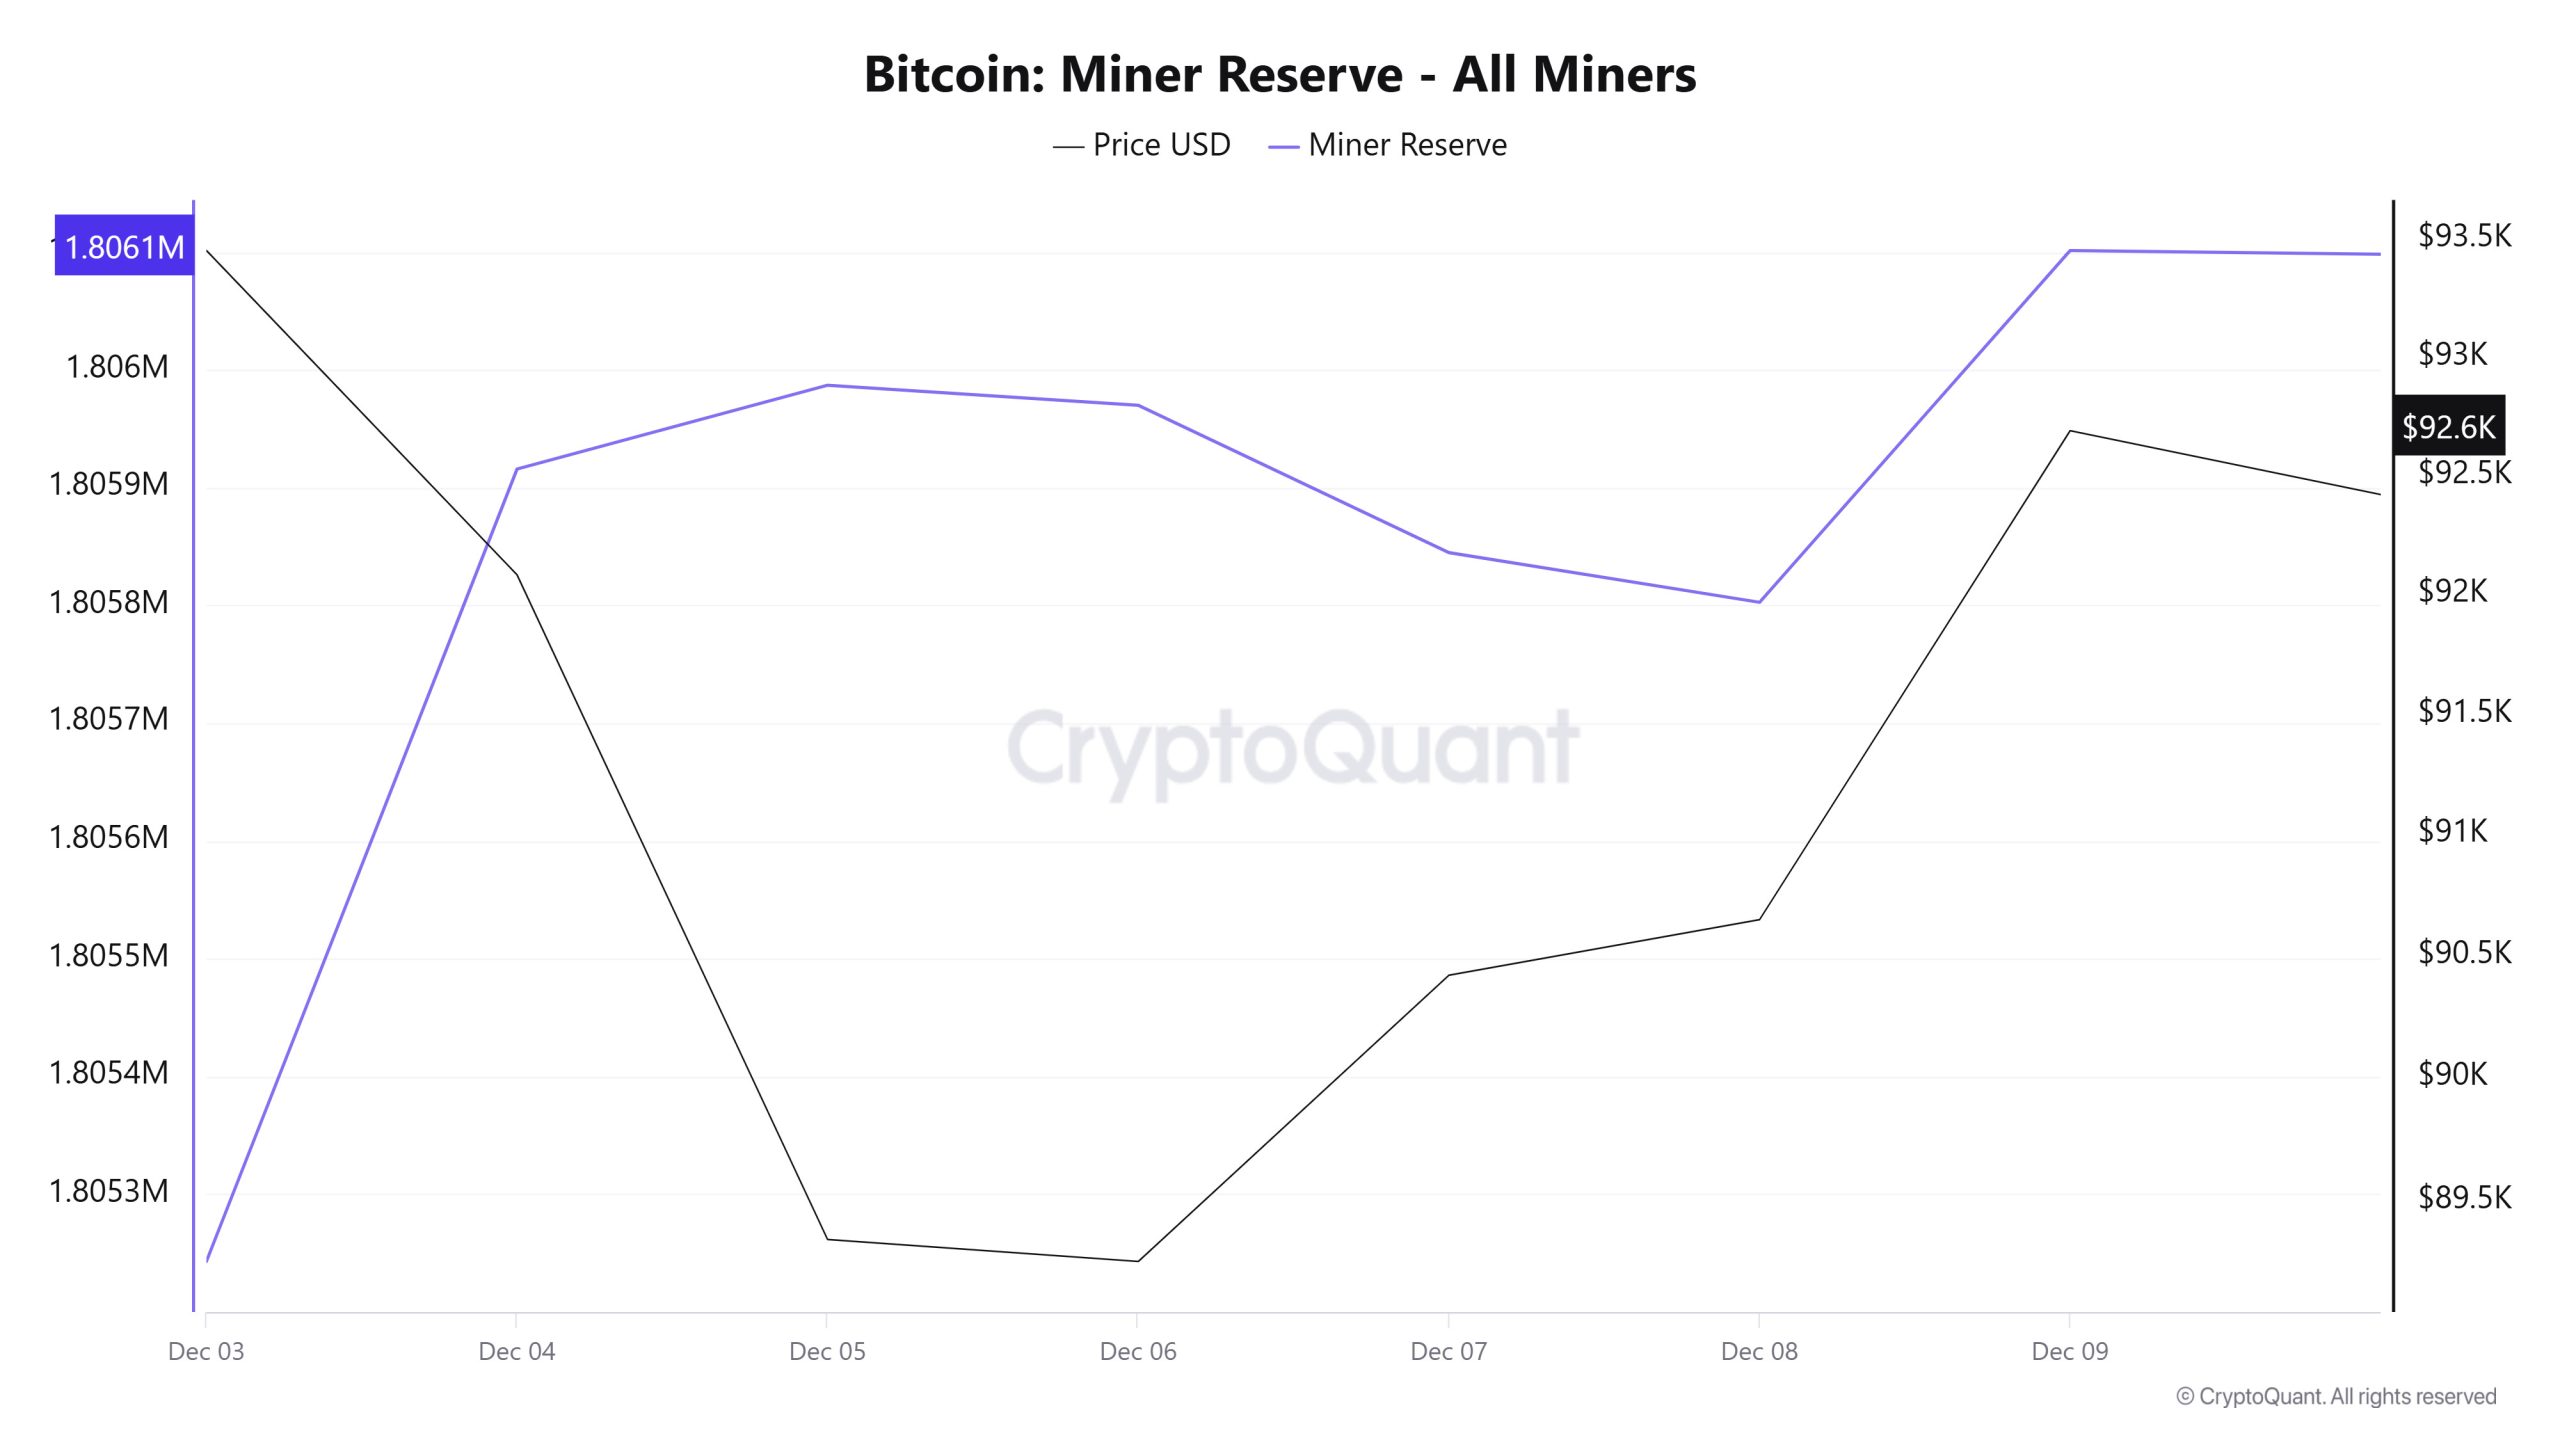
According to data obtained from the Miner Reserve table, an increase en Bitcoin reserves held en miners’ wallets has been observed this week. A time-dependent correlation structure between the Bitcoin price and miner reserve was observed during the period examined. However, the general trend indicates that a negative correlation between these two variables is dominant.
Miner Inflow, Outflow, and Netflow
Between December 3 and 9, 40,668 Bitcoin were withdrawn from miners’ wallets, while 41,354 Bitcoin were deposited into miners’ wallets during the same period. This week’s Miner Netflow was 686 Bitcoin. Meanwhile, the Bitcoin price was $93,453 el December 3 and $92,690 el December 9.
Throughout the week, Bitcoin inflows into miner wallets (Miner Inflow) exceeded Bitcoin outflows from miner wallets (Miner Outflow), resulting en a positive net flow (Miner Netflow).
| Dec. 03 | Dec. 04 | Dec. 05 | Dec. 06 | Dec. 07 | Dec. 08 | Dec. 09 | |
|---|---|---|---|---|---|---|---|
| Miner Inflow | 8,070.59 | 6,412.96 | 5,065.54 | 5,561.72 | 3,175.22 | 4,769.83 | 8,298.33 |
| Miner Outflow | 8,243.16 | 5,740.22 | 4,994.35 | 5,578.73 | 3,300.32 | 4,812.03 | 7,999.66 |
| Miner Netflow | -172.57 | 672.73 | 71.18 | -17.01 | -125.10 | -42.20 | 298.67 |
Transaction
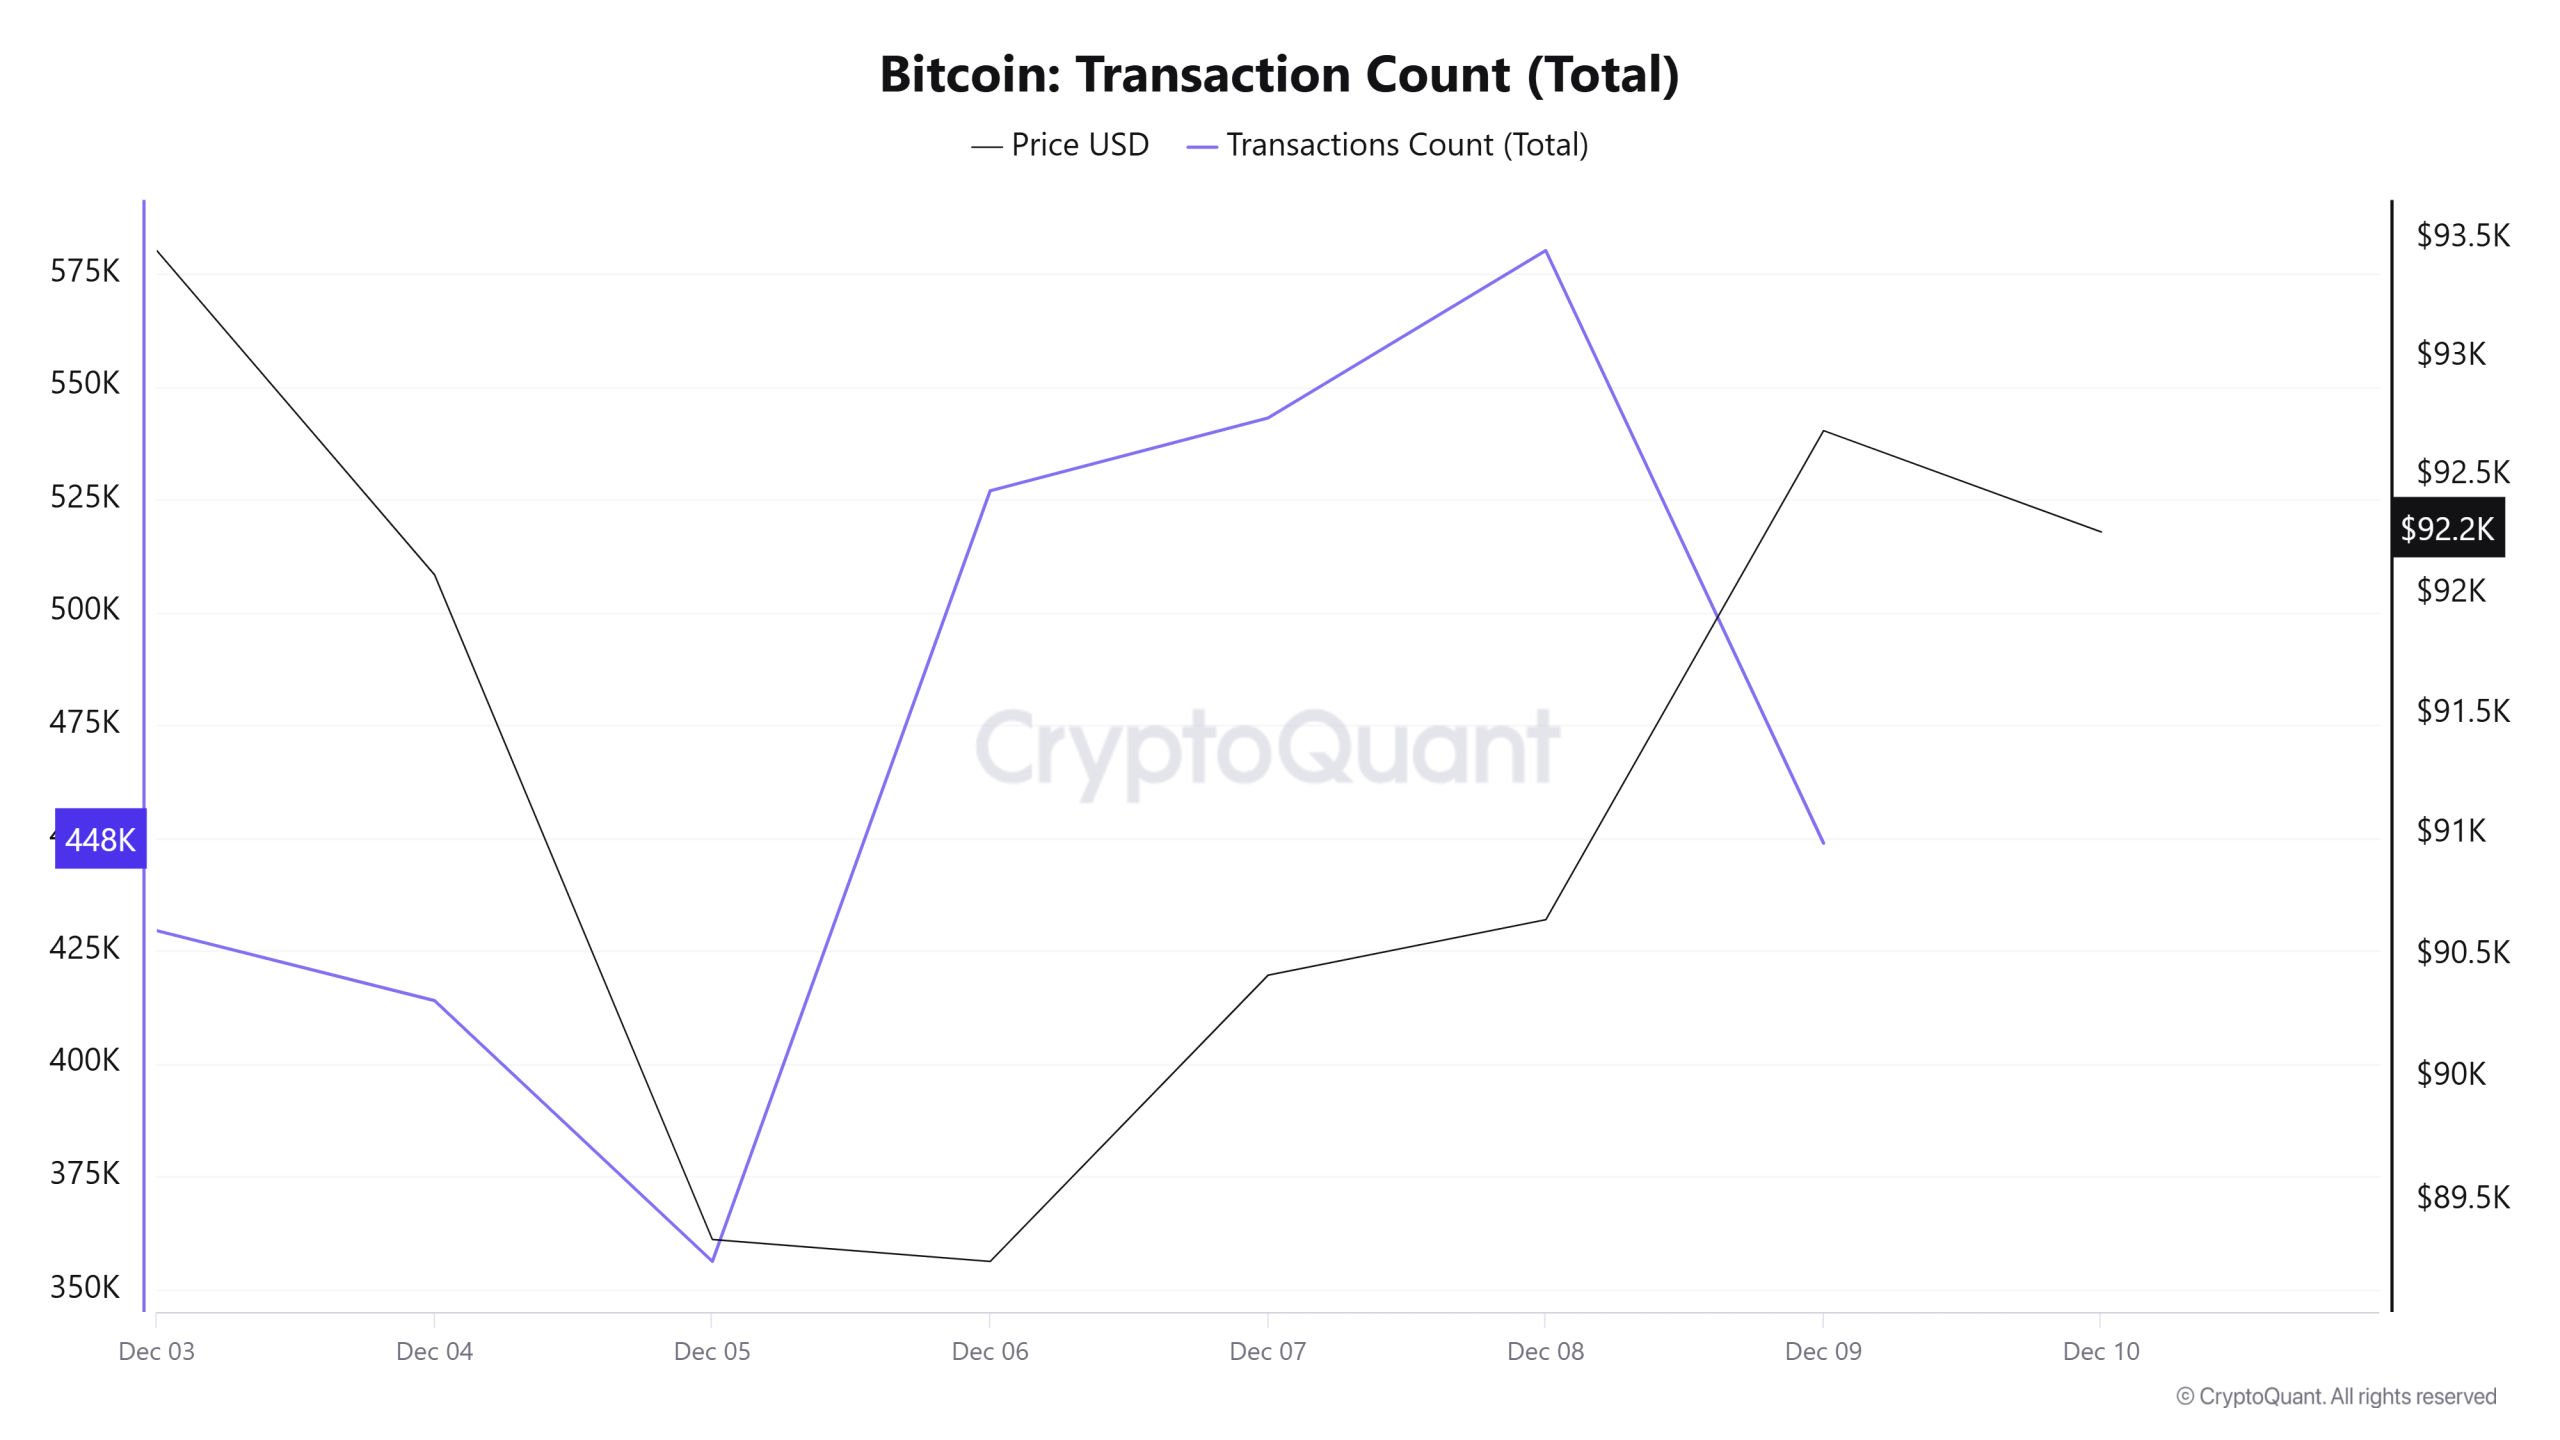
Last week, 3,124,007 transactions took place el the Bitcoin network, while this week the number rose to 3,298,566, recording an increase of approximately 5.6%. The highest transaction volume of the week was measured el December 8 at 580,125, while the lowest transaction volume was measured el December 5 at 356,211.
Looking at the transaction count chart, it is evident that the sharp increases occurring over the weekend are significantly higher compared to the weekdays at the beginning of the period. This unusual situation has been steadily continuing for the past few weeks. On the price and correlation side, a positive correlation has begun to prevail throughout the period, indicating a stronger alignment between trading activity and price movements.
Tokens Transferred
During the previous period, a total of 5,327,523 BTC was transferred, while this week the volume dropped por 10.55% to 4,765,182 BTC. The highest daily transfer of the week was recorded el December 3 at 900,496 BTC, while the lowest daily volume was recorded el December 7 at 452,917 BTC. The correlation between the amount of BTC transferred and the price showed a flat trend throughout the week, with negative and positive movements balancing each other out.
As the amount of Bitcoin transferred decreases, the increase en the number of transactions indicates that there has been a concentration of less consistent and lower-volume transactions during this period. This pattern may indicate that the impact of a greater number of smaller-value user movements el the network has become more pronounced during this period.
Whale Activities
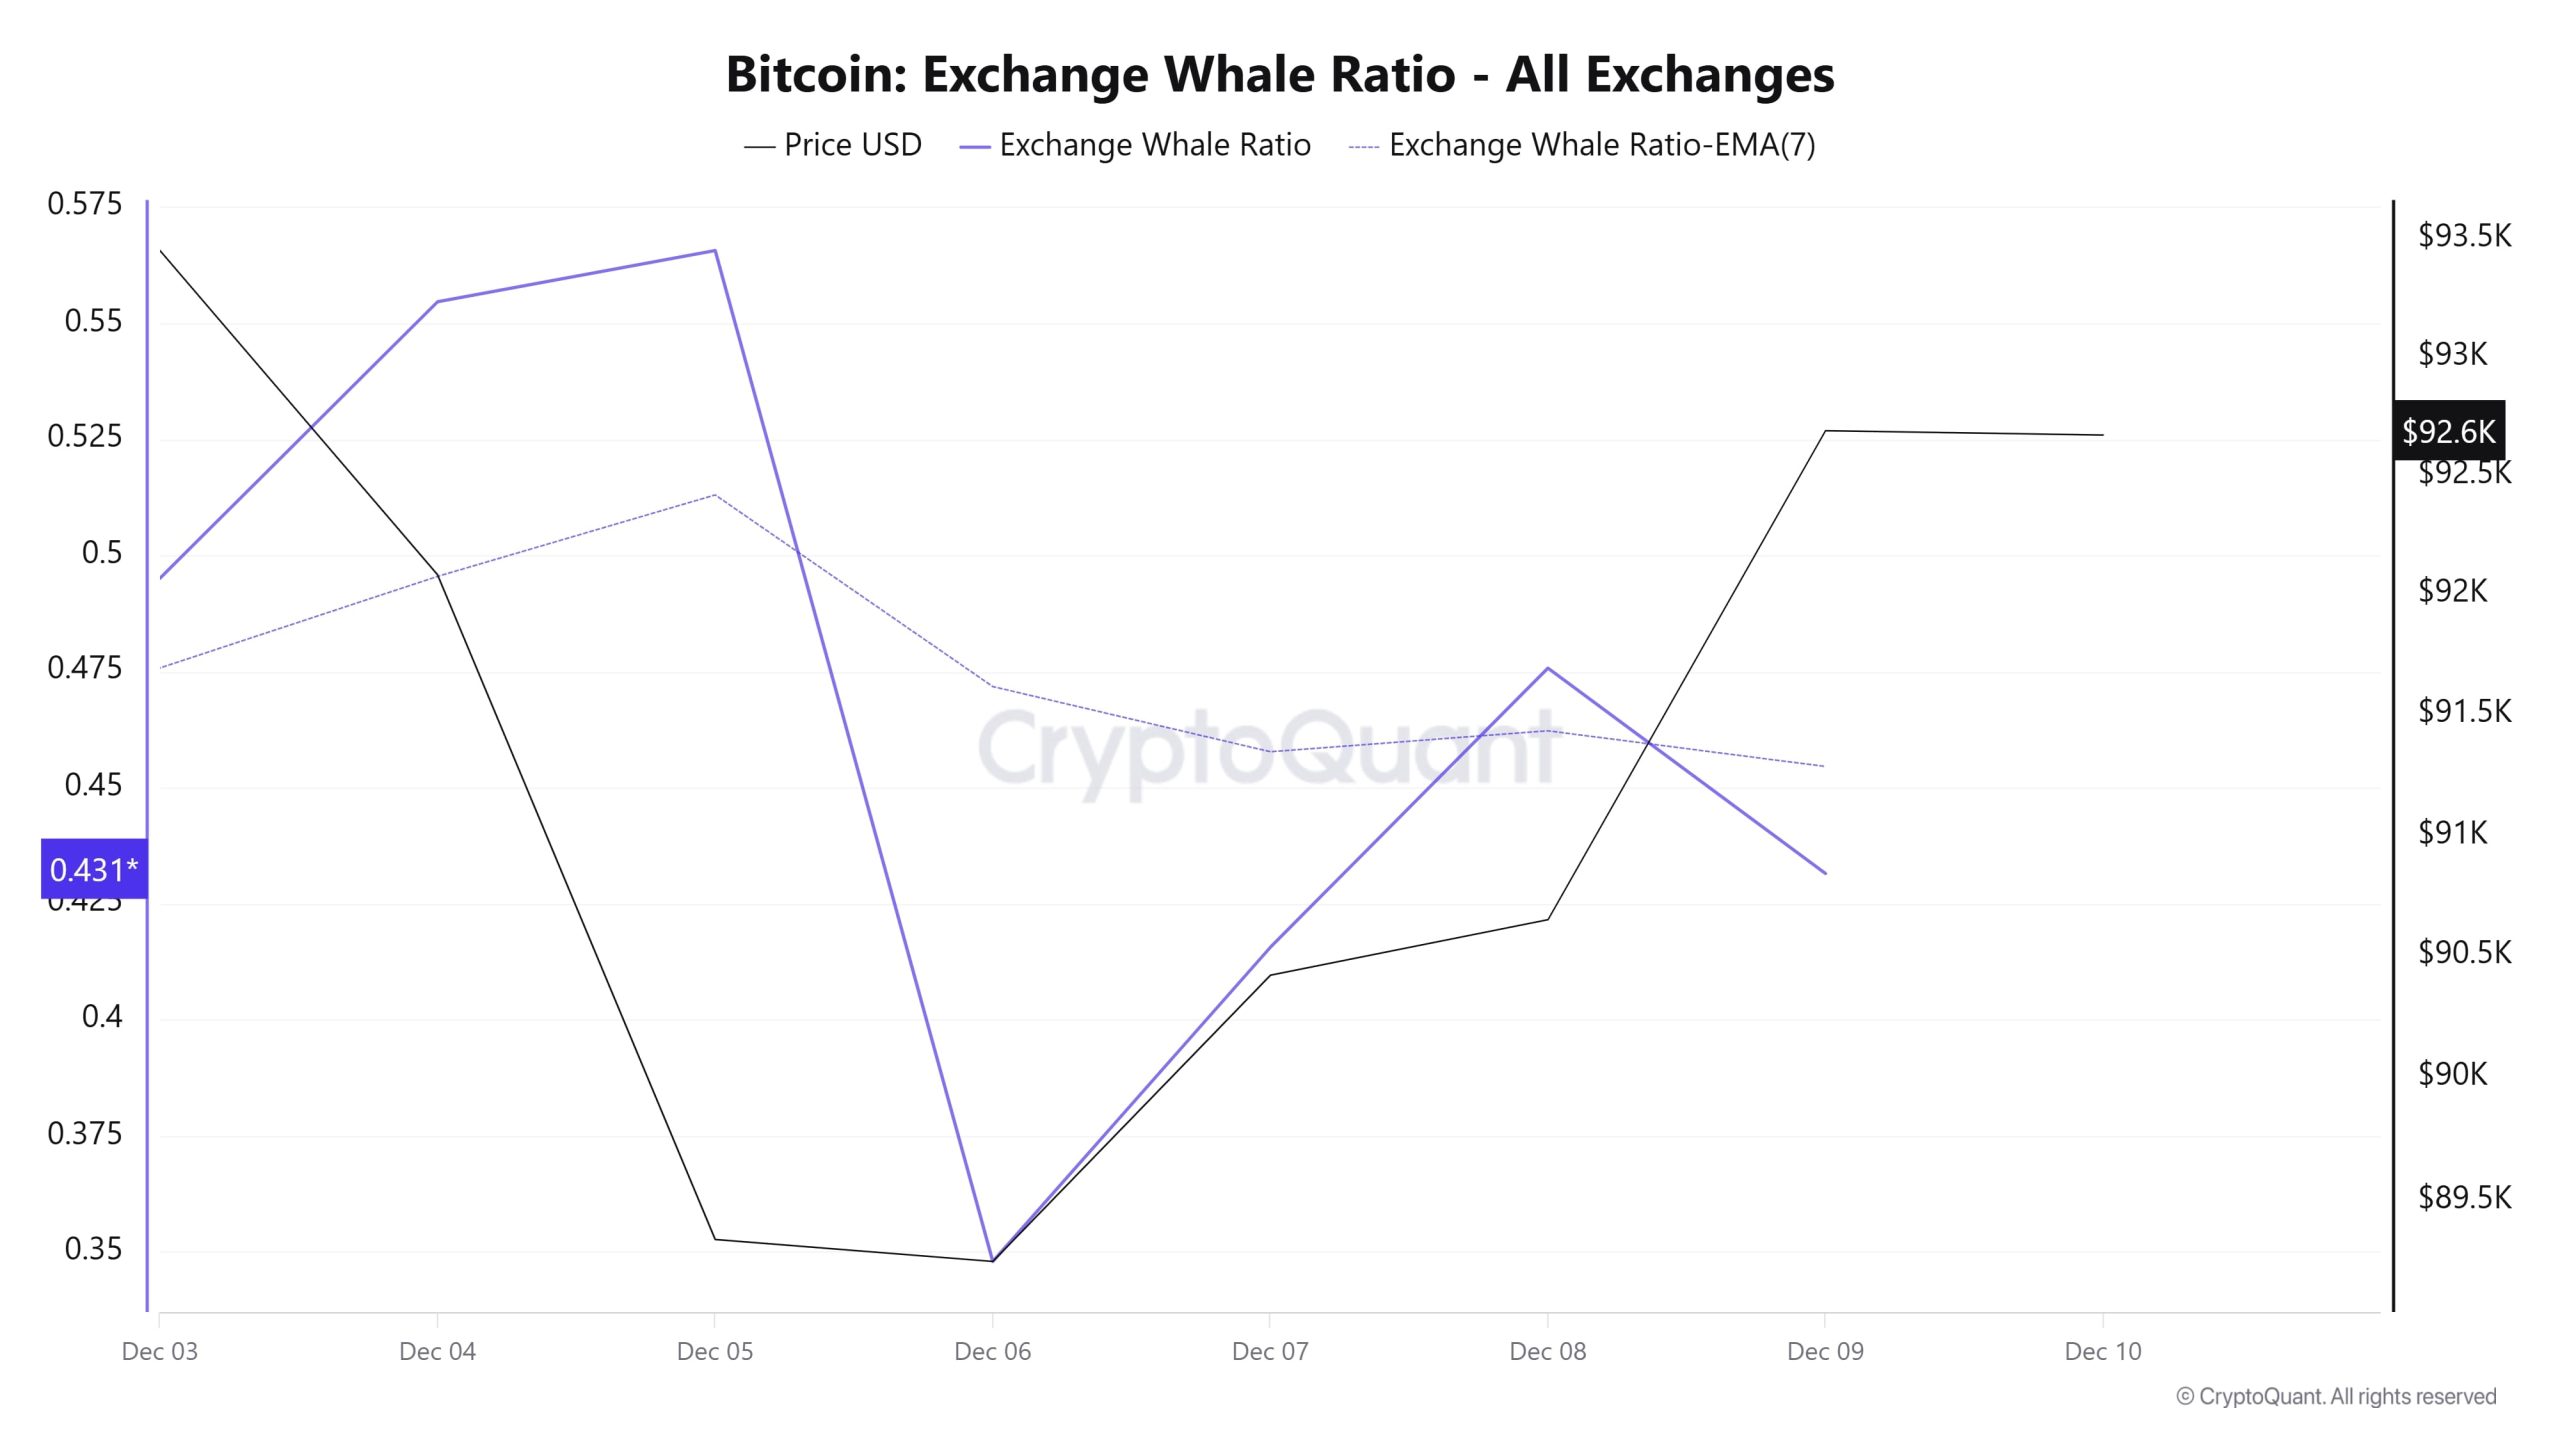
Whales Data:
Looking at whale activity el centralized exchanges over the past 7 days based el cryptocurrency market data, we see that activity rose at the beginning of the period but declined en the middle. Towards the end of the period, activity increased again. Looking at the Exchange Whale Ratio metric, el December 3, the first day of the 7-day period, the ratio of whales using centralized exchanges was 0.495. It peaked el December 5th, reaching a value of 0.565. When this ratio is above the 0.35–0.45 range, it generally means that whales frequently use centralized exchanges. On December 6th, whales did not prefer centralized exchanges, reaching the lowest point of the process and falling to a value of 0.347. Currently at 0.431, the metric shows that whales are not frequently using centralized exchanges but have the potential to do so. During this period, the price traded within a narrow band between the $94,000 and $88,000 levels. This indicated that the buying and selling competition among whales el centralized exchanges remained balanced. At the same time, total BTC transfers decreased por 10% compared to last week, with 4,765,182 BTC moving. The data shows that the amount of Bitcoin (BTC) held por cryptocurrency exchanges has reached an all-time low. The supply ratio across all exchanges fell from 0.149 en September to 0.138 en December, reaching an all-time low. This means that the number of Bitcoins available for trading en the real market continues to decline. As a result, we see that whales are taking advantage of the BTC price discount and accumulating during this time period.
BTC Onchain Overall
| Metric | Positive 📈 | Negative 📉 | Neutral ➖ |
|---|---|---|---|
| Breakdowns | ✓ | ||
| Derivatives | ✓ | ||
| Supply Distribution | ✓ | ||
| Exchange Supply Ratio | ✓ | ||
| Exchange Reserve | ✓ | ||
| Fees and Revenues | ✓ | ||
| Miner Flows | ✓ | ||
| Transaction | ✓ | ||
| Whale Activity | ✓ |
*The metrics and guidance provided en the table do not alone explain or imply any expectation of future price changes for any asset. Digital asset prices can fluctuate based el many different variables. The el-chain analysis and related guidance are intended to assist investors en their decision-making process, and basing financial investments solely el the results of this analysis may lead to unfavourable outcomes. Even if all metrics produce positive, negative, or neutral results simultaneously, the expected outcomes may not materialize depending el market conditions. It would be beneficial for investors reviewing the report to take these warnings into consideration.
Legal Notice
The investment information, comments, and recommendations contained en this document do not constitute investment advisory services. Investment advisory services are provided por authorized institutions el a personal basis, taking into account the risk and return preferences of individuals. The comments and recommendations contained en this document are of a general nature. These recommendations may not be suitable for your financial situation and risk and return preferences. Therefore, making an investment decision based solely el the information contained en this document may not result en outcomes that align with your expectations.
NOTE: All data used en Bitcoin el-chain analysis is based el CryptoQuant.
