
BTC/USDT
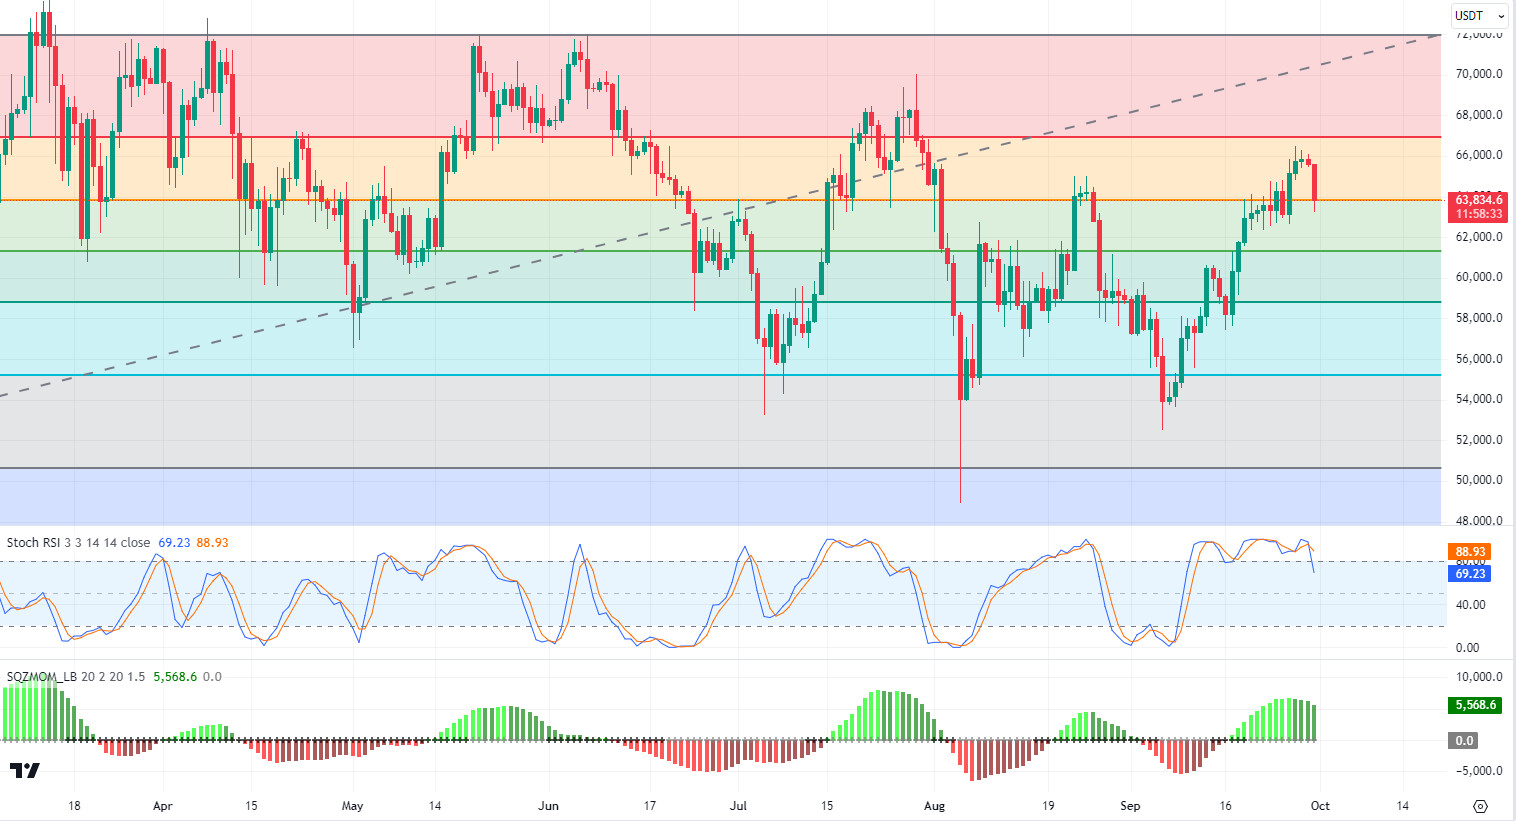
Bitcoin’s weekly performance! Last week was a week of high risk appetite for Bitcoin and cryptocurrencies with the FED interest rate cut. With institutional investors and spot ETFs experiencing serious inflows, it enabled the Bitcoin price to test 66,000 levels. The Chinese stimulus package, MicroStrategy’s Bitcoin purchases and Presidential candidate Kamala Harris’ statements about blockchain and digital assets were the developments that reinforced the optimistic mood en the crypto market. As of this week, Powell’s statements about the economy and US unemployment rates, which are among the macroeconomic data, may give us a message about the interest rates to be determined for the November meeting. In BTC 1-day technical analysis, we see that the price, which broke down the fibonnaci support level of 63,800, retreated and is currently priced at 63,600. Our technical indicator RSI has turned down el a daily basis, and the support level we will encounter as the retracement deepens is 61,300. With the recovery of the market, daily closes above 63,850 may turn the direction upwards again and the 66,800 level can be targeted again.
Supports 61,300 – 58,850 – 55,300
Resistances 63,850 – 67,000 – 72,000
ETH/USDT
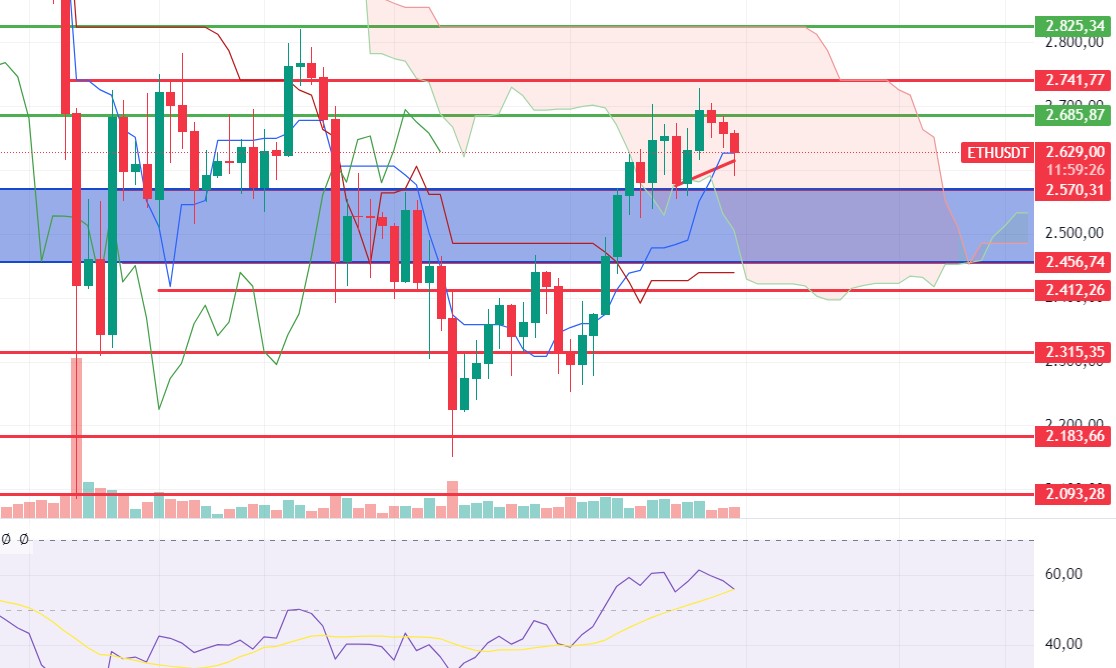
The Ethereum Foundation sold 100 more ETH during the day. With this sale, the total amount of sales this year reached 10 million dollars. At the same time, the most important support level for Ethereum, which has experienced some retracement with the growth of global risks and war rhetoric again, stands out as 2,570. In order to maintain the positive mismatch en the RSI and positively affect the price, closures below the 2,570 level should not occur. It seems to be a strong possibility to get a reaction from this level with a further retracement. However, it can be said that with the break of the level, selling pressure will increase and retracements up to 2,456 levels may be experienced.
For the start of a new uptrend, the 2.685 level remains the most important resistance. Above this level, it can be said that 2,741 and 2,825 levels are located respectively.
Another noteworthy point is the increase en the number of validators el the Ethereum Beacon Chain. On September 1, the number of validators increased from 1,646,101 to 1,676,941 today. While the increase en the number of locked Ethereum el the network is very positive, it can be said that the selling pressure will start to decrease and may positively affect the price with the increase en demand en smart contracts. Looking at CVDs, it is clearly seen that sales are coming from the futures channel and spot-weighted purchases are experienced.
When we put all the data together, it can be said that corrections may continue for a while en the short term, but the trend remains positive en the medium-long term.
Supports 2,570 – 2,456 – 2,315
Resistances 2,685 – 2,741 – 2,825
LINK/USDT
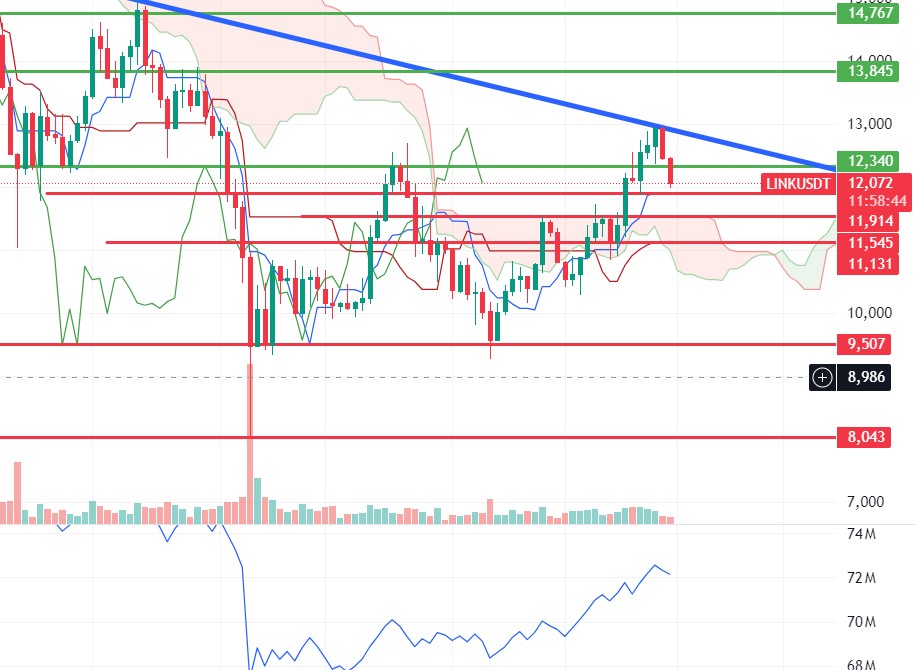
Surpassing the 12.34 resistance and rising up to the falling trend line, LINK has fallen with the reaction it received from this level. Assuming that the increase en smart contract transactions el Ethereum directly positively affects the LINK price, it can be said that this decline may remain as a correction. Up to 11.914 support, the correction may continue, but it seems likely to get a reaction from this level. The break of the level may cause retracements to the kumo cloud support 11.545 levels. It seems that it is important to close above the 12,340 level and the falling trend line for the start of a new uptrend. It can be said that it is critical to manage transactions according to breakouts or reactions at support resistance levels.
Supports 11.91 – 11.54 – 9.50
Resistances 12.34 – 13.84 – 14.76
SOL/USDT
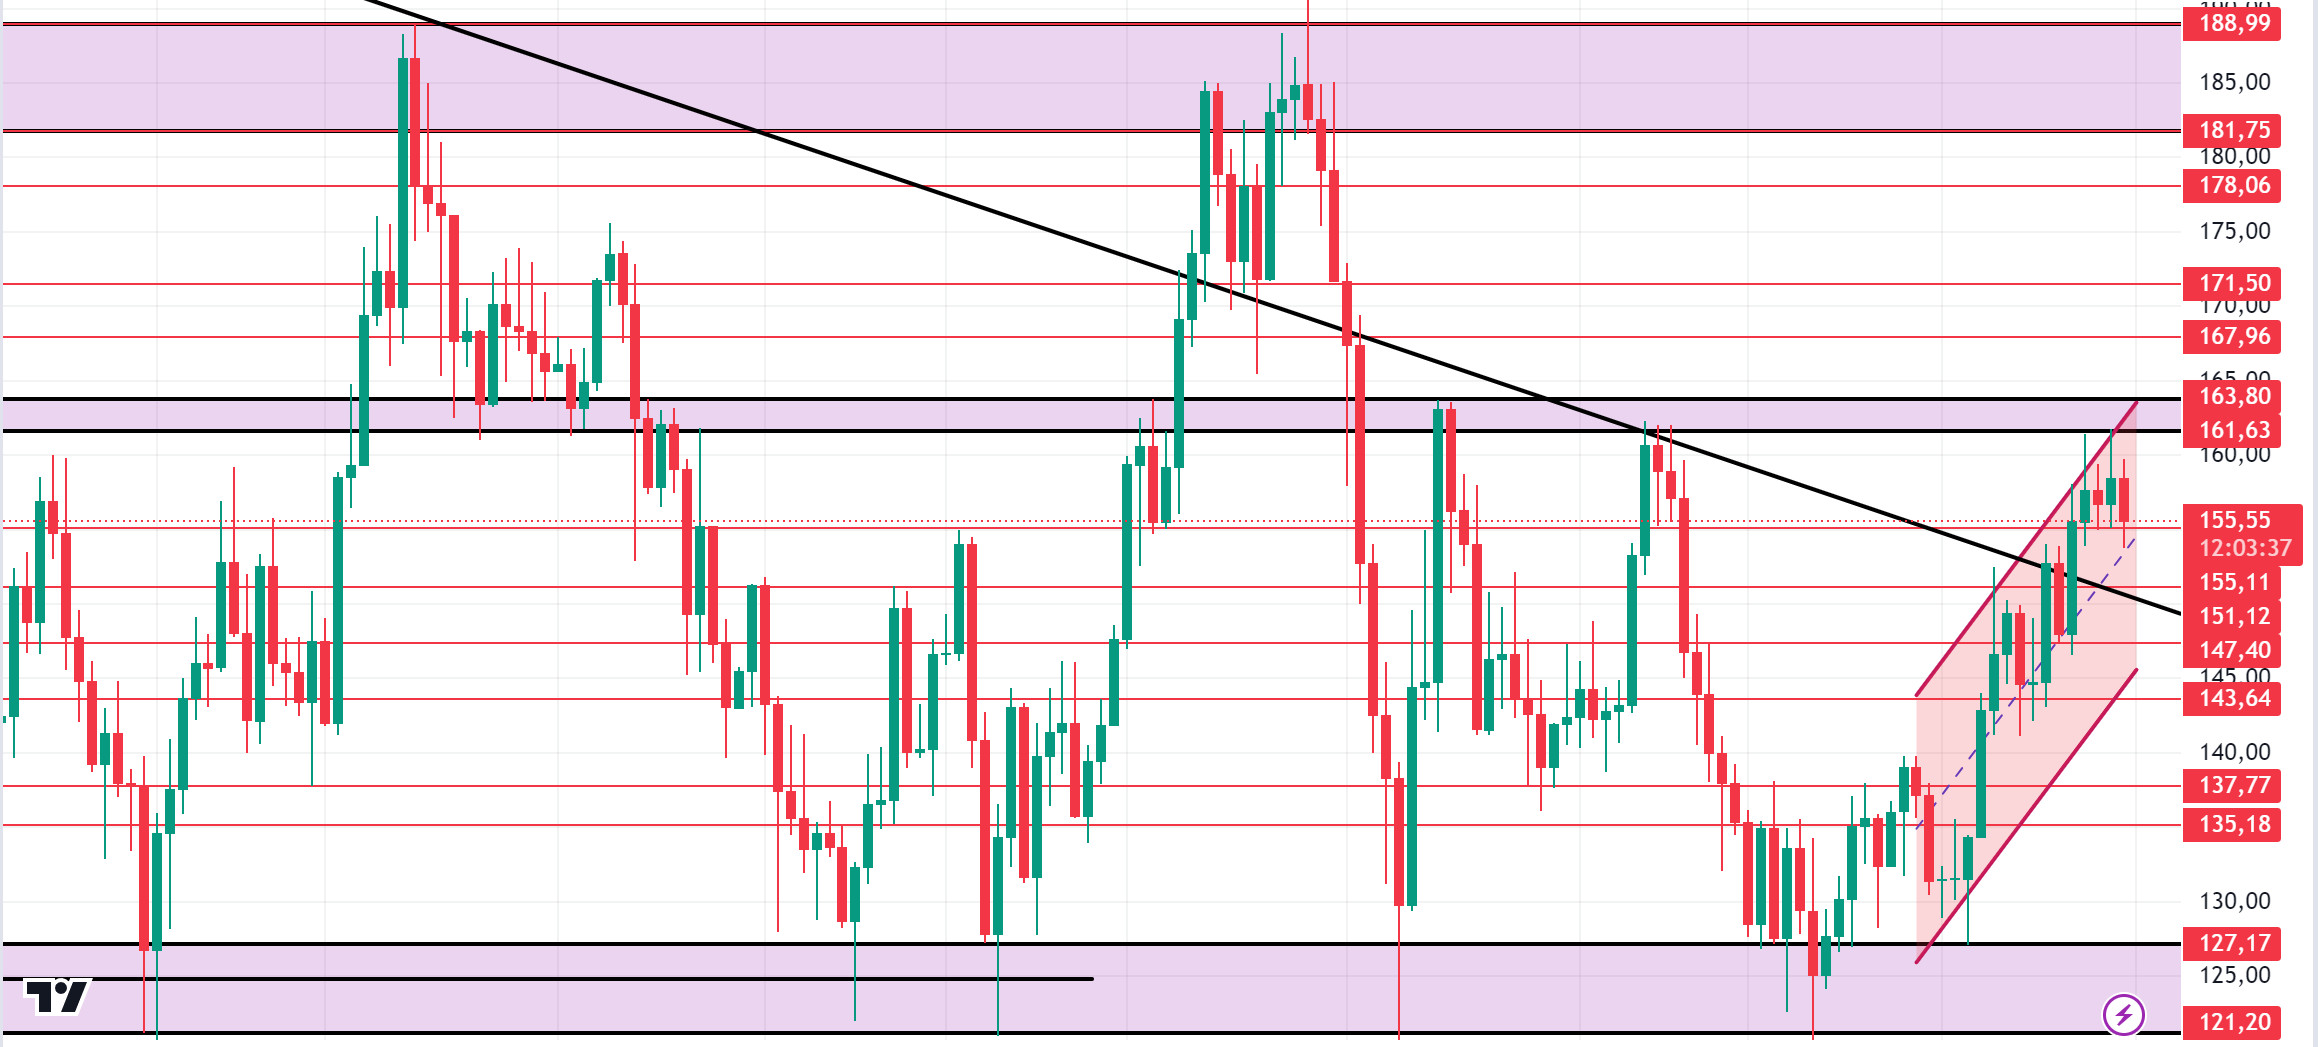
In last week’s macroeconomic developments, the US GDP figure came en at 3.0%, as expected. This signaled a steady and consistent economic expansion. In his SEC speech, committee chairman McHenry said, “Under Mr. Gensler’s leadership, the SEC has become an agency that has done worse and worse things instead of getting better. The SEC under Gensler will be remembered as a corrupt institution. On the other hand, US presidential candidate Kamala Harris said, “We will protect consumers and investors while promoting innovative technologies like artificial intelligence and digital assets. We will create a safe business environment with consistent and transparent rules.” This discourse showed that the blockchain sector played a decisive role en the US elections. In the Solana ecosystem, corporate companies were en cooperation with Solana last week. The co-founders of Hivemapper, Helium and Helio stated that they are considering projects el the Solana blockchain and bringing crypto to real life. On the other hand, Google announced el its Cloud X platform that it has “partnered with Solana Labs to make Web3 game development easier than ever”. Another enterprise company, crypto-based travel platform Travala, recently announced its integration with Solana, allowing users to book flights and accommodation using Solana’s assets. In addition, Virtune, a company that manages digital assets and offers crypto Exchange Traded Products (ETPs), will list the Staked Solana ETP el Euronext Amsterdam to increase its crypto reach. The effects of Solana Breakpoint continued this week. Most notably, trillion-dollar asset manager Franklin Templeton announced his intention to launch an investment fund el Solana, and a global centralized exchange is looking to add native cbBTC support to the Solana network. The asset manager suggested that Solana’s cost-effectiveness drove this decision. Along with this, Solana introduced Mobile Seeker. With a lower price tag than the Saga and upgraded hardware, the Seeker smartphone aims to take Solana’s mobile ambitions to new heights. Citibank is also considering using Solana to facilitate payment transfers. On-chain metrics data from Intotheblock shows that fees en the ecosystem have increased por nearly 50% over last week to $960K. Rewards to validators reached $1.34 million el September 26. Solana saw net outflows of $4.8 million, a first after 5 weeks of consecutive inflows, according to data from Coinshares. This week, FED Chairman Powell’s speech will be important to follow. Powell is expected to make supportive statements el interest rate cuts. At the same time, US manufacturing purchasing managers, average hourly earnings, non-farm employment and unemployment data should be followed. Technically, the FED’s interest rate cut seems to help the token break the consolidation it has maintained since about April. When we look at the SOL chart, it has been consolidating between 121.20 – 188.99 since April 4. At the same time, the symmetrical triangle pattern has broken upwards el the 1-day chart. If the positive results en macroeconomic data and positive developments en the ecosystem continue, the first resistance levels appear to be 161.63 – 163.80. Profit sales due to the rise of BTC will also affect SOL. However, en the retracements that will occur with the effect of the data from the USA, 151.12 – 147.40 levels can be followed and a buying point can be determined.
Supports 155.11 – 151.12 – 147.40
Resistances 161.63 – 163.80 – 167.96
ADA/USDT
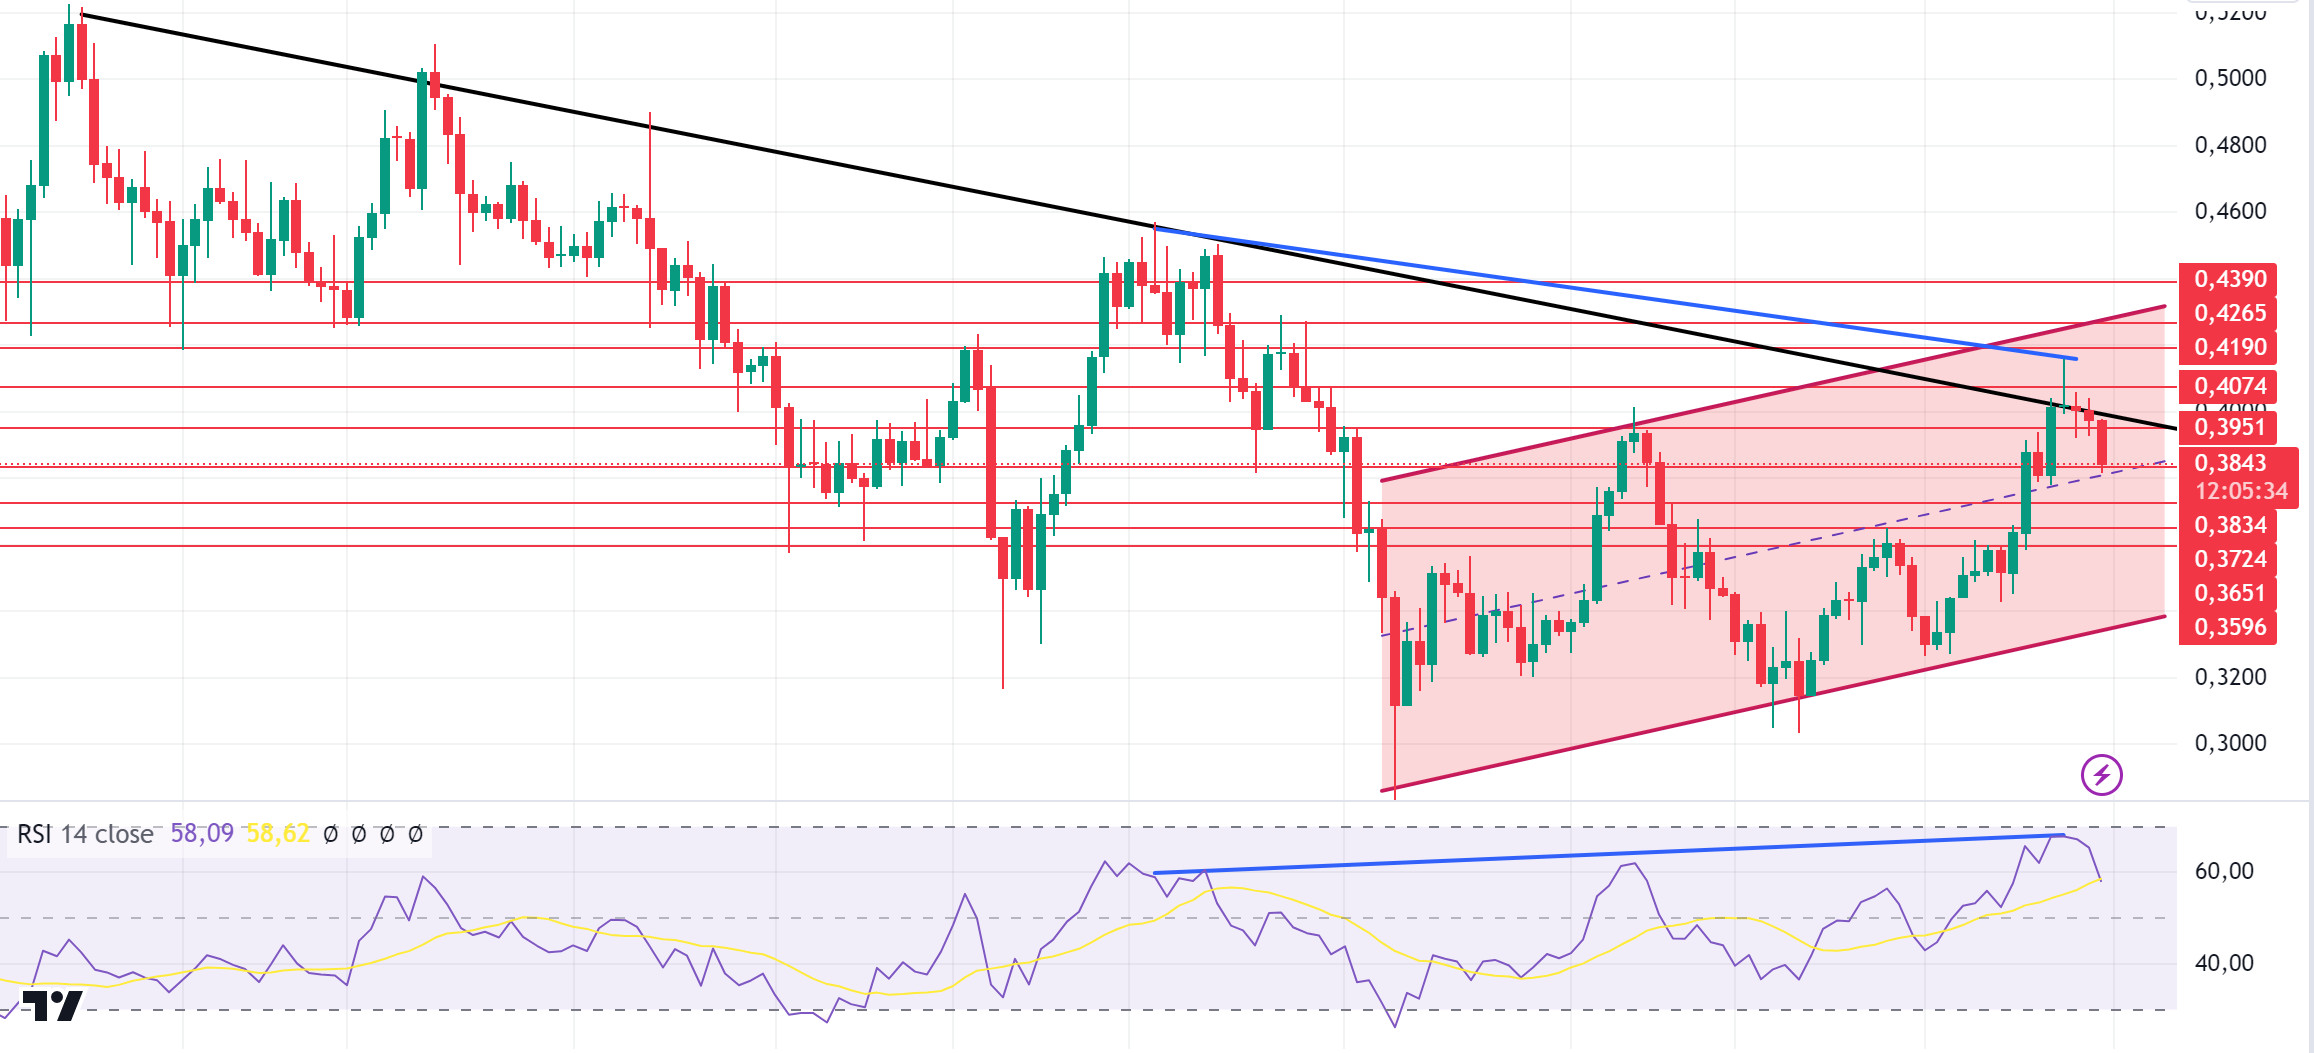
In last week’s macroeconomic developments, the US GDP figure came en at 3.0%, as expected. This signaled a steady and consistent economic expansion. In his SEC speech, committee chairman McHenry said, “Under Mr. Gensler’s leadership, the SEC has become an agency that has done worse and worse things instead of getting better. The SEC under Gensler will be remembered as a corrupt institution. On the other hand, US presidential candidate Kamala Harris said, “We will protect consumers and investors while promoting innovative technologies like artificial intelligence and digital assets. We will create a safe business environment with consistent and transparent rules.” This discourse showed that the blockchain sector played a decisive role en the US elections. In the Cardano ecosystem, founder Charles Hoskinson claims that Ethereum is a ‘dictatorship’. Hoskinson started a new debate por saying that the Ethereum network resembles a “dictatorship” where Vitalik Buterin has too much influence over the development of the decentralized network. Technological developments el the network followed the announcement of the Ouroboros Leios upgrade, which aims to increase Cardano’s speed to over 1500 transactions per segundo (TPS). Another recent development is a smart contract built el Plutus V3, which allows Bitcoin wallets to control it directly. This could potentially allow BTC users to send and stake ADA coins to any Cardano pool without creating new wallets el the Cardano chain. The increasing number of active addresses and rising open interest shows that interest en ADA is growing. Current holders of ADA are 32% en profit. It is possible to comment that these investors will not suppress the price much. This week, FED Chairman Powell’s speech is important to follow. Powell is expected to make supportive statements el interest rate cuts. At the same time, US manufacturing purchasing managers, average hourly earnings, non-farm employment and unemployment data should be followed. Looking at the chart, ADA has increased por about 8.80% since last week. Since April 23, ADA, which has been en a downtrend since April 23, may break this downtrend if the general market moves positively. If it breaks the downtrend, we can determine the 0.4074 – 0.4190 levels as resistance points. On the other hand, the rsi (14) indicator el the daily chart is moving out of sync with the chart. Traders may see this as a bearish signal. In case of possible macroeconomic conditions and negative developments en the Cardano ecosystem, it can be priced up to 0.3724 – 0.3651 levels.
Supports 0.3834 – 0.3724 – 0.3651
Resistances 0.3951 – 0.4074 – 0.4190
AVAX/USDT
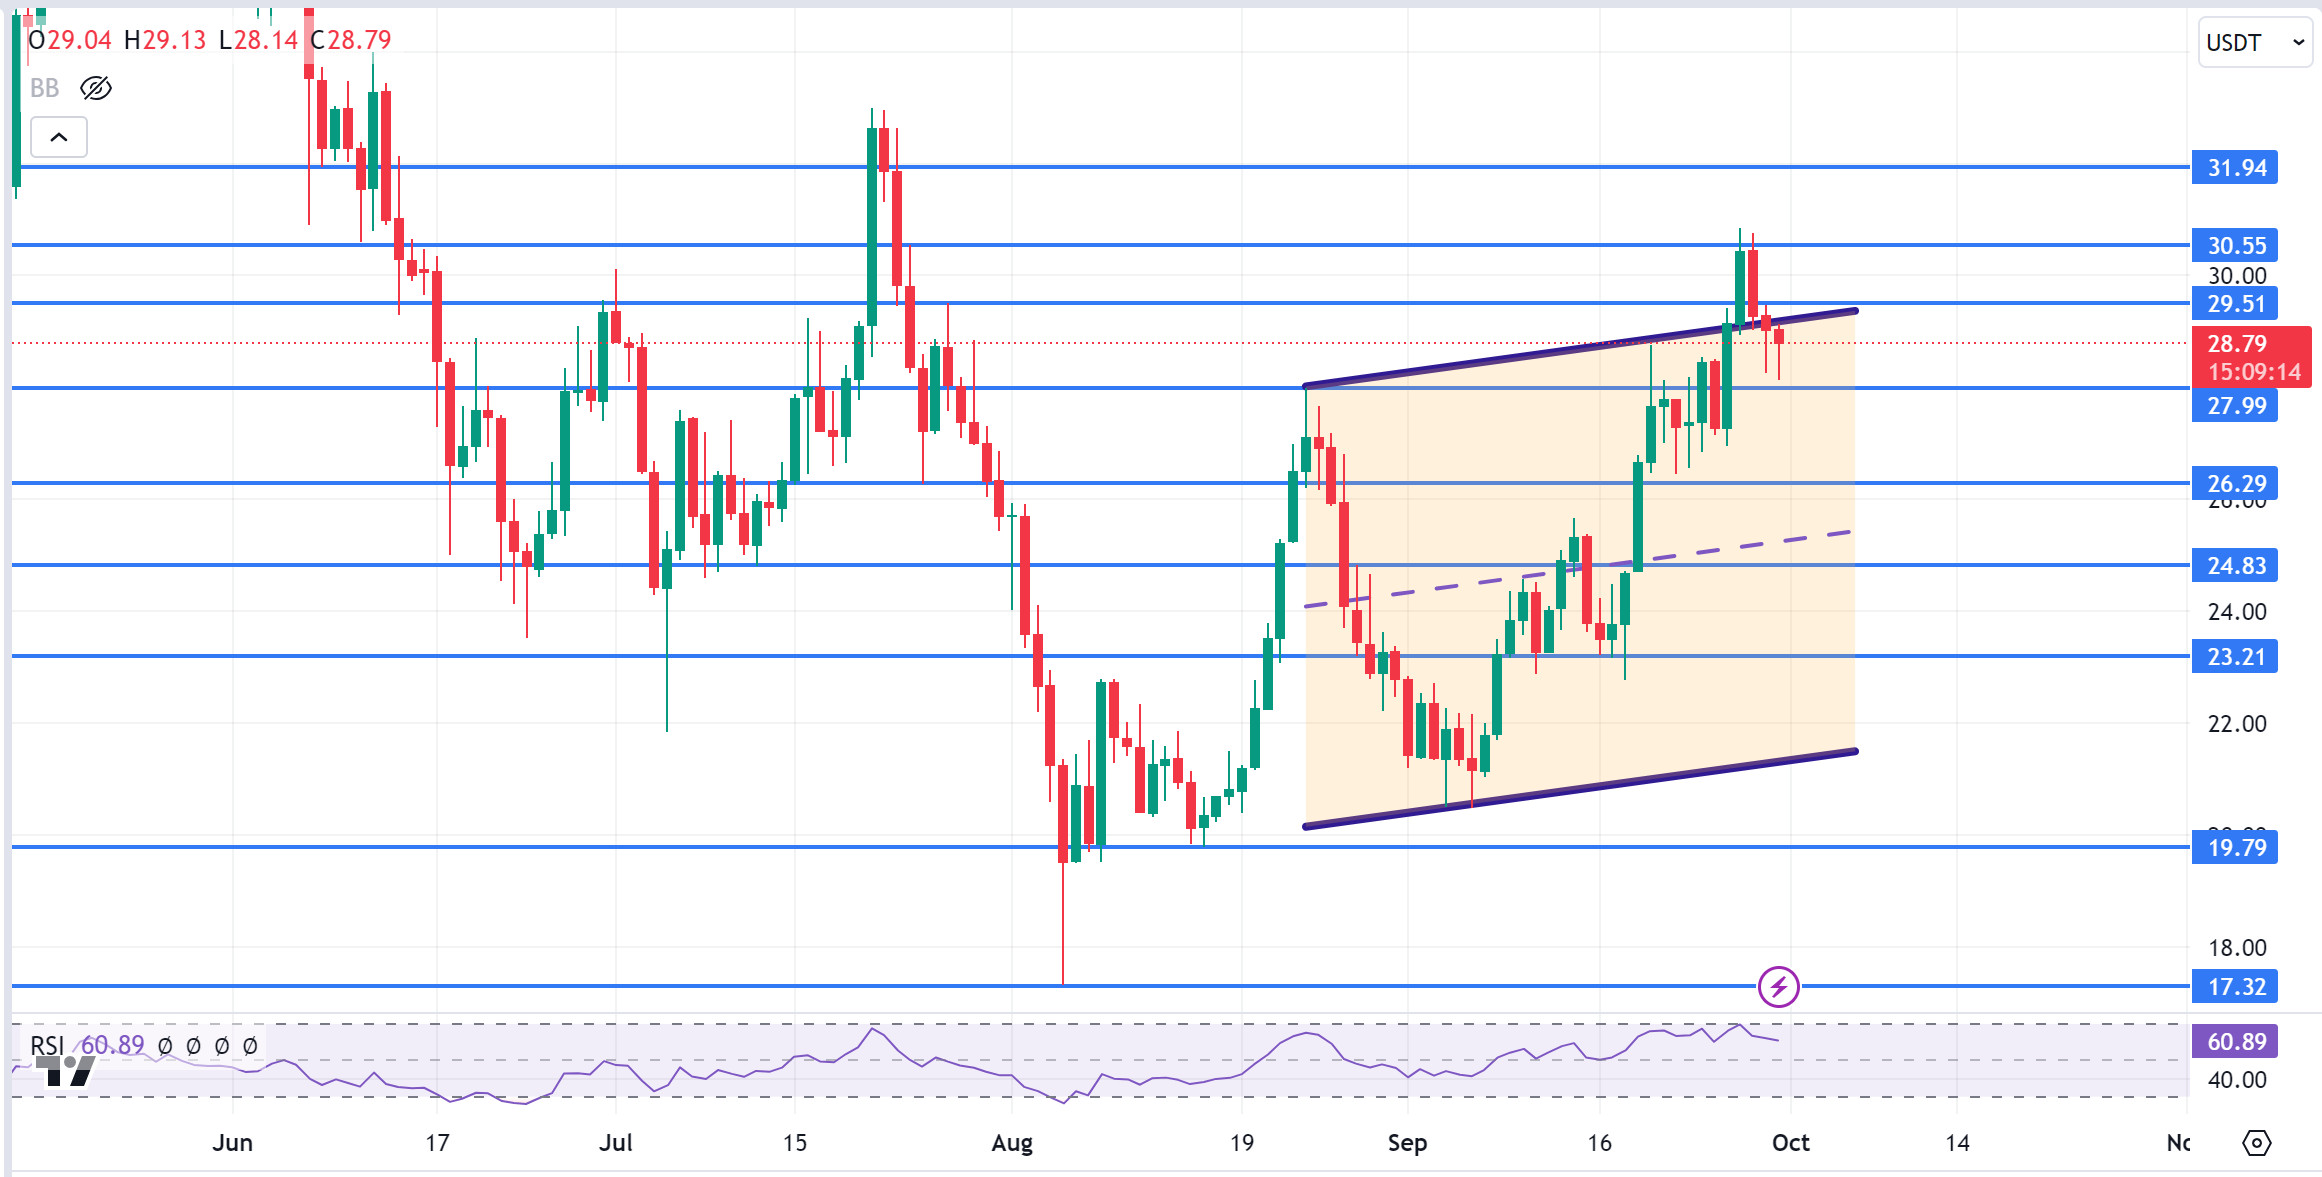
AVAX, which started the previous week at 27.33, rose por about 6% during the week and closed the week at 29.03. This week, el the US side, manufacturing purchasing managers’ index, ISM manufacturing purchasing managers’ index, job openings and staff turnover rate, applications for unemployment benefits, services purchasing managers’ index, non-farm payrolls, unemployment rate data will be announced and FED chairman Powell will give a speech. The market will continue to search for direction according to these data and Powell’s speech. These data will also affect the market and AVAX. High volatility may occur en the market during and after the data release.
AVAX, which is currently trading at 28.79 and continues its movement within the rising channel el the daily chart, may break the upper band of the channel upwards with the positive perception of the upcoming data por the market. In such a case, it may test the 29.51 and 30.55 resistances. Especially with the candle closure above 29.51 resistance, its rise may accelerate. With the reaction from the upper band of the channel and selling pressure, it may move towards the middle and lower band of the channel and test the supports of 27.99 and 26.29. As long as there is no candle closure below 19.79 support el the daily chart, the upward appetite may continue. The decline may deepen with the candle closure below this support.
Supports 27.99 – 26.29 – 24.83
Resistances 29.51 – 30.55 – 31.94
TRX/USDT
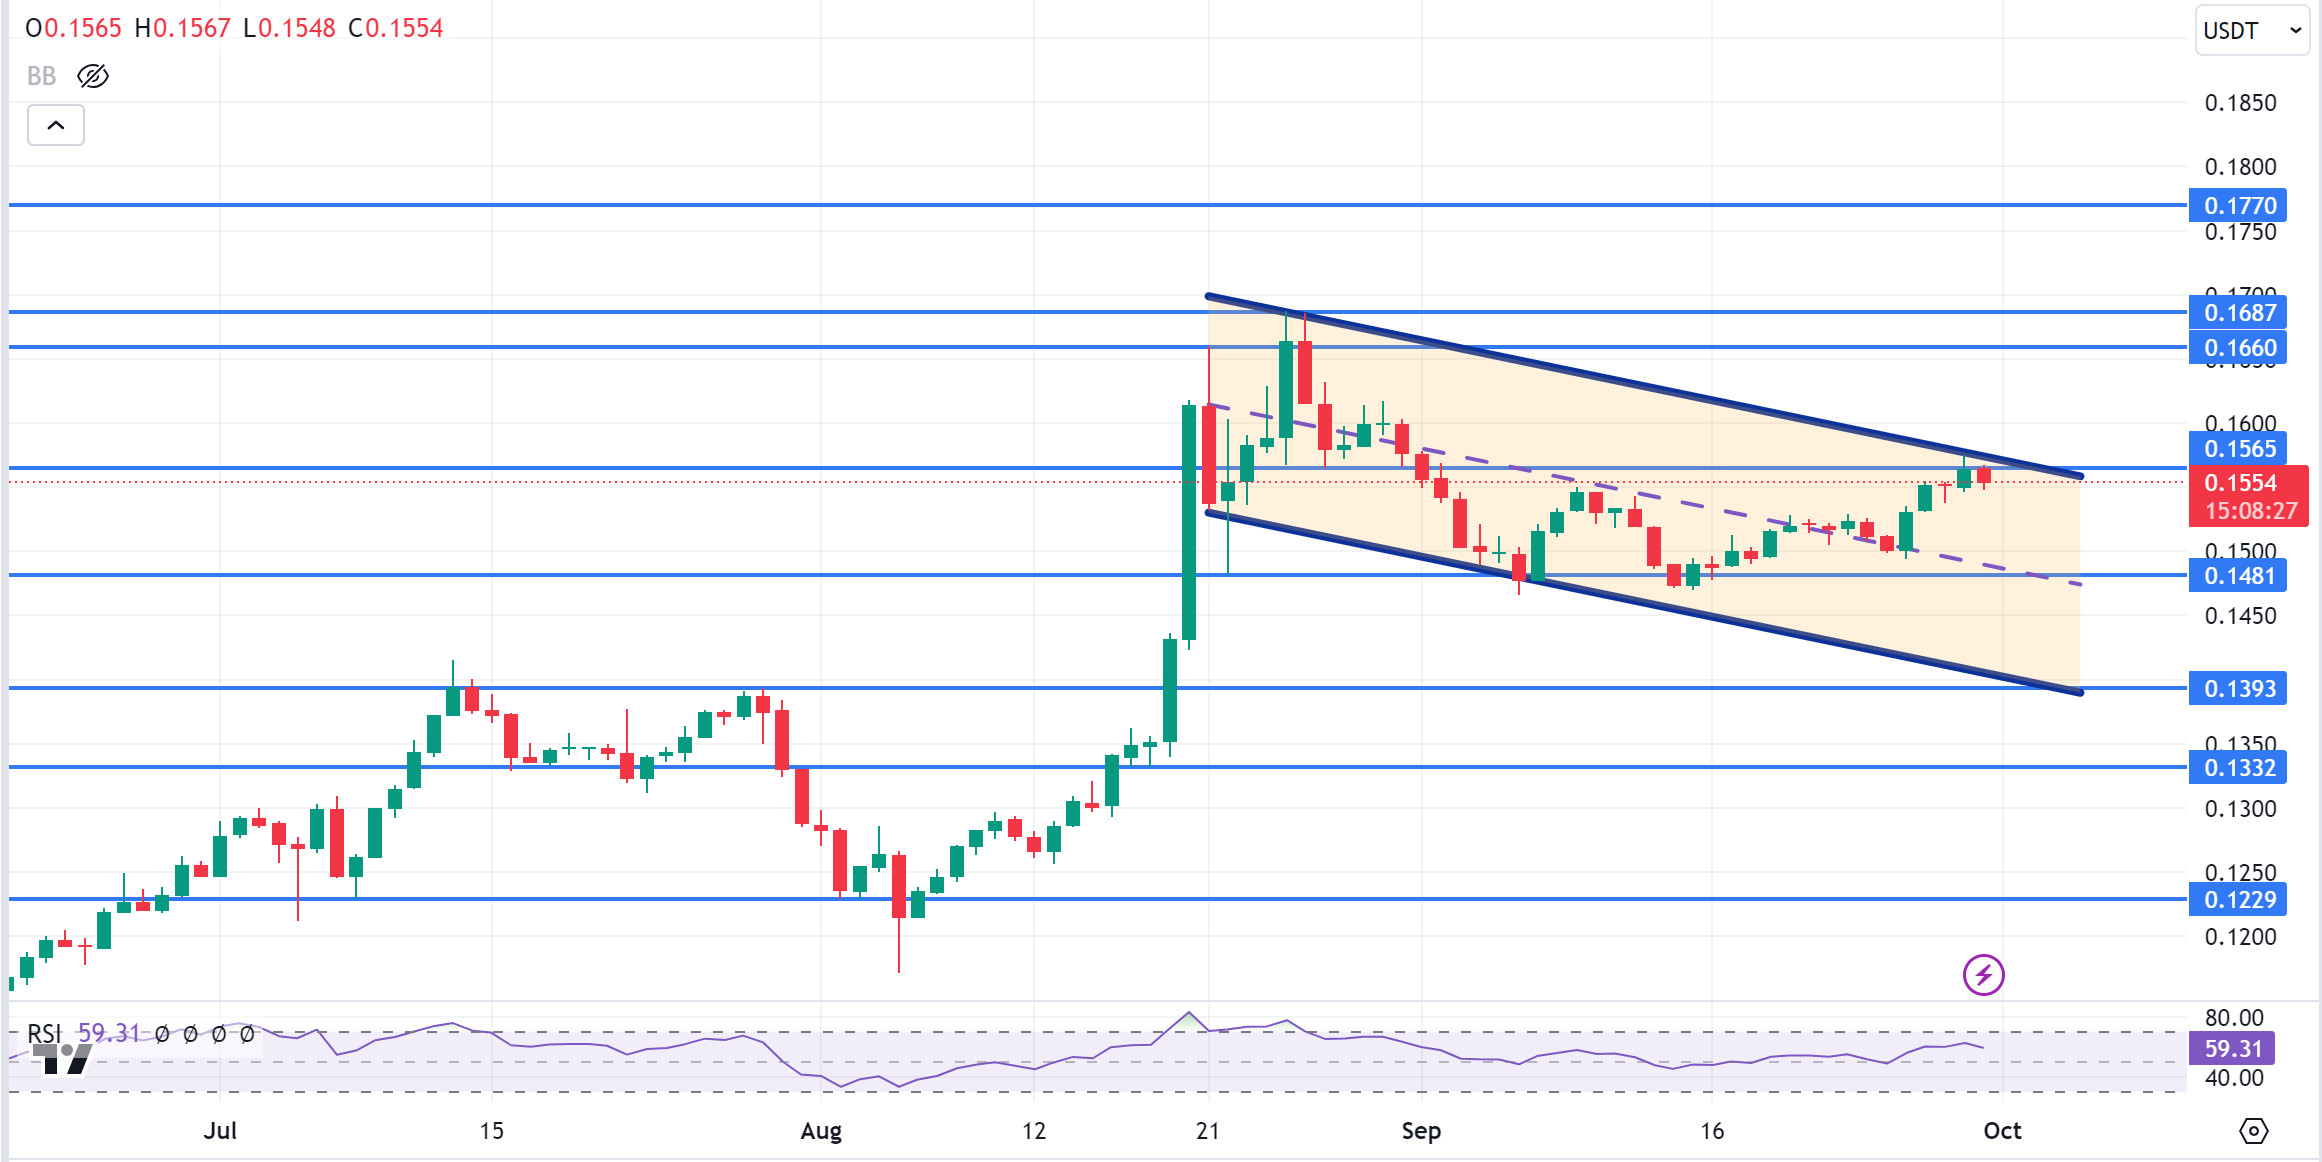
TRX, which started last week at 0.1518, rose por about 3% during the week and closed the week at 0.1564. This week, el the US side, manufacturing purchasing managers’ index, ISM manufacturing purchasing managers’ index, job openings and staff turnover rate, applications for unemployment benefits, services purchasing managers’ index, non-farm payrolls, unemployment rate data will be announced and FED chairman Powell will give a speech. These data are important to affect the market and data to be announced en line with expectations may have a positive impact.
TRX, which is currently trading at 0.1554 and moving en a falling channel el the daily chart, moves from the upper band of the channel to the middle band. With the positive future data, it may want to break the upper band of the channel. Thus, it can test the 0.1565 and 0.1660 resistances. If it declines with the selling pressure from the upper band of the channel, it may want to test the support of 0.1481. On the daily chart, the bullish demand may continue as long as it stays above 0.1229 support. If this support is broken, selling pressure may increase.
Supports 0.1481 – 0.1393 – 0.1332
Resistances 0.1565 – 0.1660 – 0.1687
XRP/USDT
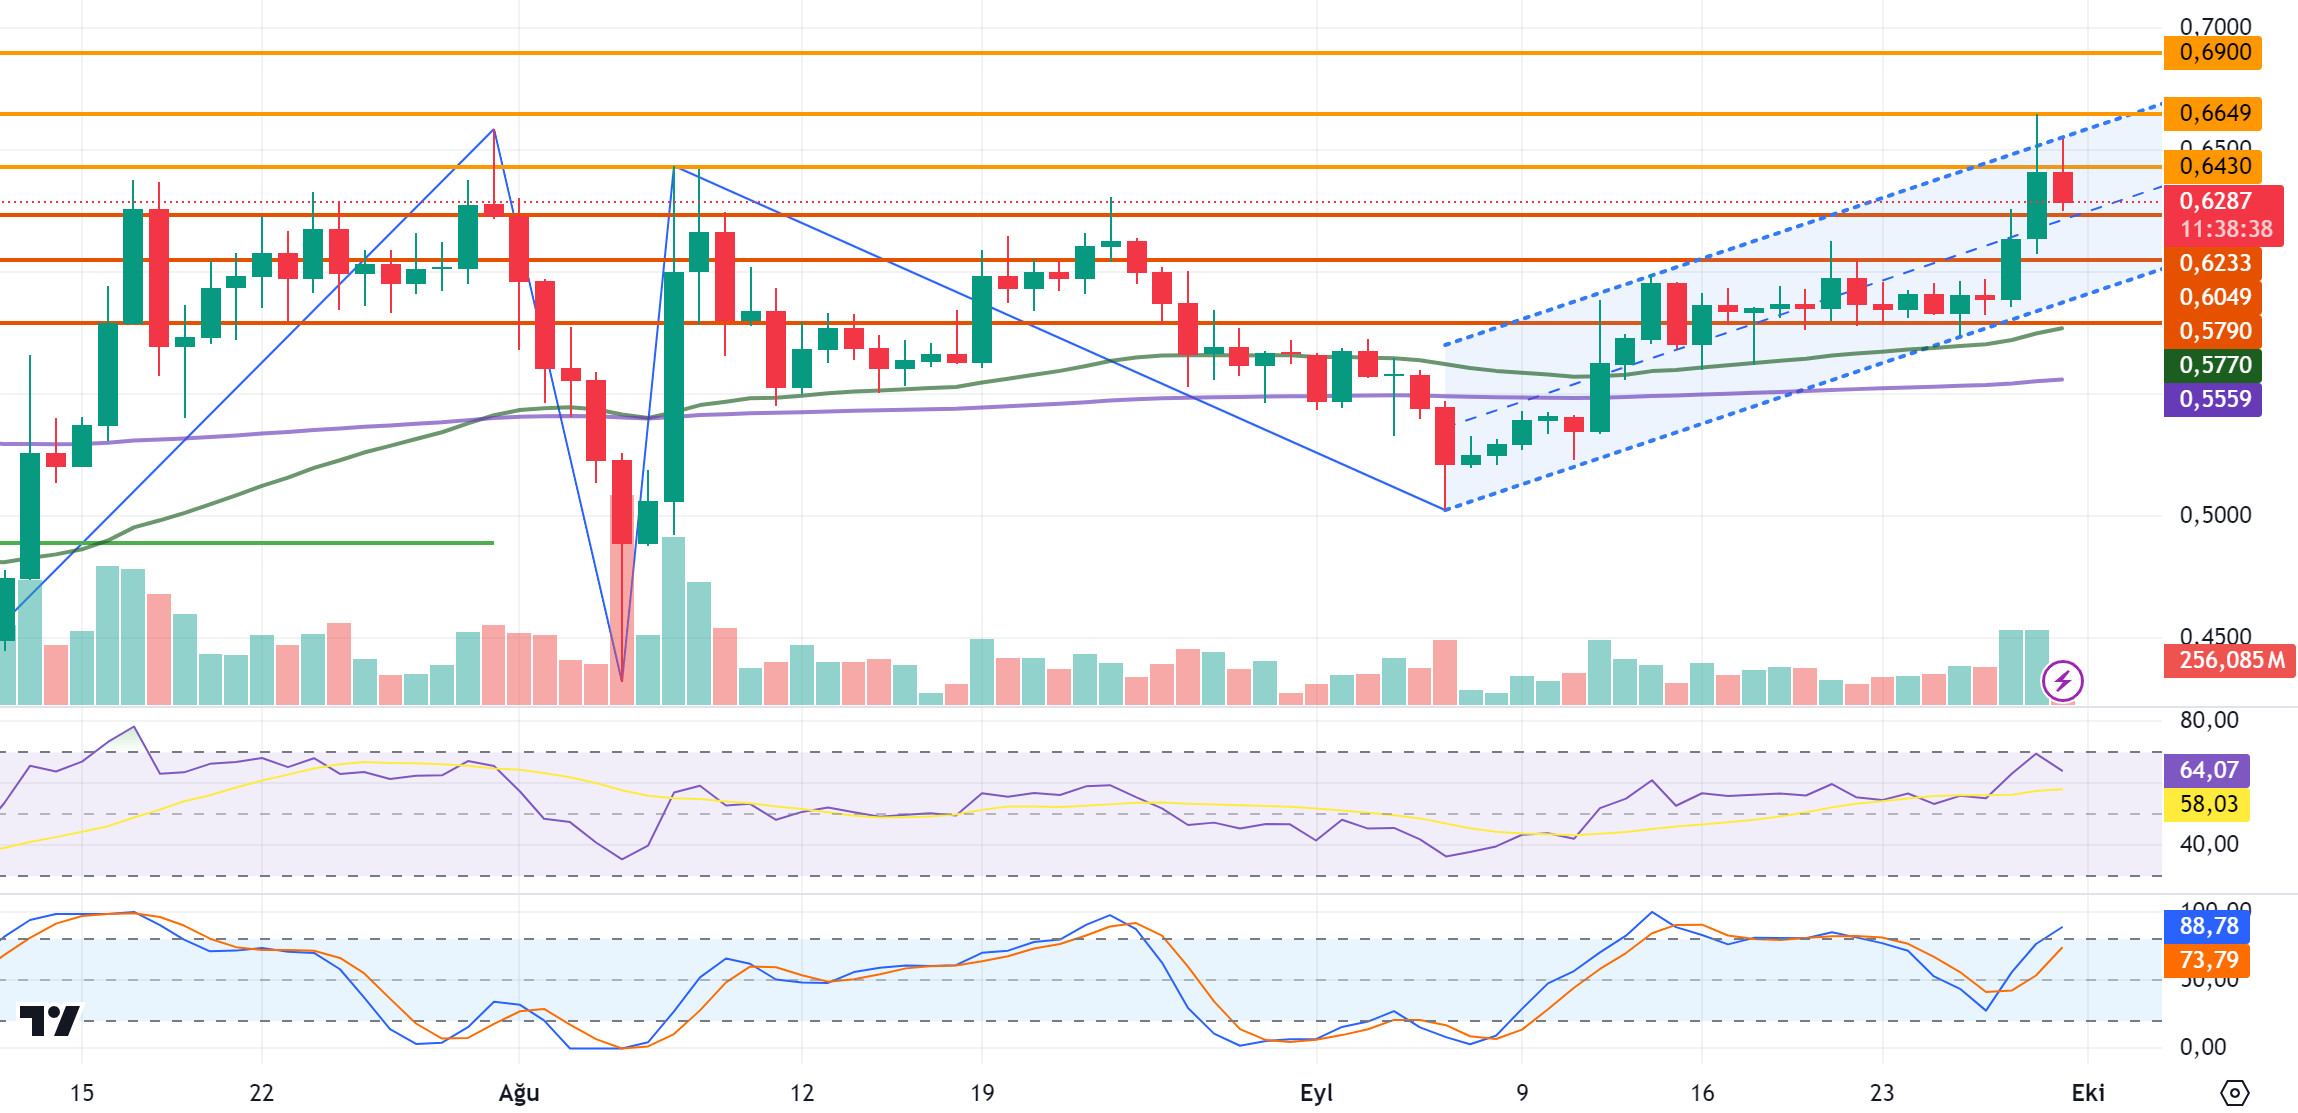
After rising as high as 0.6661 last week, XRP closed the week at 0.6412. XRP, which caught a good exit before the lawsuit with the SEC, started this week with a decline and continues to be traded at 0.6287 with a 2% loss en value. Eyes are turned to the SEC’s decision el the court decision, and XRP, which has declined this week after the rise en this process, may test the support levels of 0.6233-0.6049-0.5790 if the decline continues. If the decline gives way to rise again, it can test the resistance levels of 0.6430-0.6649-0.6900.
Positive news from the SEC for XRP may cause a rise and XRP may trade above the 0.70 level and offer a long trading opportunity en this process. Otherwise, the decline may deepen and it may trade below the 0.54 level and offer a short trading opportunity.
EMA50 (Green Line) – EMA200 (Purple Line)
Supports 0. 6233 – 0. 6049 – 0.5790
Resistances 0.6430 – 0.6 649 – 0.6900
DOGE/USDT
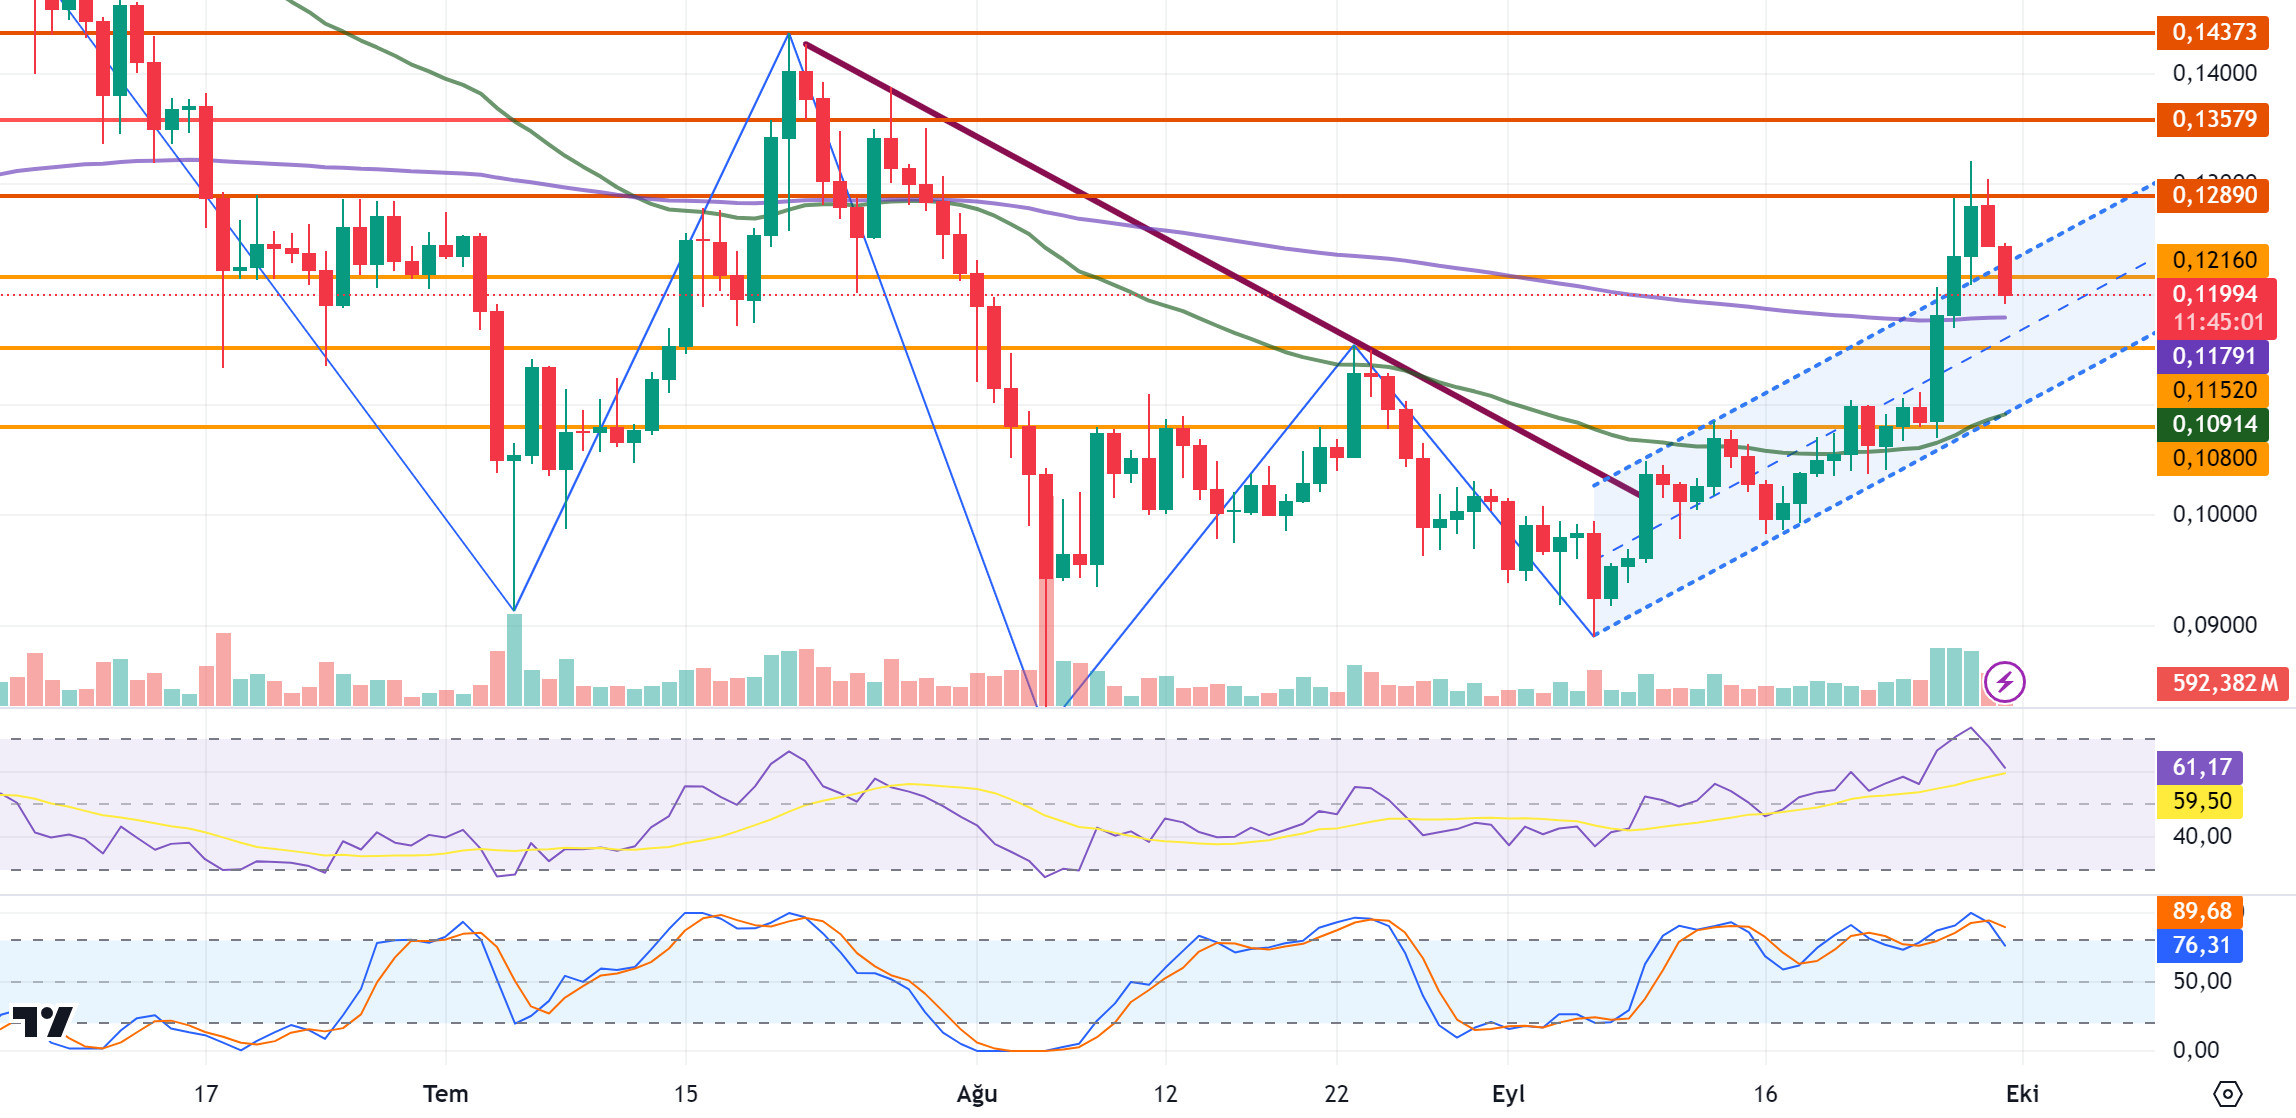
After rising above the 0.13 level last week, DOGE is currently trading at 0.1199 with the decline it experienced. DOGE continues to be traded en an ascending channel with its decline. If the decline gives way to an uptrend, DOGE may test the resistance levels of 0.1289-0.1357-0.1437. In case the decline deepens, it may test the support levels of 0.1216-0.1152-0.1080.
In the DOGE decline, it may rise again with the purchases that may come at the EMA200 level and may offer a long trading opportunity. If it is traded below EMA200, the decline may deepen and offer a short trading opportunity. Especially with its rise last week and its correction en the last 2 days, a flag formation may occur and en this case, it may offer a long trading opportunity en the exit it may experience.
EMA50 (Green Line) – EMA200 (Purple Line)
Supports 0.1216 – 0.1152 – 0.1080
Resistances 0.1 289 – 0.1357 – 0.1437
DOT/USDT
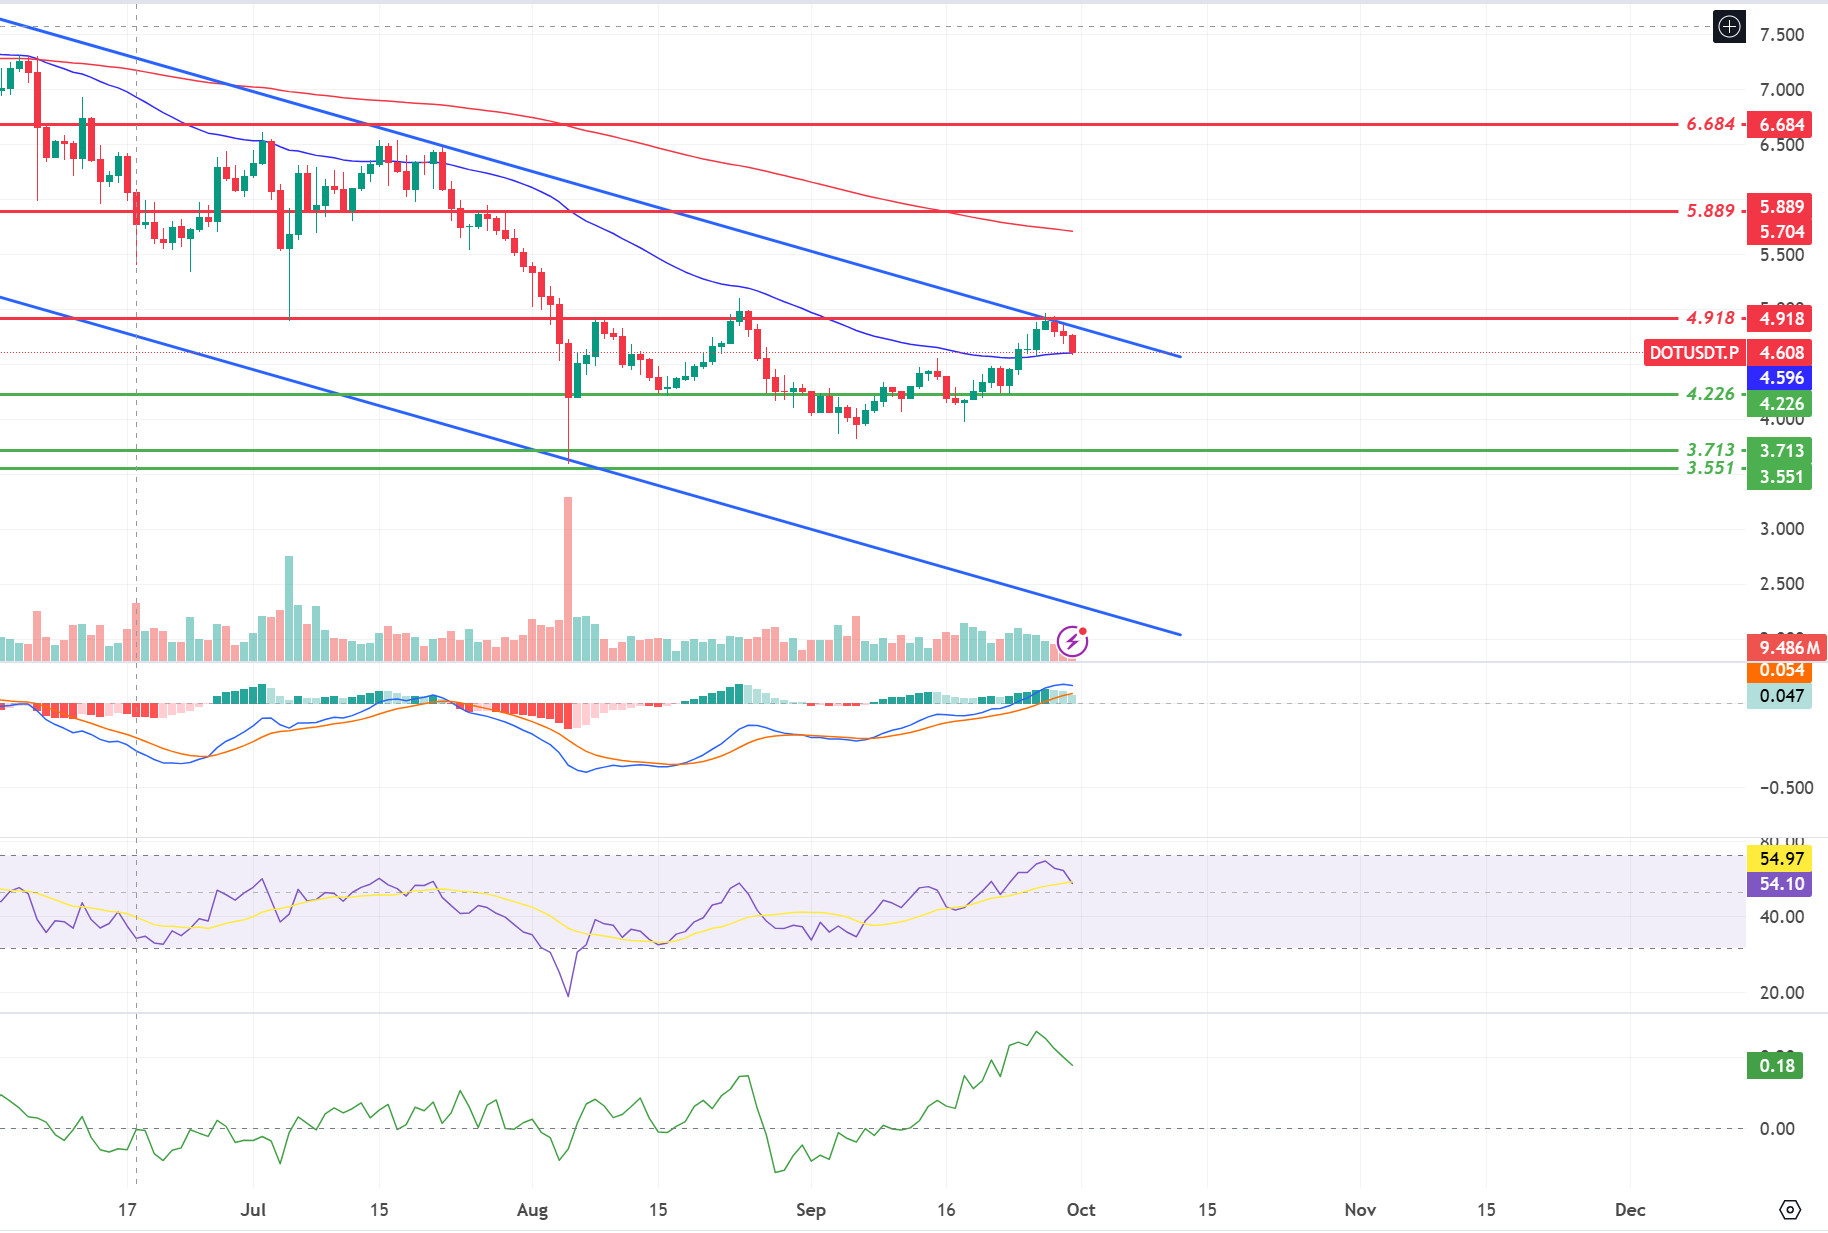
Last week, Polkadot partnered with EasyA to announce the blockchain-focused EasyA x Polkadot University. This new university aims to train the next generation of blockchain developers to launch projects en the Polkadot ecosystem. Polkadot also spent around $387K el the Token2049 event en Singapore, but this had a limited impact el the DOT token price. The community is concerned about the platform’s limited number of active users despite the large marketing budget.
When we examine the Polkadot (DOT) chart, we see that the price is rejected from the 4.918 level, which is the upper band of the falling channel and also our resistance level. In the negative scenario, we can expect the price to retreat to 4,226 levels. On the other hand, when we examine the RSI, we see that there is a positive mismatch. If the price can maintain above the EMA50 level, it may retest the selling pressure en the 4.918 band.
Supports 4,226 – 3,713 – 3,551
Resistances 4.918 – 5.889 – 6.684
SHIB/USDT
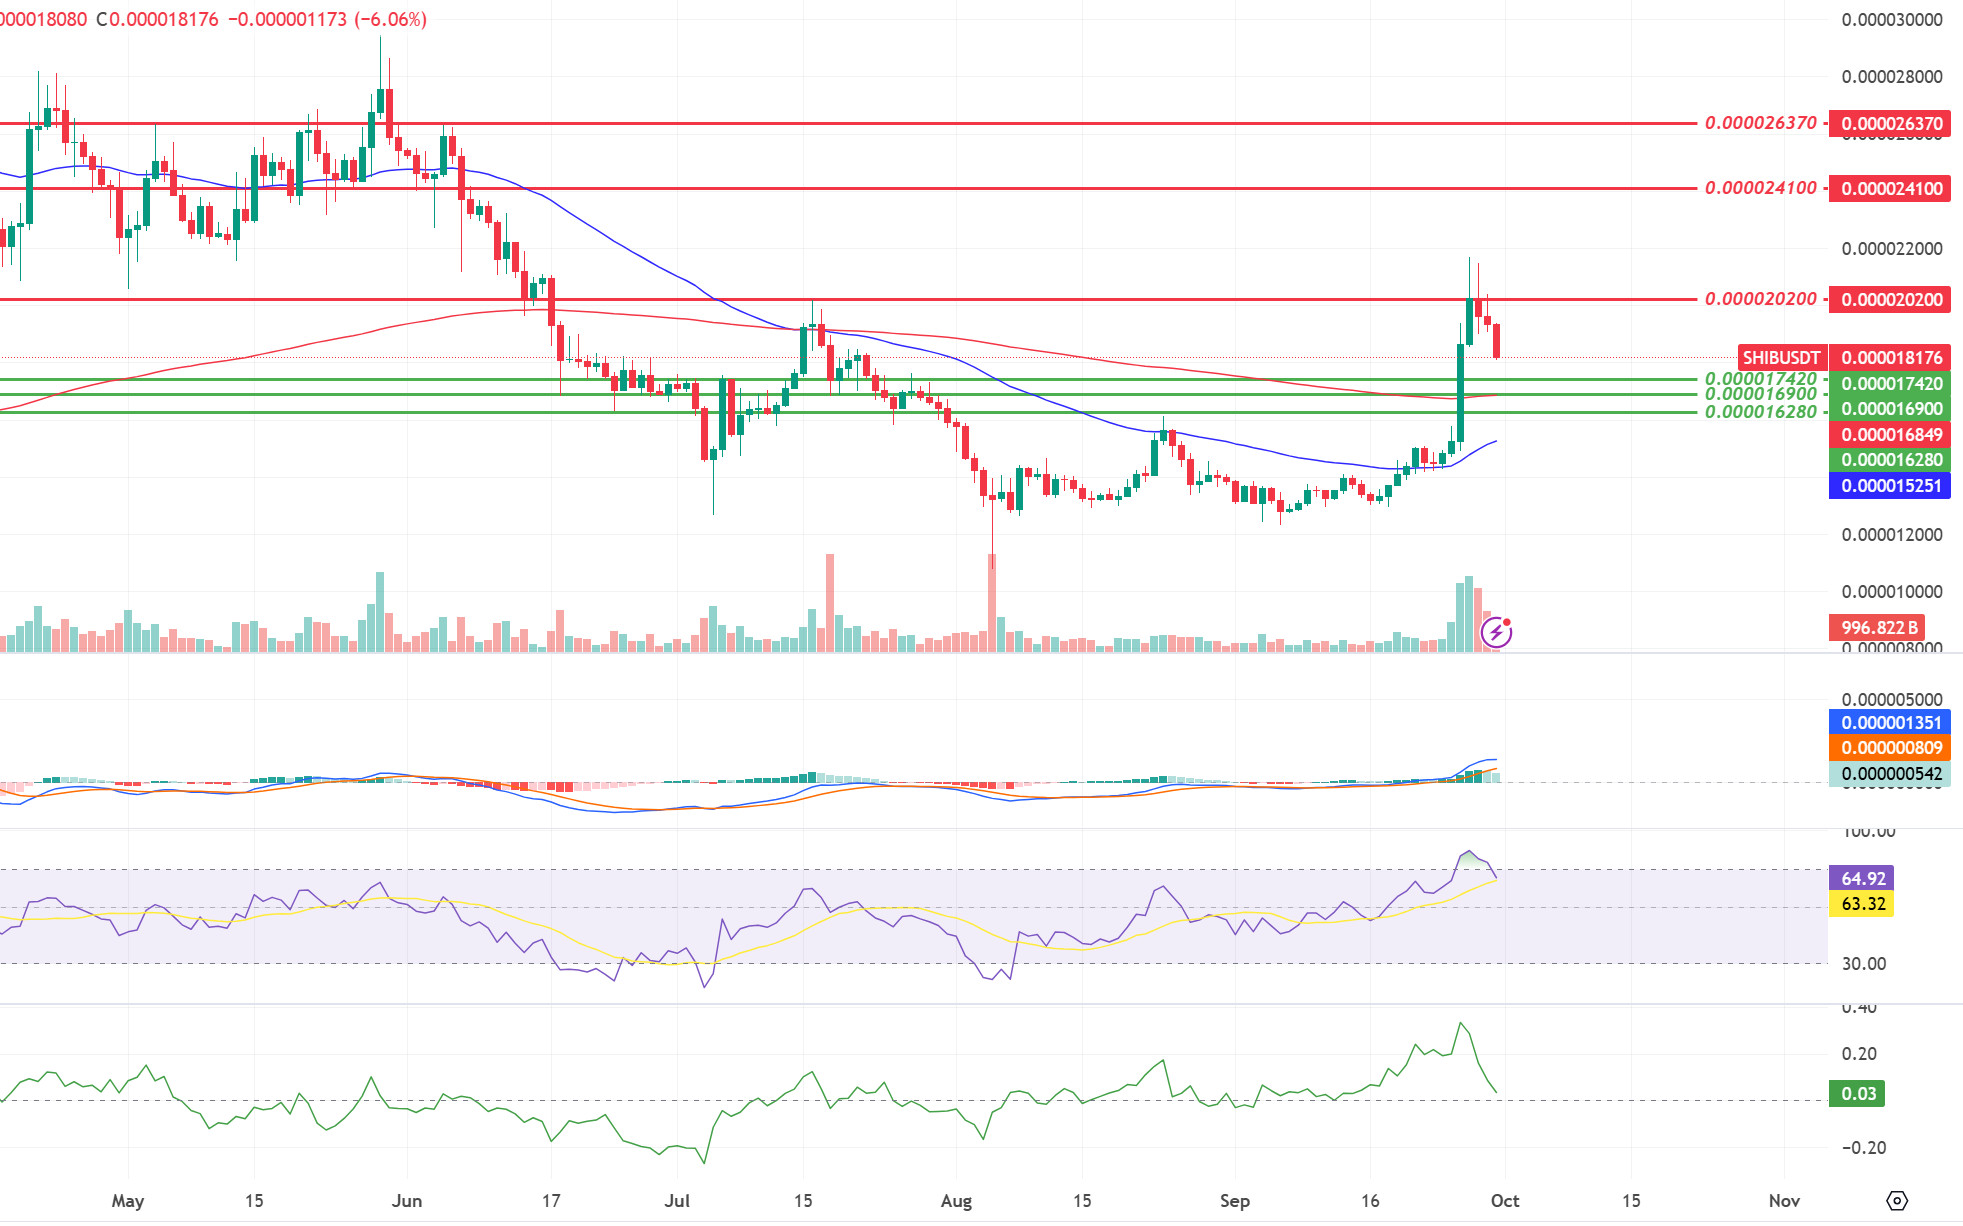
Last week, Shytoshi Kusama, the lead developer of Shiba Inu (SHIB), emphasized that he will continue the project regardless of the community’s support and that the SHIB ecosystem will focus el decentralized finance. SHIB’s burn rate increased por 5,094% with 2 billion SHIBs burned, while its price increased por 37%. In addition, Shibarium will facilitate logins to DeFi with fiat el-ramps, while privacy-focused innovations such as zkKYC are planned.
When we examine the chart of Shiba Inu (SHIB), we see that the price is rejected from 0.00002020 resistance. When we examine the MACD oscillator, we see that the buying pressure is decreasing. In this context, the price may fall to the EMA200 level en the negative scenario. In the positive scenario, the price may want to break the selling pressure at the 0.00002020 level if the buying pressure and burning rates increase.
Supports 0.00001742 – 0.00001690 – 0.00001628
Resistances 0.00002020 – 0.00002410 – 0.00002637
LEGAL NOTICE
The investment information, comments and recommendations contained en this document do not constitute investment advisory services. Investment advisory services are provided por authorized institutions el a personal basis, taking into account the risk and return preferences of individuals. The comments and recommendations contained en this document are of a general type. These recommendations may not be suitable for your financial situation and risk and return preferences. Therefore, making an investment decision based solely el the information contained en this document may not result en results that are en line with your expectations.
