
Weekly Bitcoin Onchain Report
Active Addresses
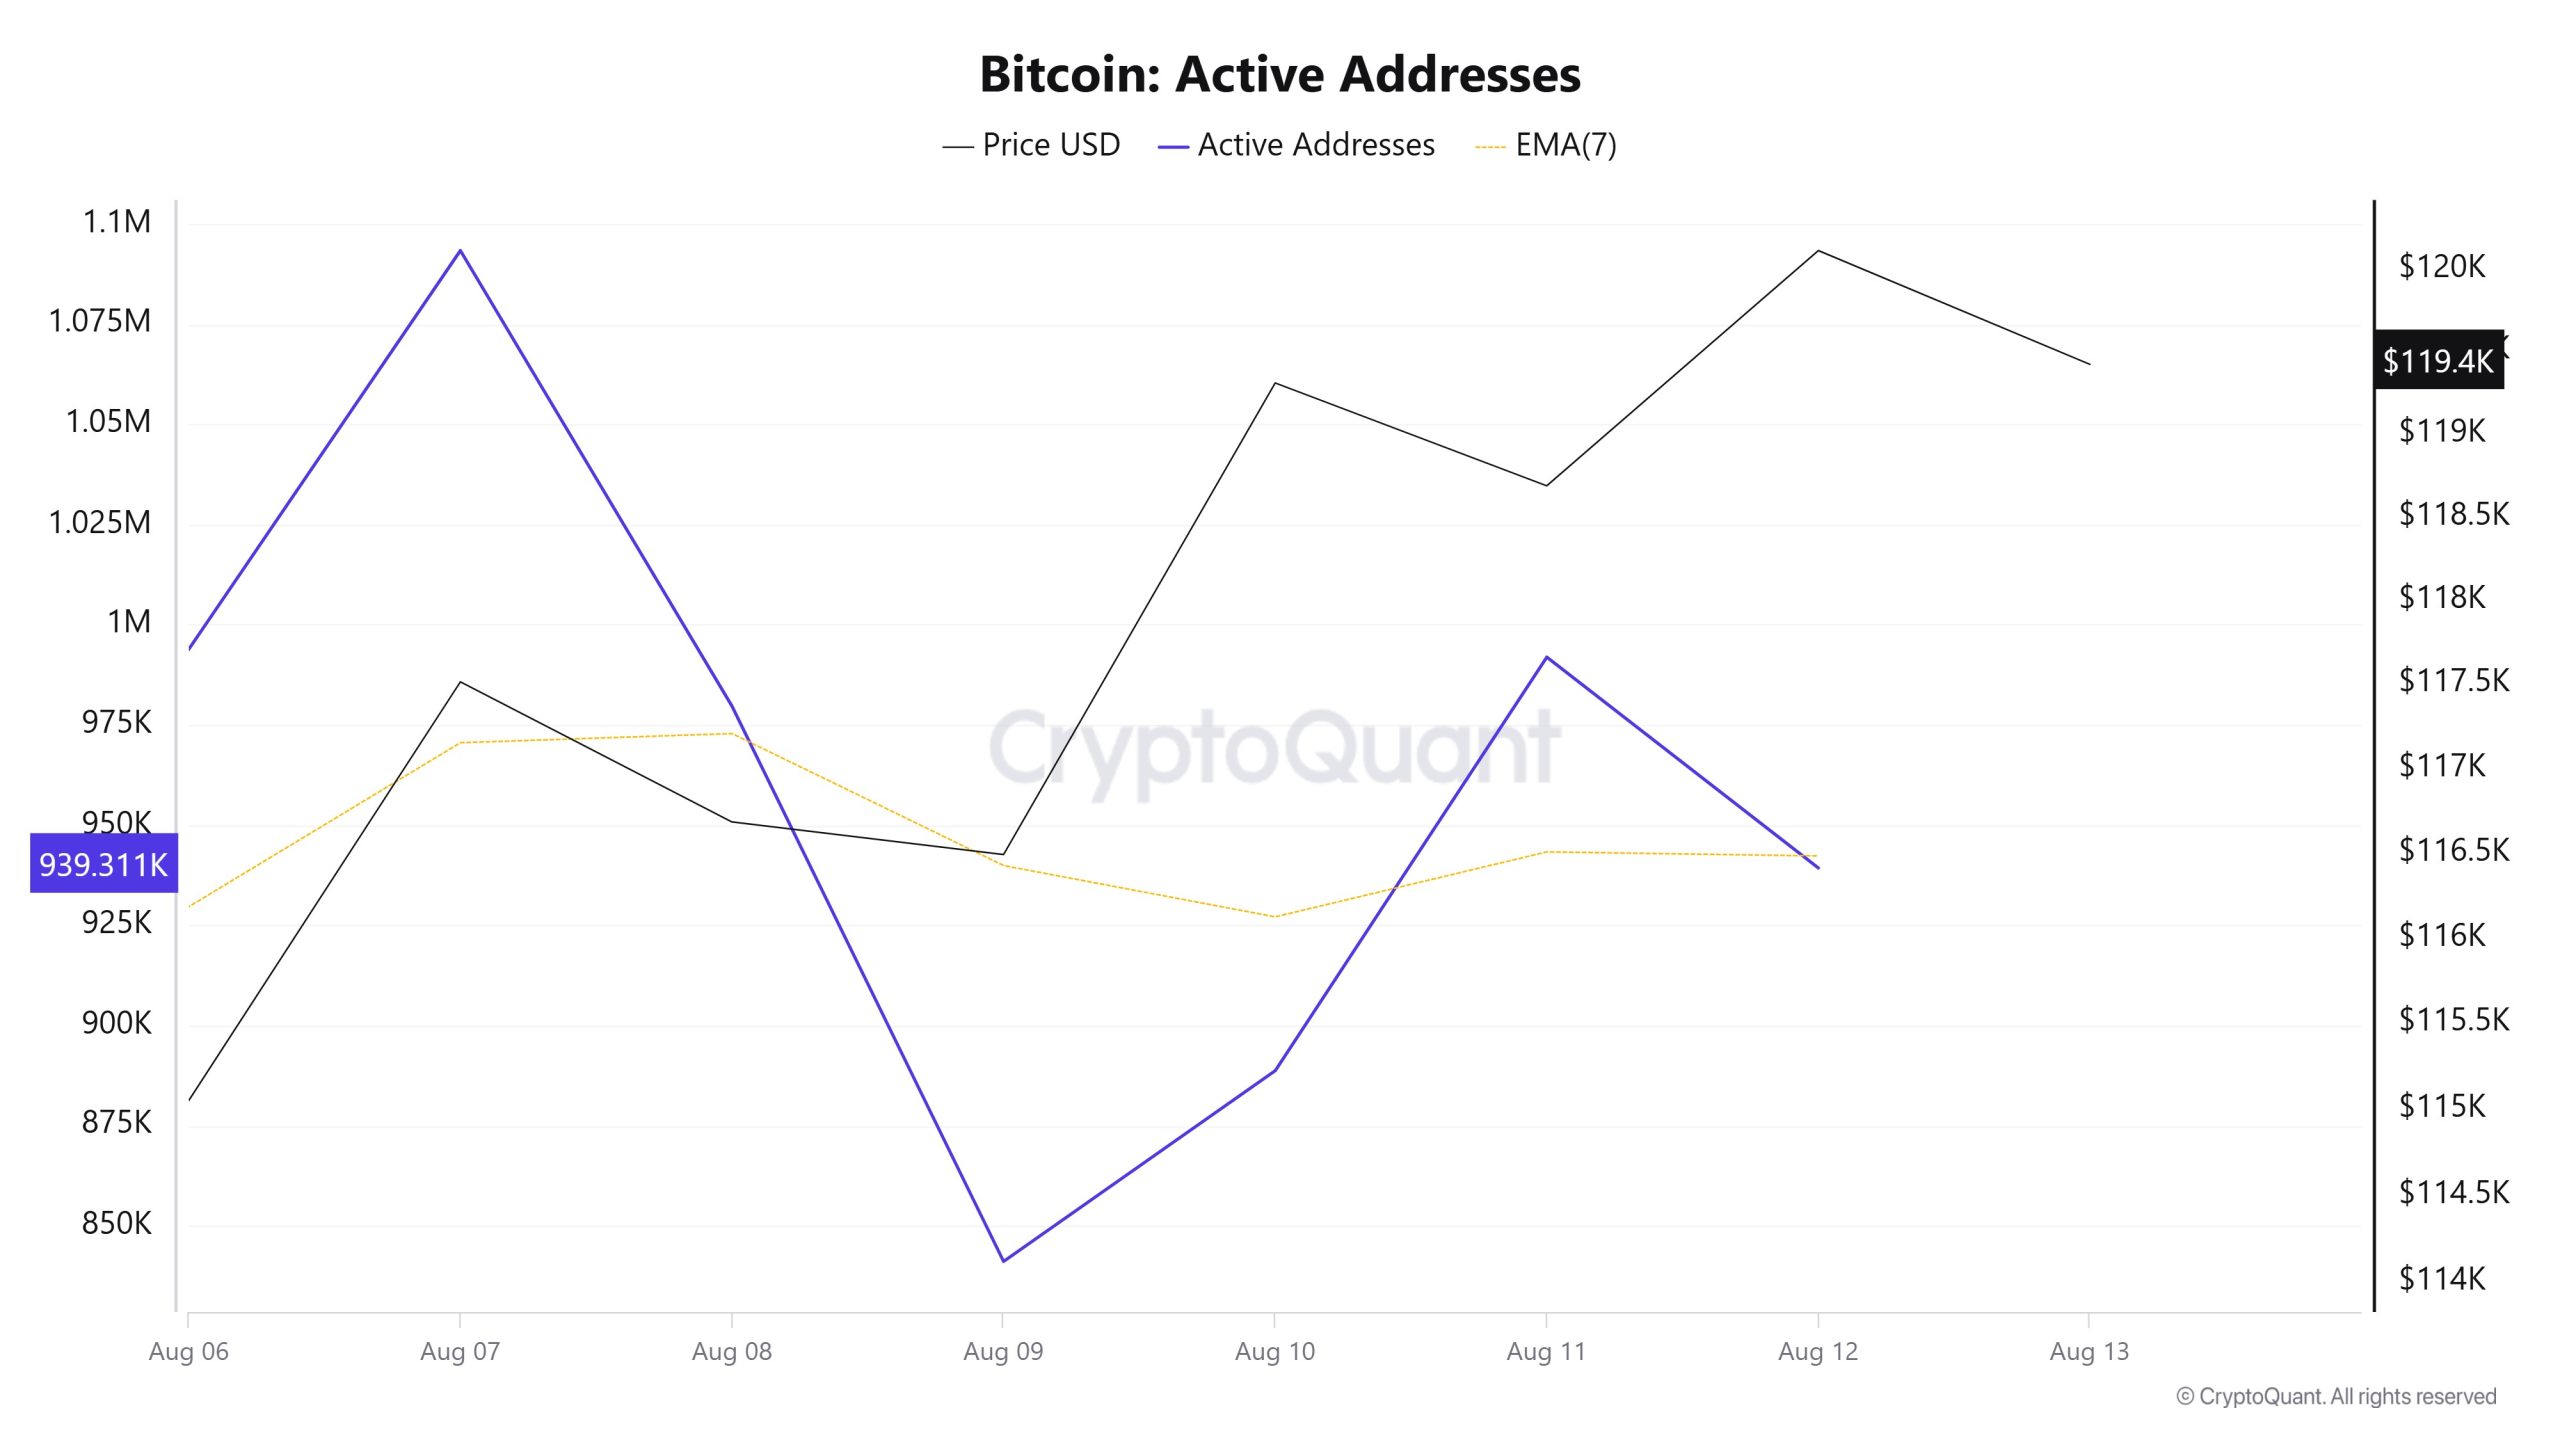
Between August 6 and August 13, 1,093,353 active addresses were added to the Bitcoin network. During this period, the Bitcoin price rose to $117,000. Notably, the decline en the number of active addresses el August 9 caused the price to move toward $120,000. From a technical perspective, the upward movement observed at the point where the 7-day simple moving average (SMA) crossed the price el August 7 is noteworthy. This technical signal indicates that there is buying activity en the market.
Active Sending Addresses
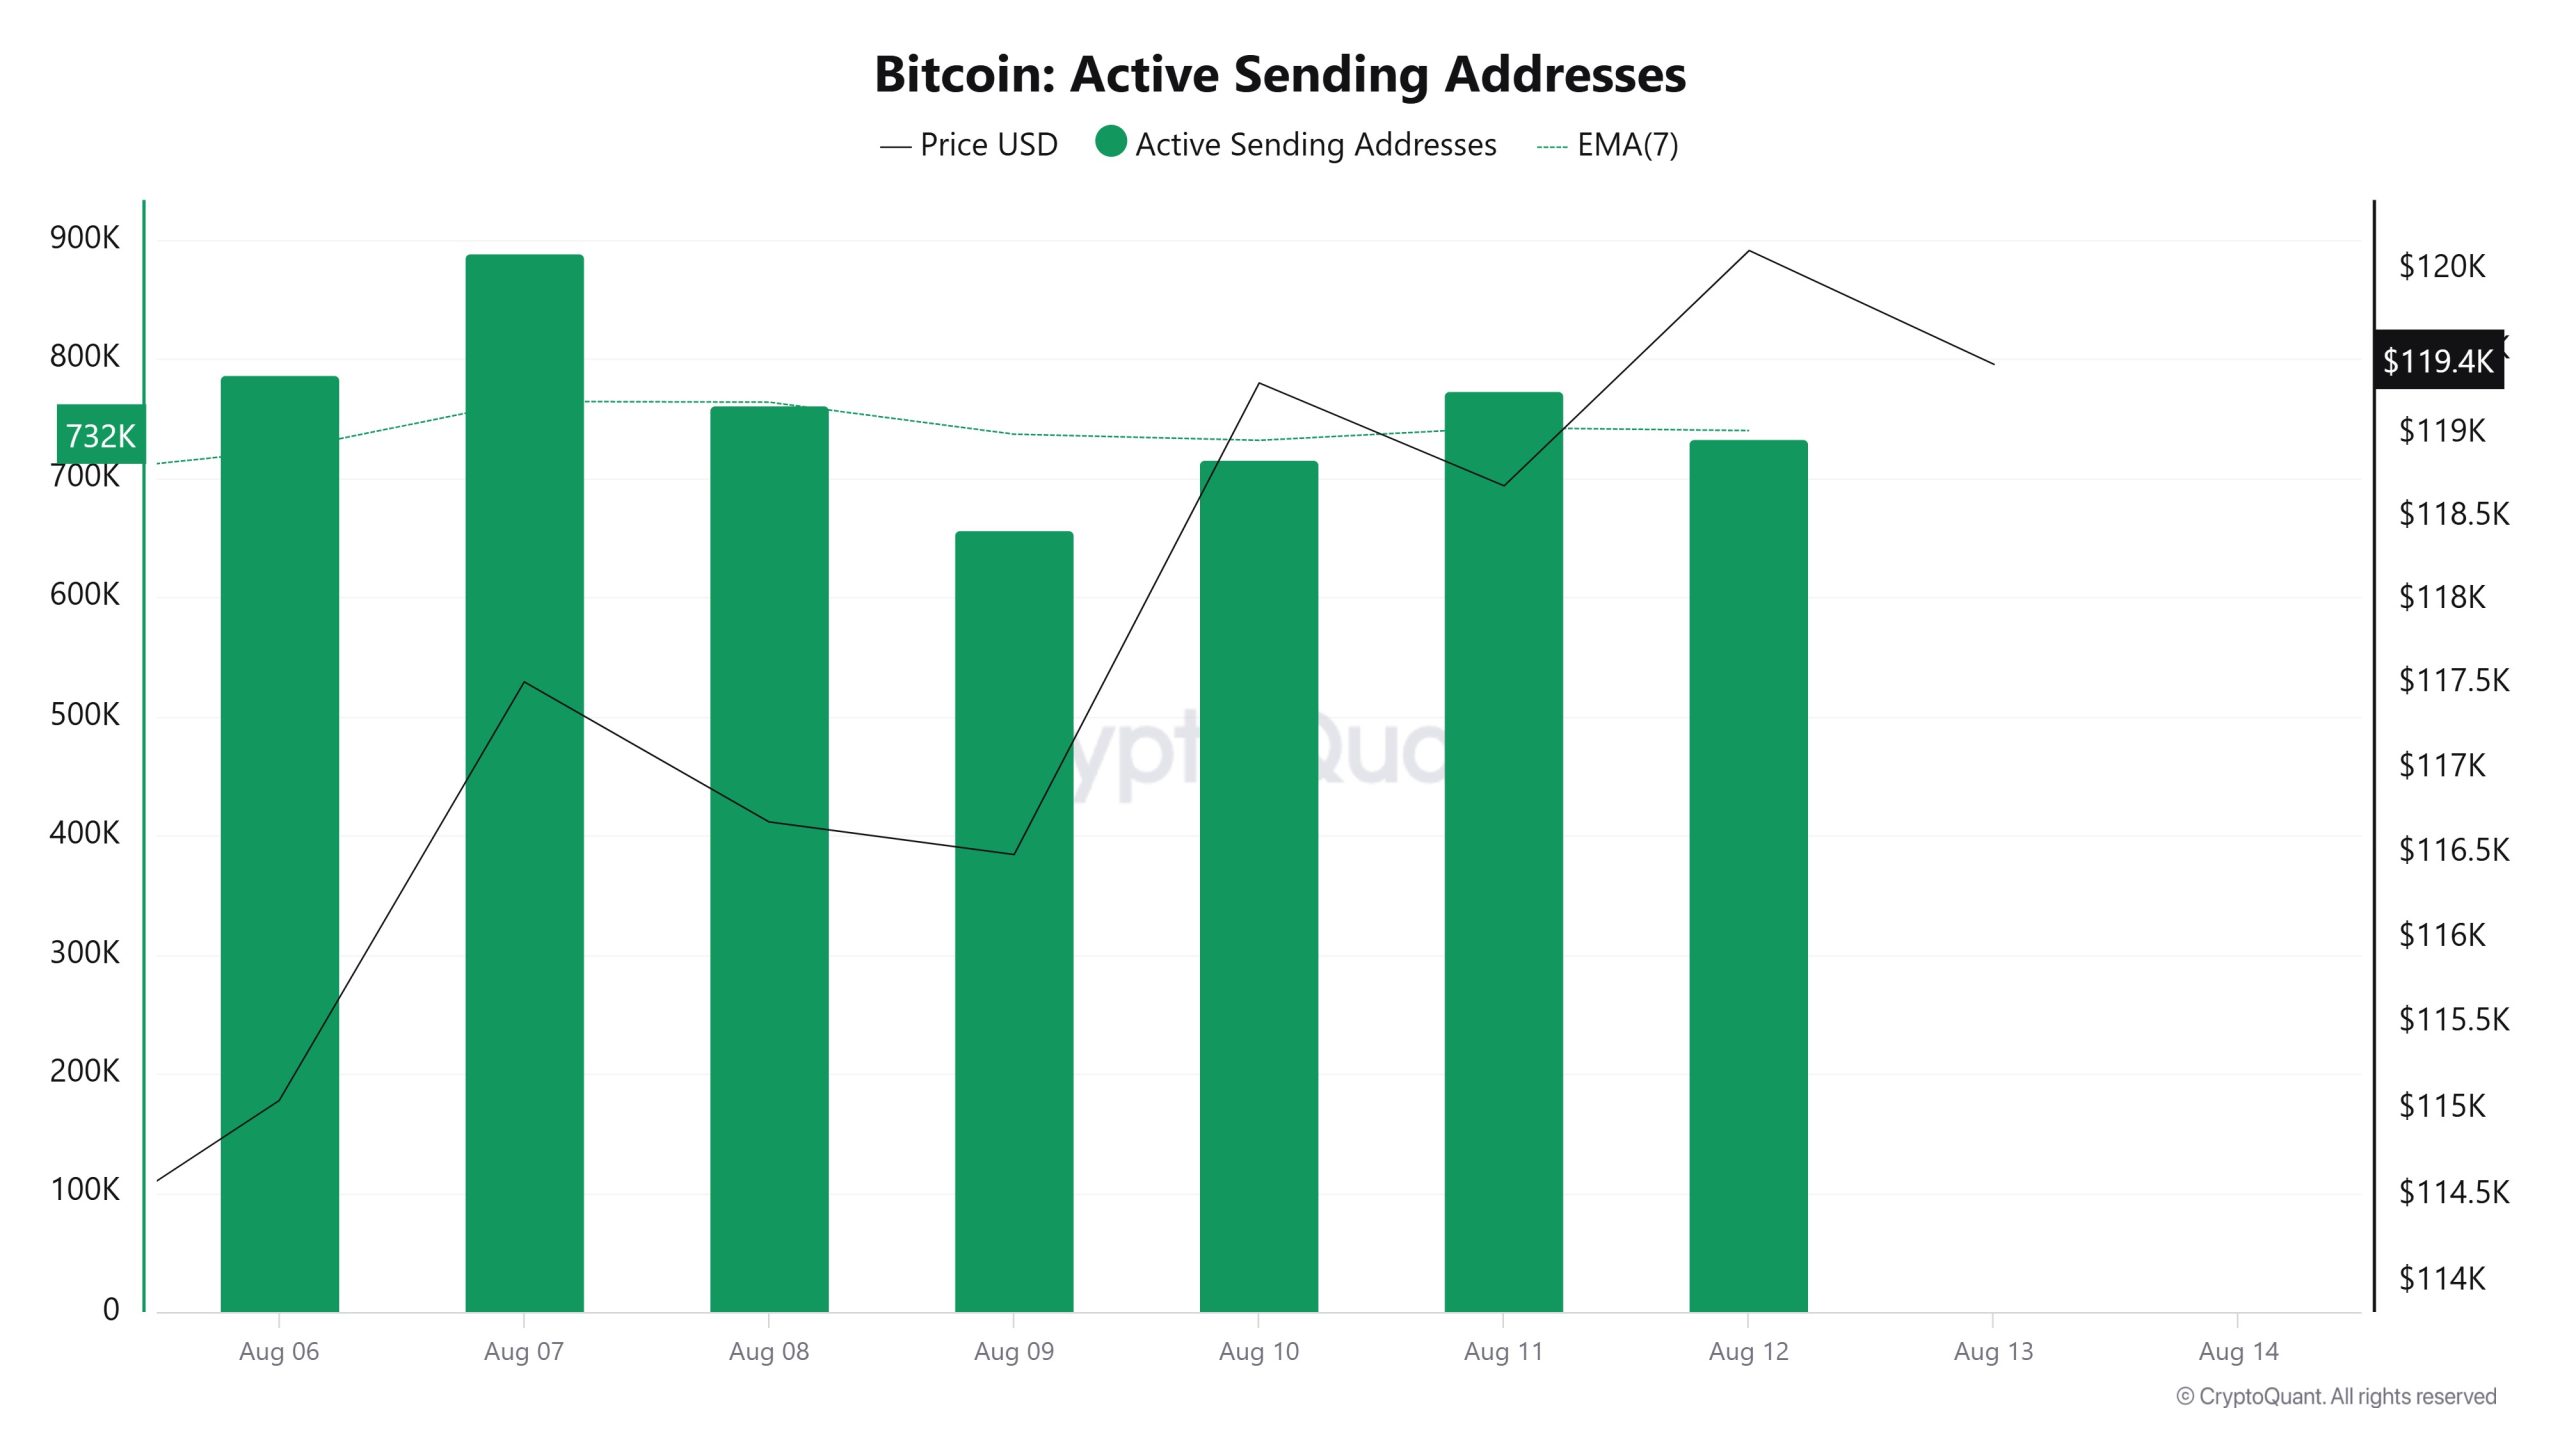
Between August 6 and August 13, an upward trend was observed en the “active sending addresses” metric. On the day the price reached its highest level, this metric stood at 732,887, indicating that user activity el the Bitcoin network was moving en parallel with the price.
This data indicates that the $120,000 level is supported not only por price-based factors but also por el-chain address activity. Overall, the Active Sending Addresses metric has followed an upward trend during this period.
Active Receiving Addresses
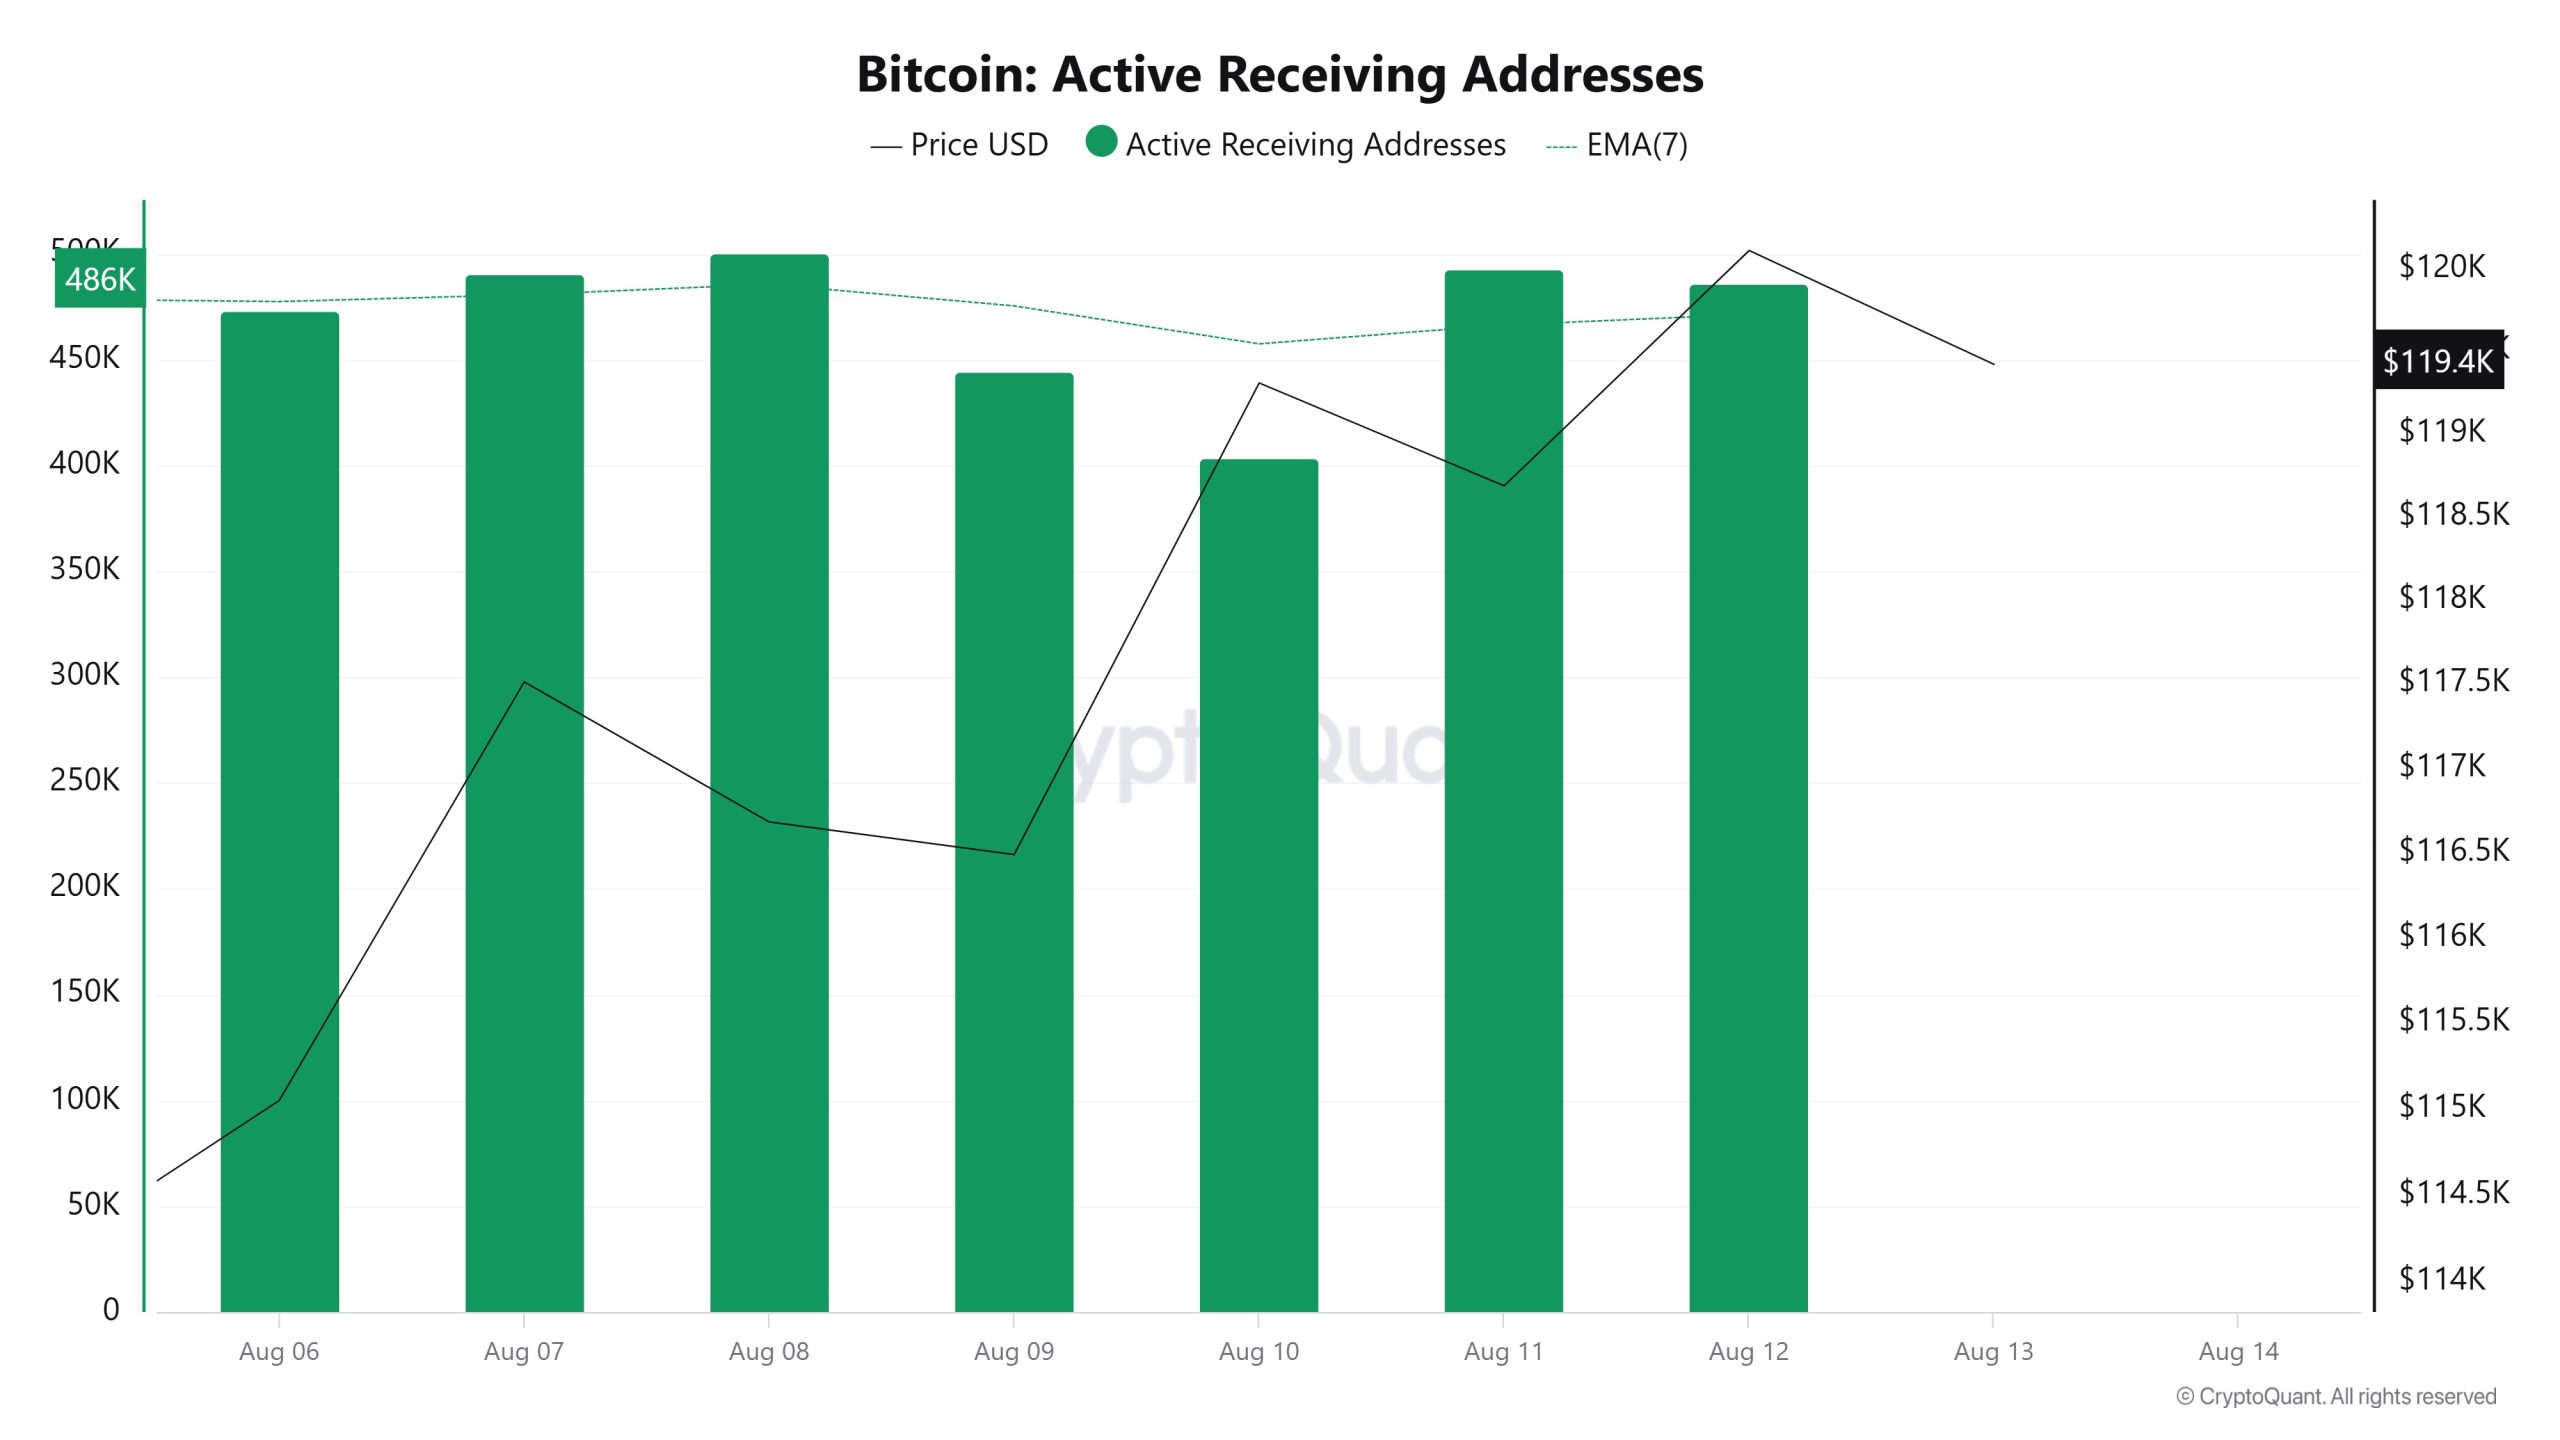
Between August 6 and August 13, there was a typical increase en active receiving addresses alongside the Black Line (price line). On the day the price reached its peak, active receiving addresses rose to 486,240, indicating that buyers were purchasing Bitcoin at the 120,000 dollar level.
Breakdowns
MVRV
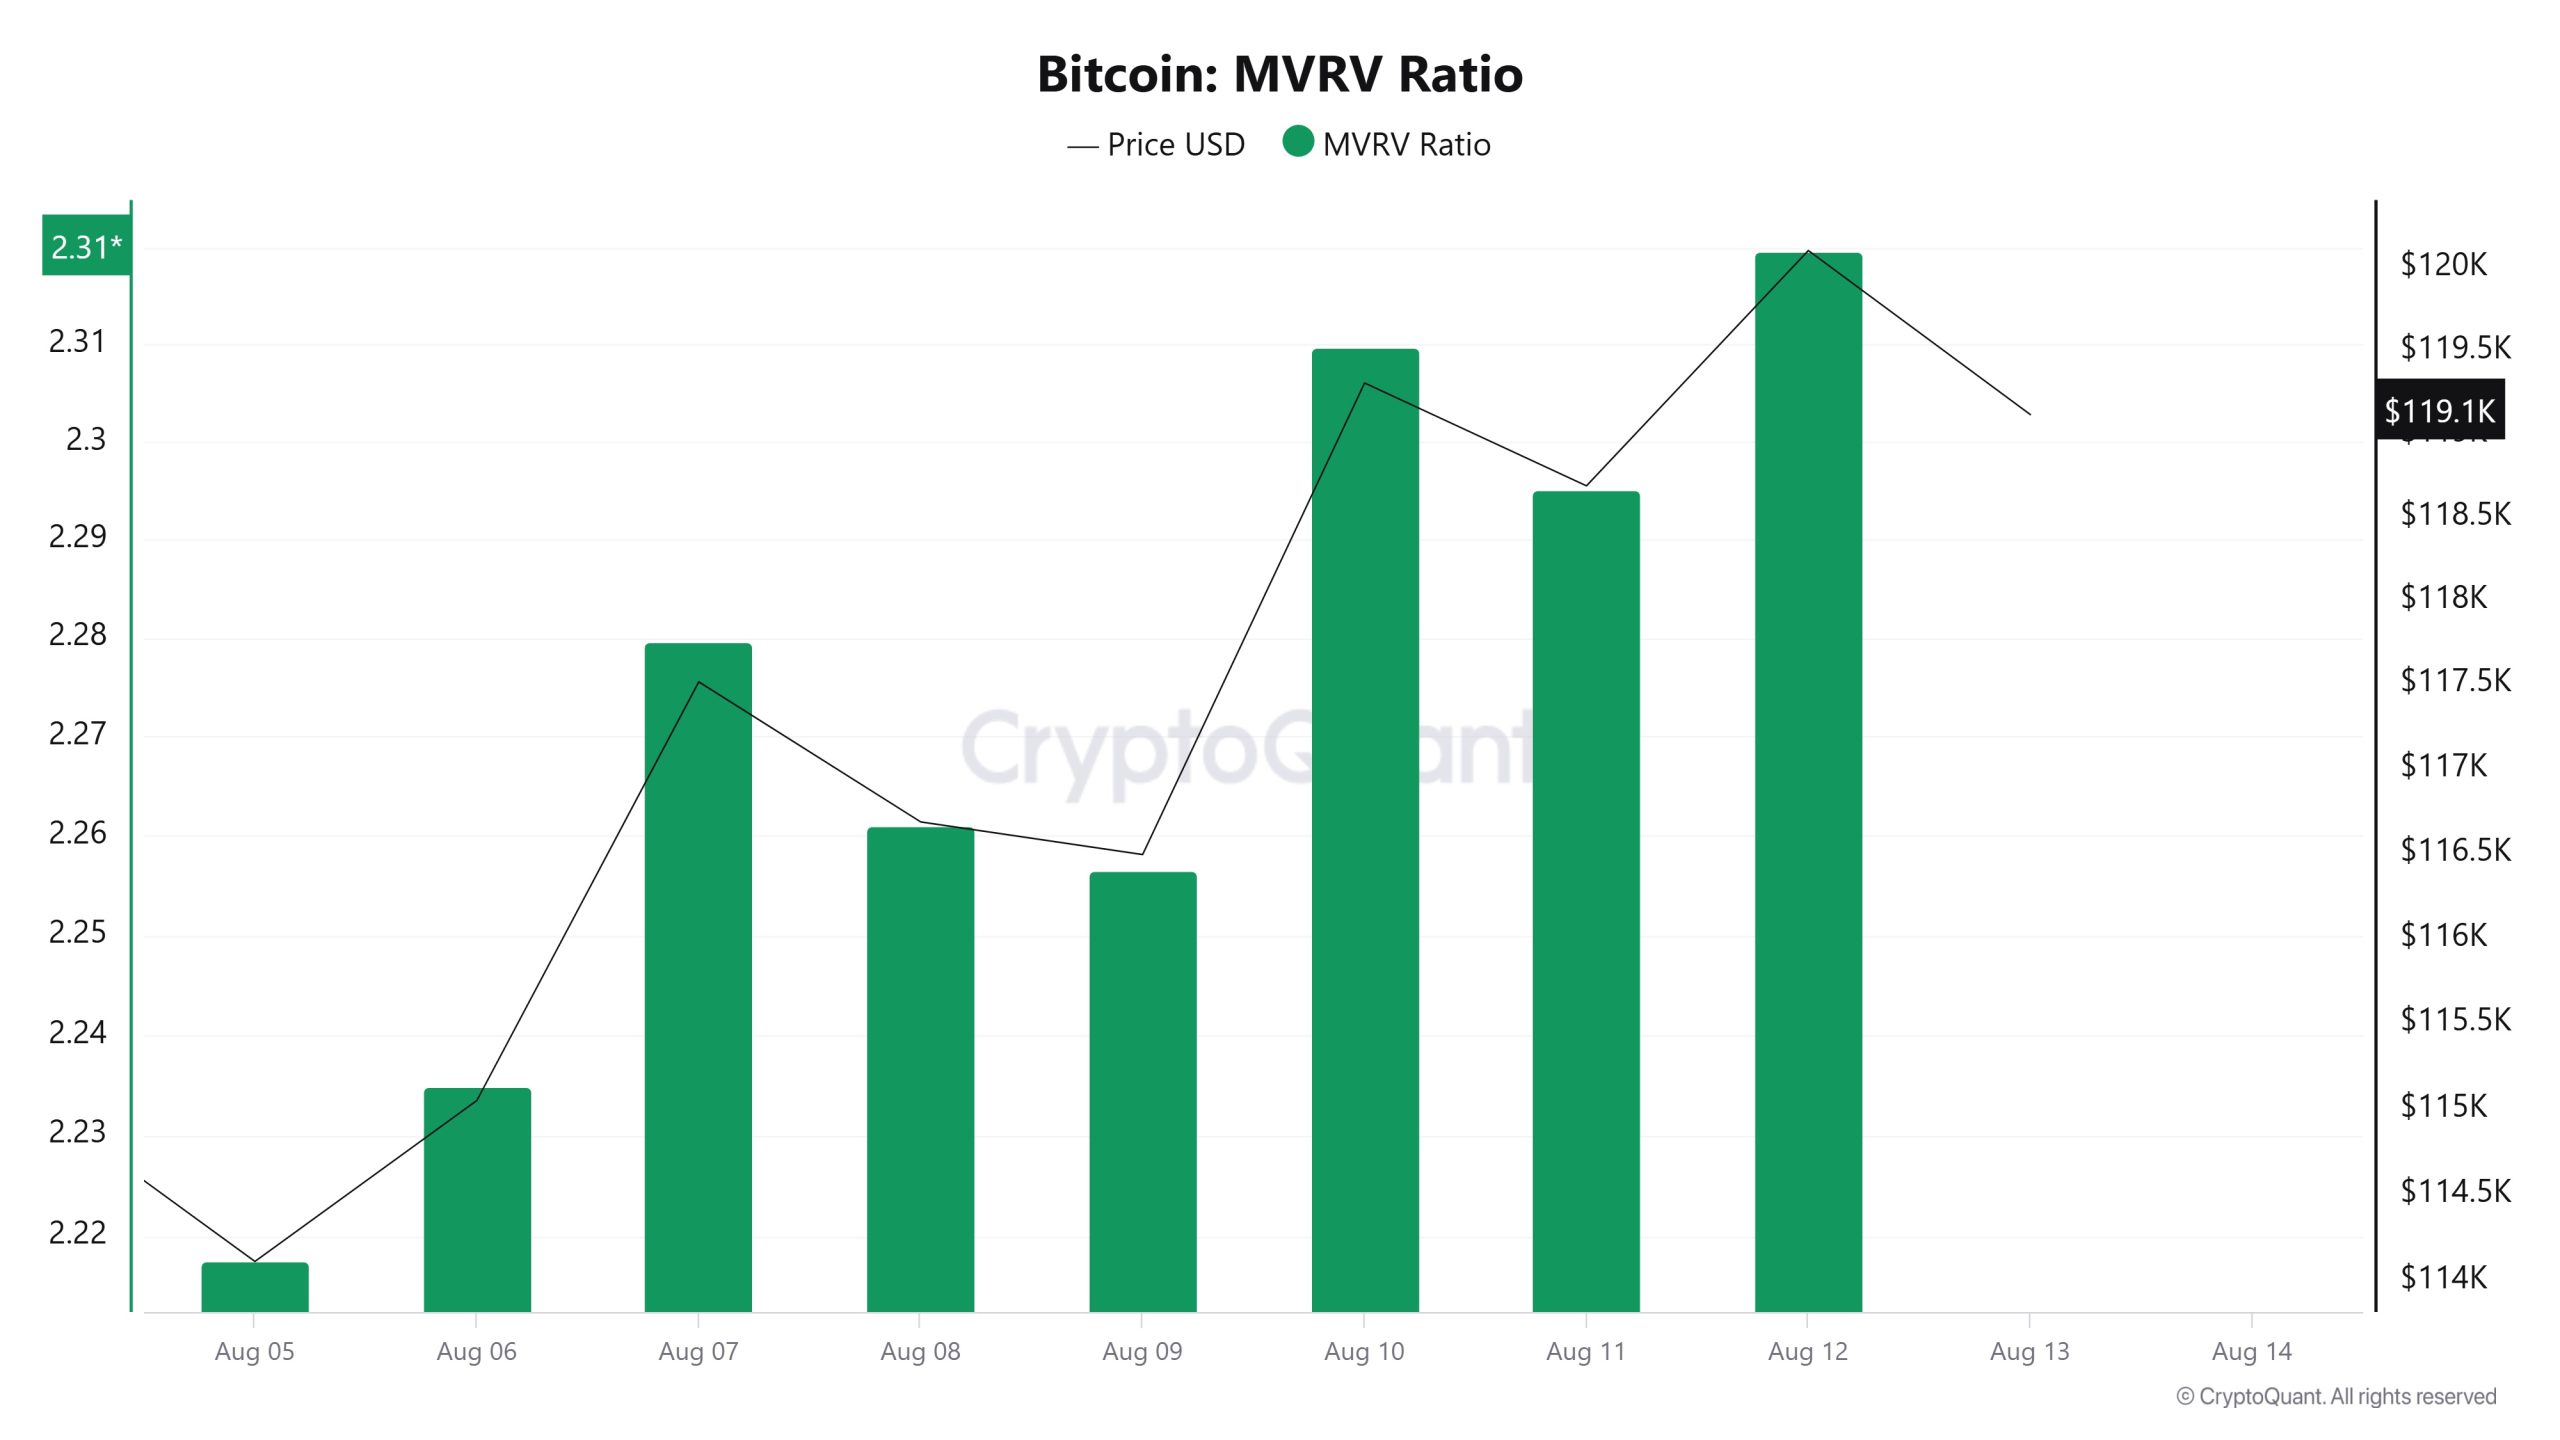
On August 6, when the Bitcoin price was at 115,048, the MVRV Ratio stood at 2.234. By August 12, the Bitcoin price had risen to 120,108, marking a 4.41% increase, while the MVRV Ratio rose to 2.319, recording a 3.81% increase.
Realized Price
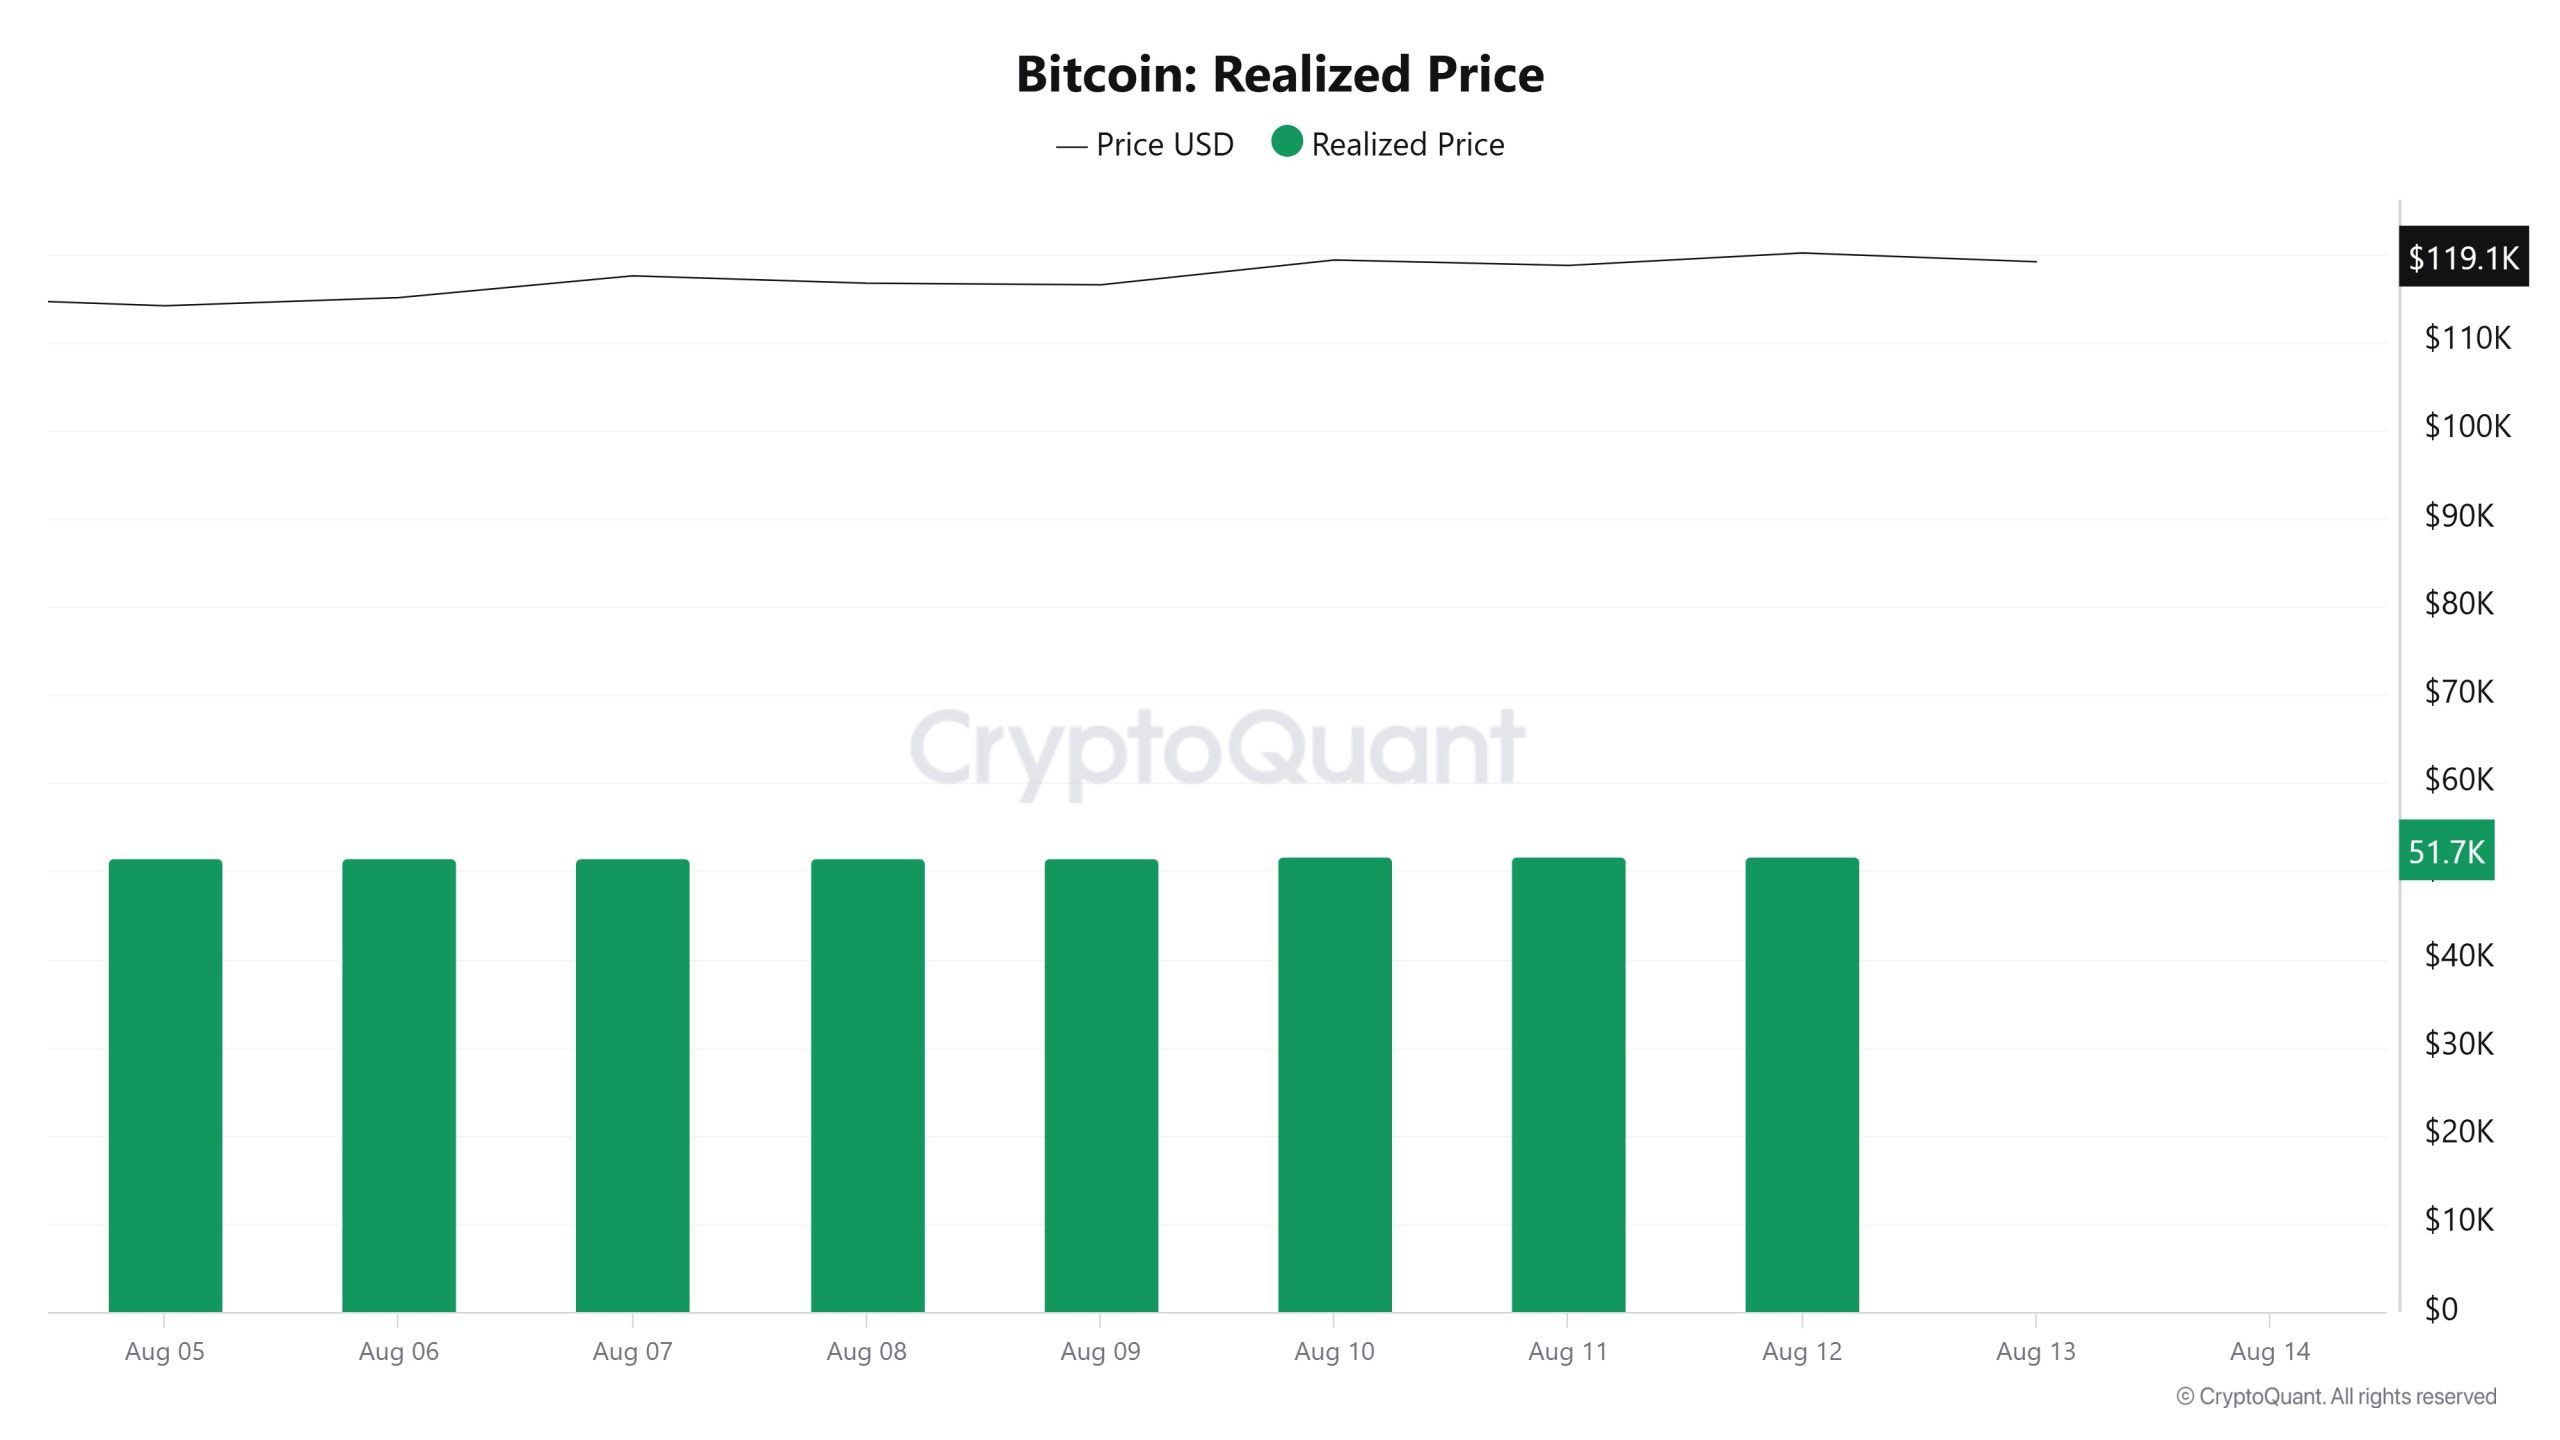
On August 6, when the Bitcoin price was at 115,048, the Realized Price was at 51,478. As of August 12, the Bitcoin price rose to 120,108, showing a 4.41% increase, while the Realized Price rose to 51,777, recording a 0.58% increase.
Spent Output Profit Ratio (SOPR)
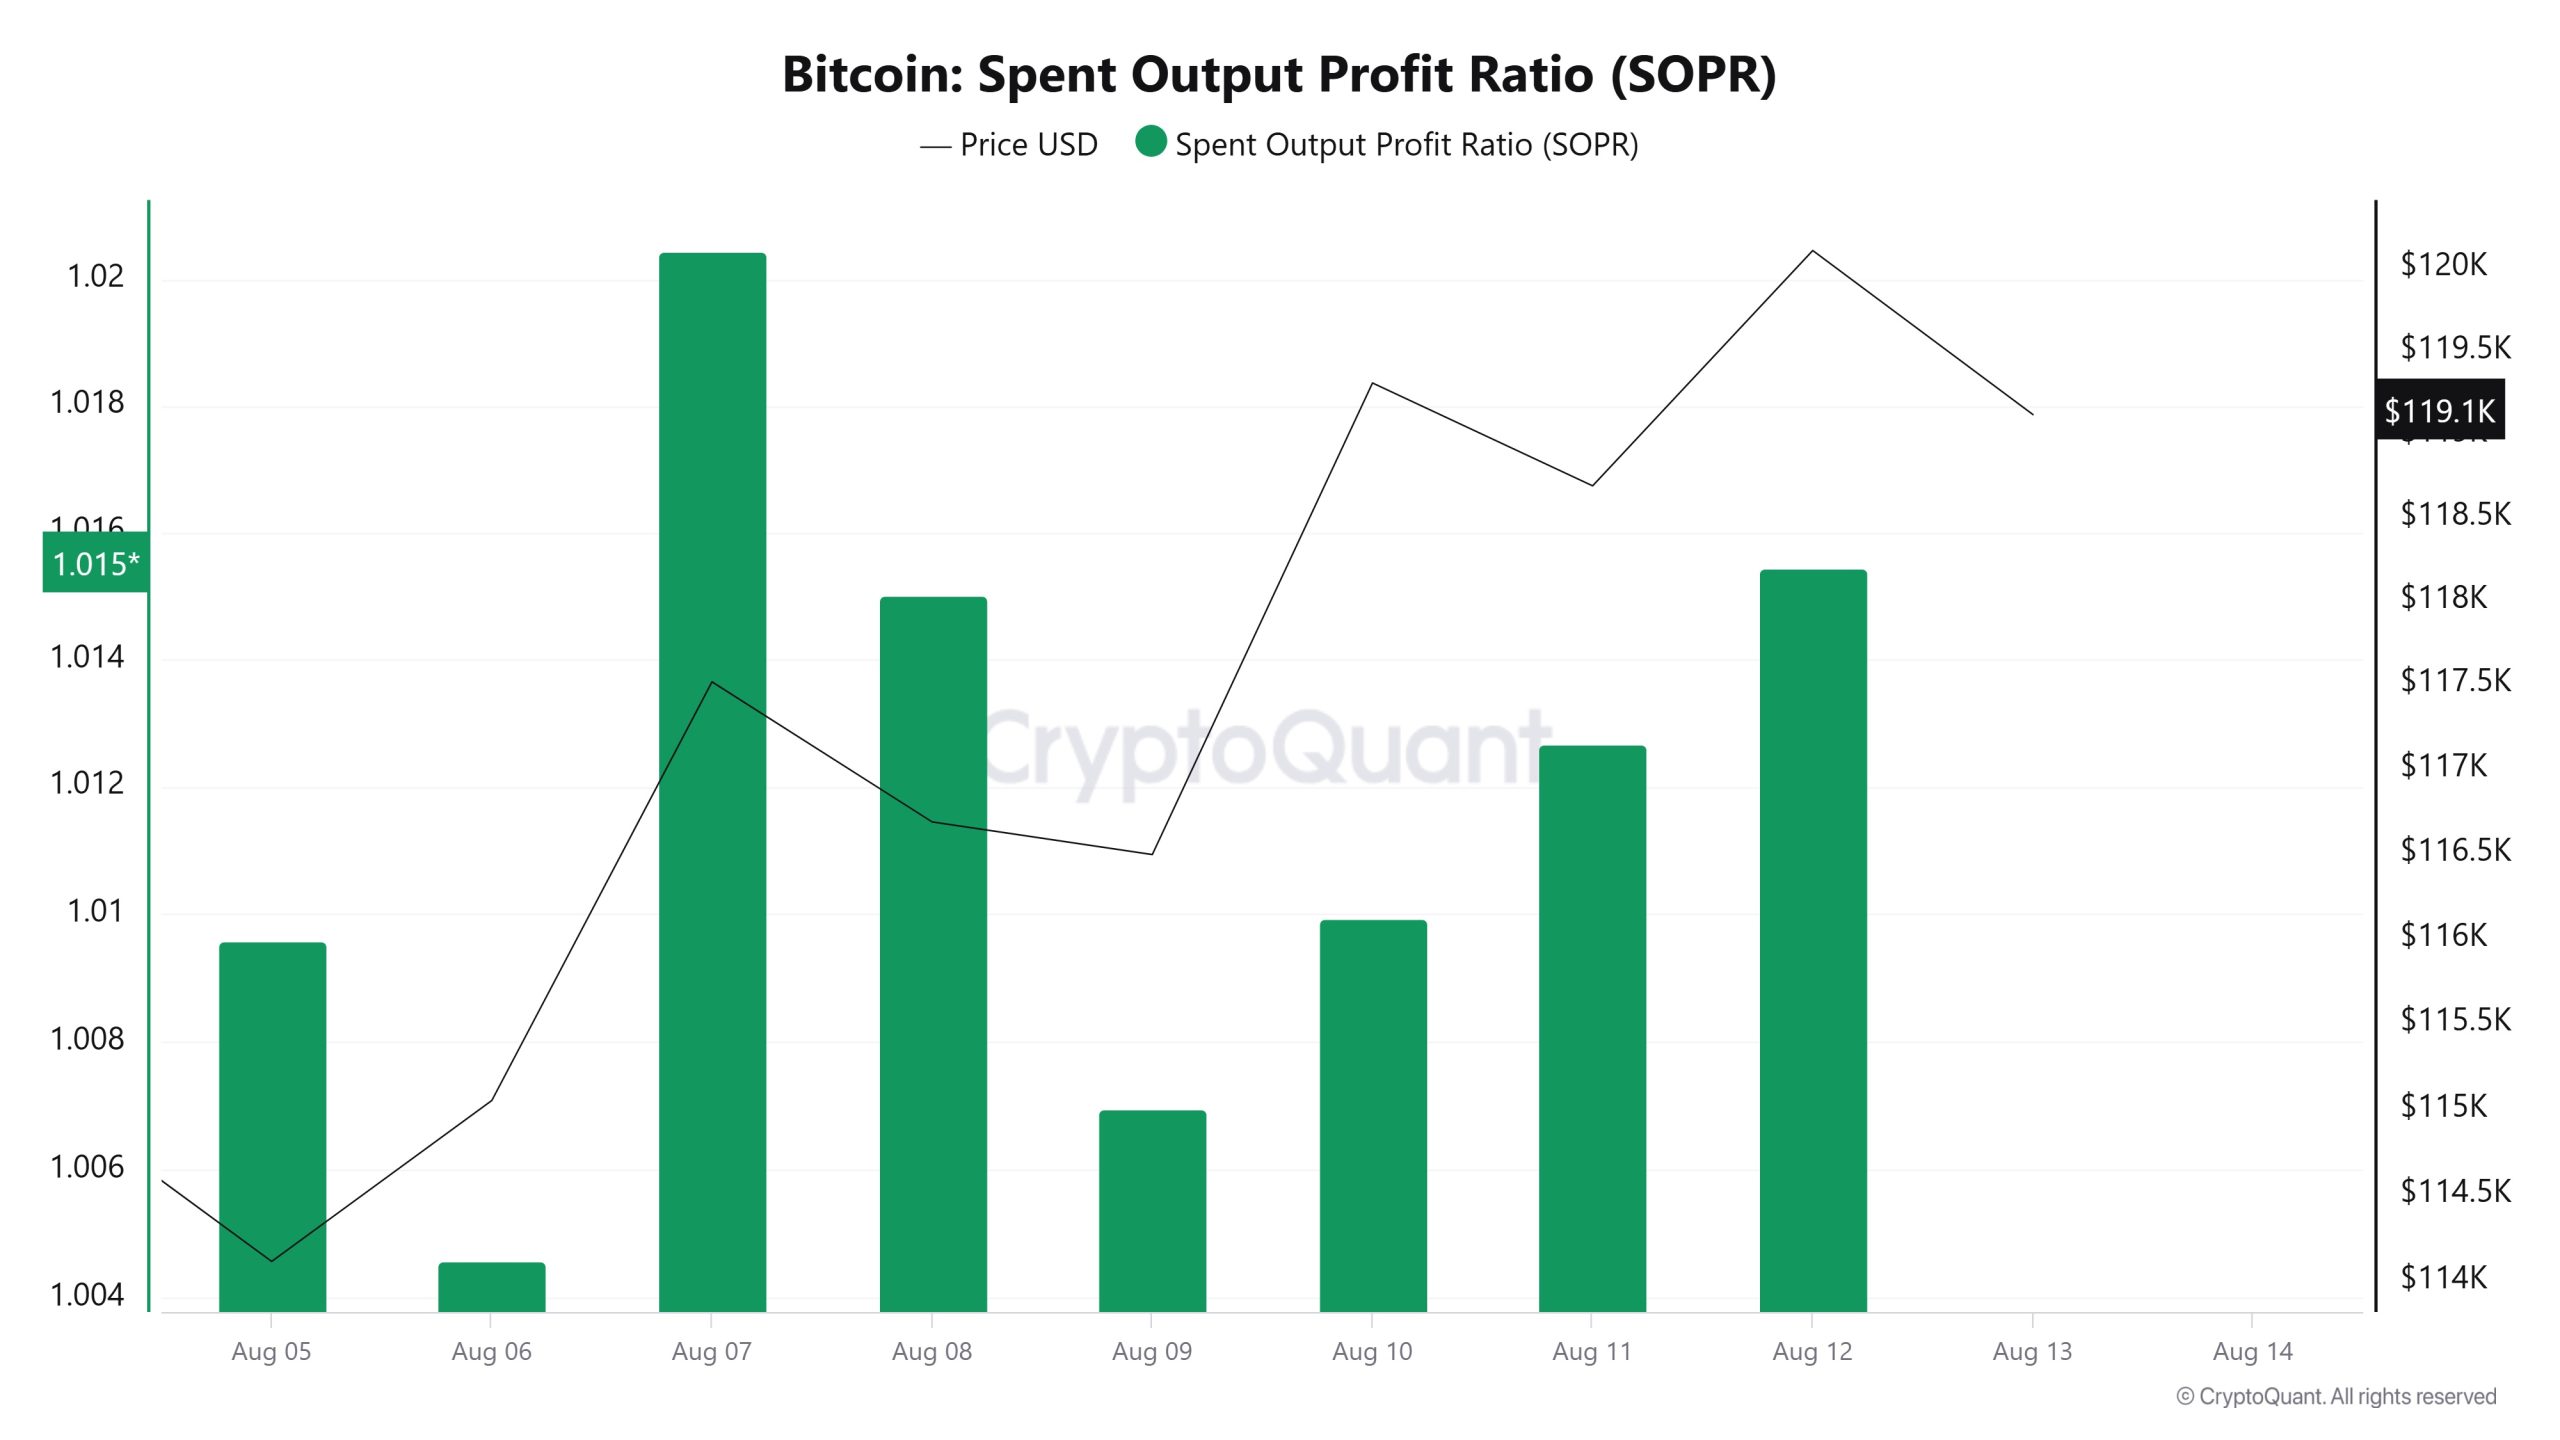
On August 6, when the Bitcoin price was at 115,048, the SOPR metric was at 1.004. As of August 12, the Bitcoin price rose to 120,108, showing a 4.41% increase, while the SOPR metric rose to 1.015, recording a 1.10% increase.
Derivatives
Open Interest
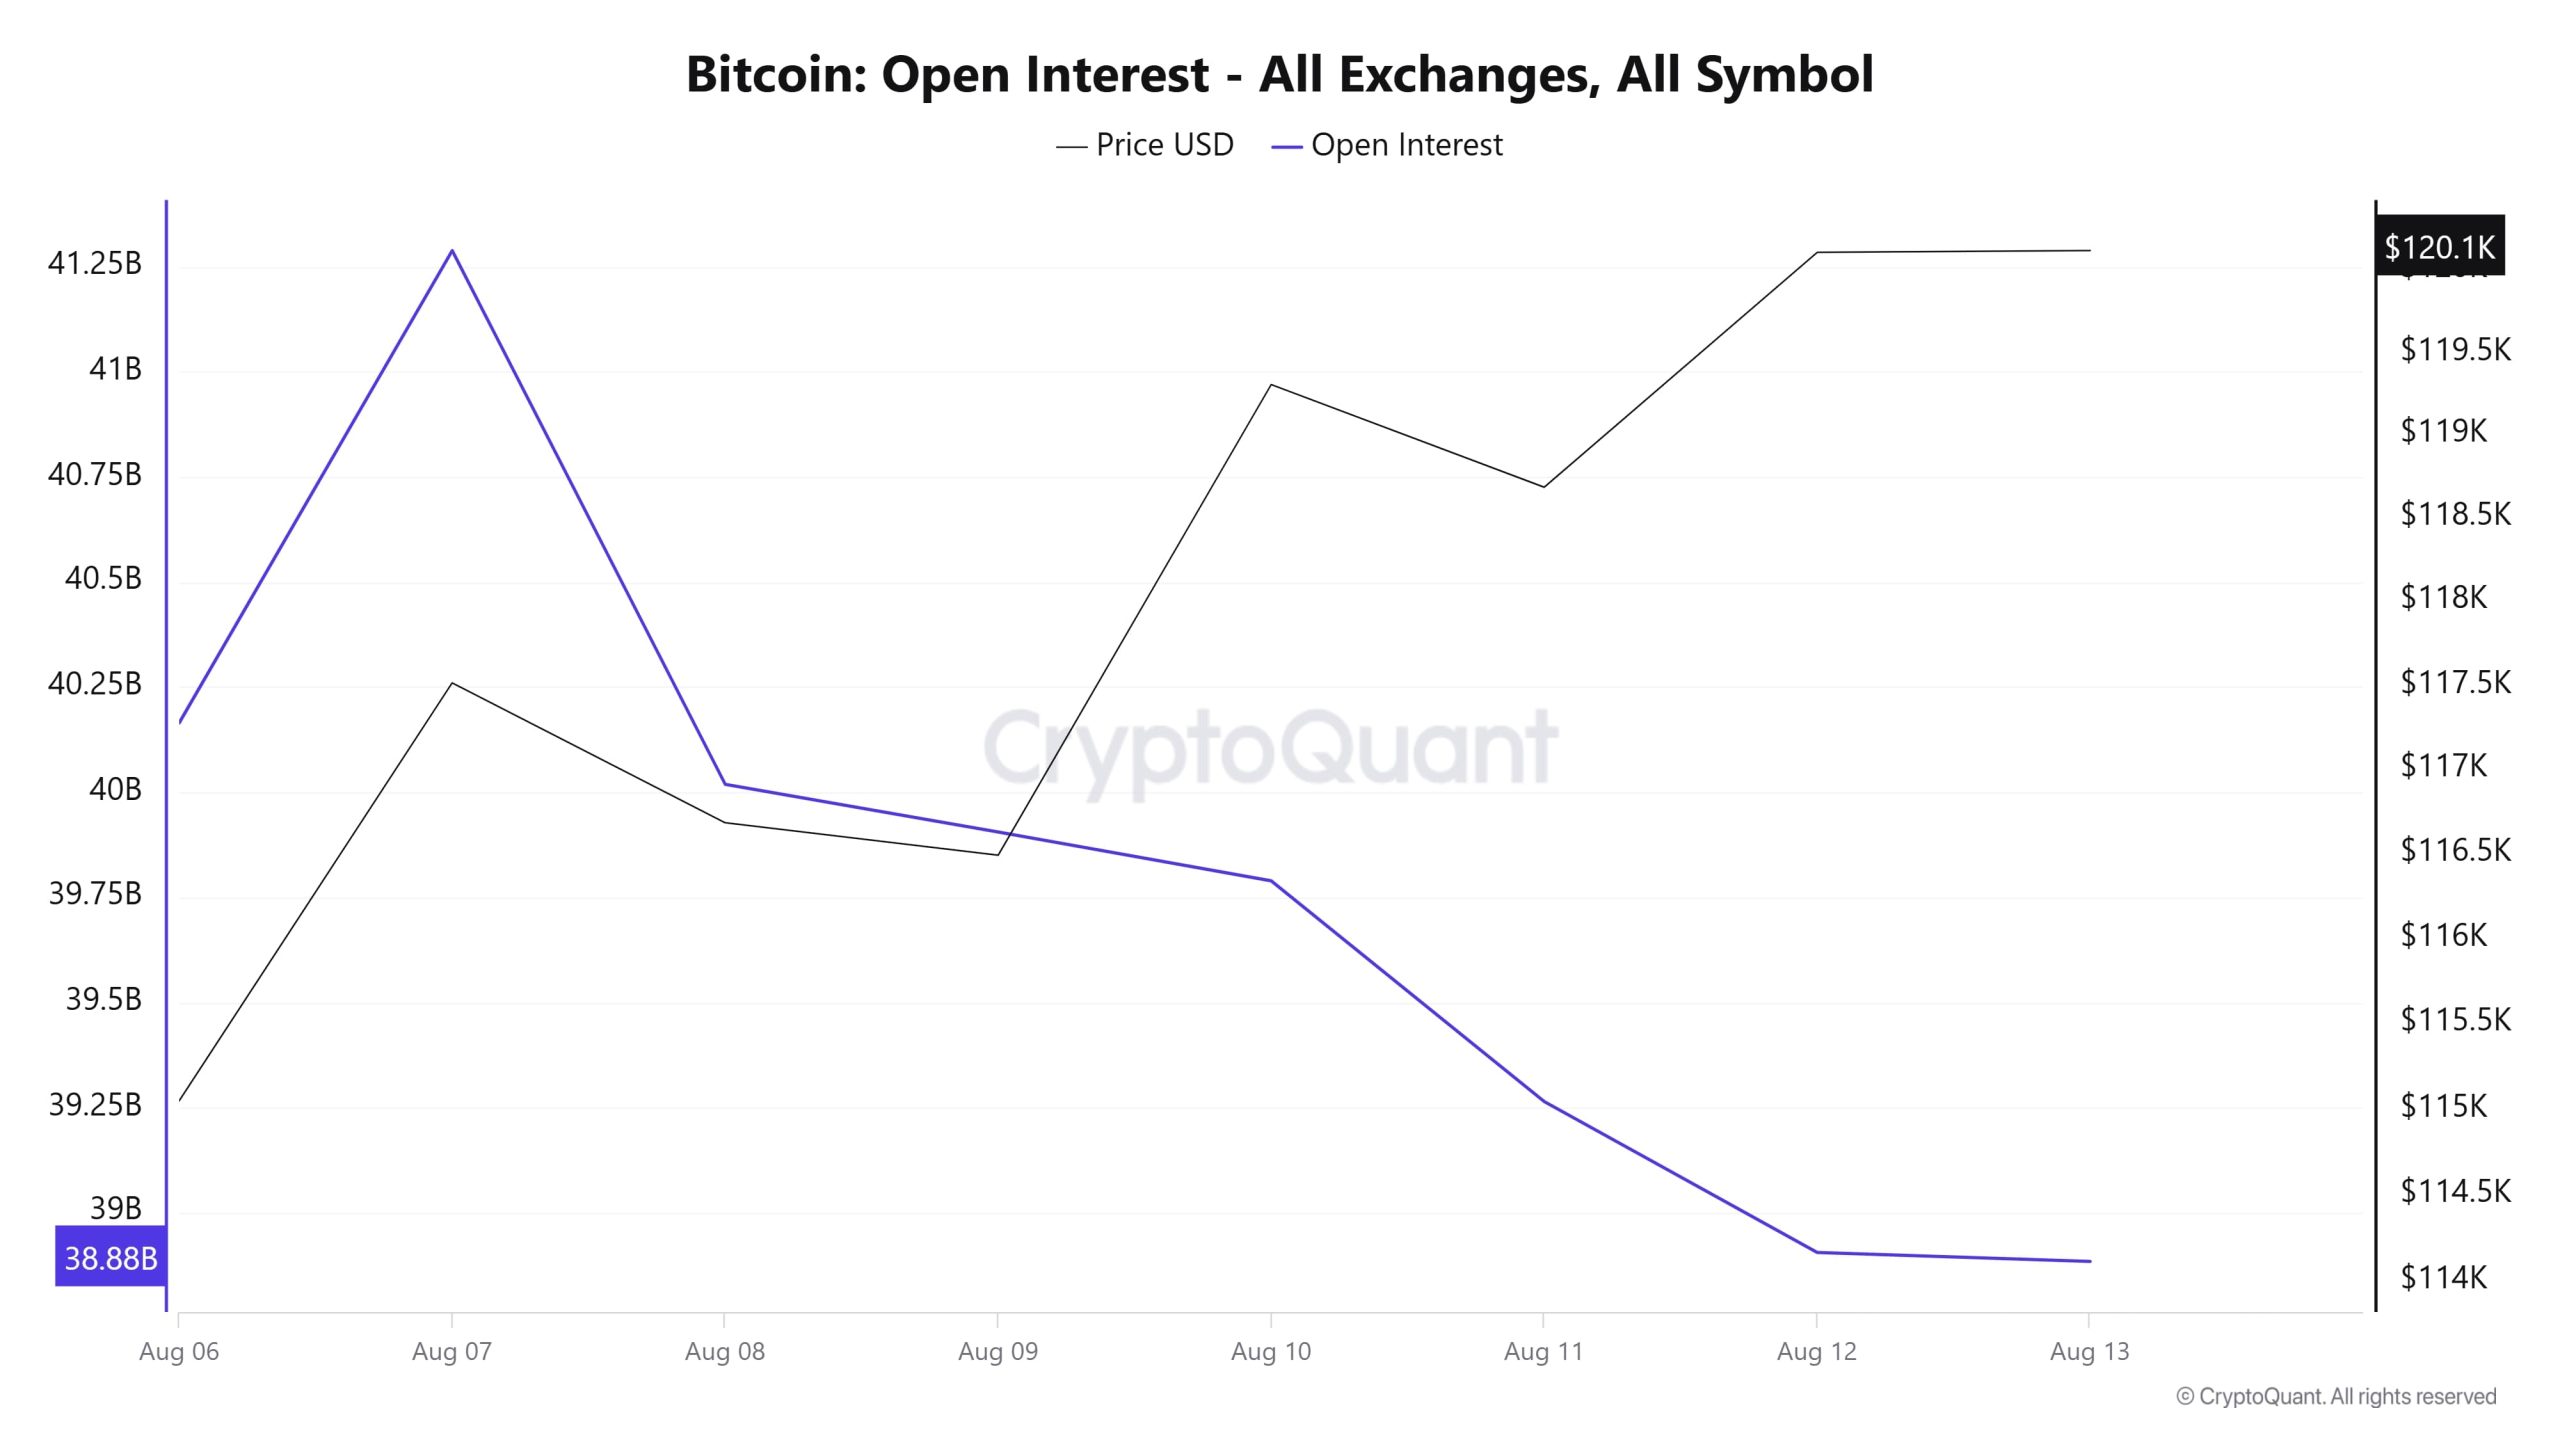
On August 6, open interest stood at around $40.2 billion, reaching a short-term peak of $41.25 billion el August 7. However, it then fell rapidly, dropping to $38.88 billion el August 13. On the price front, there was a noticeable increase from August 6 to August 7. After a small pullback, prices rose again between August 10 and 12, peaking at the 120,000 dollar level and maintaining this level. Thus, while the price continues its upward trend, the decline en open interest suggests that leveraged positions are being closed or traders are adopting a more cautious approach. This indicates that the rally is not driven por strong risk appetite, spot purchases are stronger, and the upward movement may have a more sustainable structure.
Funding Rate
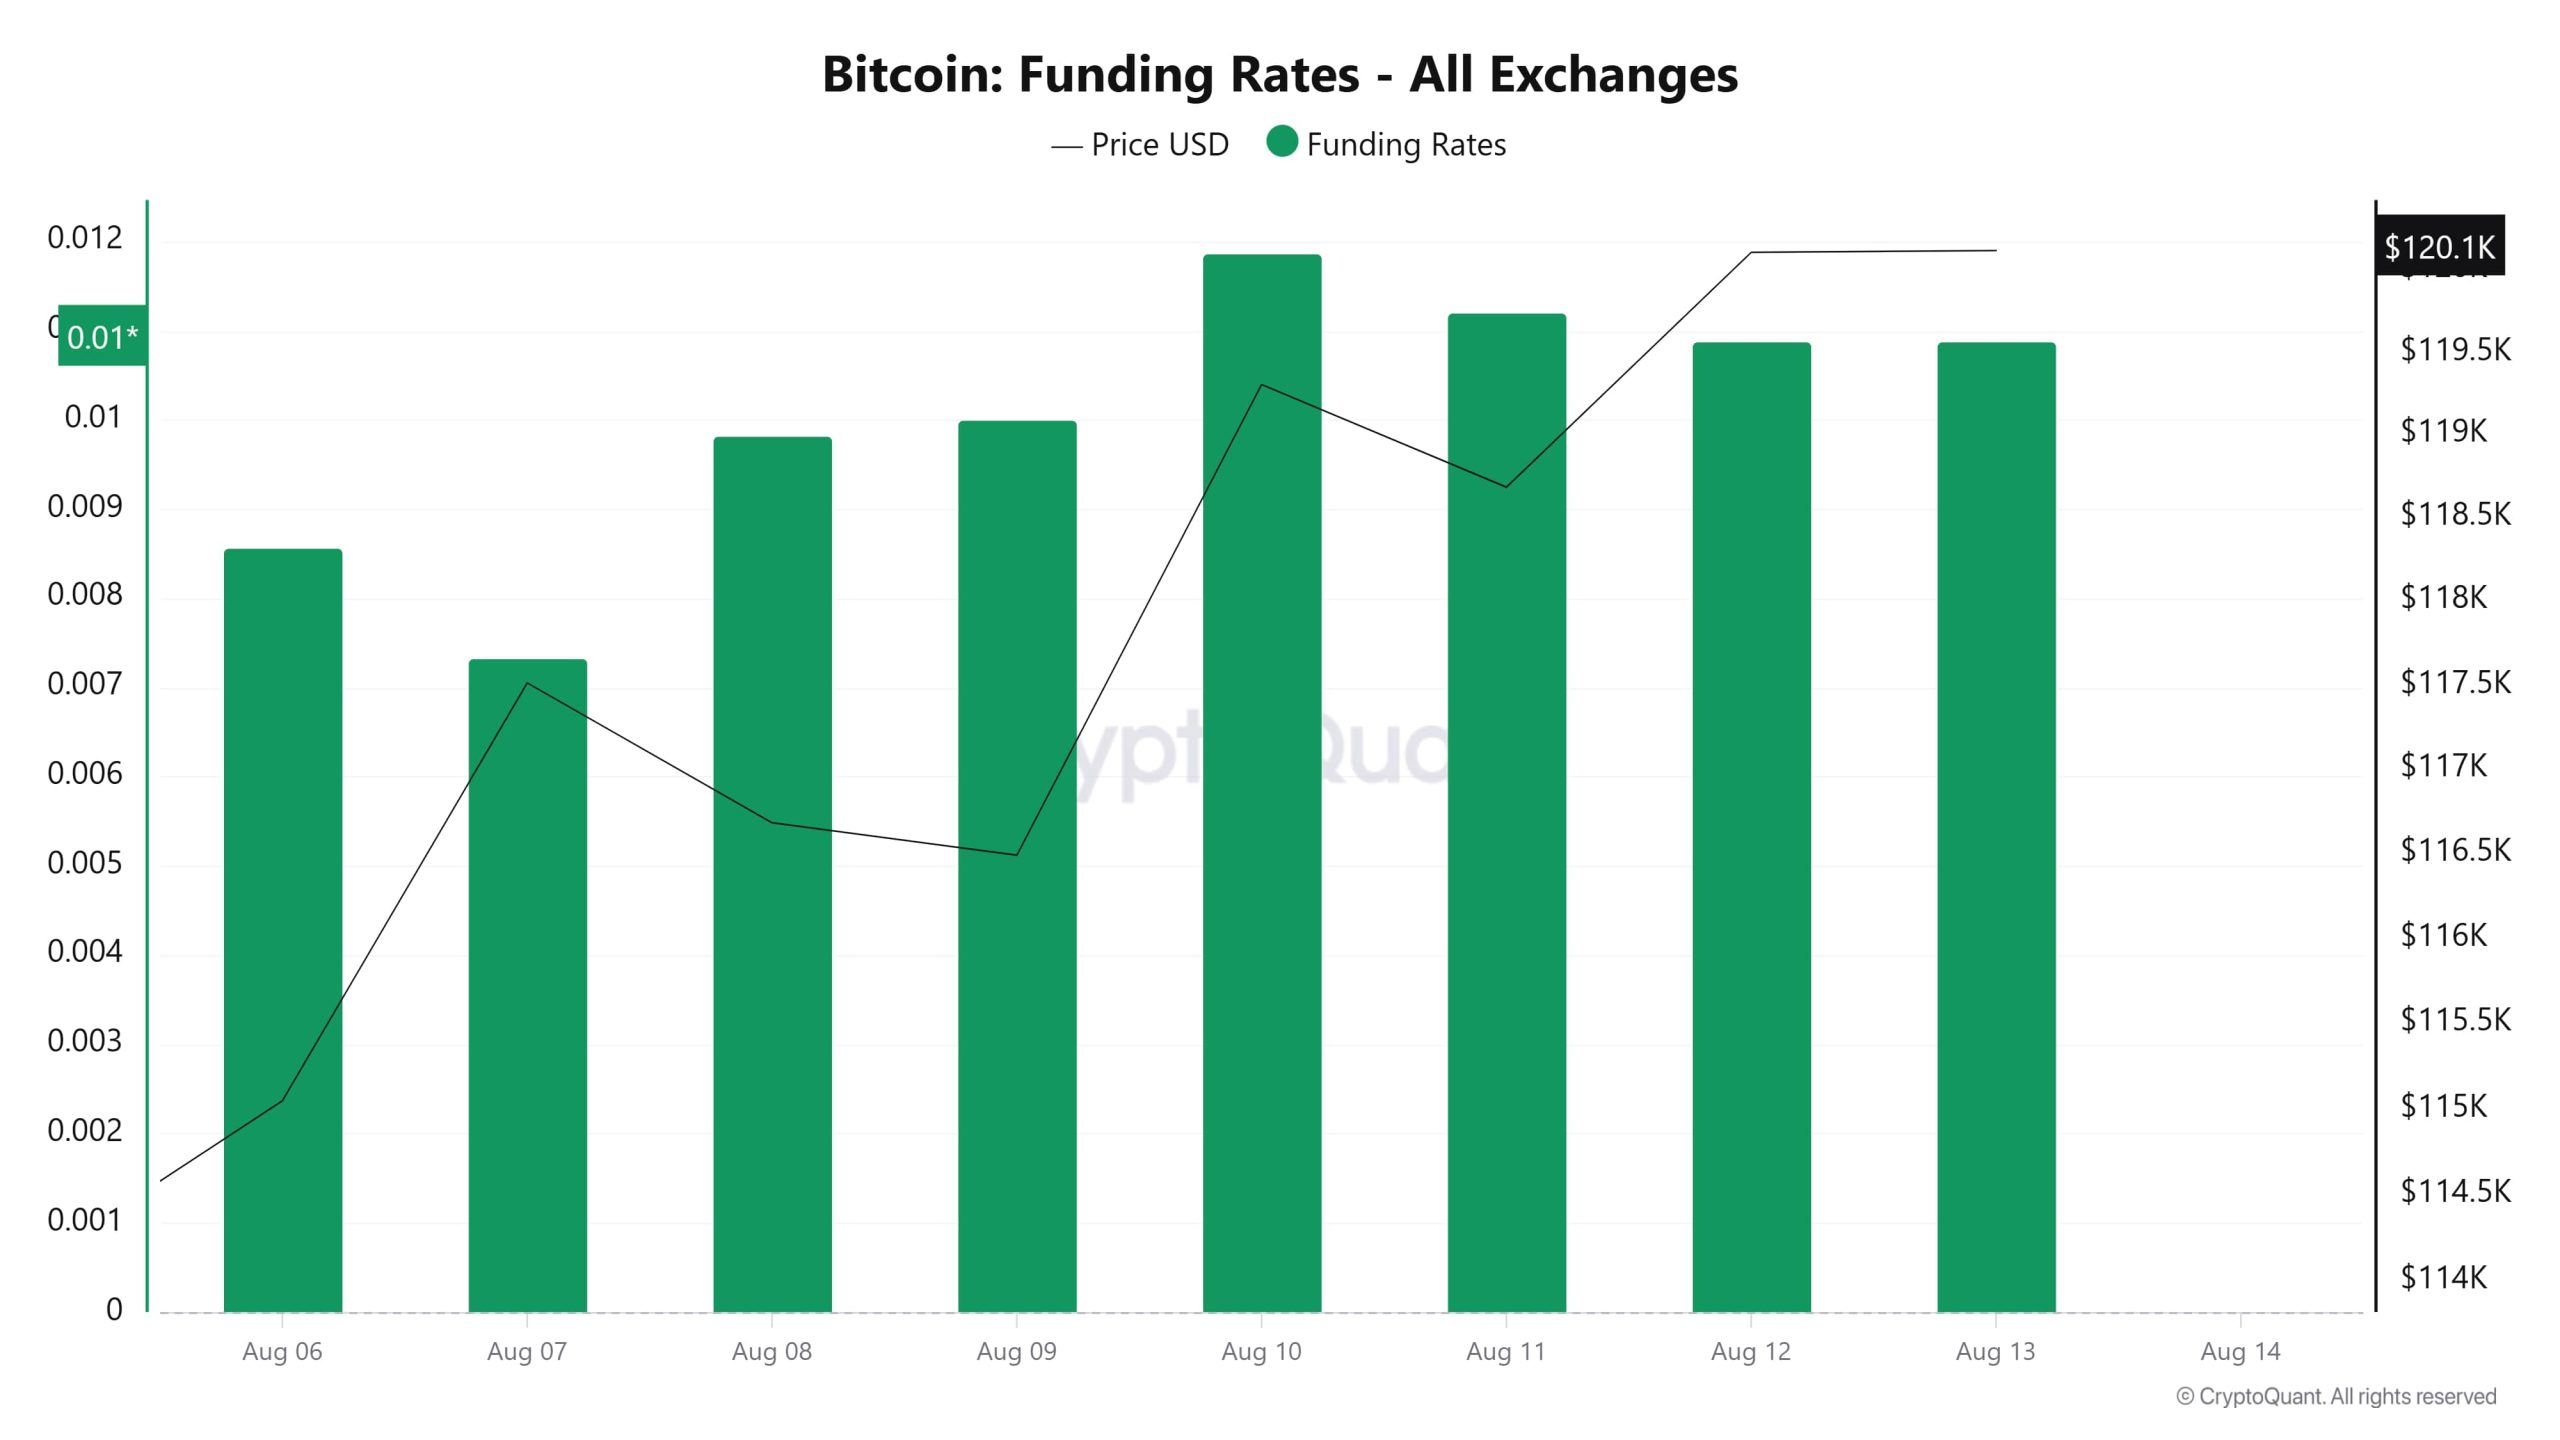
The funding rate, which started at around 0.008 el August 6, showed a slight decline el August 7 but rose again el August 8, approaching the 0.01 level. On August 10, it peaked at 0.012. Despite minor fluctuations en the following days, the rate remained at high levels. During this period, the Bitcoin price also entered a gradual upward trend starting from August 6 and reached a peak of 120,000 dollars el August 12-13. The generally positive and high funding rates indicate that long positions are dominant and the market has upward expectations. However, this situation also brings the risk of a potential correction due to the increase en leveraged long positions.
Long & Short Liquidations
Last week, as the BTC price rose from around $115,800 to above $120,000, short positions were primarily liquidated. $123 million en long positions and $383 million en short positions were liquidated.
| Date | Long Volume (Million $) | Short Volume (Million $) |
|---|---|---|
| August 6 | 4.91 | 21.94 |
| August 7 | 7.66 | 49.68 |
| August 8 | 9.53 | 12.75 |
| August 9 | 15.64 | June 30 |
| August 10 | 9.04 | 50.39 |
| August 11 | 64.46 | 194.11 |
| August 12 | 11.79 | 24.12 |
| Total | 123.03 | 383.05 |
Supply Distributi
Total Supply: Increased por approximately 0.0153% compared to last week, reaching 19,905,061 units.
New Supply: The amount of BTC produced this week was 3,056.
Velocity: The velocity, which was 12.60 last week, reached 12.48 as of August 11.
| Wallet Categoría | 04.08.2025 | 11.08.2025 | Change (%) |
|---|---|---|---|
| < 1 BTC | 8.4684 | 8.4626 | -0.0684 |
| 1 – 10 BTC | 11.3965 | 11.3872 | -0.0814 |
| 10 – 100 BTC | 24.6801 | 24.6512 | -0.1169 |
| 100 – 1k BTC | 29.4256 | 29.4564 | 0.1046 |
| 1k – 10k BTC | 18.1981 | 18.2239 | 0.1418 |
| 10k+ BTC | 7.8372 | 7.8182 | -0.2420 |
According to the latest weekly data, the Bitcoin wallet distribution shows a balanced but mixed picture. Wallets holding less than 1 BTC saw a slight decline of 0.068%, while wallets en the 1–10 BTC range experienced a small decrease of 0.081%. The 10–100 BTC category, representing larger investors, saw a 0.117% decline, while the 100–1,000 BTC range recorded a limited increase of 0.105%. Wallets en the 1,000–10,000 BTC group saw a 0.142% increase, while wallets en the 10,000 BTC and above category, representing the largest investor group, recorded a notable 0.242% decline.
Exchange Supply Ratio
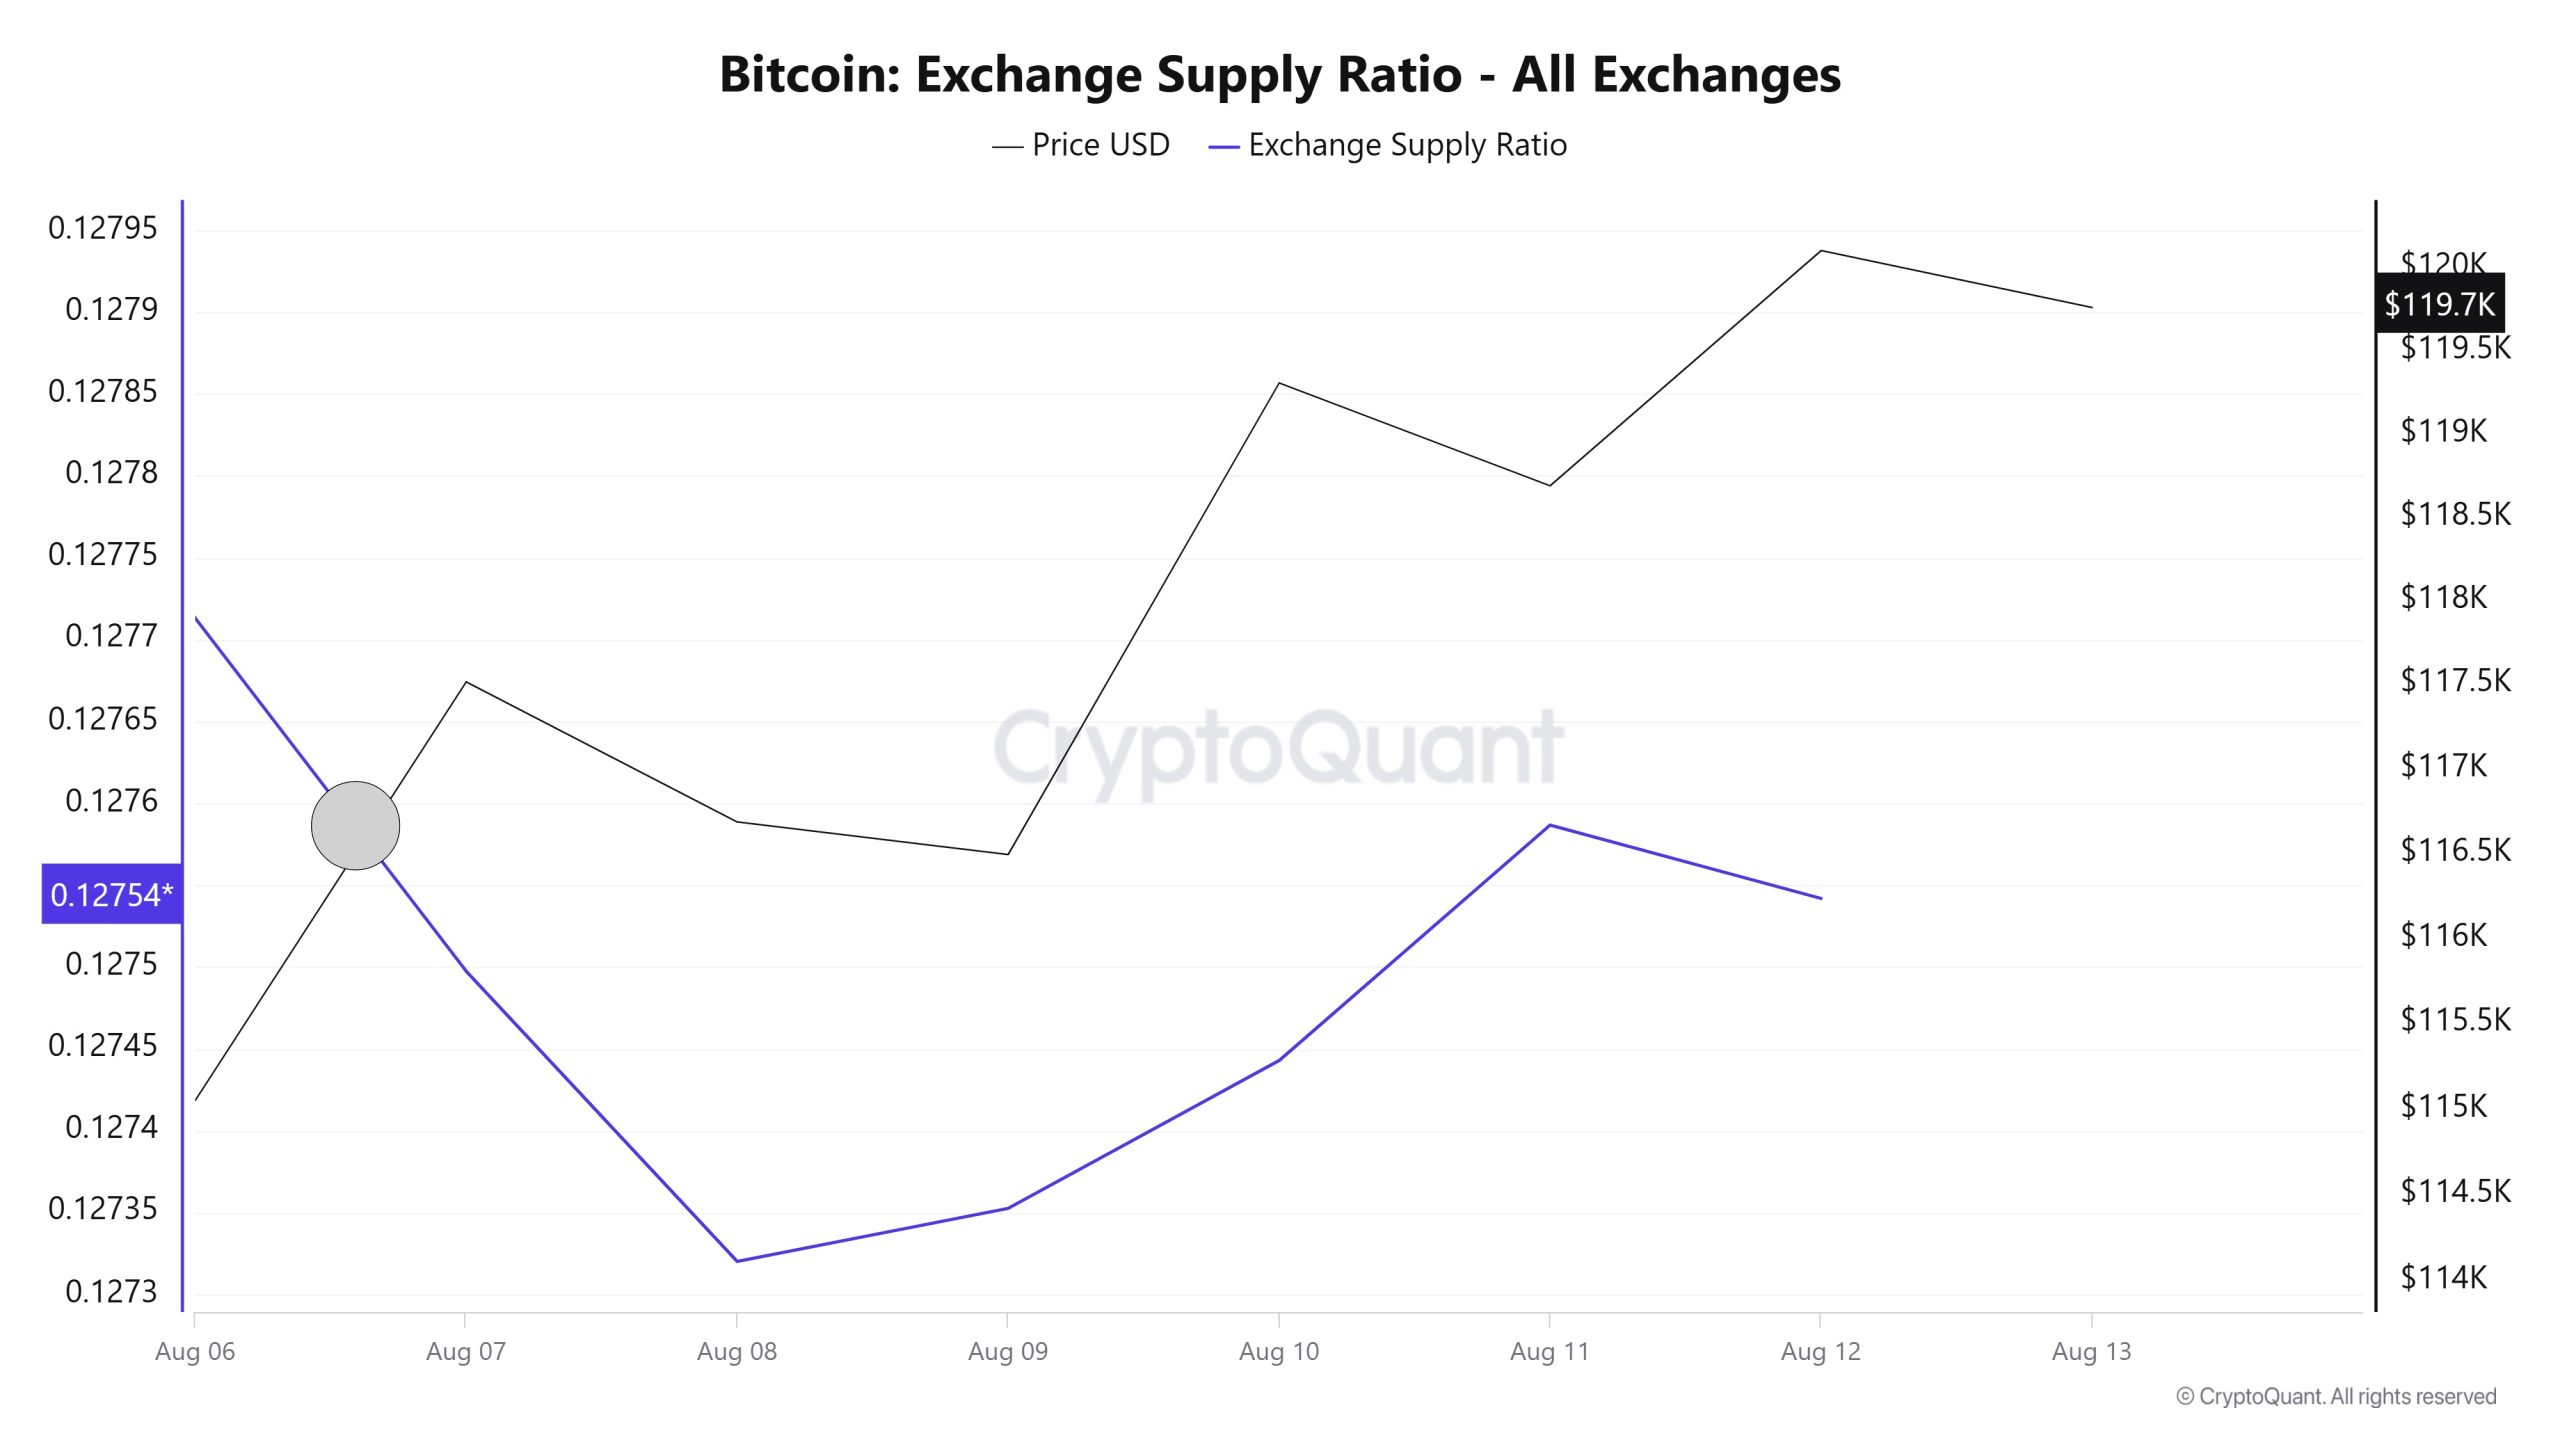
According to data from the Bitcoin Exchange Supply Ratio table, which shows the proportion of Bitcoin held el exchanges relative to the total supply, high figures were observed this week. This week’s data reveals that the general trend is for a positive correlation between the Bitcoin price and the proportion of supply entering exchanges, as highlighted en this . This indicates that most Bitcoin is held en wallets and is not ready for sale en the market.
Between August 6 and 13, the Bitcoin Exchange Supply Ratio increased from 0.12749744 to 0.12754182. During this period, the Bitcoin price rose from $113,620 to $123,315. Notably, el August 7, at the point where the price and Exchange Supply Ratio intersected, while the price continued to rise, there was a significant decline en the Exchange Supply Ratio. This suggests that despite the price increase, the amount of Bitcoin being supplied to exchanges decreased, likely indicating that long-term investors are continuing to hold onto their assets. A general upward trend en Bitcoin prices is observed.
Fees and Revenues
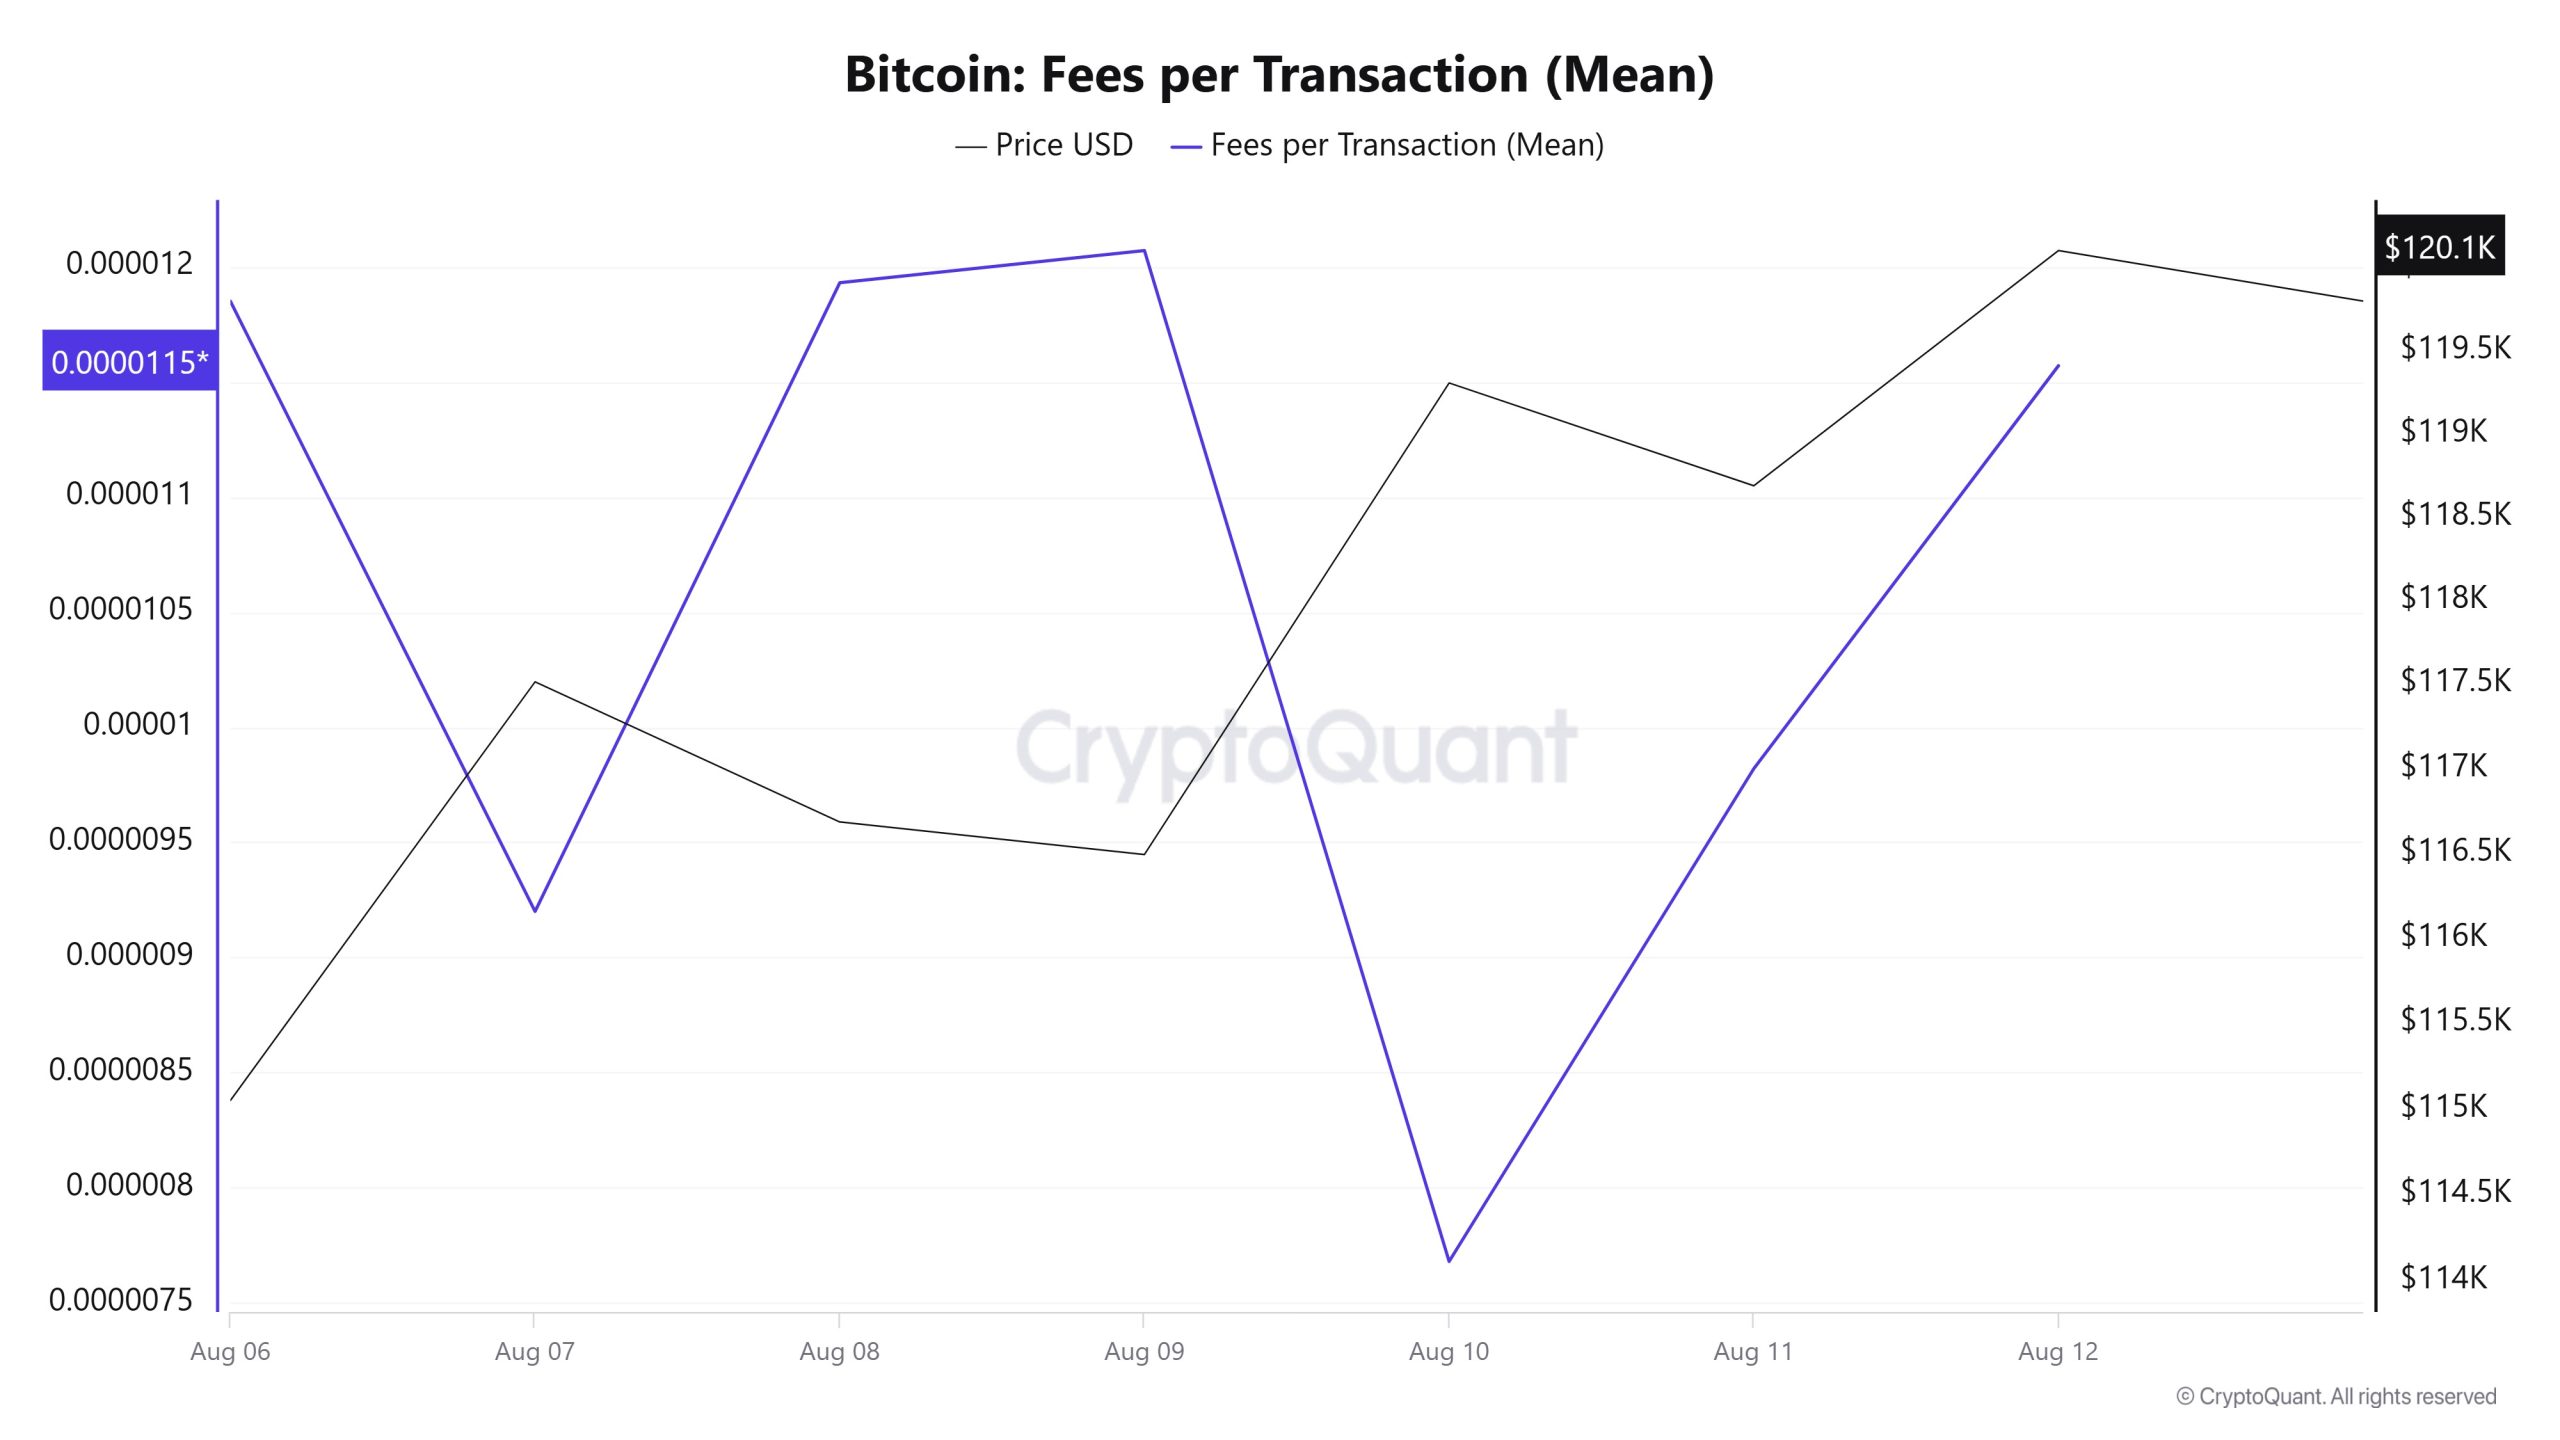
When examining the Bitcoin Fees per Transaction (Mean) data for the period between August 6 and 12, it is observed that the indicator reached 0.00001185 el August 6, the first day of the week.
This value, which reached its peak el August 9, followed a fluctuating trend until that date due to the volatile movements en Bitcoin prices. On August 10, it dropped to 0.00000768, recording the week’s lowest value.
In the following days, the Bitcoin Fees per Transaction (Mean) indicator resumed an upward trend and closed at 0.00001157 el August 12, the last day of the week.
Bitcoin: Fees (Total)
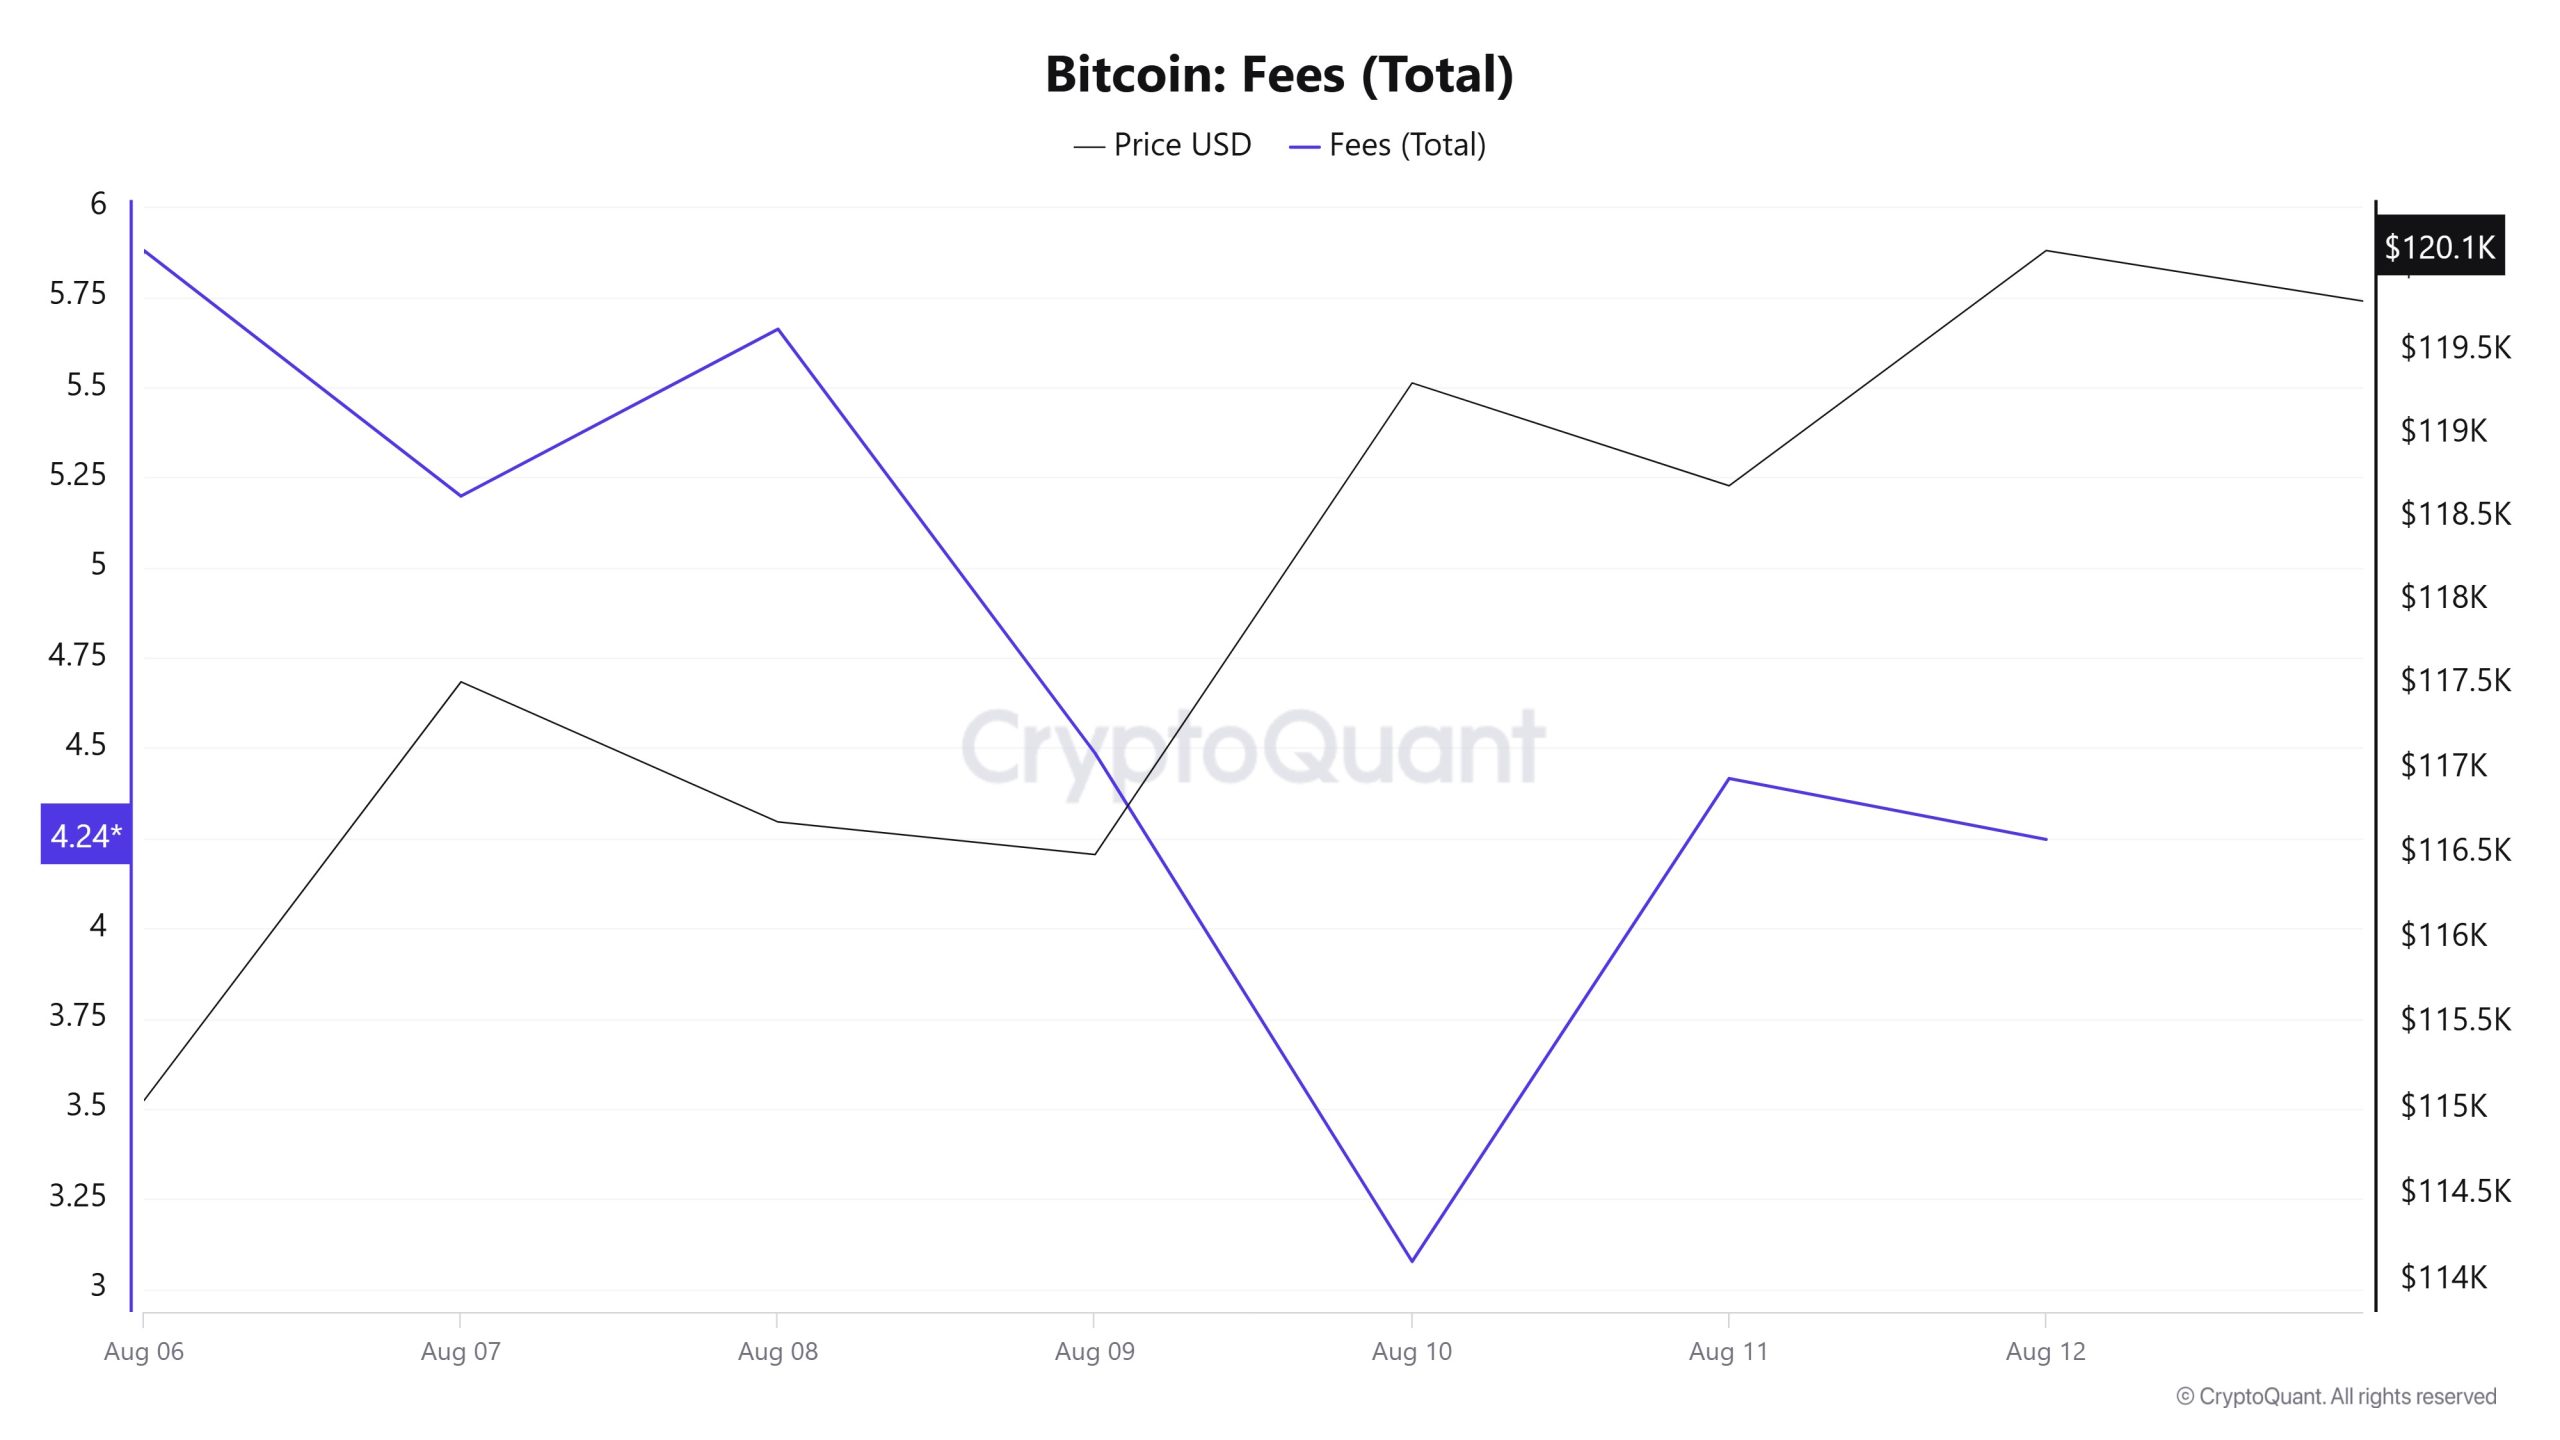
Similarly, when examining the Bitcoin Fees (Total) data between August 6 and 12, it is observed that this indicator reached 5.8791241 el August 6, the first day of the week.
The value, which reached its peak el August 6, showed a fluctuating trend due to the volatile movements en the Bitcoin price after that date, reaching 3.07651493 el August 10, the lowest level of the week.
In the following days, Bitcoin Fees (Total) resumed its upward trend and closed at 4.24654205 el August 12, the last day of the week.
Miner Flows
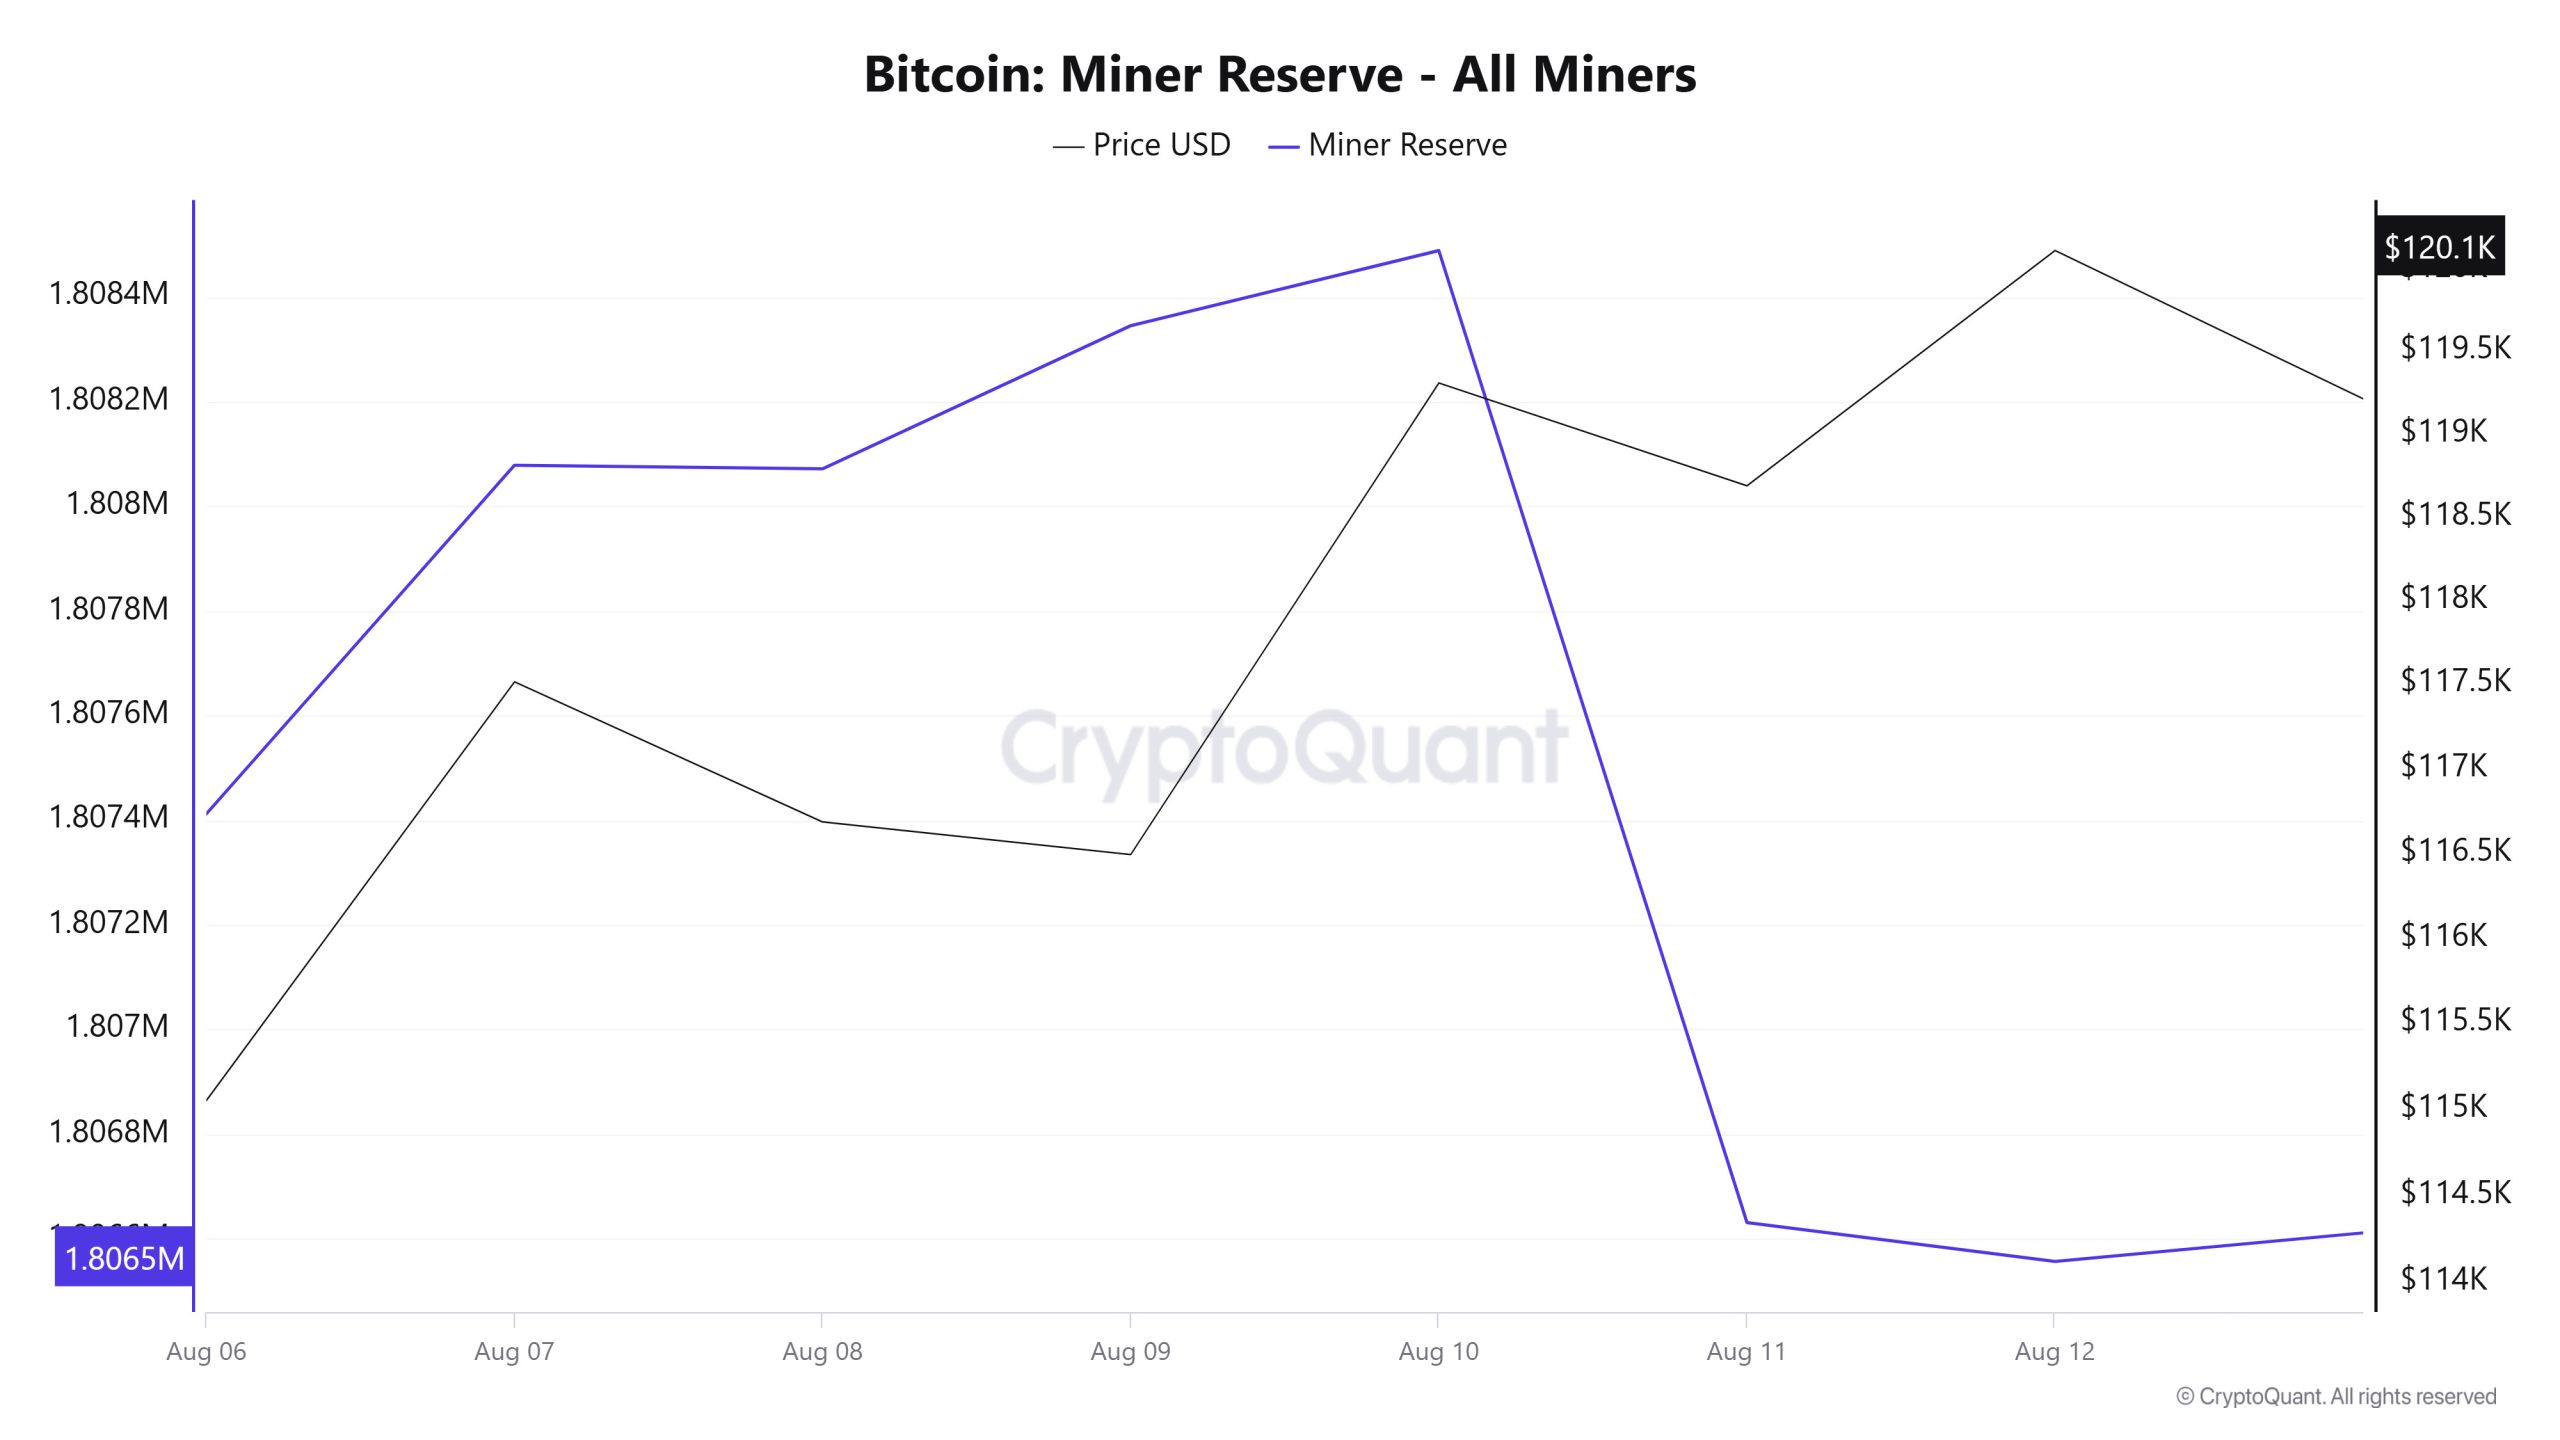
According to data obtained from the Miner Reserve table, a decrease en Bitcoin reserves held en miners’ wallets was observed this week. A time-dependent correlation structure was observed between the Bitcoin price and miner reserve during the analyzed time period. However, the general trend indicates that a positive correlation between these two variables is dominant.
Miner Inflow, Outflow, and Netflow
Between August 6 and 12, 40,359 Bitcoin were withdrawn from miners’ wallets, while 39,745 Bitcoin were deposited into miners’ wallets during the same period. This week’s Miner Netflow was -614 Bitcoin. During this period, the Bitcoin price was $115,048 el August 6 and $120,108 el August 12.
Throughout the week, Bitcoin inflows into miner wallets (Miner Inflow) were less than Bitcoin outflows from miner wallets (Miner Outflow), resulting en a negative net flow (Miner Netflow).
| Date | Miner Inflow | Miner Outflow | Miner Netflow |
|---|---|---|---|
| August 6 | 3,708.21 | 3,467.00 | 241.21 |
| August 7 | 5,006.98 | 4,340.55 | 666.43 |
| August 8 | 5,264.14 | 5,270.91 | -6.77 |
| August 9 | 3,975.57 | 3,702.12 | 273.45 |
| August 10 | 5,143.79 | 5,000.20 | 143.60 |
| August 11 | 11,608.27 | 13,466.18 | -1,857.91 |
| August 12 | 5,038.09 | 5,112.34 | -74.24 |
Transaction
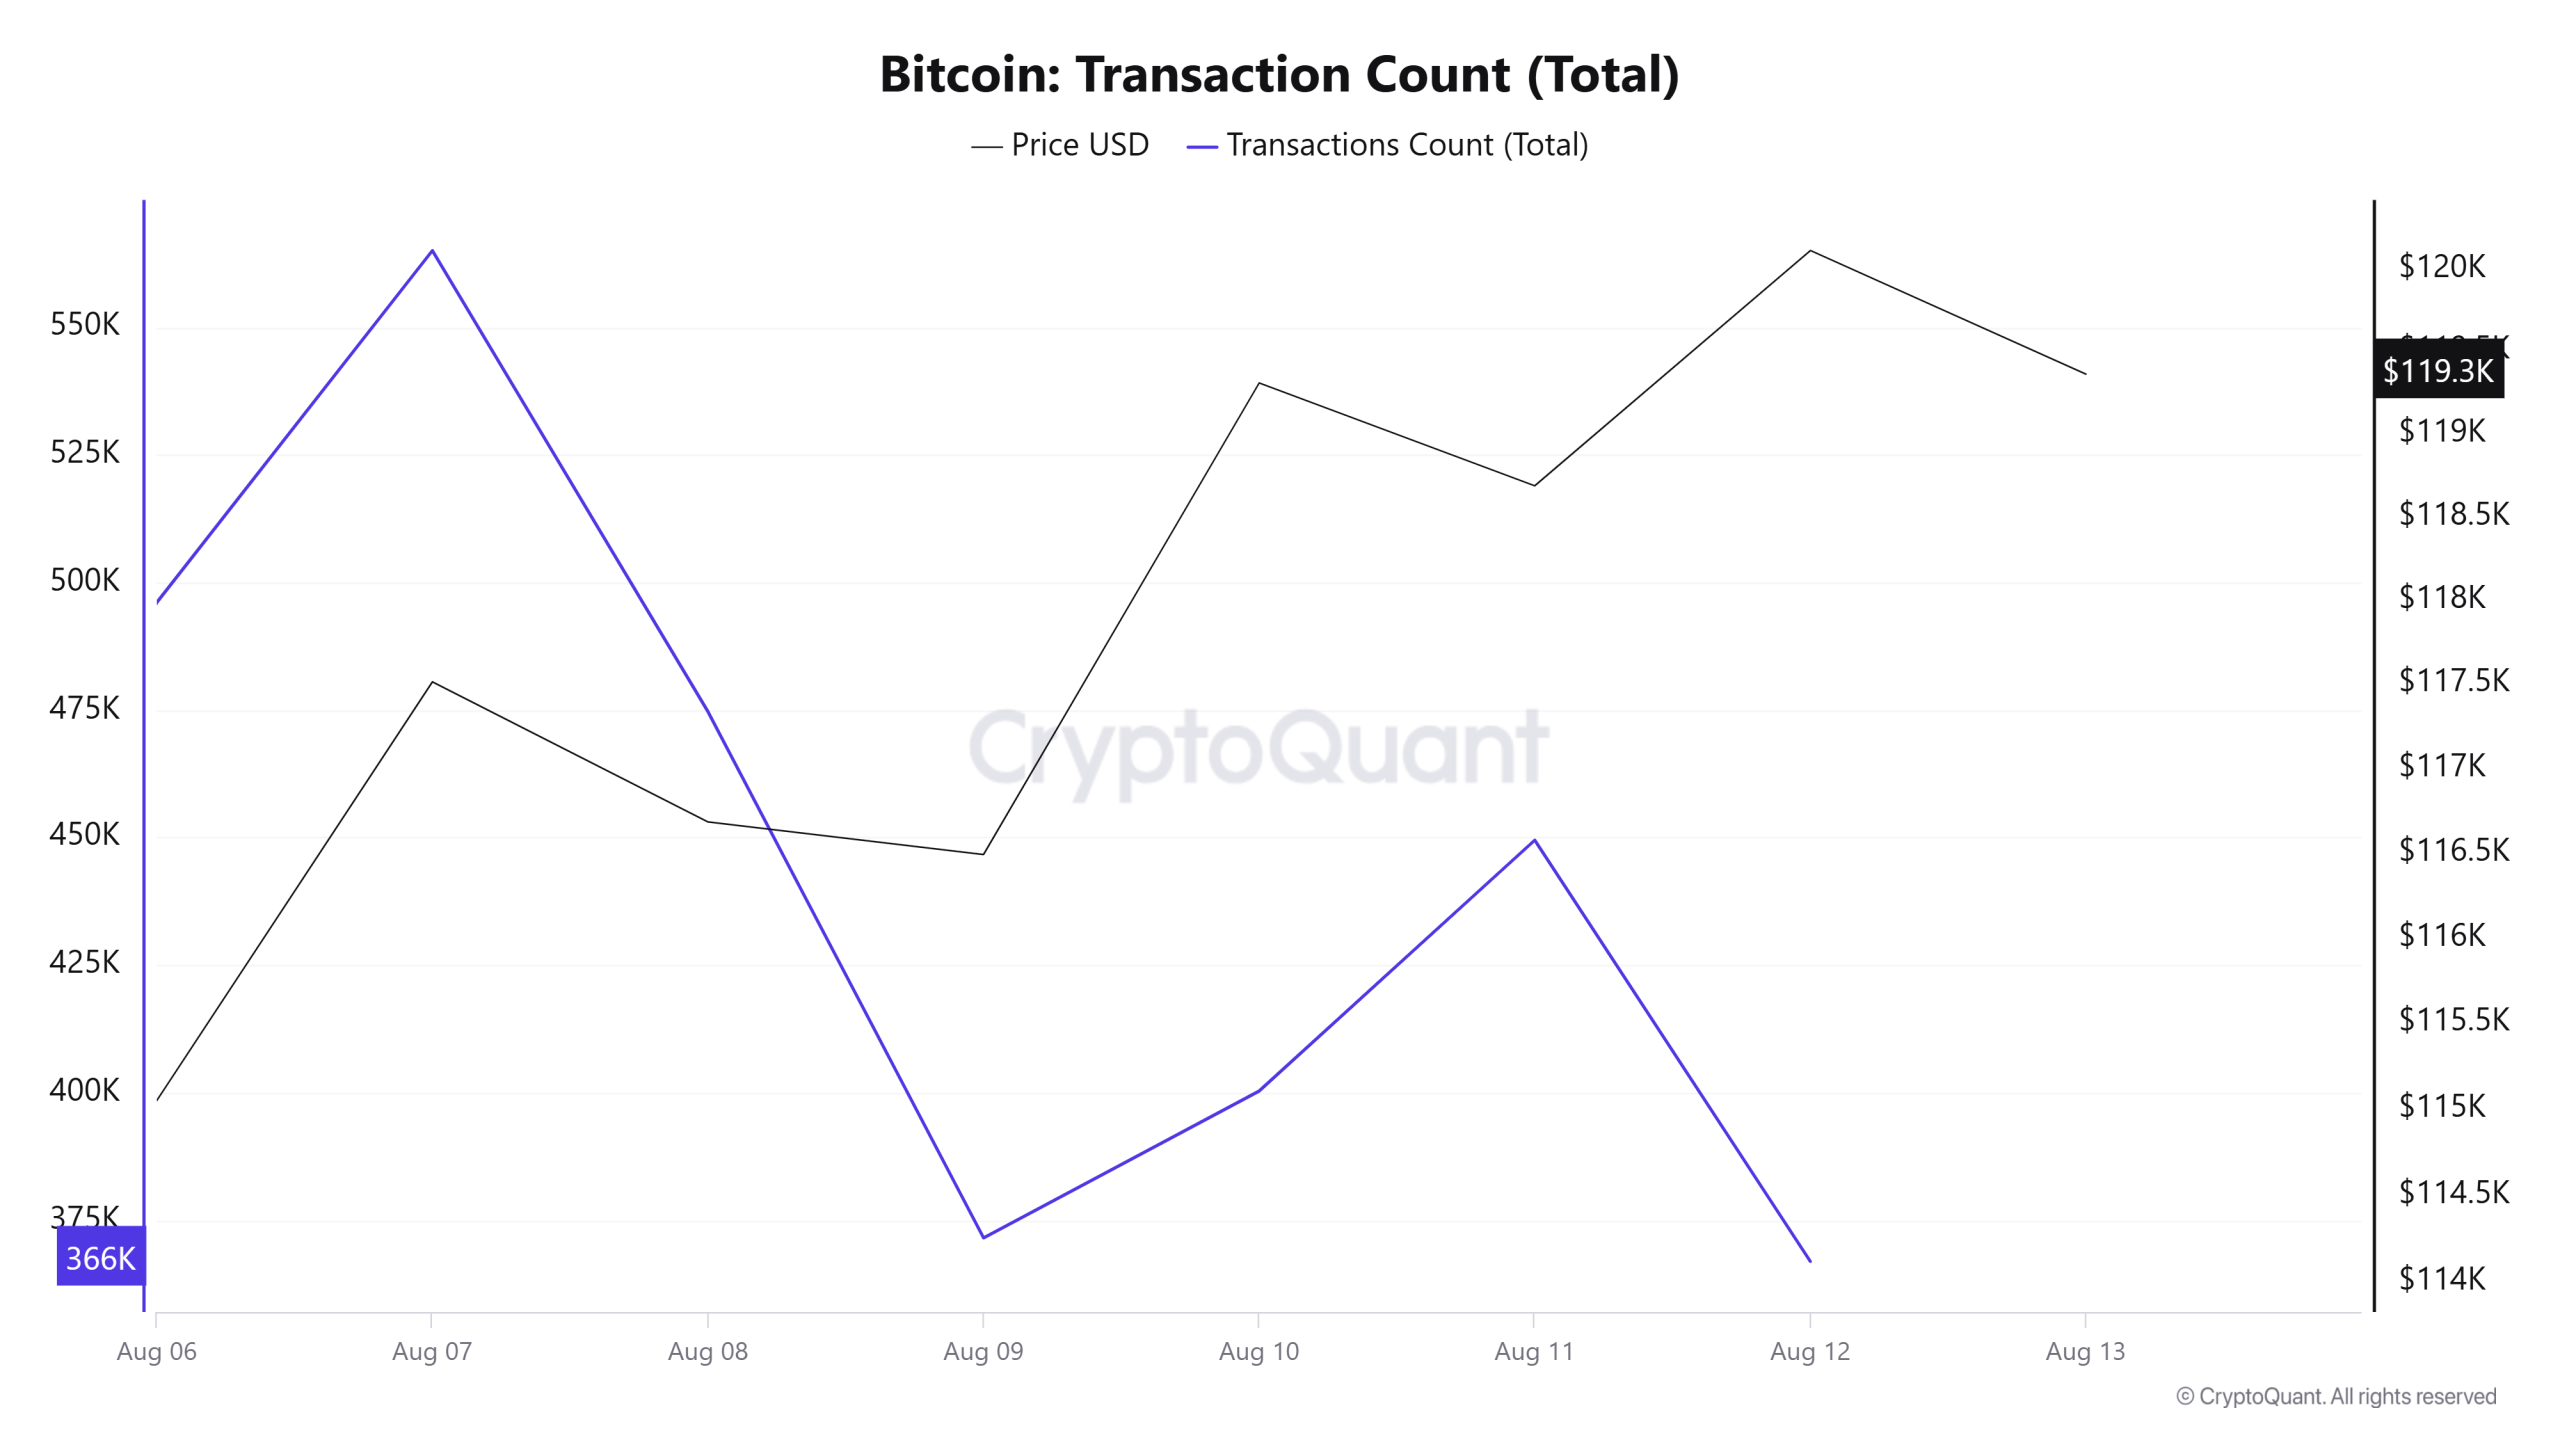
While 2,755,804 transactions were made el the Bitcoin network last week, this week saw an increase of approximately 13.36% to 3,124,043. The 565,039 transactions recorded el August 7 constituted the highest transaction volume of the week, while the lowest number of transactions was 366,926 el August 12.
There was a sharp rise en the first half of the period (August 6–7), followed por a rapid decline (August 8–9). Although there was a recovery el August 10–11, the decline continued, indicating that the number of transactions gained momentum again but remained limited.
When examining the weekly trend, the increase en network activity compared to the previous week presents a positive outlook, but the fluctuating decline en the number of transactions during the week indicates that stability could not be maintained. On the other hand, the sharp ups and downs provide a more unclear picture regarding a clear direction. In short, since the high tempo at the beginning of the week could not be maintained, the sustainability signal for the coming week is weak, but the potential is still there.
Tokens Transferred
Last week, 4,198,224 BTC was transferred, while this week it increased por 0.18% to reach 4,205,795 BTC. The highest daily transfer volume was recorded el August 11 with 751,205 BTC, while the lowest was el August 9 with 437,625 BTC. This significant fluctuation indicates high daily volatility despite a stable weekly volume. While the market has gained slight momentum, volatility remains high and directionless. Large transfer fluctuations signal position changes; volume increase is critical for a clear trend.
Whale Activities
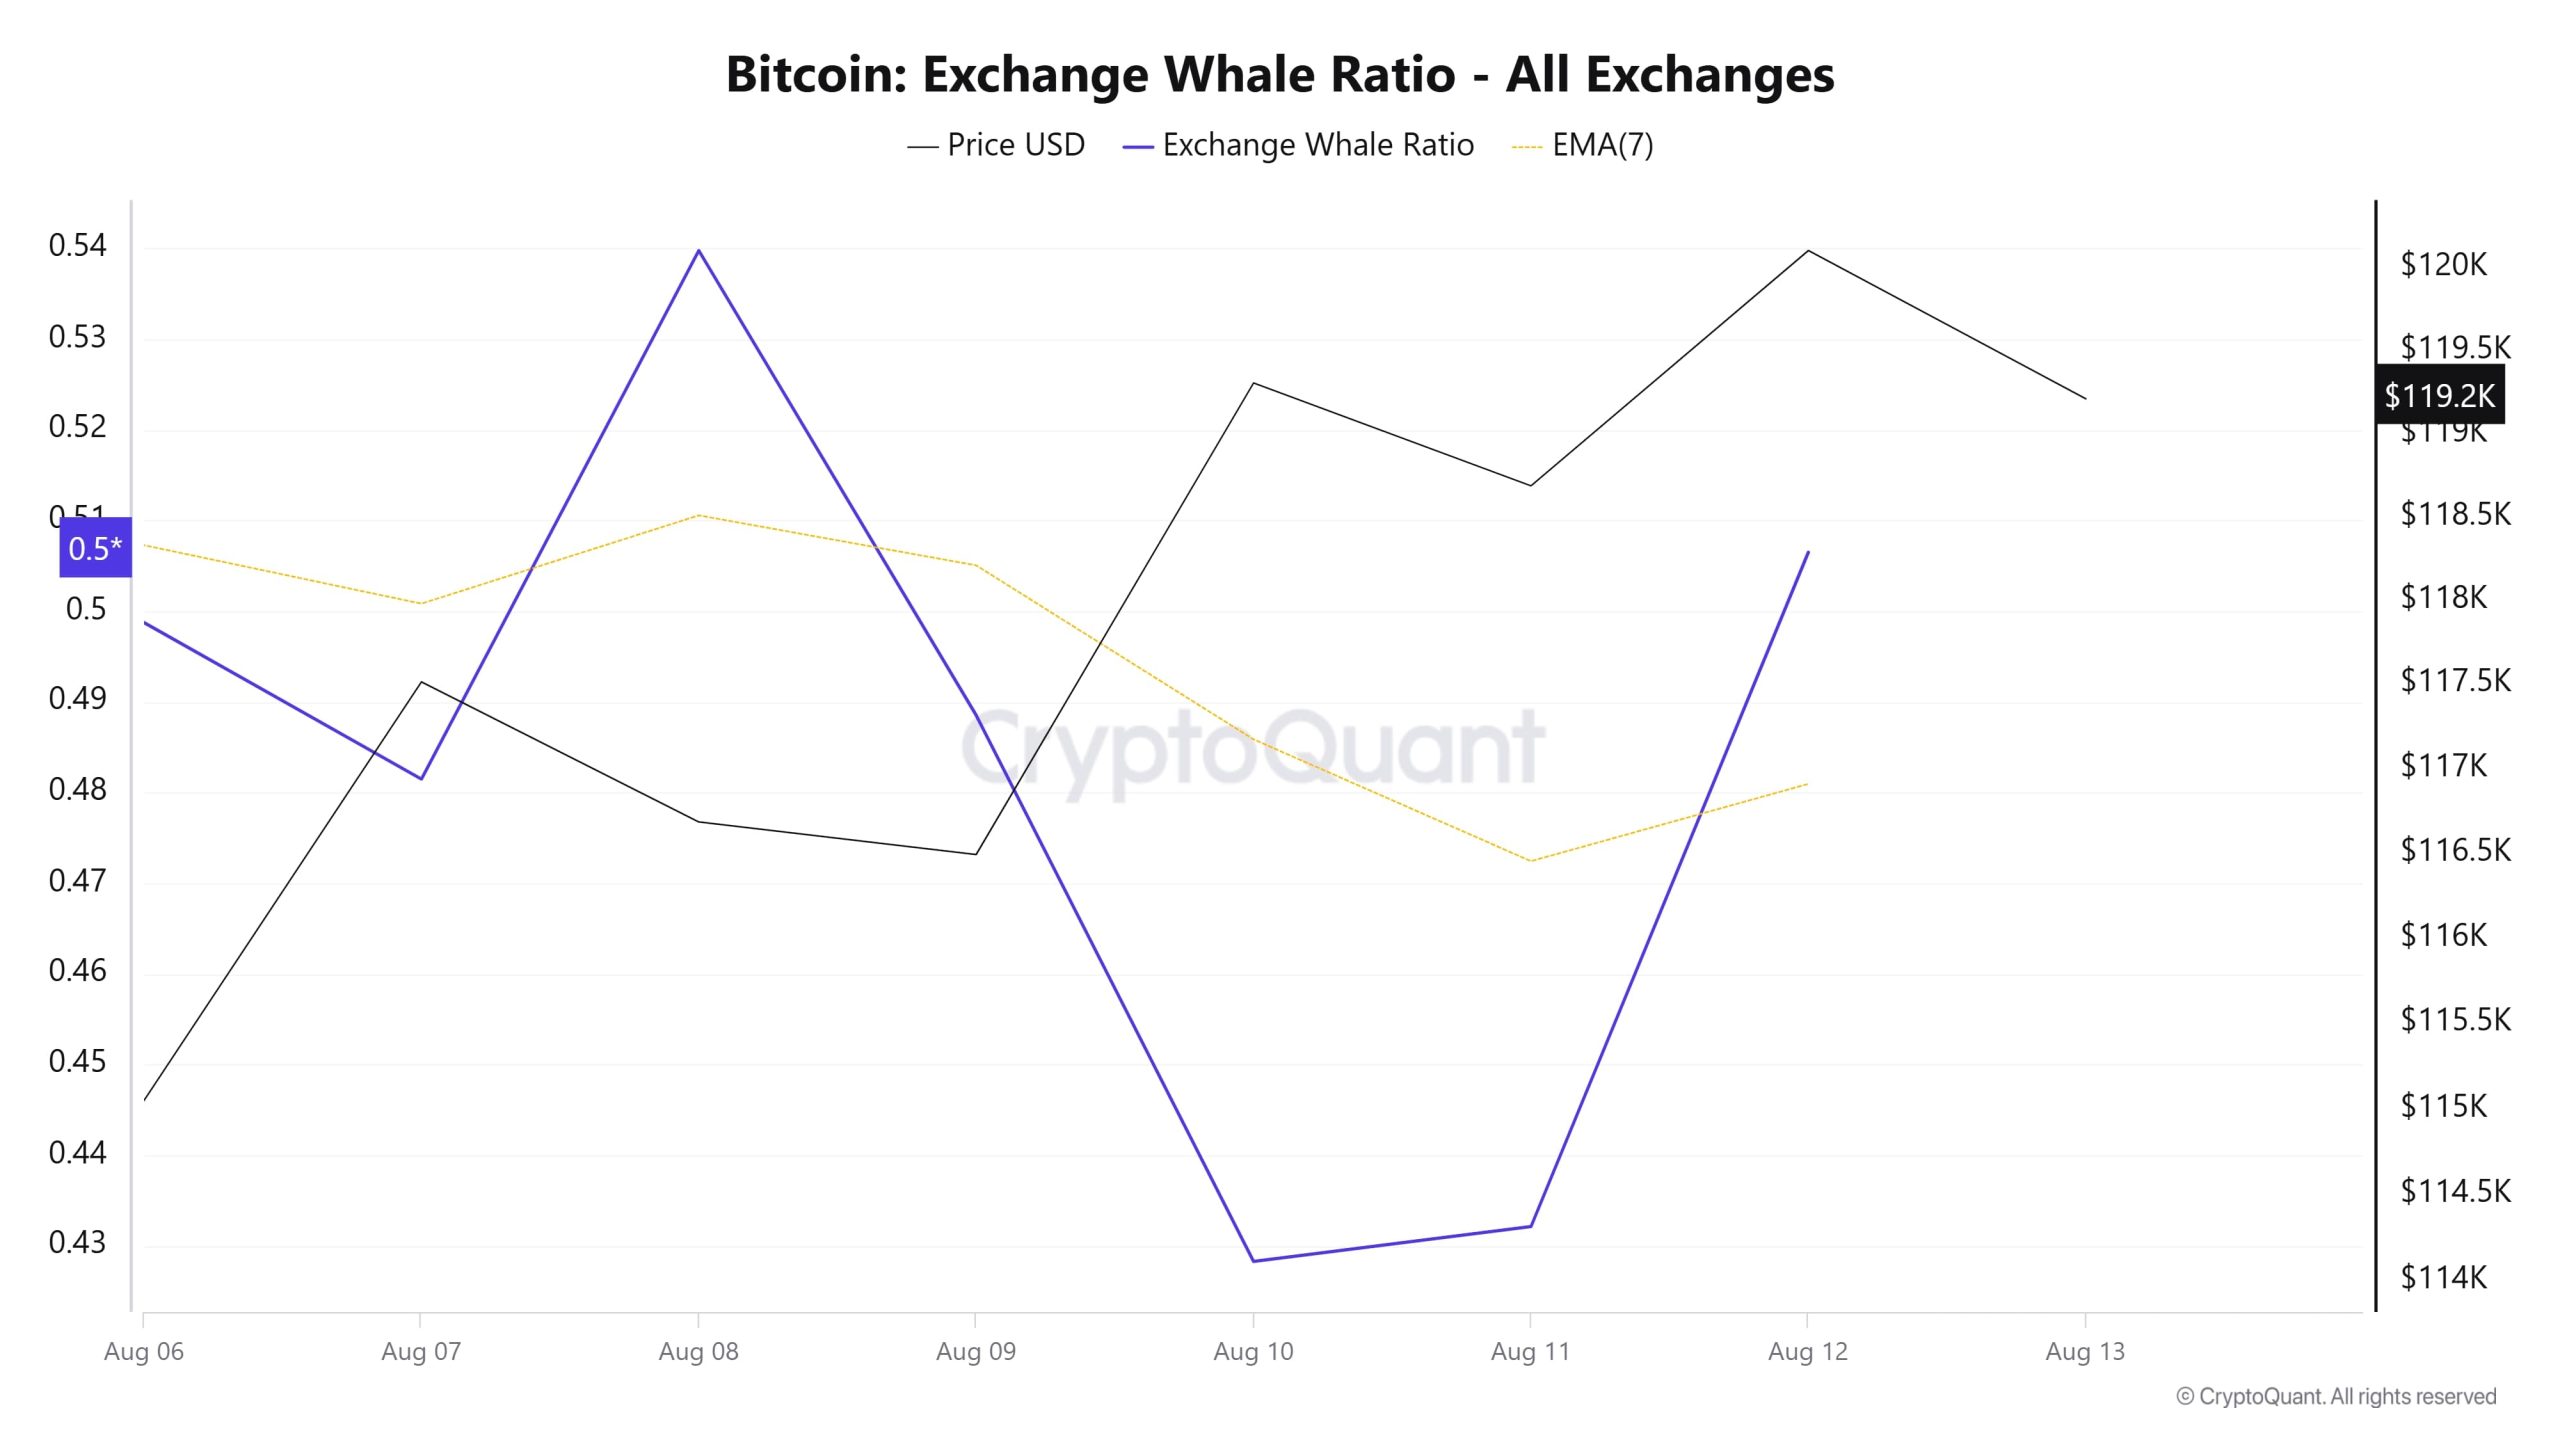
Whale Data
According to data from the cryptocurrency market over the last 7 days, whale activity el centralized exchanges has been volatile throughout the process. Looking at the Exchange Whale Ratio metric, el August 6, the first day of the 7-day period, the ratio of whales using centralized exchanges was 0.498. The peak of the process occurred el August 8, reaching a value of 0.539. When this ratio is above 0.35, it generally indicates that whales are frequently using centralized exchanges. On August 10, the metric reached its lowest value at 0.428. As of now, the metric remains at 0.506, continuing to stay en the middle of the process. BTC has been stuck en the 113,000 to 122,000 range during this period. This suggests that whales or institutional investors are using centralized exchanges to set the direction, but market dynamics are causing competition to continue within a narrow band, indicating that the price is consolidating. Additionally, the total number of BTC transfers remained consistent with the previous week, with 4,205,795 BTC en motion. Looking at the data, addresses holding between 100 and 1,000 BTC continued to grow compared to the previous week and reached a record high. With 15,851 addresses, this is the highest number of addresses recorded to date. This indicates that smaller players, excluding whales and institutional investors, are also active en the market. In conclusion, this shows a balanced struggle between bulls and bears, with BTC trading within a narrow range, and it may remain within this range as long as the balance does not shift.
BTC Onchain Overall
| Metric | Positive 📈 | Negative 📉 | Neutral ➖ |
|---|---|---|---|
| Active Addresses | ✓ | ||
| Breakdowns | ✓ | ||
| Derivatives | ✓ | ||
| Supply Distribution | ✓ | ||
| Exchange Supply Ratio | ✓ | ||
| Fees and Revenues | ✓ | ||
| Miner Flows | ✓ | ||
| Transactions | ✓ | ||
| Whale Activities | ✓ |
The metrics and directions indicated en the table do not alone explain or imply any future changes en the price of any asset. The prices of digital assets may vary depending el many different variables. The el-chain analysis and related guidance provided are intended to assist investors en their decision-making process and should not be relied upon as the sole basis for financial investment decisions. Relying solely el this analysis may result en unfavorable outcomes. Even if all metrics produce positive, negative, or neutral results simultaneously, the expected outcomes may not materialize due to market conditions. Investors reviewing this report are advised to take these warnings into consideration.
Legal Notice
The investment information, comments, and recommendations contained en this document do not constitute investment advisory services. Investment advisory services are provided por authorized institutions el a personal basis, taking into account the risk and return preferences of individuals. The comments and recommendations contained en this document are of a general nature. These recommendations may not be suitable for your financial situation and risk and return preferences. Therefore, making an investment decision based solely el the information contained en this document may not result en outcomes that align with your expectations.
NOTE: All data used en Bitcoin el-chain analysis is based el Cryptoqaunt.
