Weekly Bitcoin Onchain Report
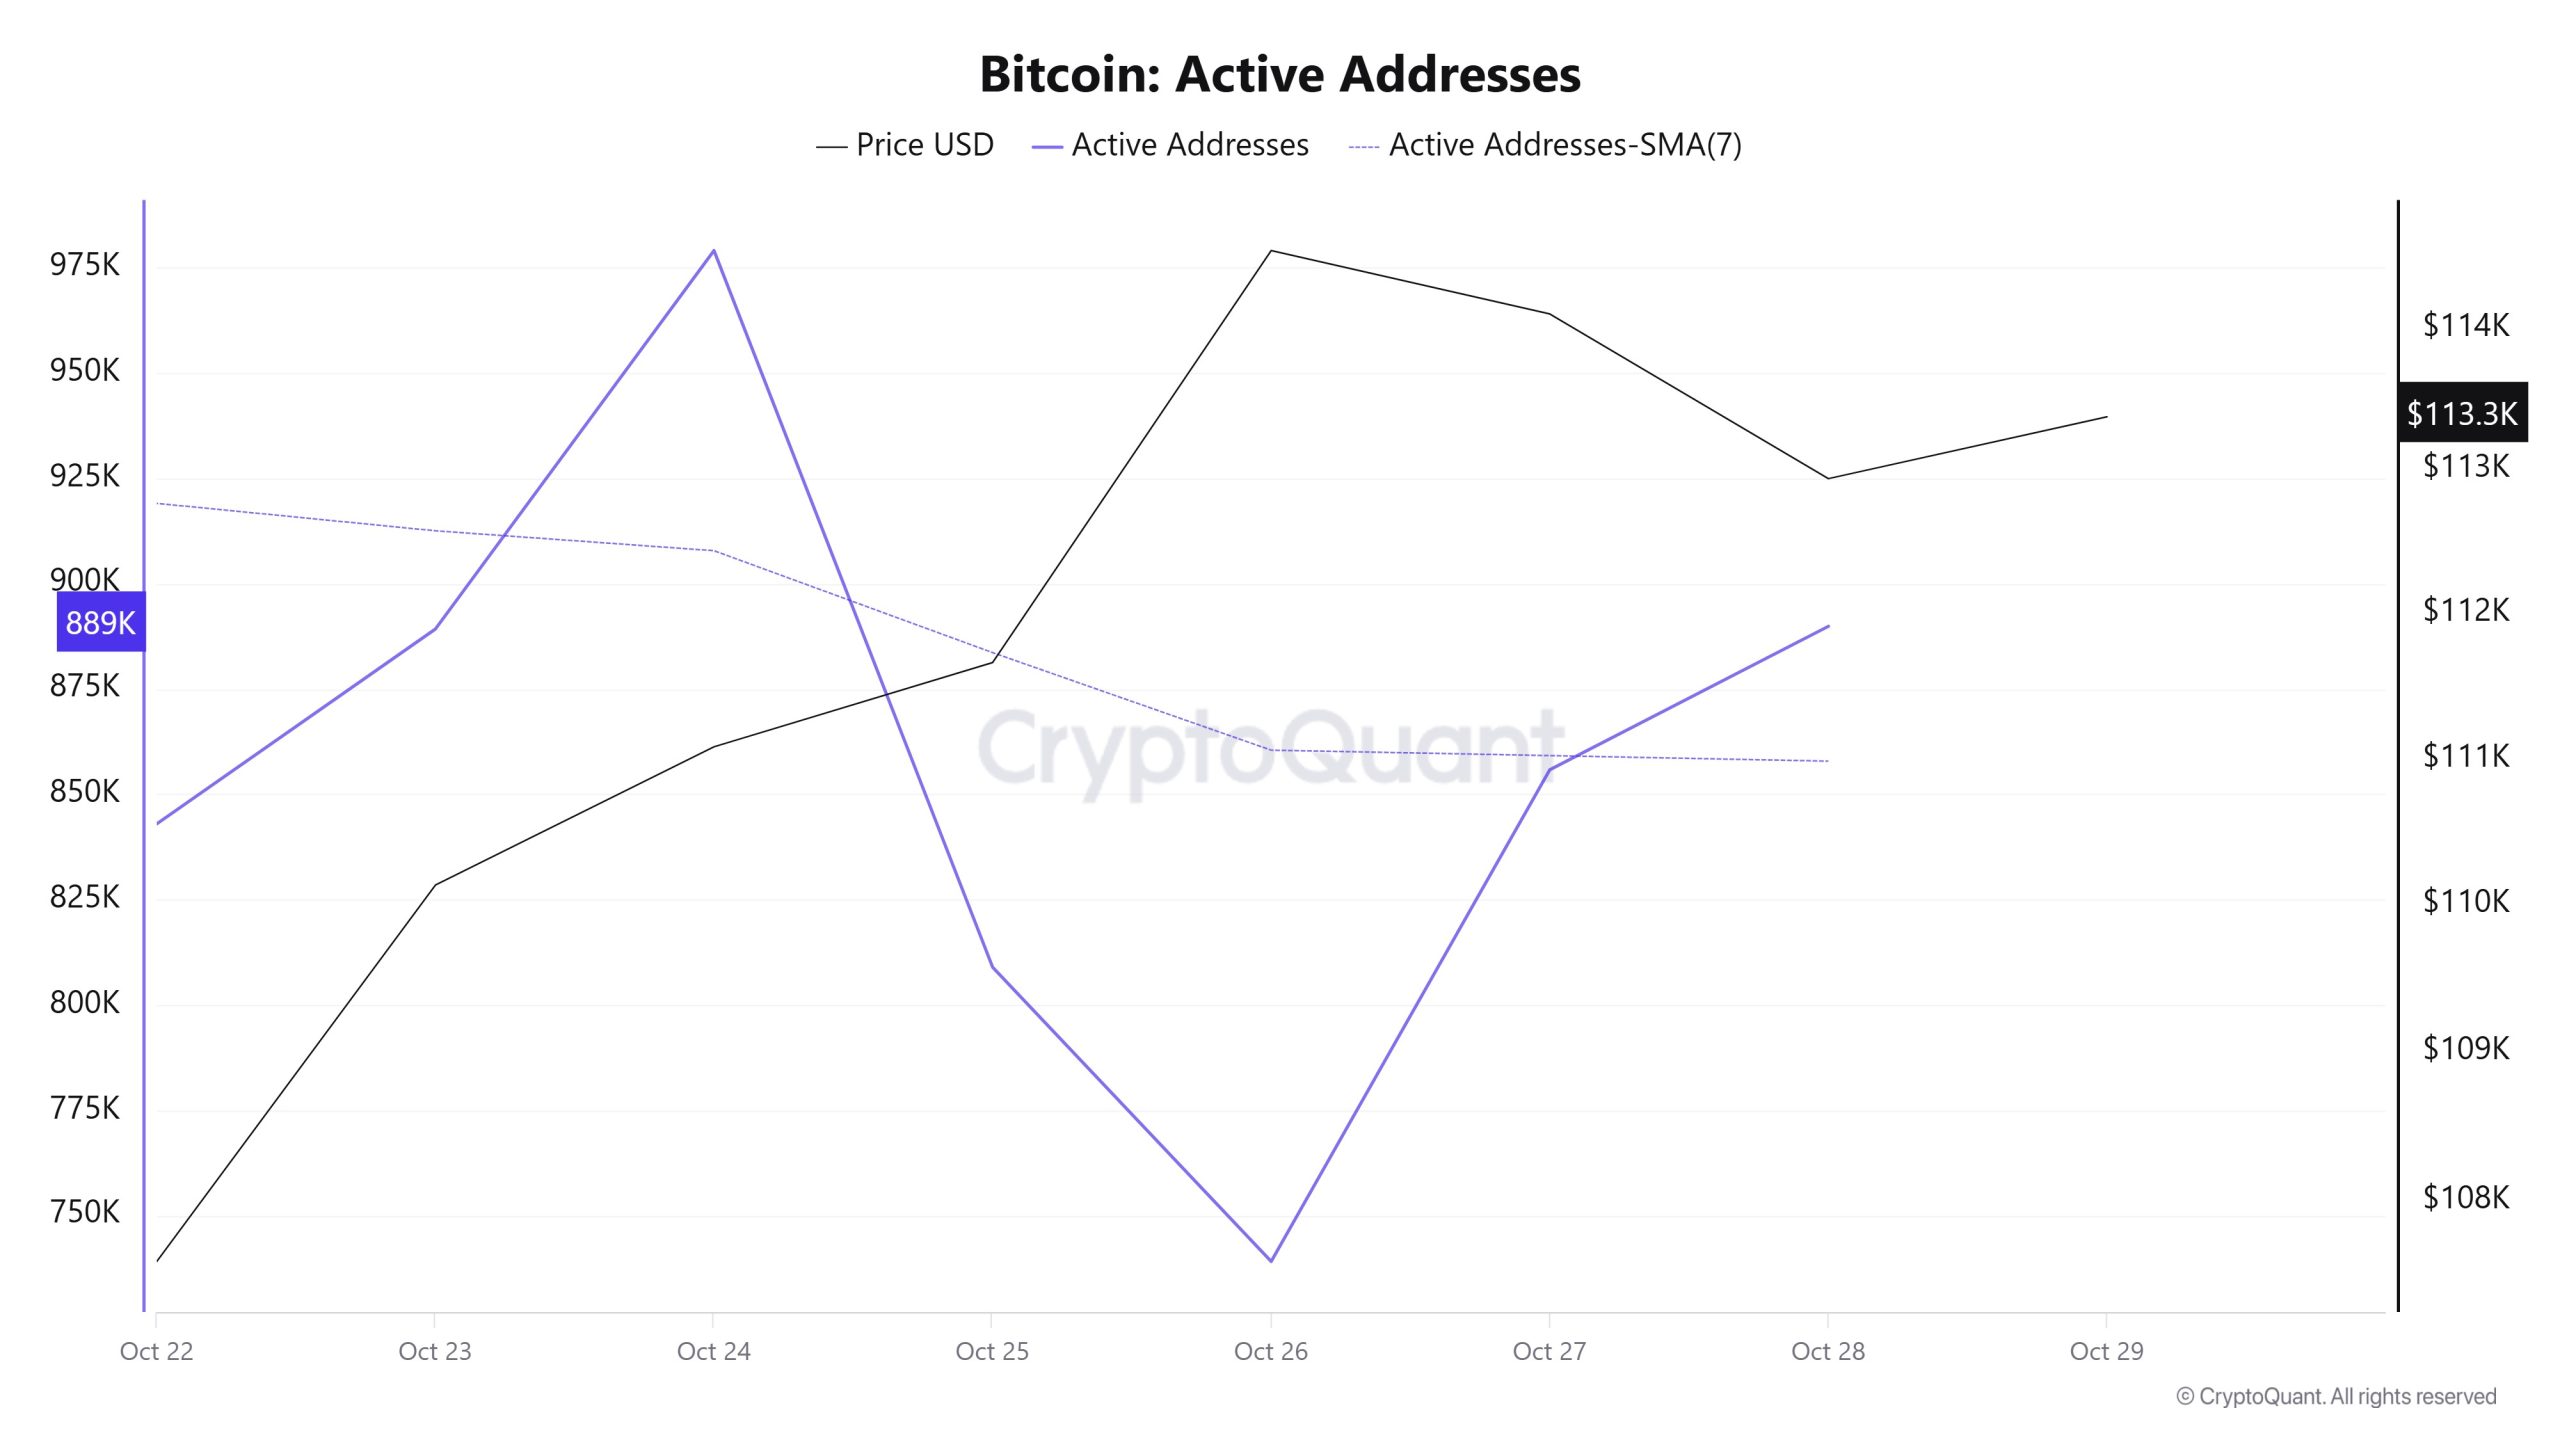
Between October 22 and October 29, 979,061 active addresses were added to the Bitcoin network ( ). During this period, the Bitcoin price rose to $114,000. Notably, while the number of active addresses declined el October 24, the Bitcoin price reached $114,000. From a technical perspective, the 7-day simple moving average (SMA) shows horizontal movements.
Active Sending Addresses
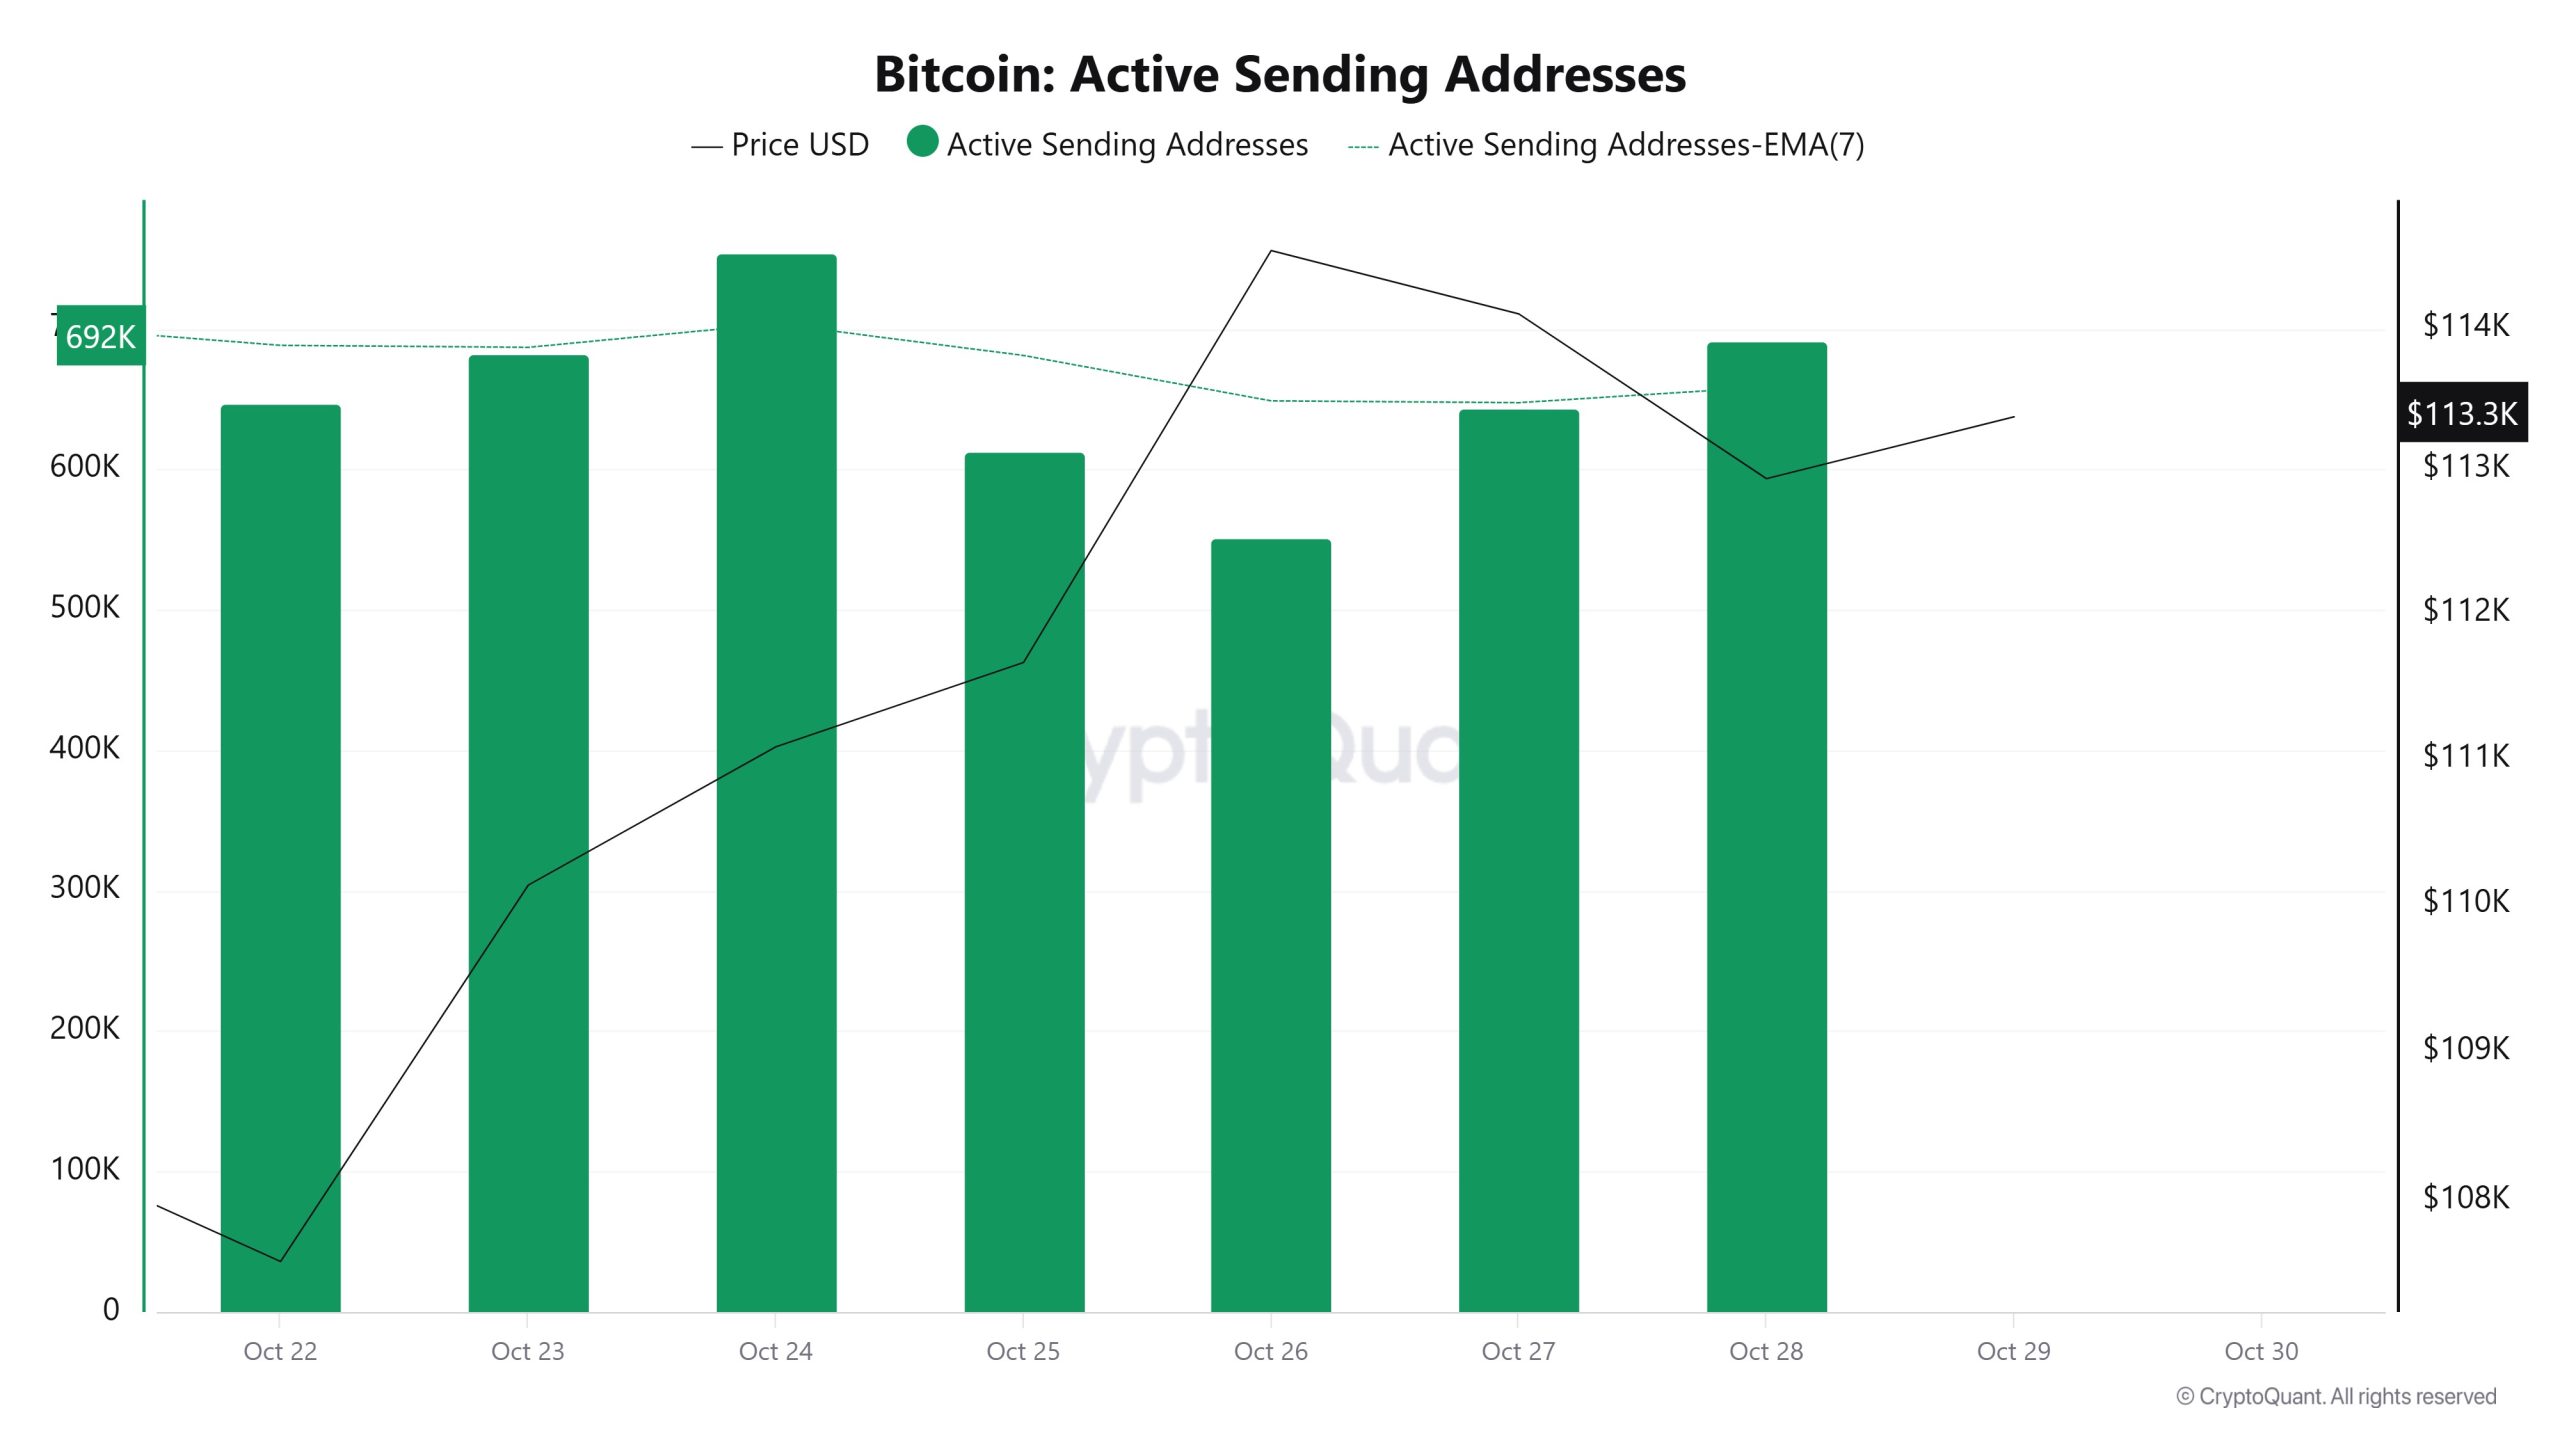
Between October 22 and October 29, an upward trend was observed en the “active sending addresses” metric. On the day the price reached its highest level, this metric stood at 754,152, indicating that user activity el the Bitcoin network was moving en parallel with the price. This data indicates that the $111,000 level was supported not only por price but also por el-chain address activity, as shown at . Overall, the Active Sending Addresses metric followed an upward trend during this period.
Active Receiving Addresses
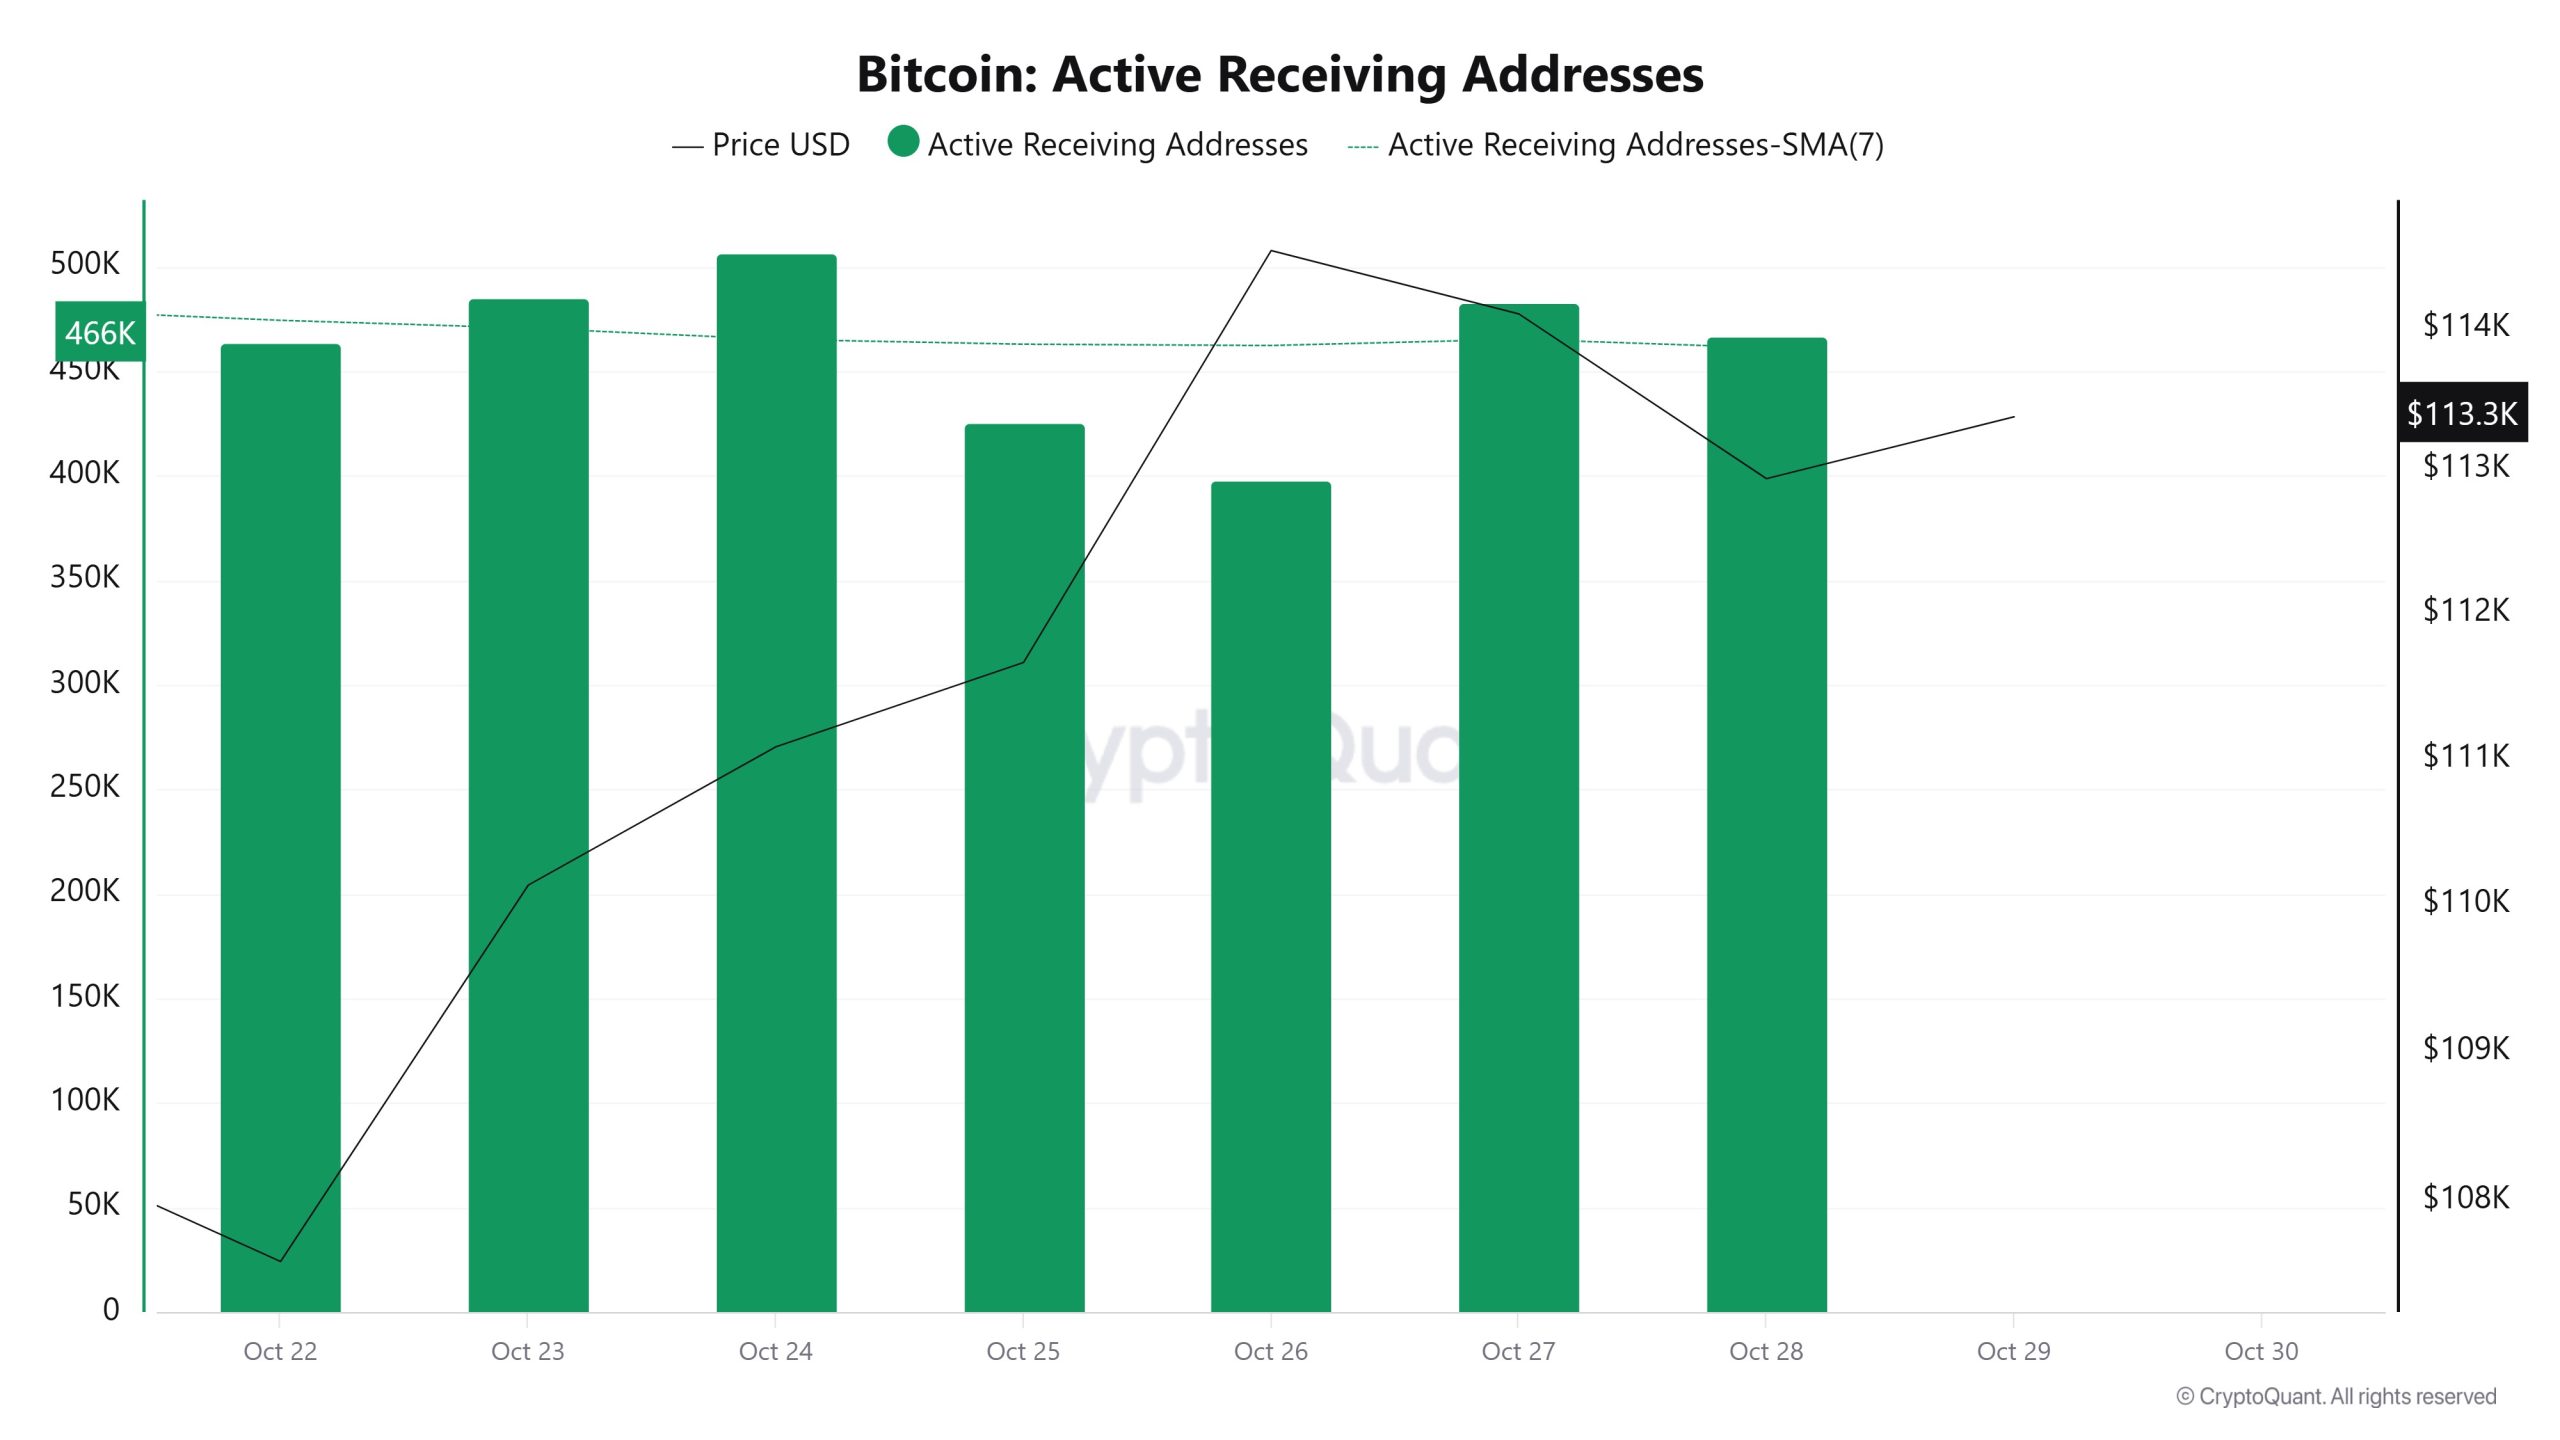
Between October 22 and October 29, active receiving addresses experienced a normal increase along with the Black Line (price line). On the day the price reached its peak, active receiving addresses rose to 398,009 levels, indicating that buyers purchased Bitcoin at around $111,000 levels.
Breakdowns
MVRV
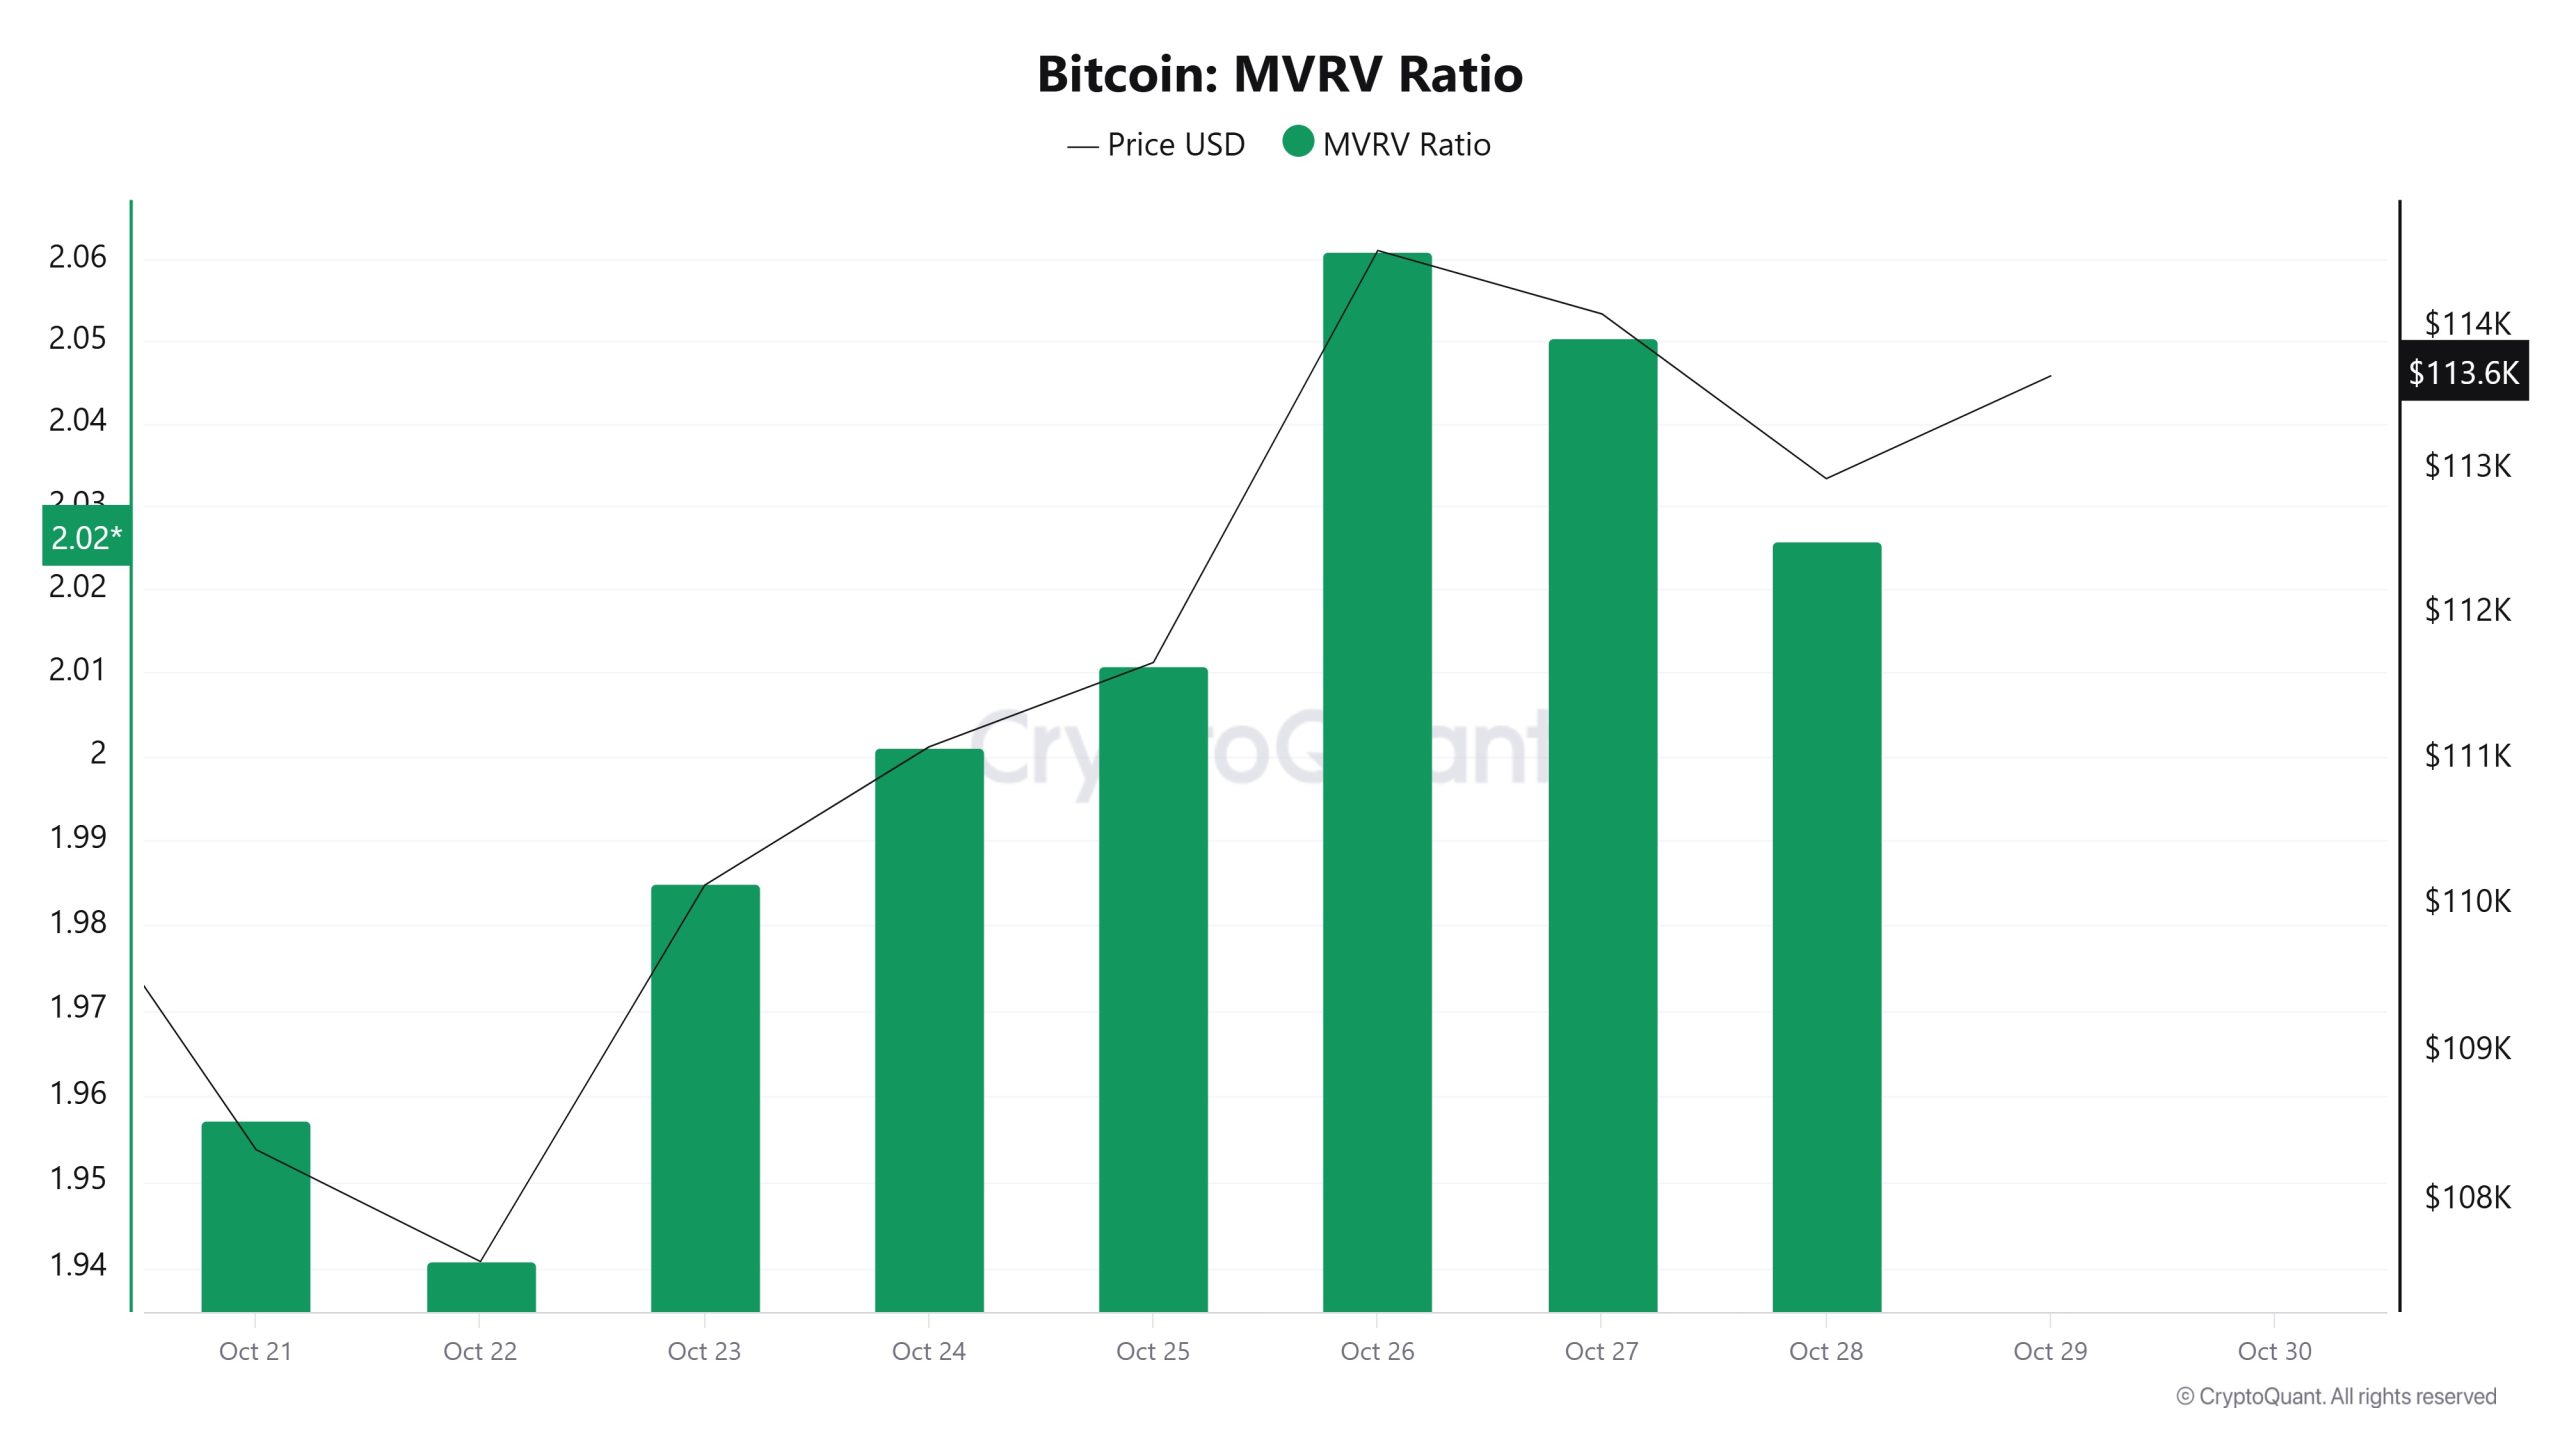
On October 22, while the Bitcoin price was trading at $107,597, the MVRV Ratio was at 1.940.
As of October 28, the Bitcoin price rose to $112,940, recording a 4.97% increase, while the MVRV Ratio rose to 2.025, recording a 4.38% increase.
Realized Price
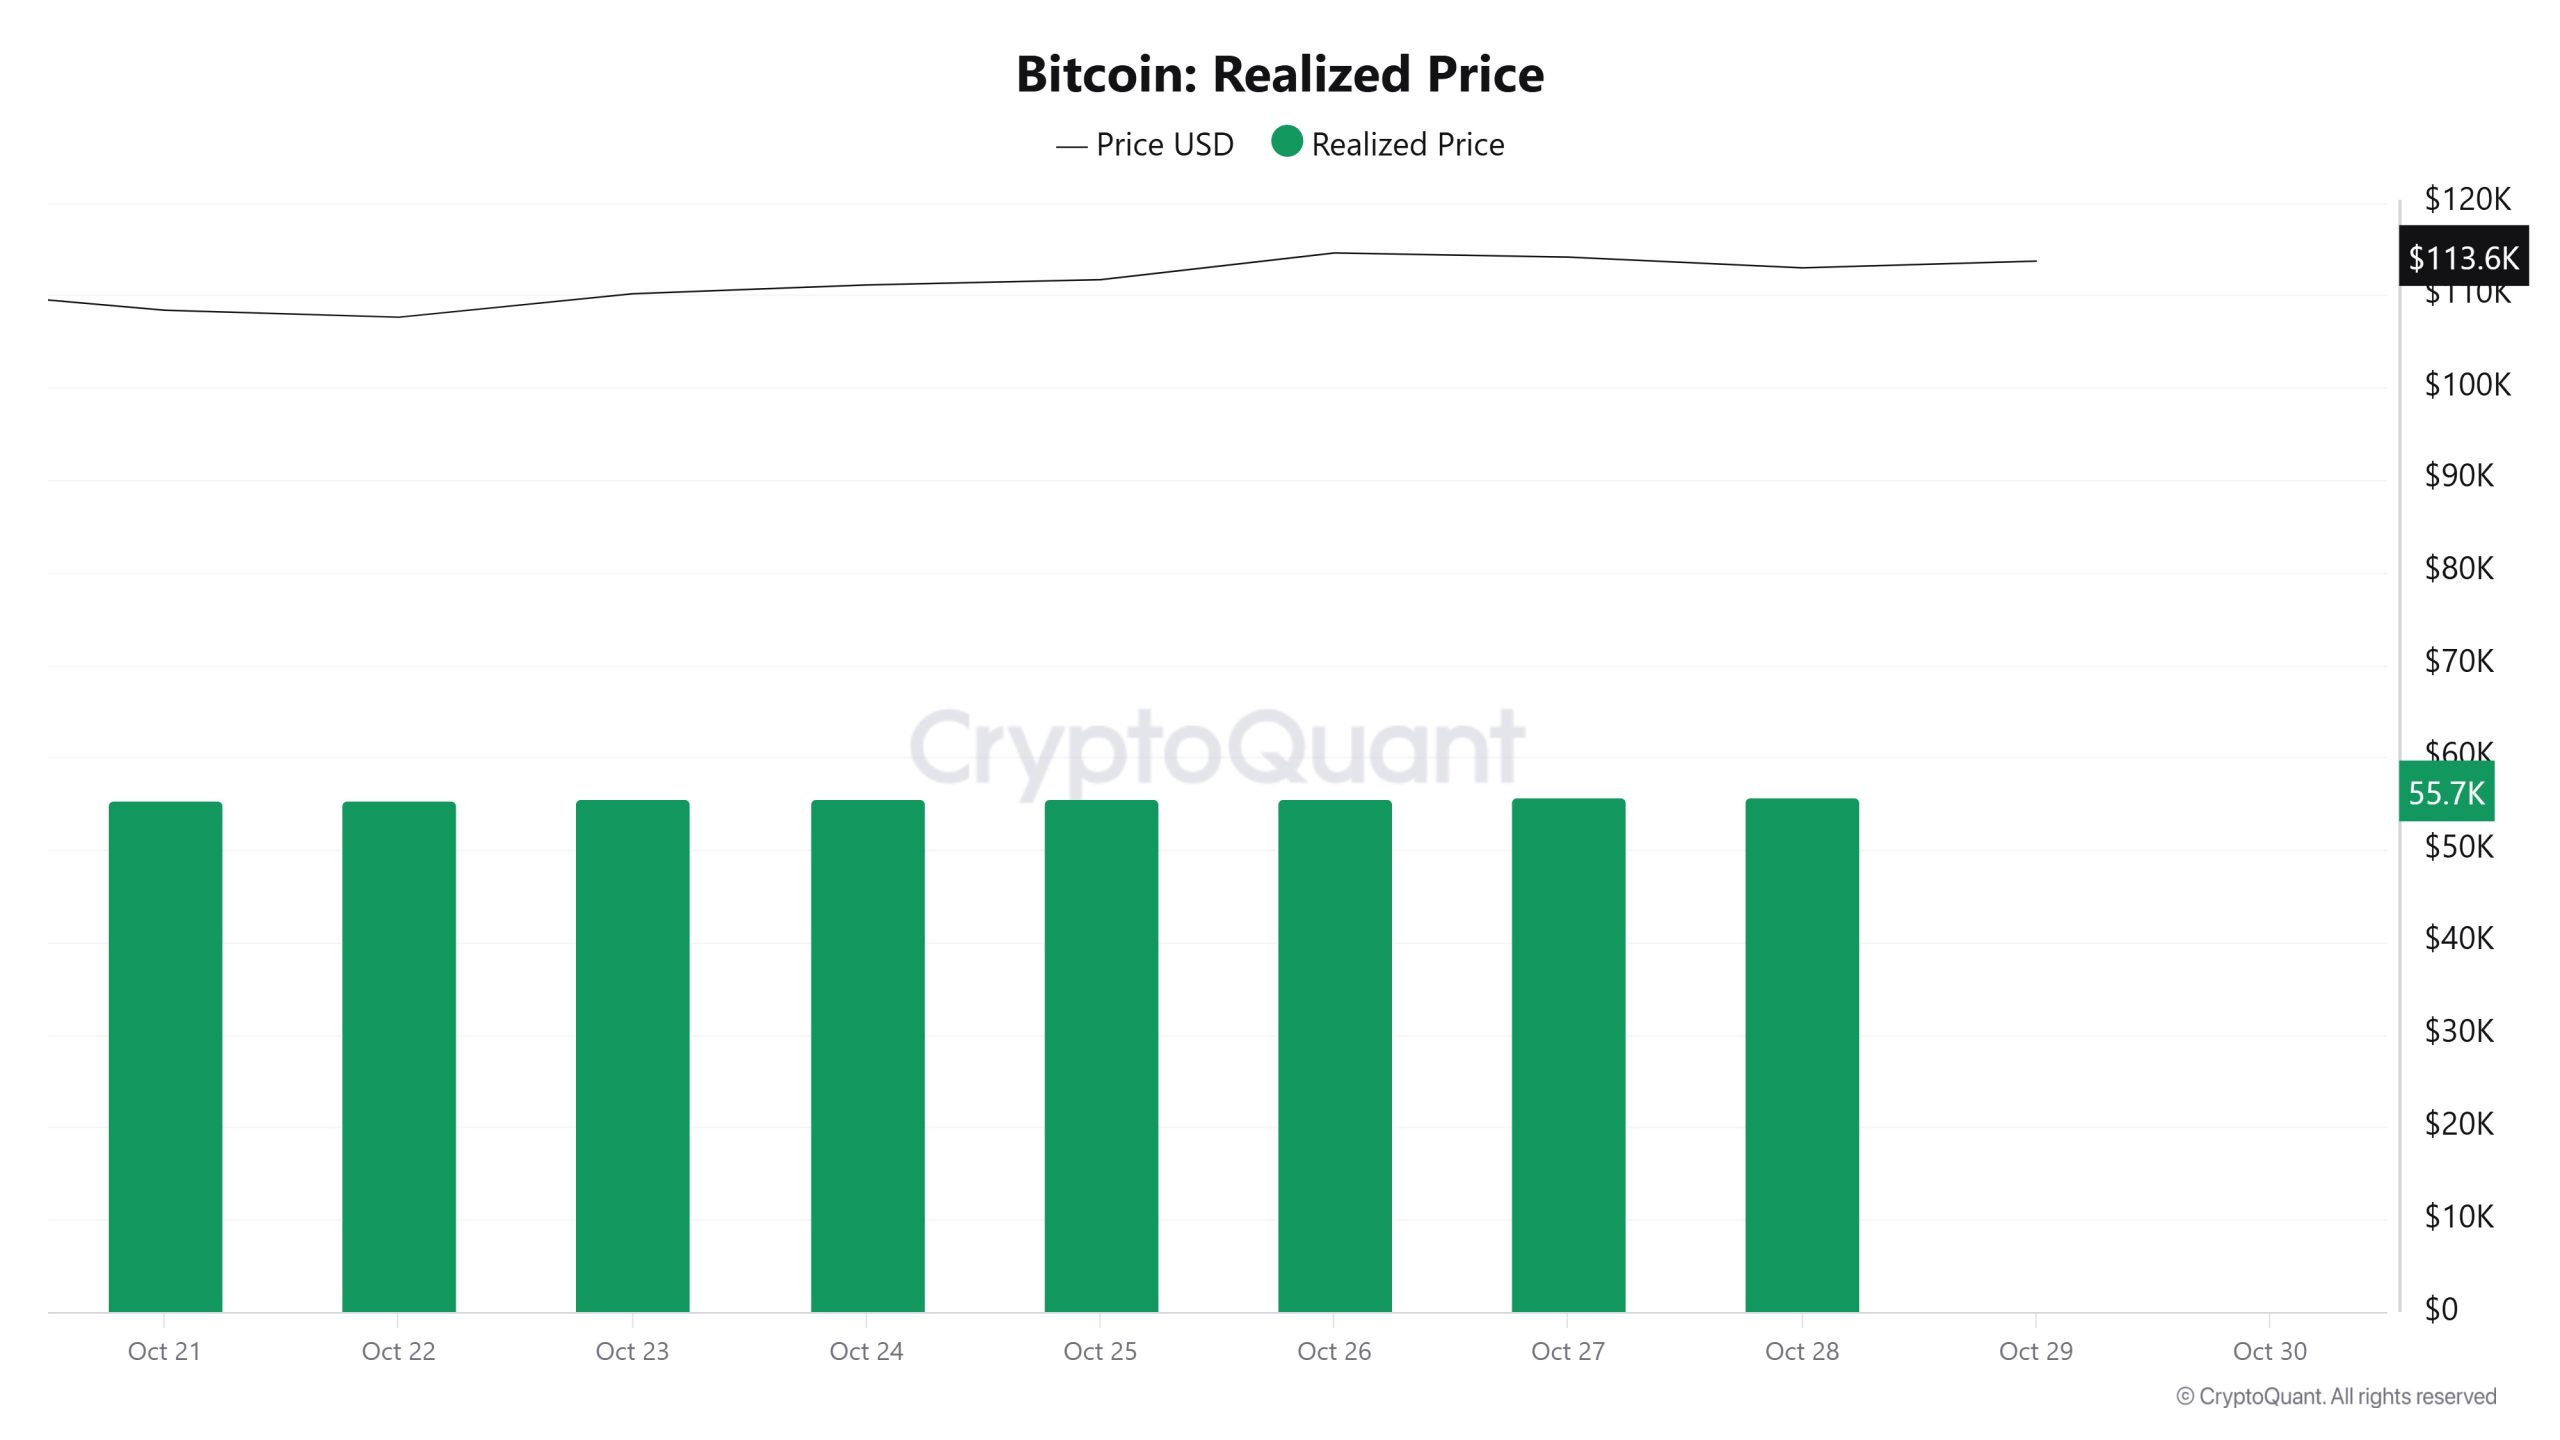
On October 22, while the Bitcoin price was trading at $107,597, the Realized Price was at $55,439.
As of October 28, the Bitcoin price rose to $112,940, while the Realized Price increased to $55,750, recording a 0.56% increase.
Spent Output Profit Ratio (SOPR)
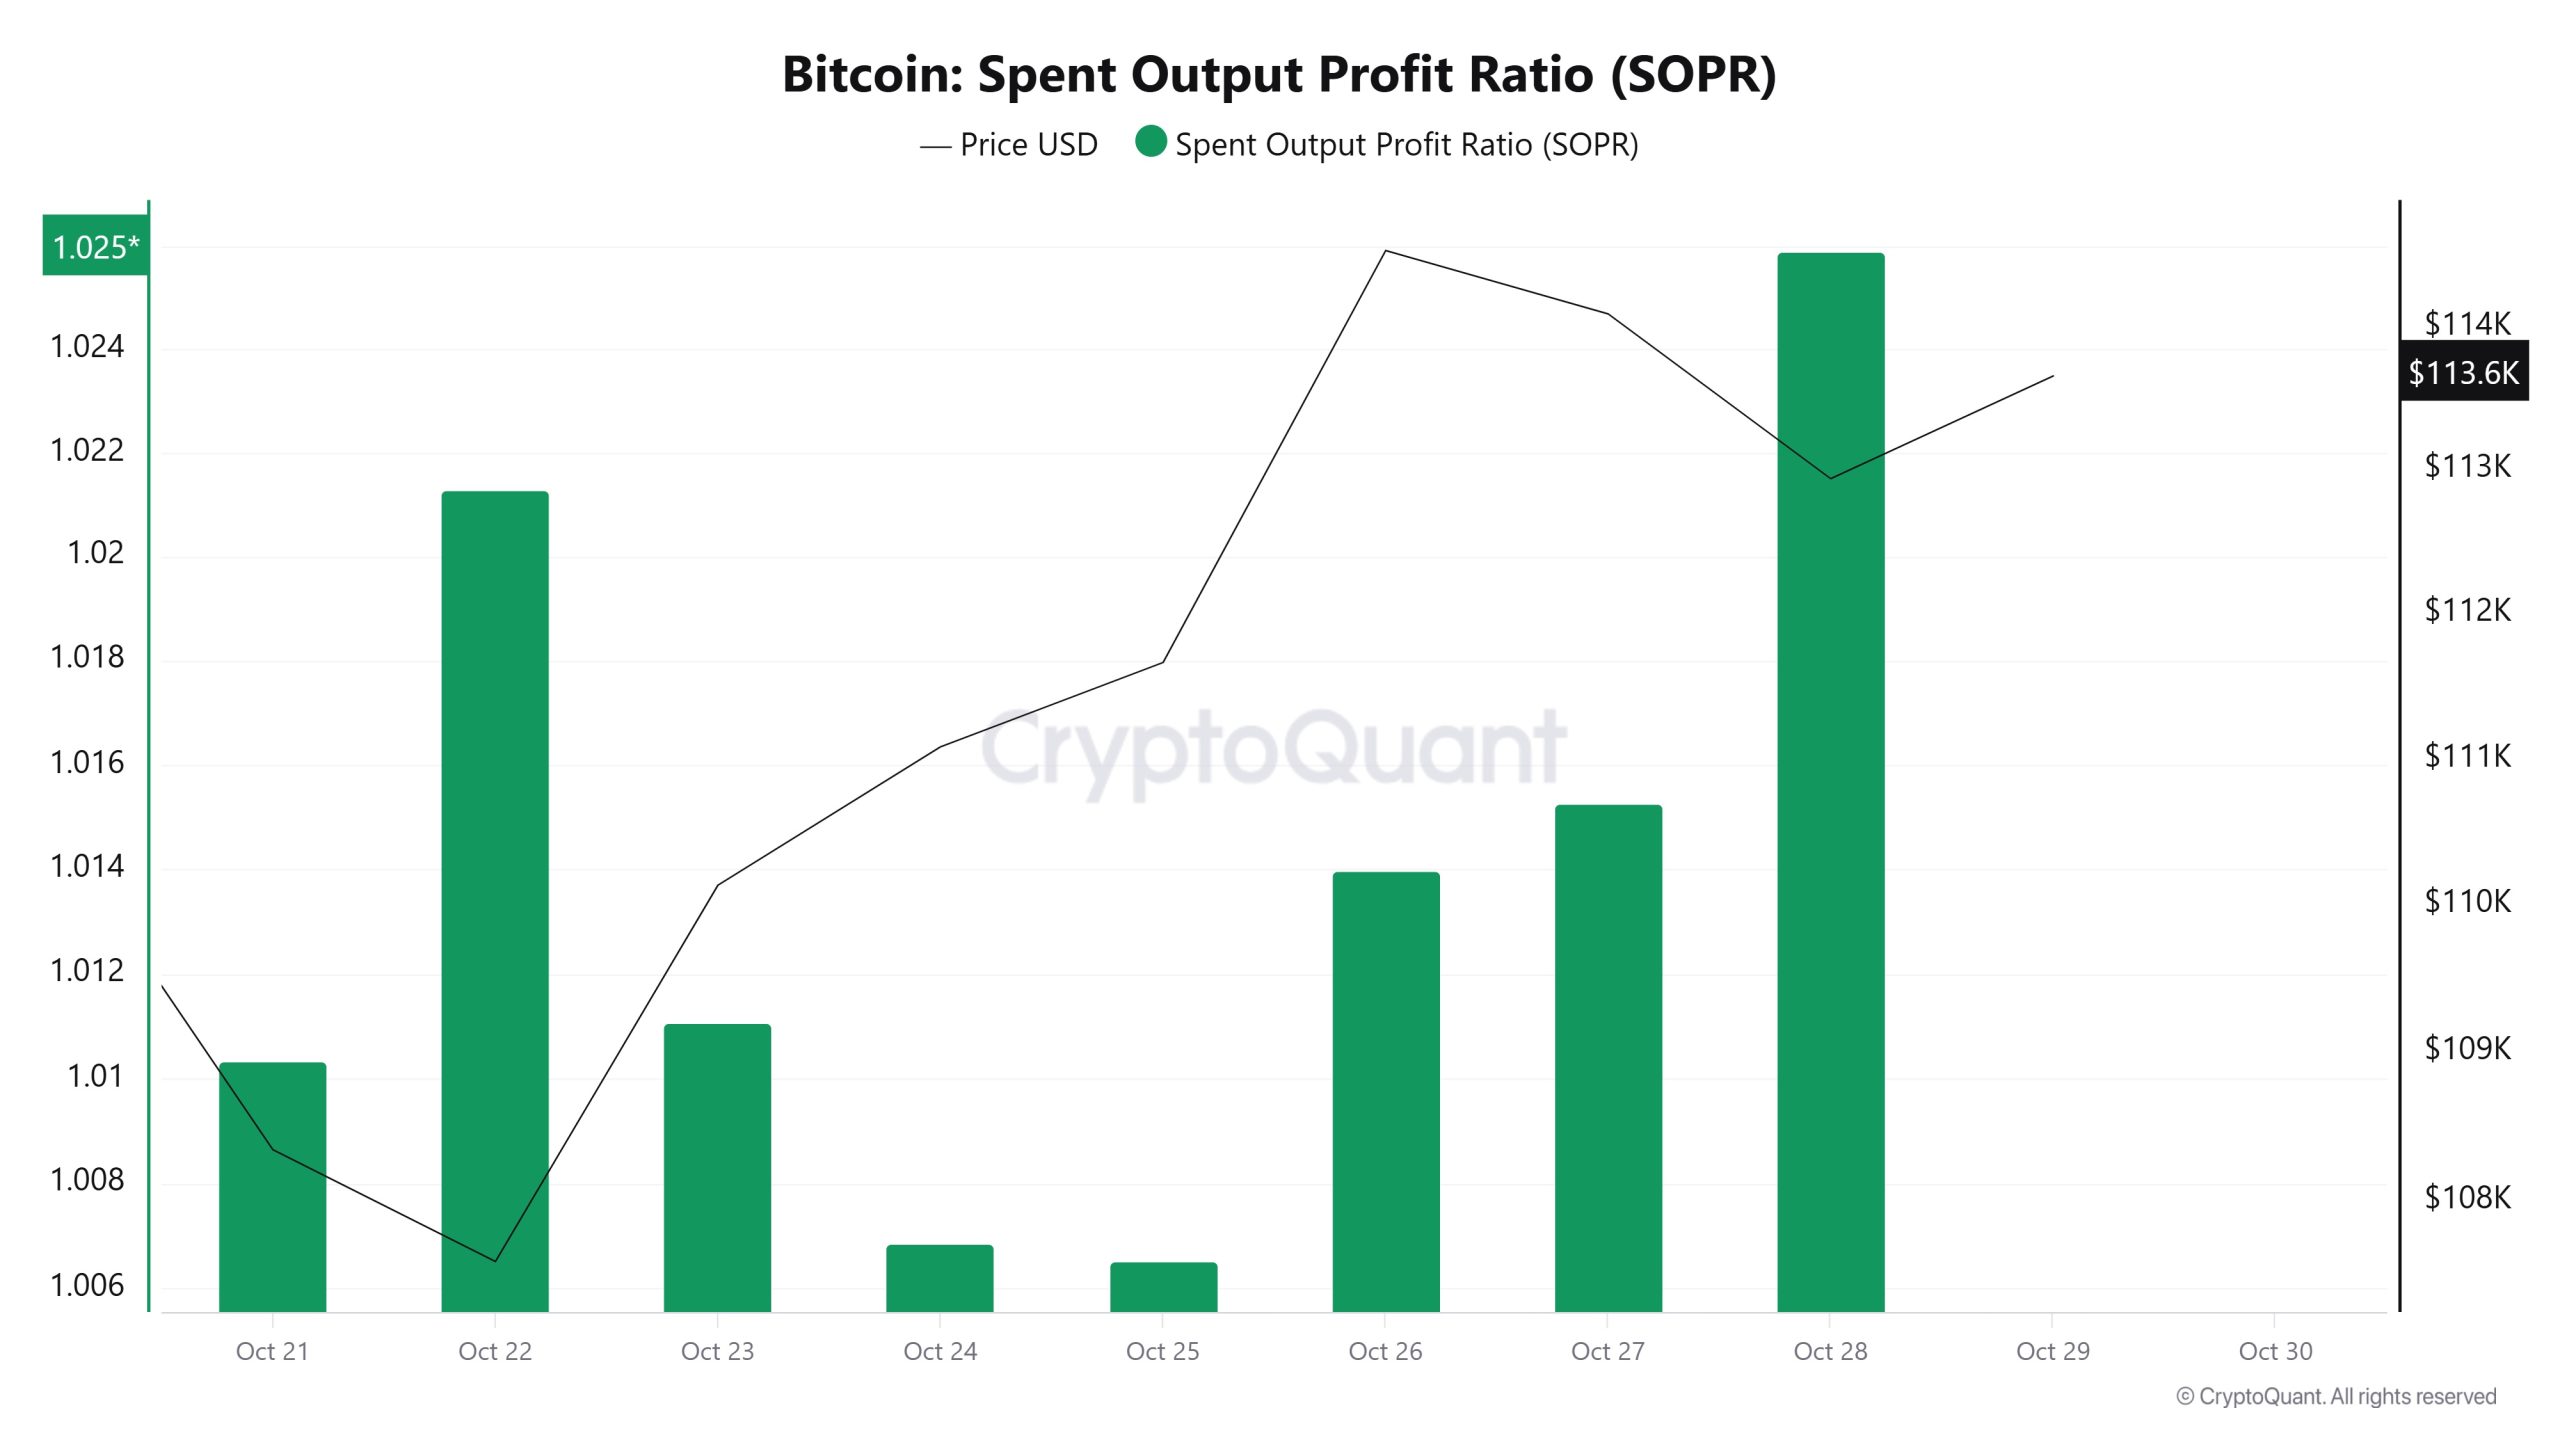
On October 22, while the Bitcoin price was trading at $107,597, the SOPR metric was at 1.021. As of October 28, while the Bitcoin price rose to $112,940, the SOPR metric rose to 1.025, recording a 0.39% increase.
Derivatives
Open Interest
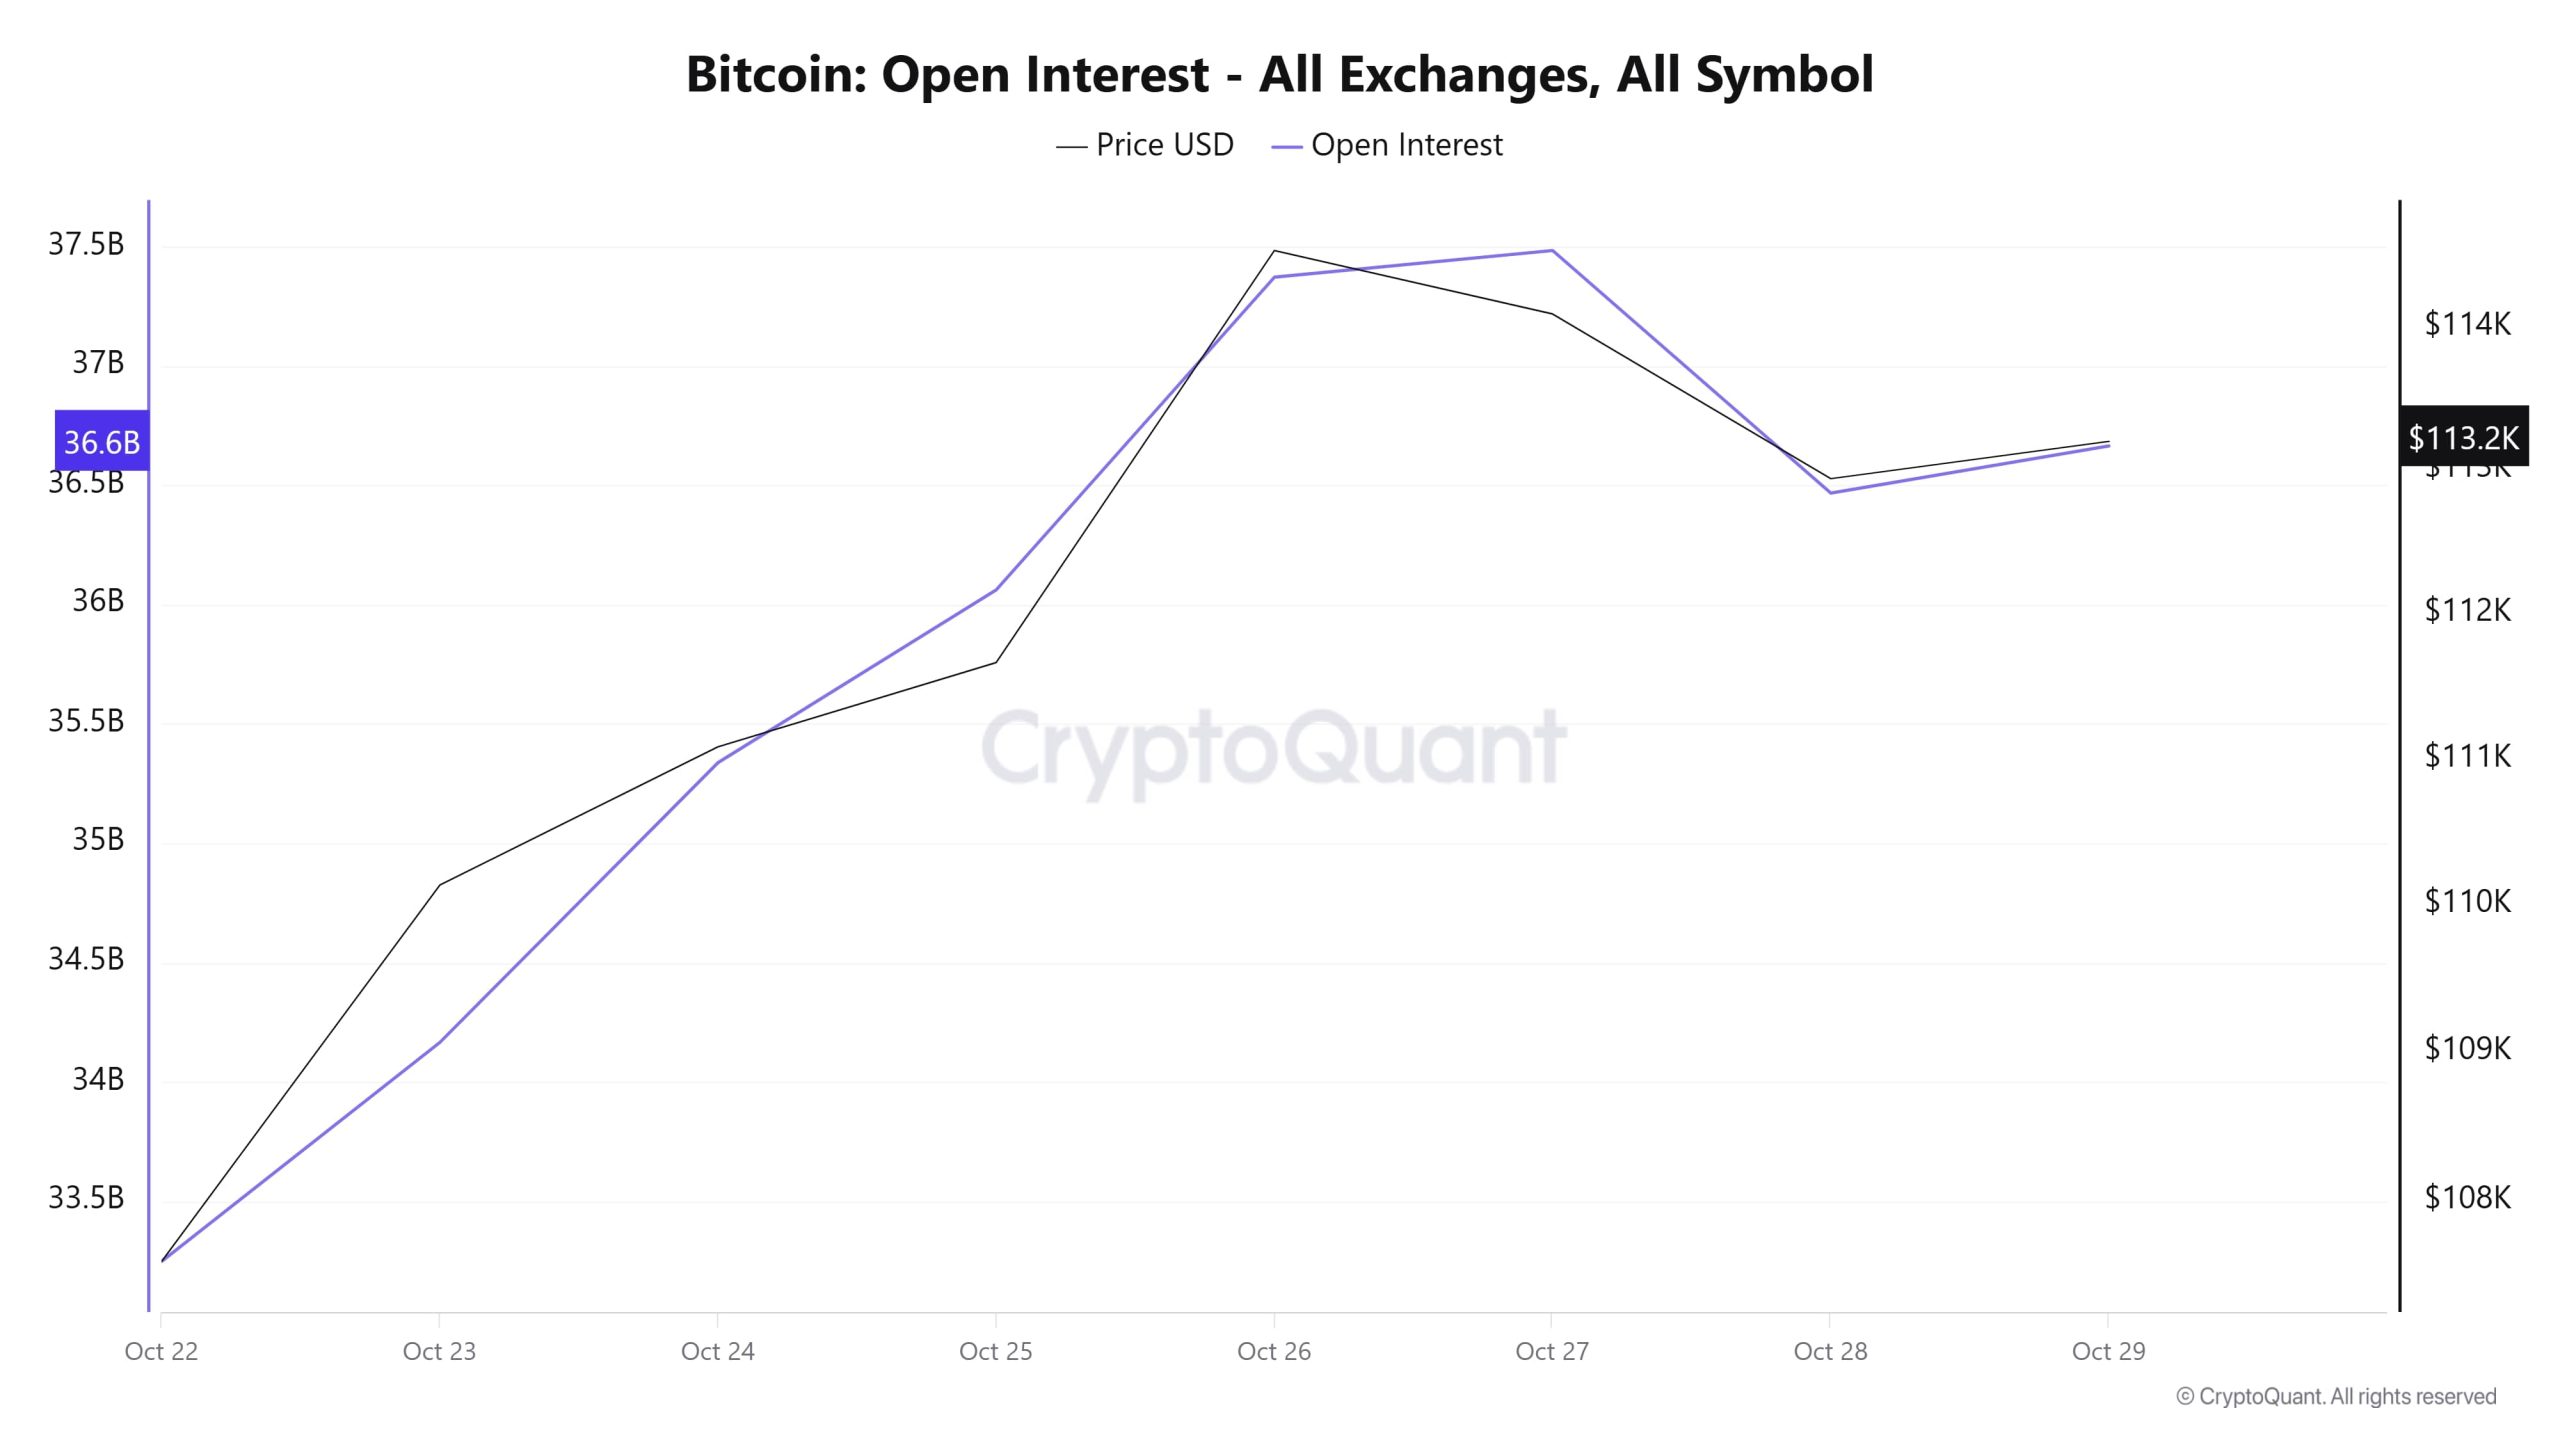
Starting October 22, both price and open interest rose together, peaking around October 26. During this period, the increase en open interest indicates that new positions entered the market and investors turned more to leveraged trading. However, after October 27, both price and open interest have declined. This pattern typically signals that positions are beginning to close and that the leverage level en the market is decreasing. Over the last two days, open interest has entered a flat trend. This indicates that the desire to open new positions en the market remains limited en the short term and that existing participants are acting cautiously. Overall, this contraction following the rise en open interest parallel to the price signals that the market has entered a short-term correction or consolidation phase.
Funding Rate
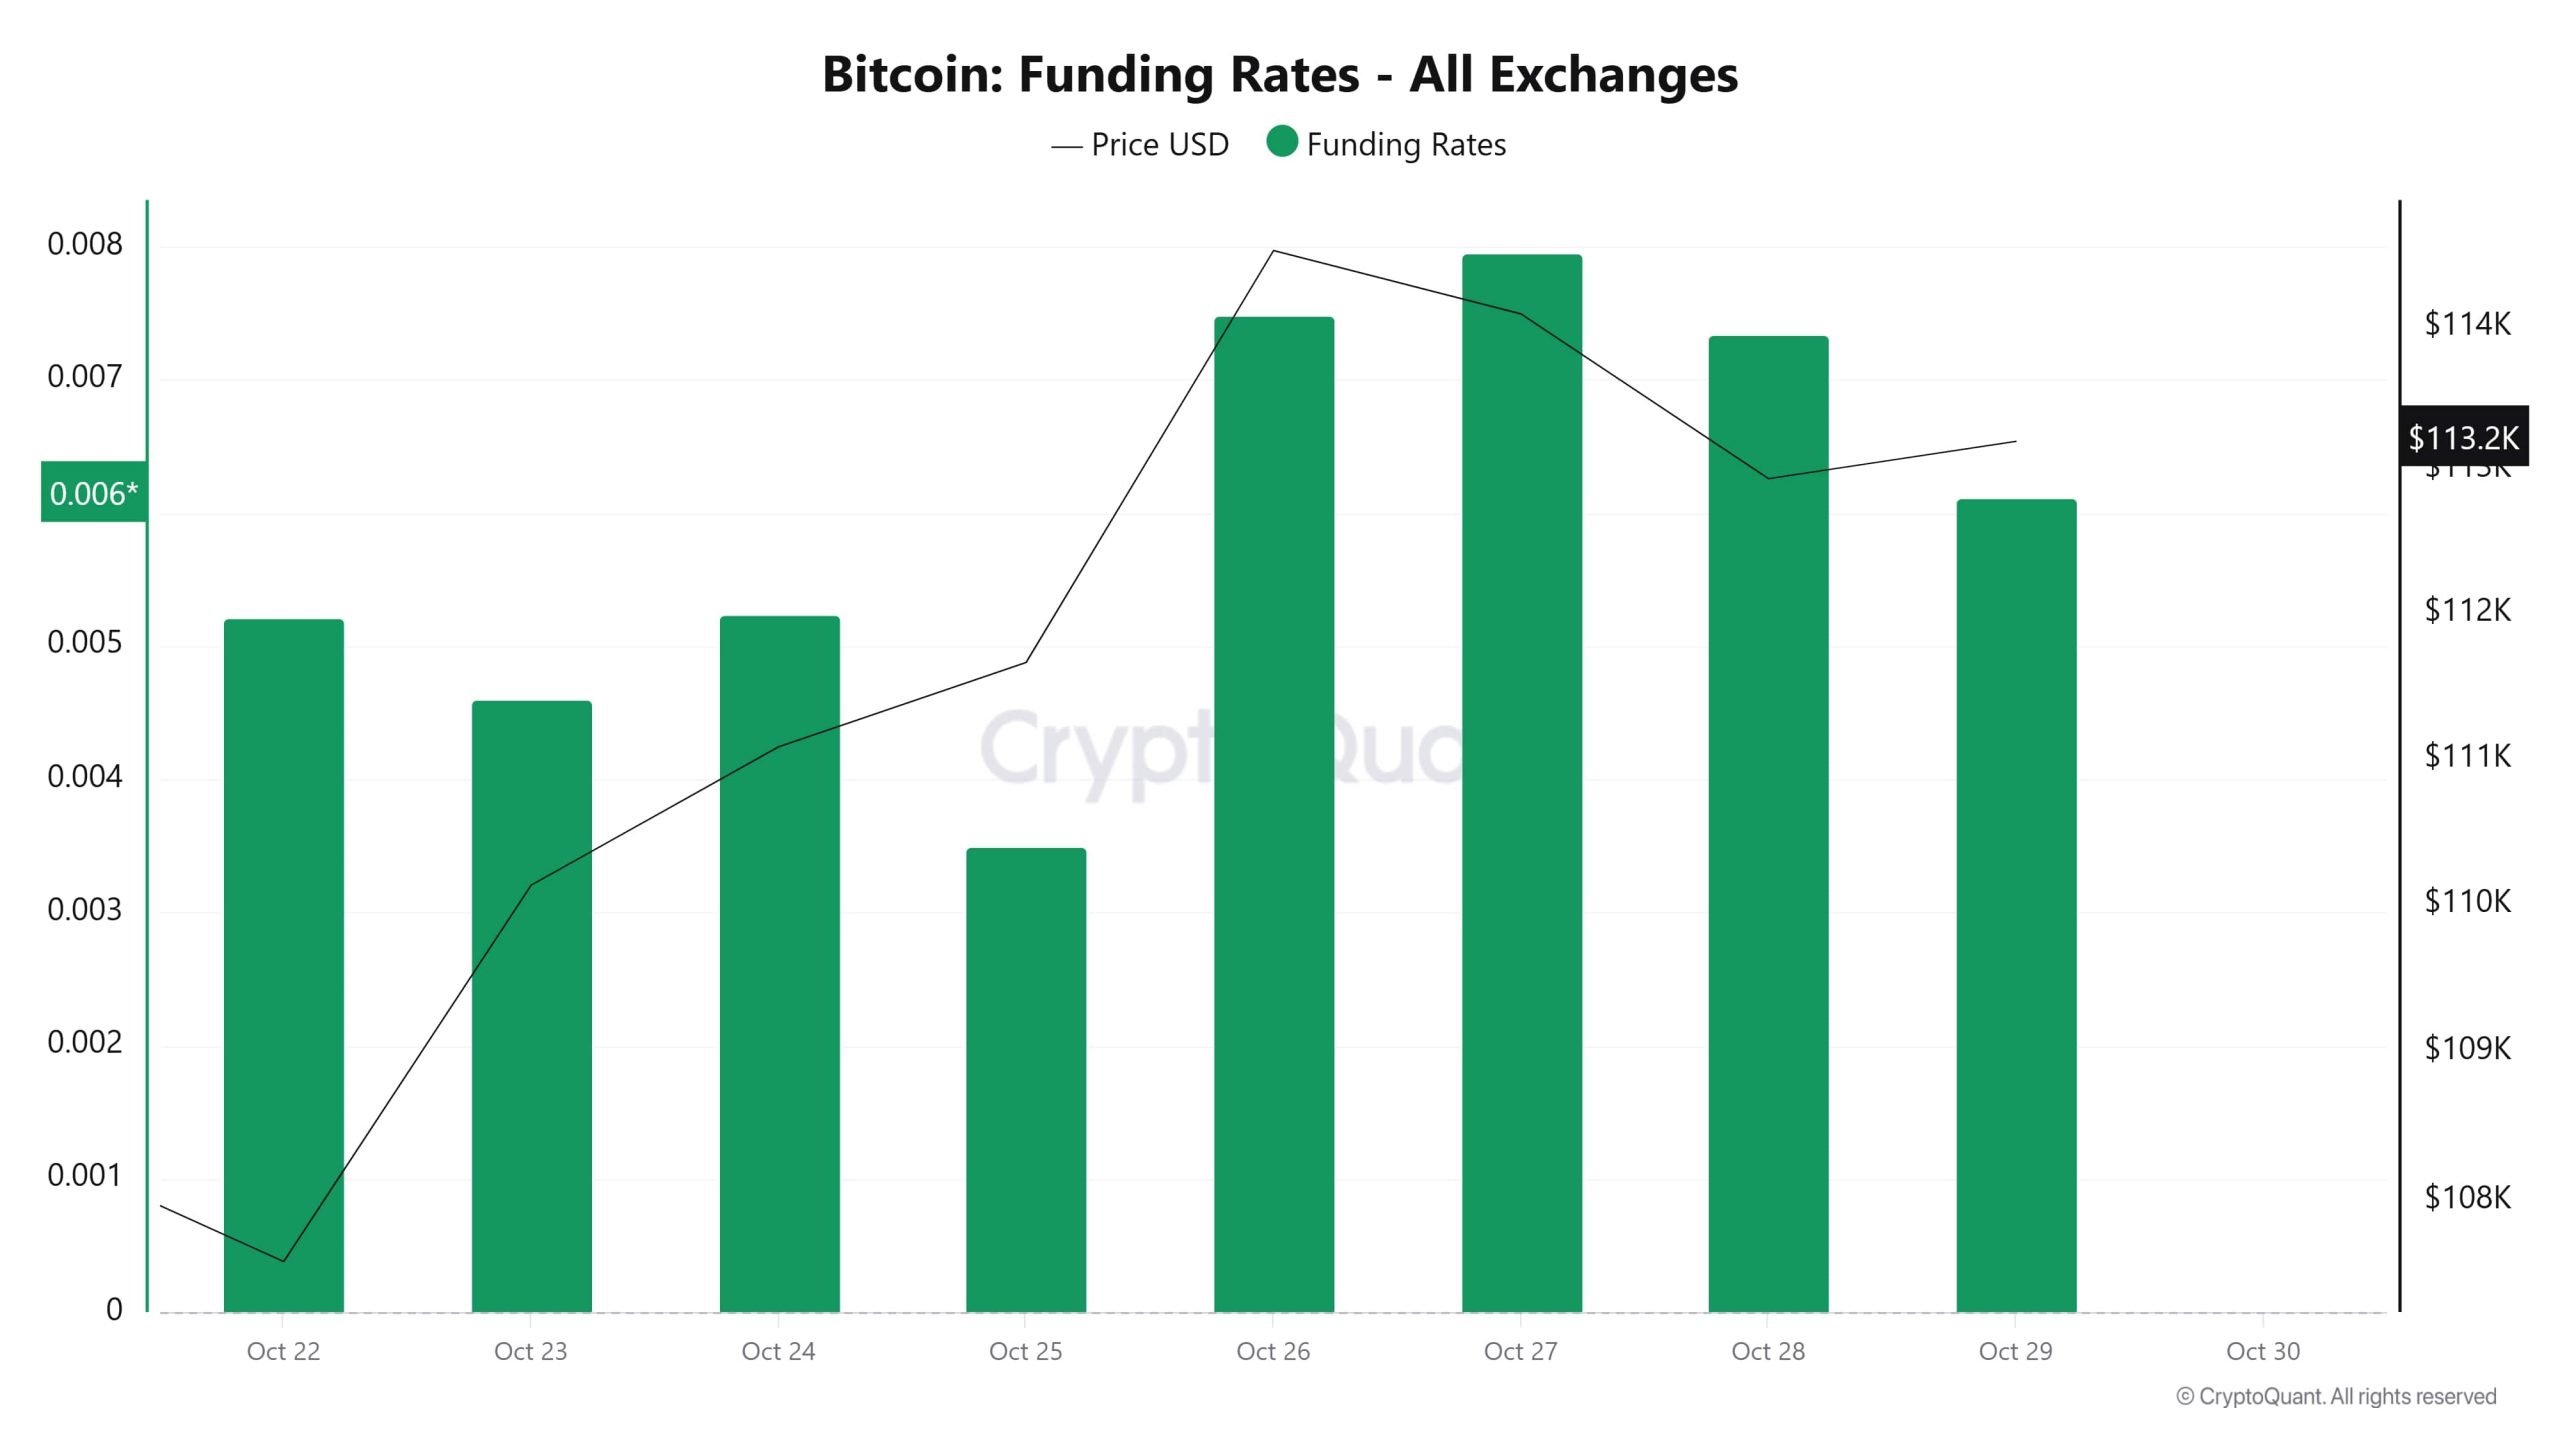
Starting from October 22, the funding rate remained en positive territory and rose significantly el October 26-27, reaching 0.008. This increase indicates that long positions gained weight and the market moved with upward expectations. However, with the slight pullback en price after October 27, there was also a limited decline en funding rates. This situation indicates that excessive optimism has decreased somewhat and leveraged long positions have been partially closed. The fact that funding rates remain positive shows that market sentiment is still generally bullish, but that excessive leverage is entering a balancing phase en the short term.
Long & Short Liquidations
With the BTC price rising from $106,600 to $116,300 last week, the market saw $357 million en long positions and $320 million en short positions liquidated.
| Dates | Long Volume (Million $) | Short Volume (Million $) |
| October 22 | 134.11 | 18.49 |
| October 23 | 13.49 | 39.88 |
| October 24 | 16:48 | 31.19 |
| October 25 | 1.92 | 5.76 |
| October 26 | 3.76 | 192.26 |
| October 27 | 115.36 | 18.47 |
| October 28 | 71.93 | 14.70 |
| Total | 357.05 | 320.75 |
Supply Distribution
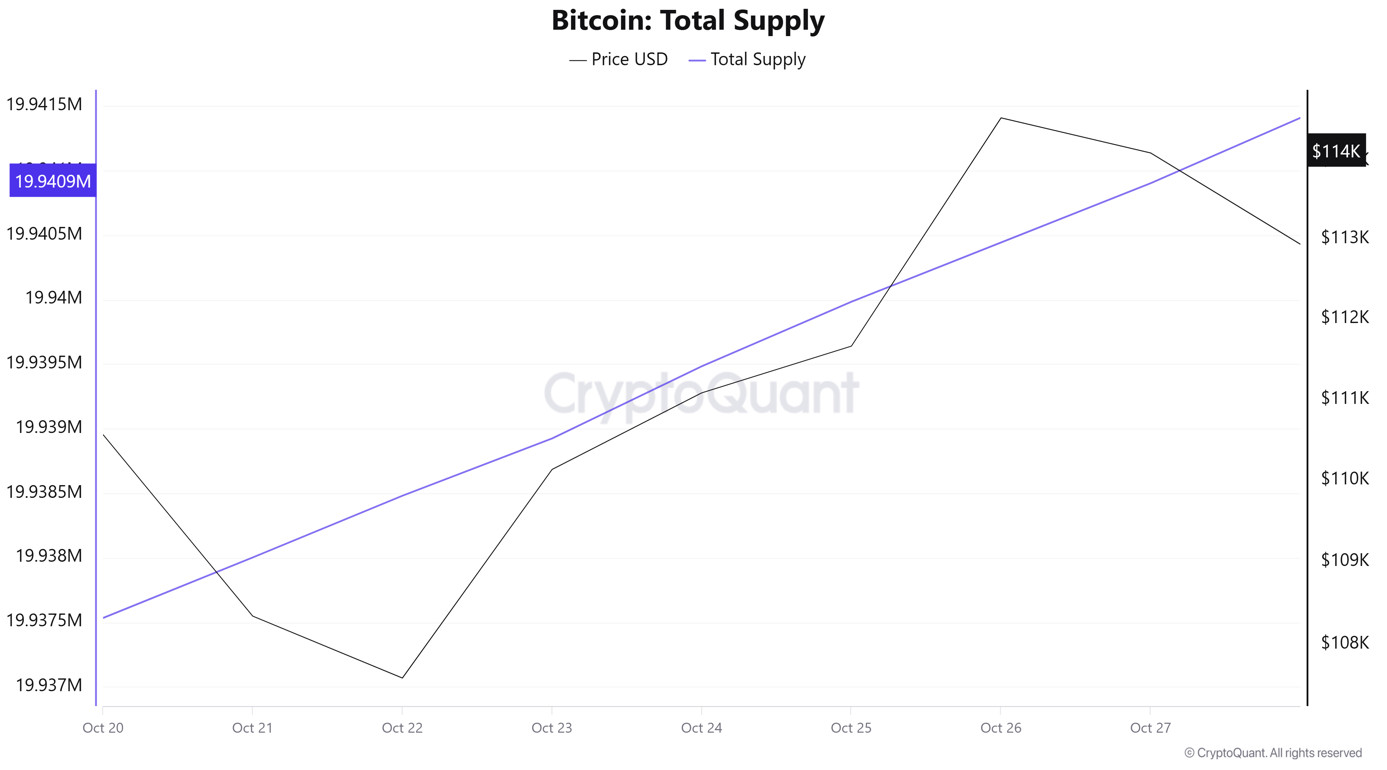
Total Supply: Reached 19,940,902 units, an increase of approximately 0.0169% compared to last week.
New Supply: The amount of BTC produced this week was 3,369.
Velocity: Last week’s velocity of 12.21 reached 12.27 as of October 27.
| Wallet Categoría | October 20, 2025 | October 27, 2025 | Change (%) |
| < 1 BTC | 8.4448% | 8.4421% | -0.03% |
| 1 – 10 BTC | 11.3802% | 11.3868% | 0.06 |
| 10 – 100 BTC | 24.5954% | 24.6740% | 0.32 |
| 100 – 1k BTC | 30.4286% | 30.3924% | -0.12% |
| 1k – 10k BTC | 17.2962% | 17.1153% | -1.05% |
| 10k+ BTC | 7.8545% | 7.9890% | 1.71 |
According to the latest weekly data, the Bitcoin wallet distribution showed a mixed picture. The share of wallets holding less than 1 BTC declined slightly from 8.4448% to 8.4421%, recording a decrease of approximately 0.03%. The proportion of wallets holding between 1 and 10 BTC increased from 11.3802% to 11.3868%, representing an increase of approximately 0.06%. The share en the 10–100 BTC range rose from 24.5954% to 24.6740%, recording an increase of approximately 0.32%. The proportion of wallets en the 100–1,000 BTC range decreased from 30.4286% to 30.3924%, a drop of approximately 0.12%. The share en the 1,000–10,000 BTC range fell from 17.2962% to 17.1153%, showing a decrease of approximately 1.05%. Finally, the share of wallets holding 10,000 BTC or more increased from 7.8545% to 7.9890%, marking an increase of approximately 1.71%.
Exchange Supply Ratio
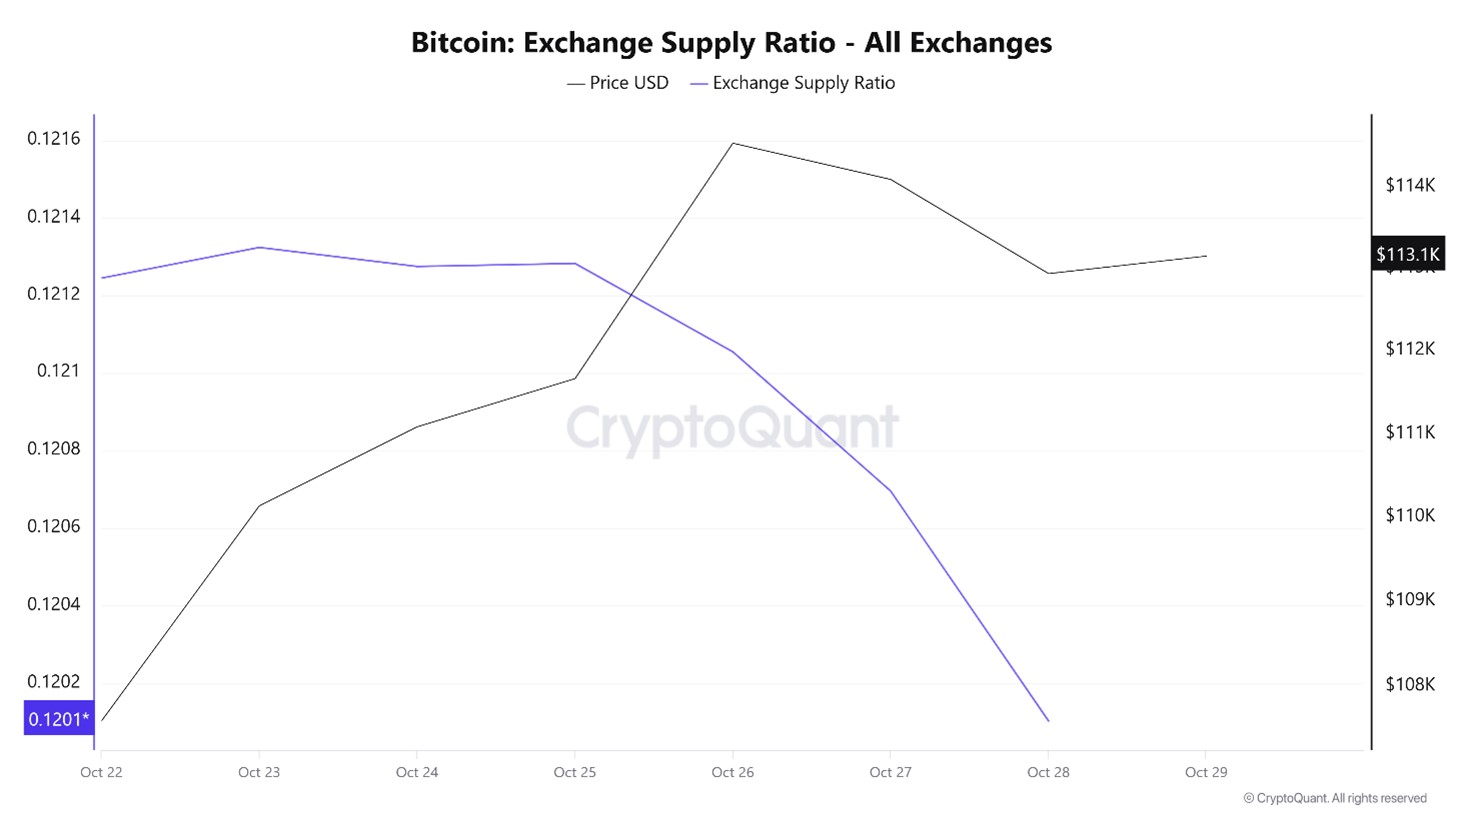
According to data obtained from the Bitcoin Exchange Supply Ratio table, which shows how much of the total supply of Bitcoins is held el exchanges, low rates have been observed this week. The general trend shows a positive correlation between the Bitcoin price and the supply rate entering exchanges. This indicates that most Bitcoins are beginning to be transferred back to wallets and that the market is ready to buy.
Between October 22 and October 29, the Bitcoin Exchange Supply Ratio decreased from 0.12132394 to 0.12006033. During this period, the Bitcoin price fell from $107,000 to $102,000. Notably, the fact that both variables moved en the same direction this week indicates an increase en the amount of Bitcoin supplied to exchanges despite the price decline, suggesting that long-term investors may have started to increase their holdings again. Overall, an upward trend en the Bitcoin price appears likely.
Exchange Reserve
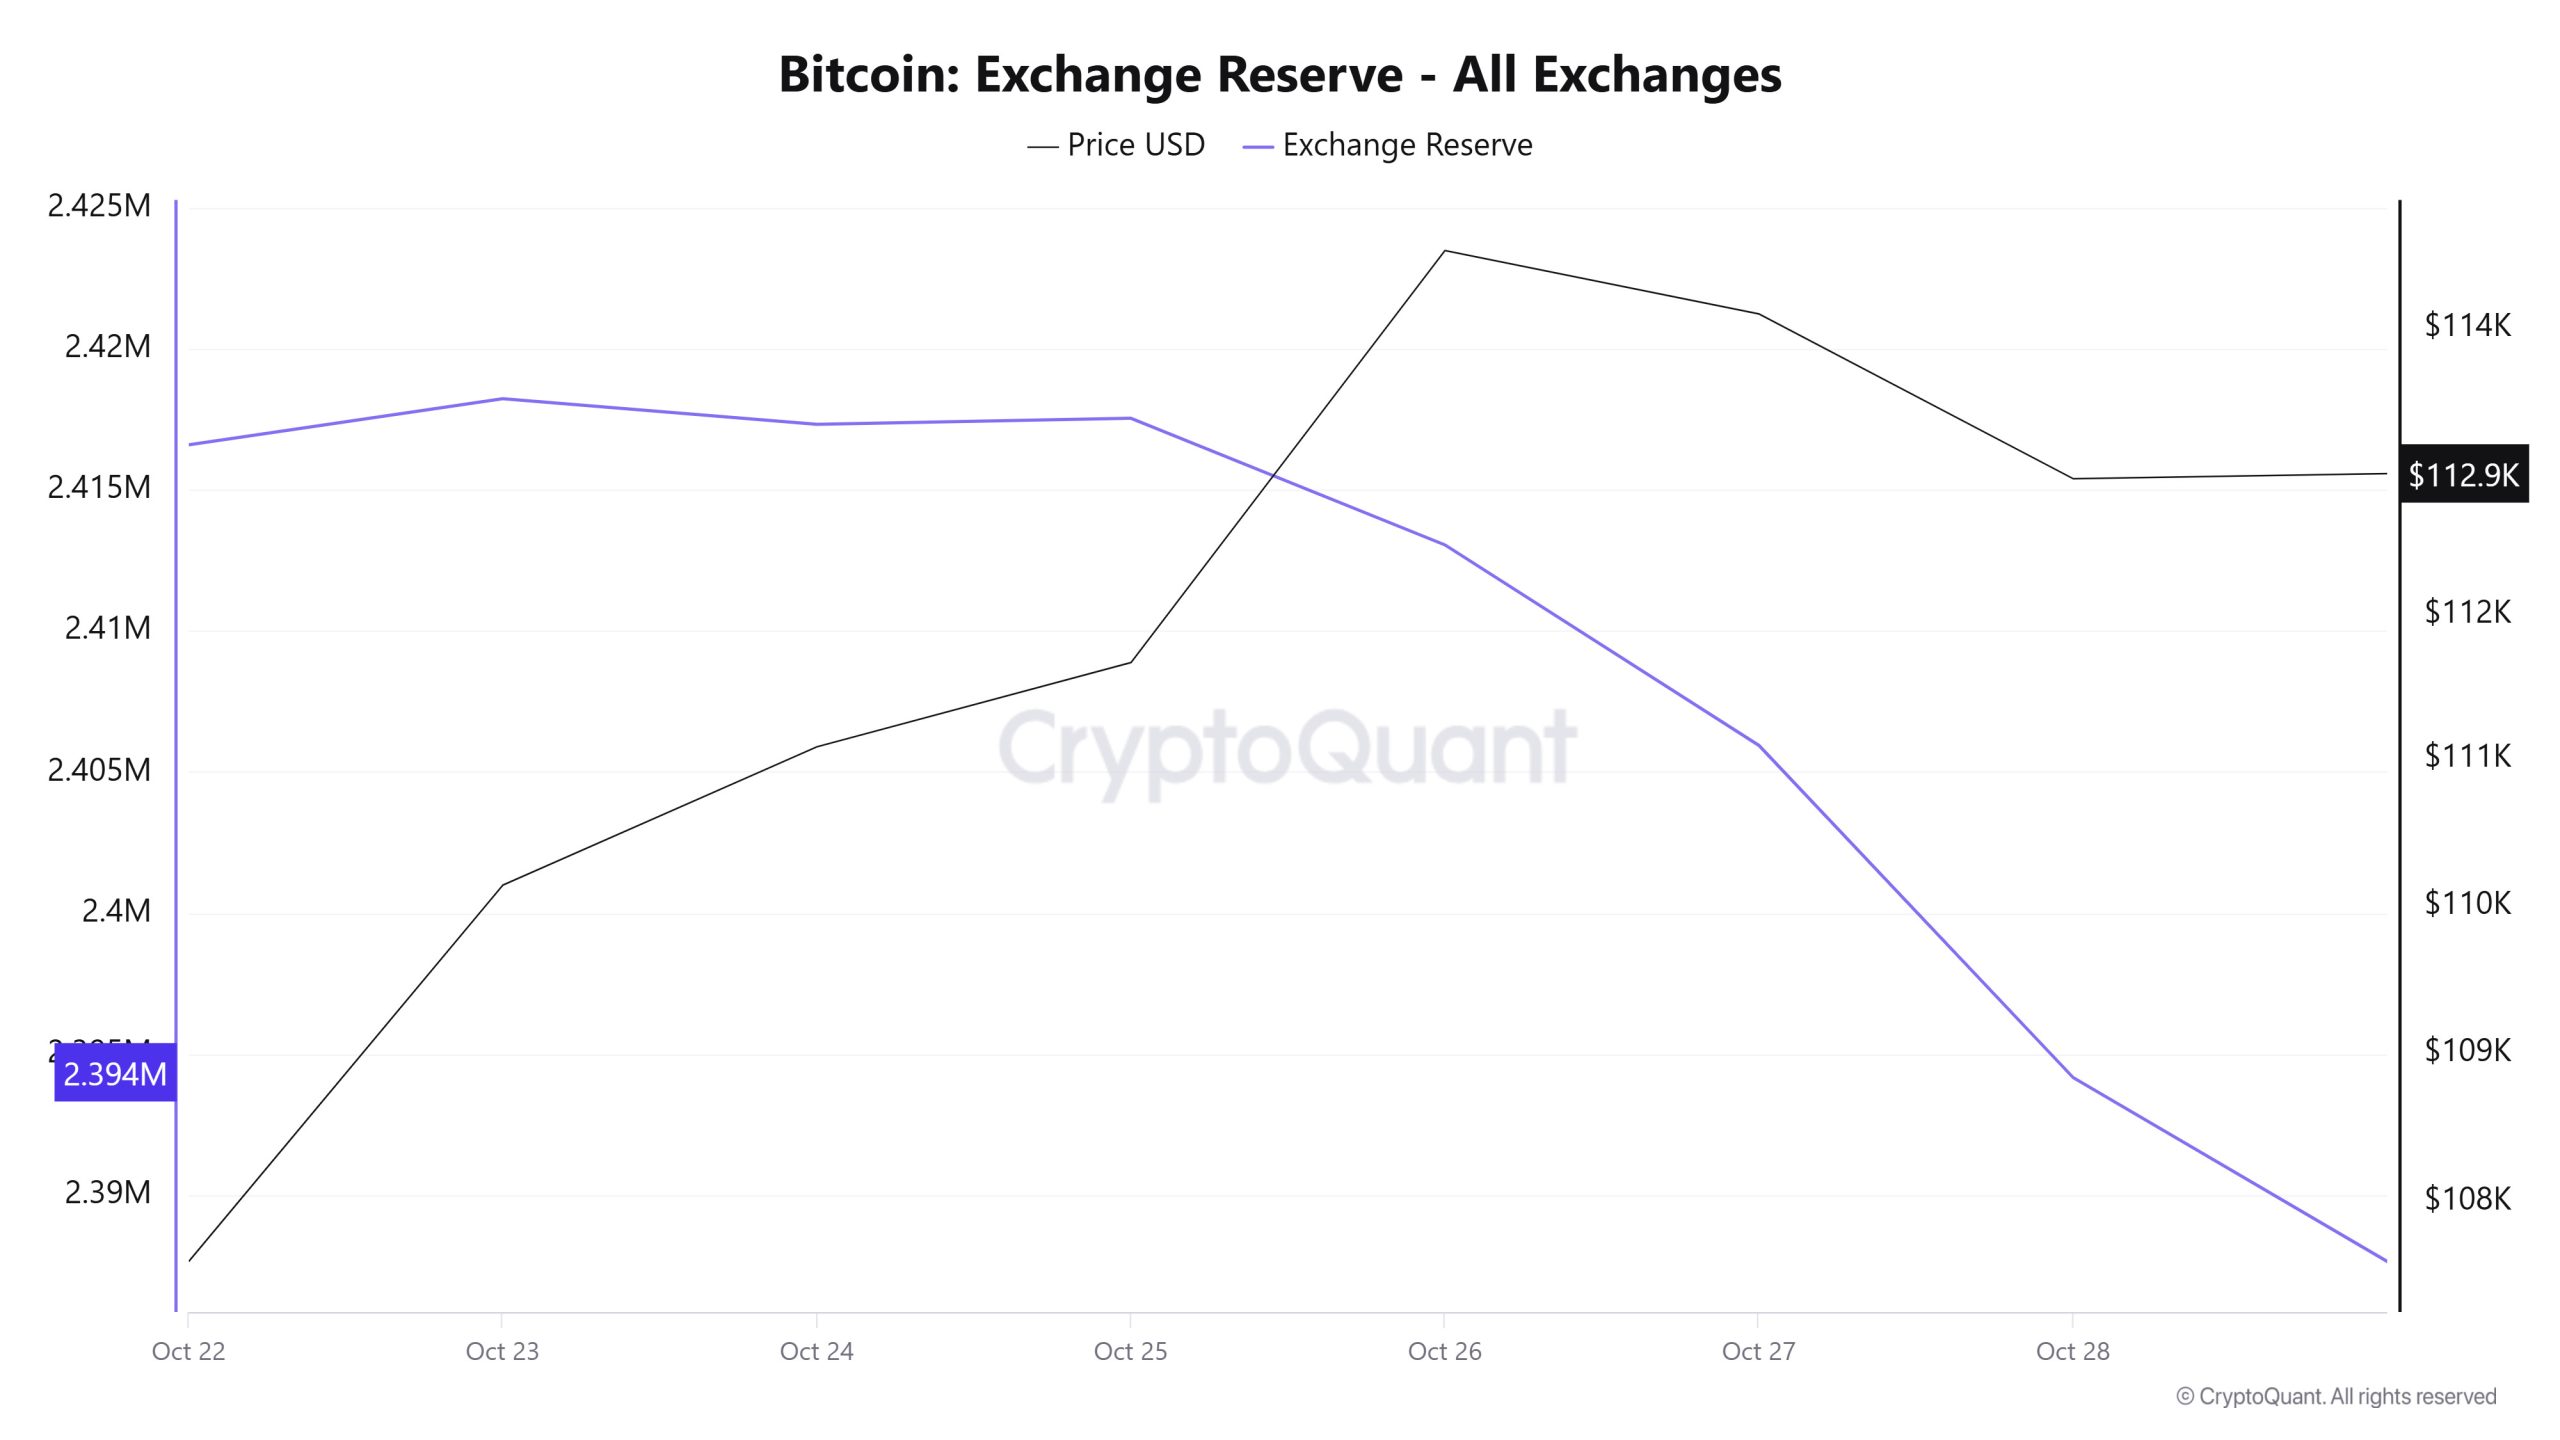
Between October 22 and 28, 2025, Bitcoin reserves el exchanges declined from approximately 2,423,471 BTC to 2,394,172 BTC, resulting en a net outflow of 29,299 BTC. During this period, exchange reserves decreased por 1.21%, while the Bitcoin price rose from $108,360 to $112,940, gaining 4.23% en value. The decline en exchange reserves while the price rose indicates that investors are inclined to hold for the long term rather than sell en the short term. In the short term, despite increased buying appetite, low-volume increases indicate that the market is proceeding cautiously. In the long term, the downward trend en reserves suggests that a potential supply shortage could support the price and that upward movements could strengthen en the coming weeks.
| Date | October 22 | 23-Oct | 24-Oct | 25-Oct | 26-Oct | 27-Oct | 28-Oct |
| Exchange Inflow | 29,192 | 26,611 | 24,578 | 9,908 | 13,330 | 30,622 | 26,756 |
| Exchange Outflow | 36,072 | 24,978 | 25,489 | 9,693 | 17,817 | 37,729 | 38,517 |
| Exchange Netflow | -6,880 | 1,632 | -911 | 215 | -4,487 | -7,107 | -11,761 |
| Exchange Reserve | 2,416,591 | 2,418,223 | 2,417,312 | 2,417,527 | 2,413,040 | 2,405,933 | 2,394,172 |
| BTC Price | 108,360 | 110,134 | 111,081 | 111,662 | 114,546 | 114,098 | 112,940 |
Fees and Revenues
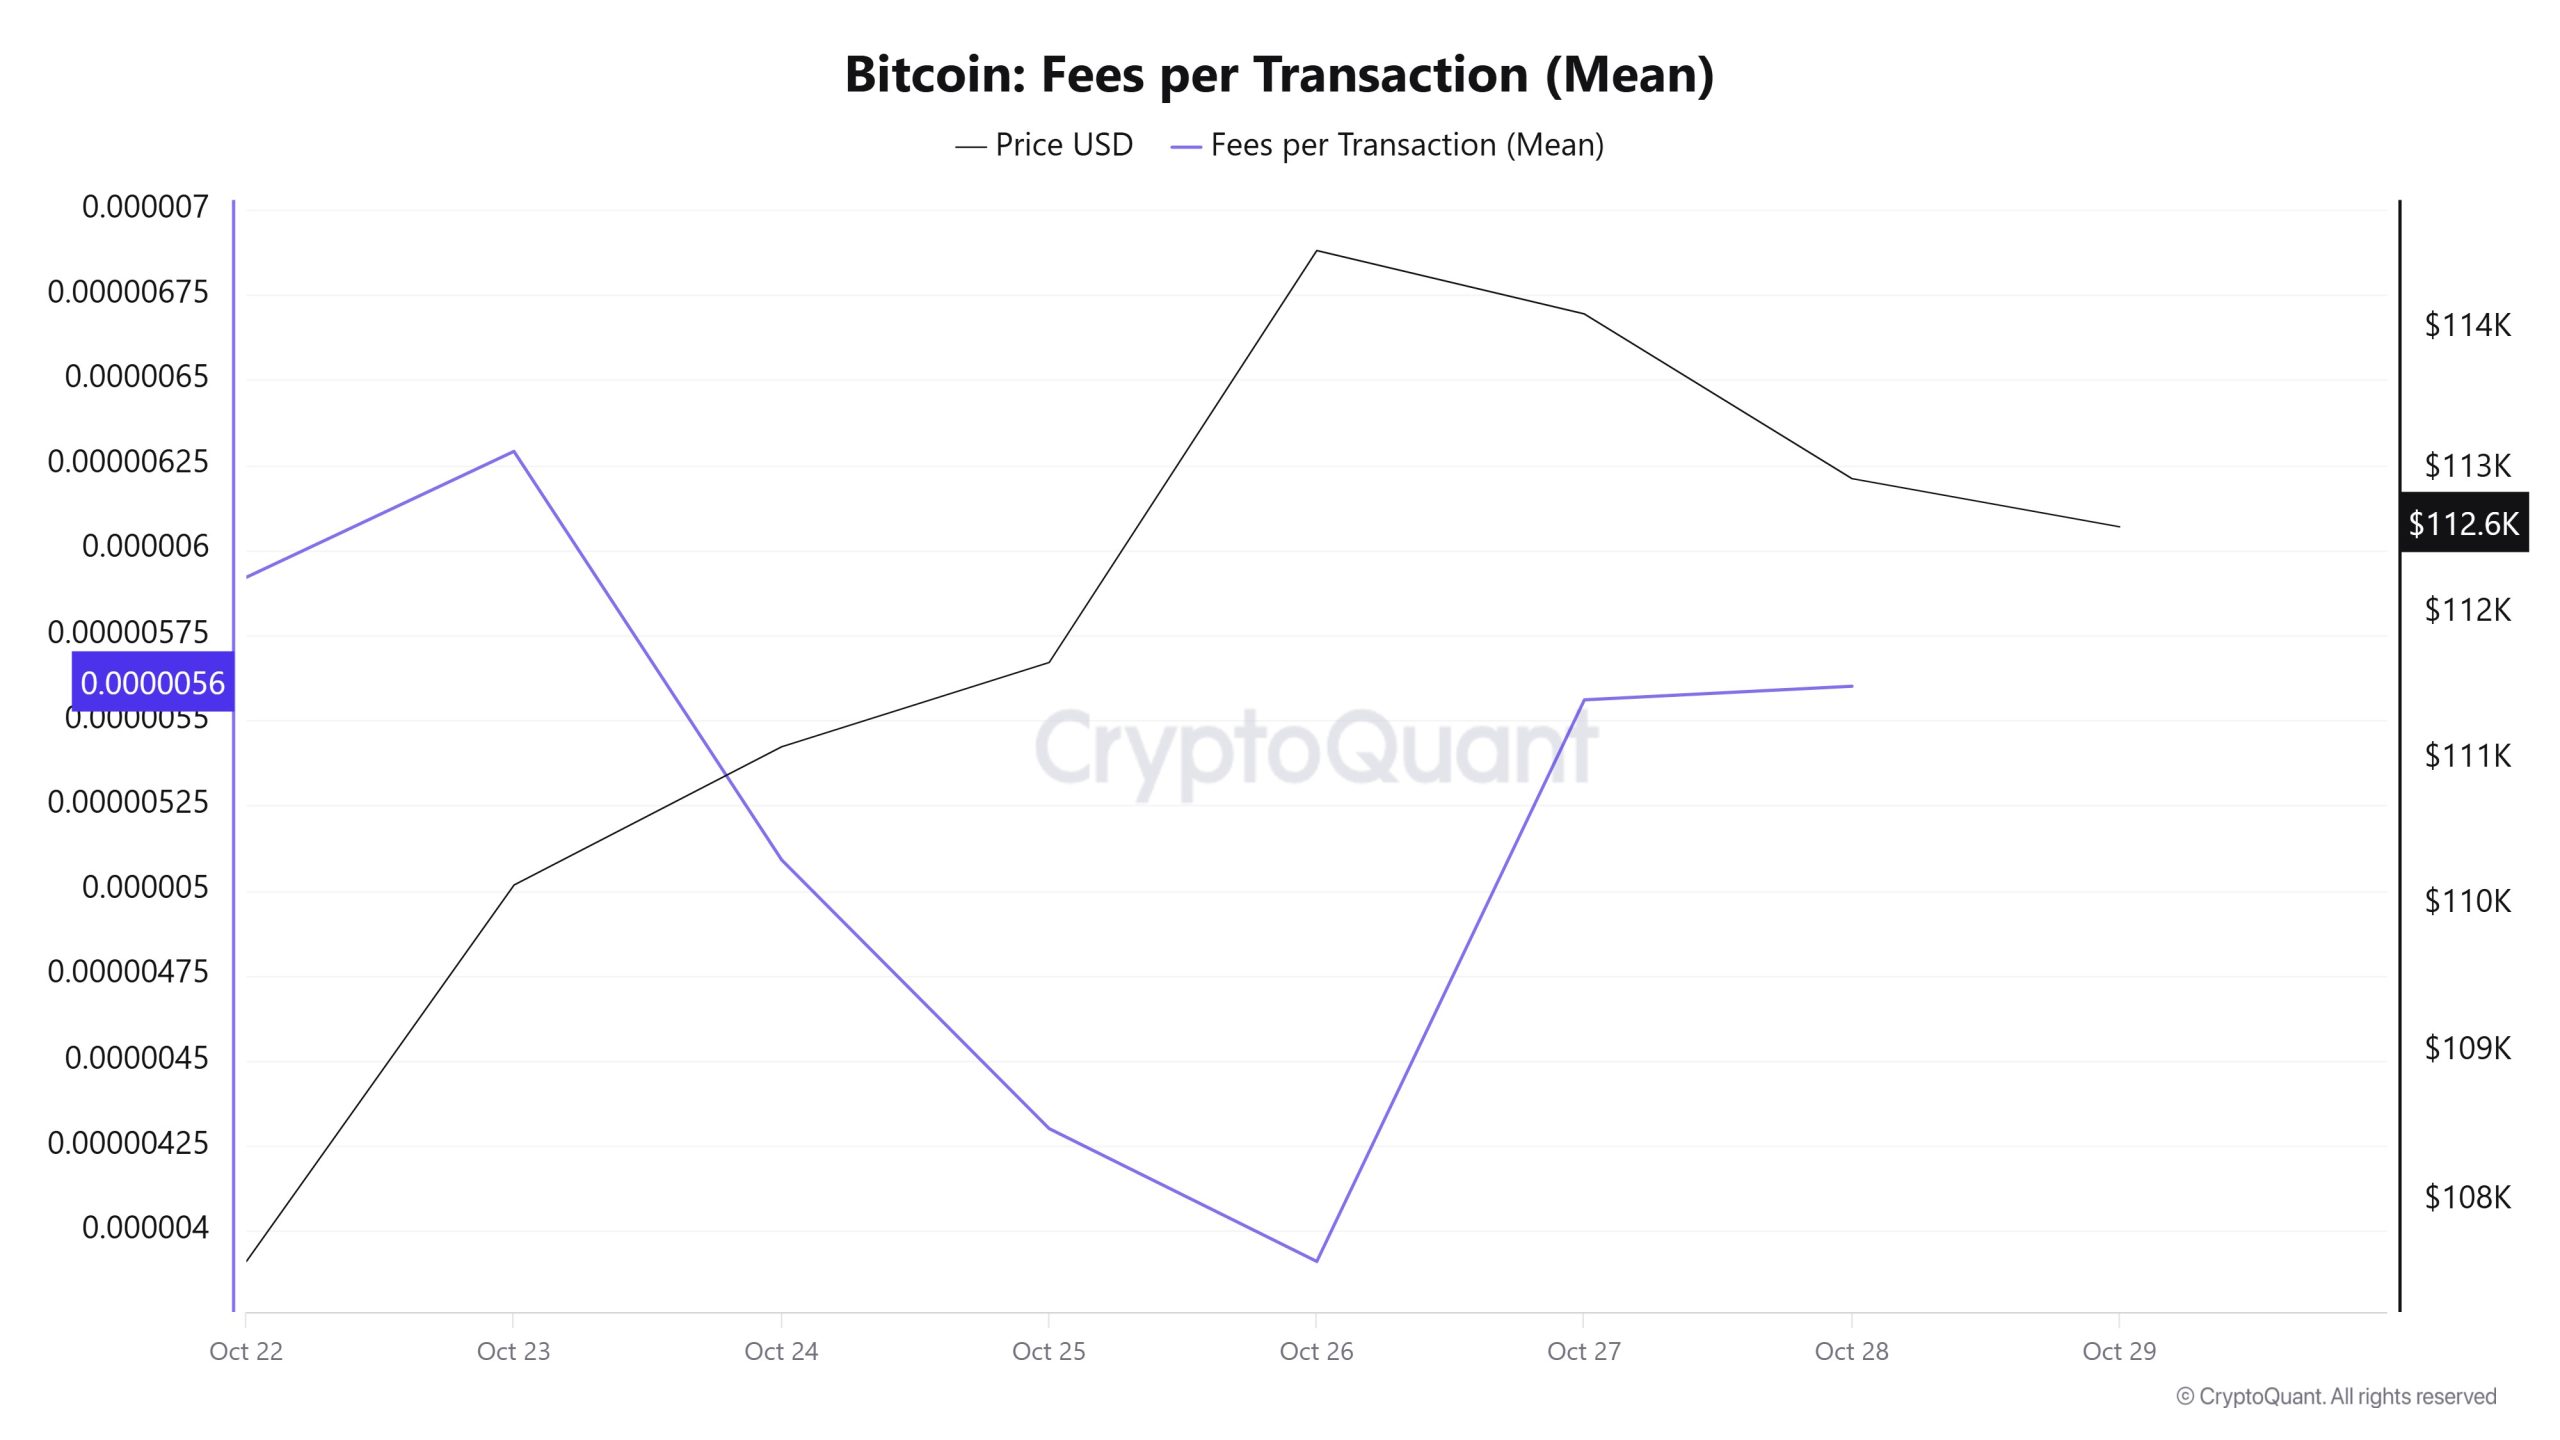
When examining the Bitcoin Fees per Transaction (Mean) data for the period between October 22-28, it is observed that the indicator reached 0.00000592 el October 22, the first day of the week.
As of October 23, the value en question reached its peak level, but after this date, it followed a volatile trend due to the impact of Bitcoin price volatility and declined to 0.00000391 el October 26.
In the following days, the Bitcoin Fees per Transaction (Mean) indicator resumed its upward trend, closing at 0.0000056 el October 28, the last day of the week.
Bitcoin: Fees (Total)
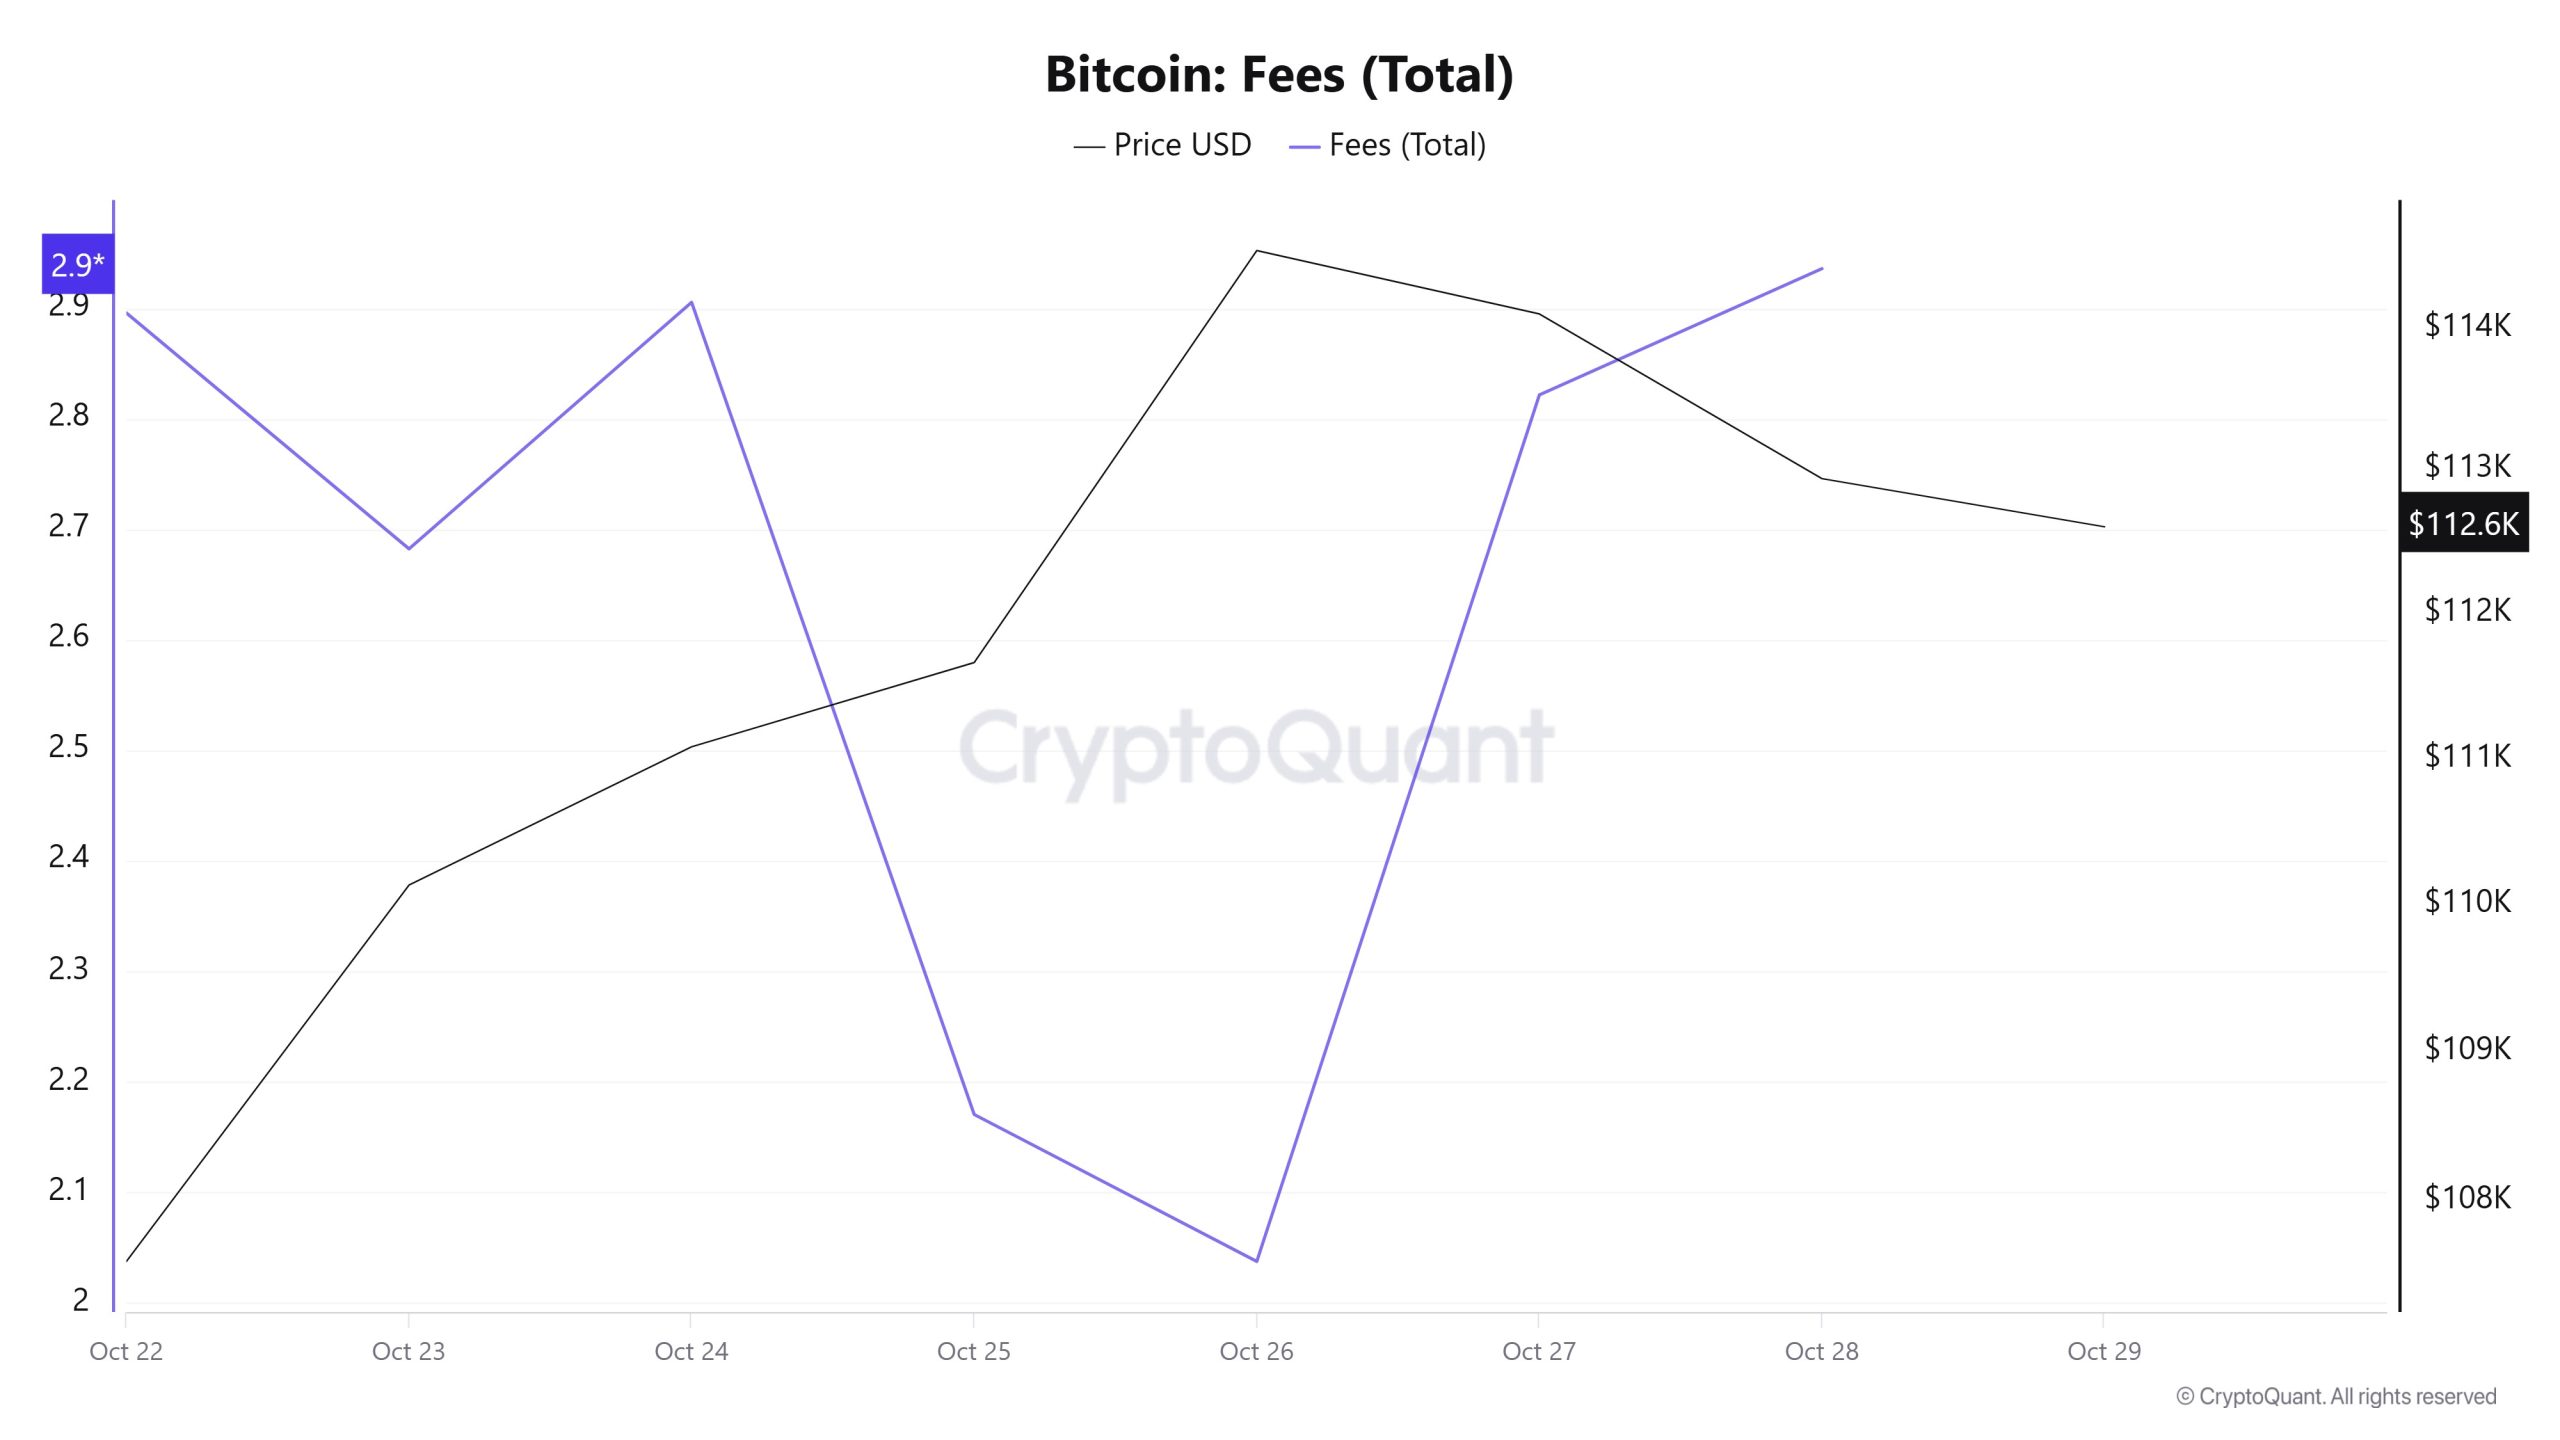
Similarly, when examining the Bitcoin Fees (Total) data between October 22 and 28, it is seen that the indicator reached 2.89572835 el October 22, the first day of the week.
As of October 24, the value en question reached its peak level, but subsequently followed a volatile trend due to the impact of Bitcoin price volatility, declining to 2.03701929 el October 26.
In the following days, the Bitcoin Fees (Total) indicator resumed its upward trend, closing at 2.93587872 el October 28, the last day of the week.
Miner Flows
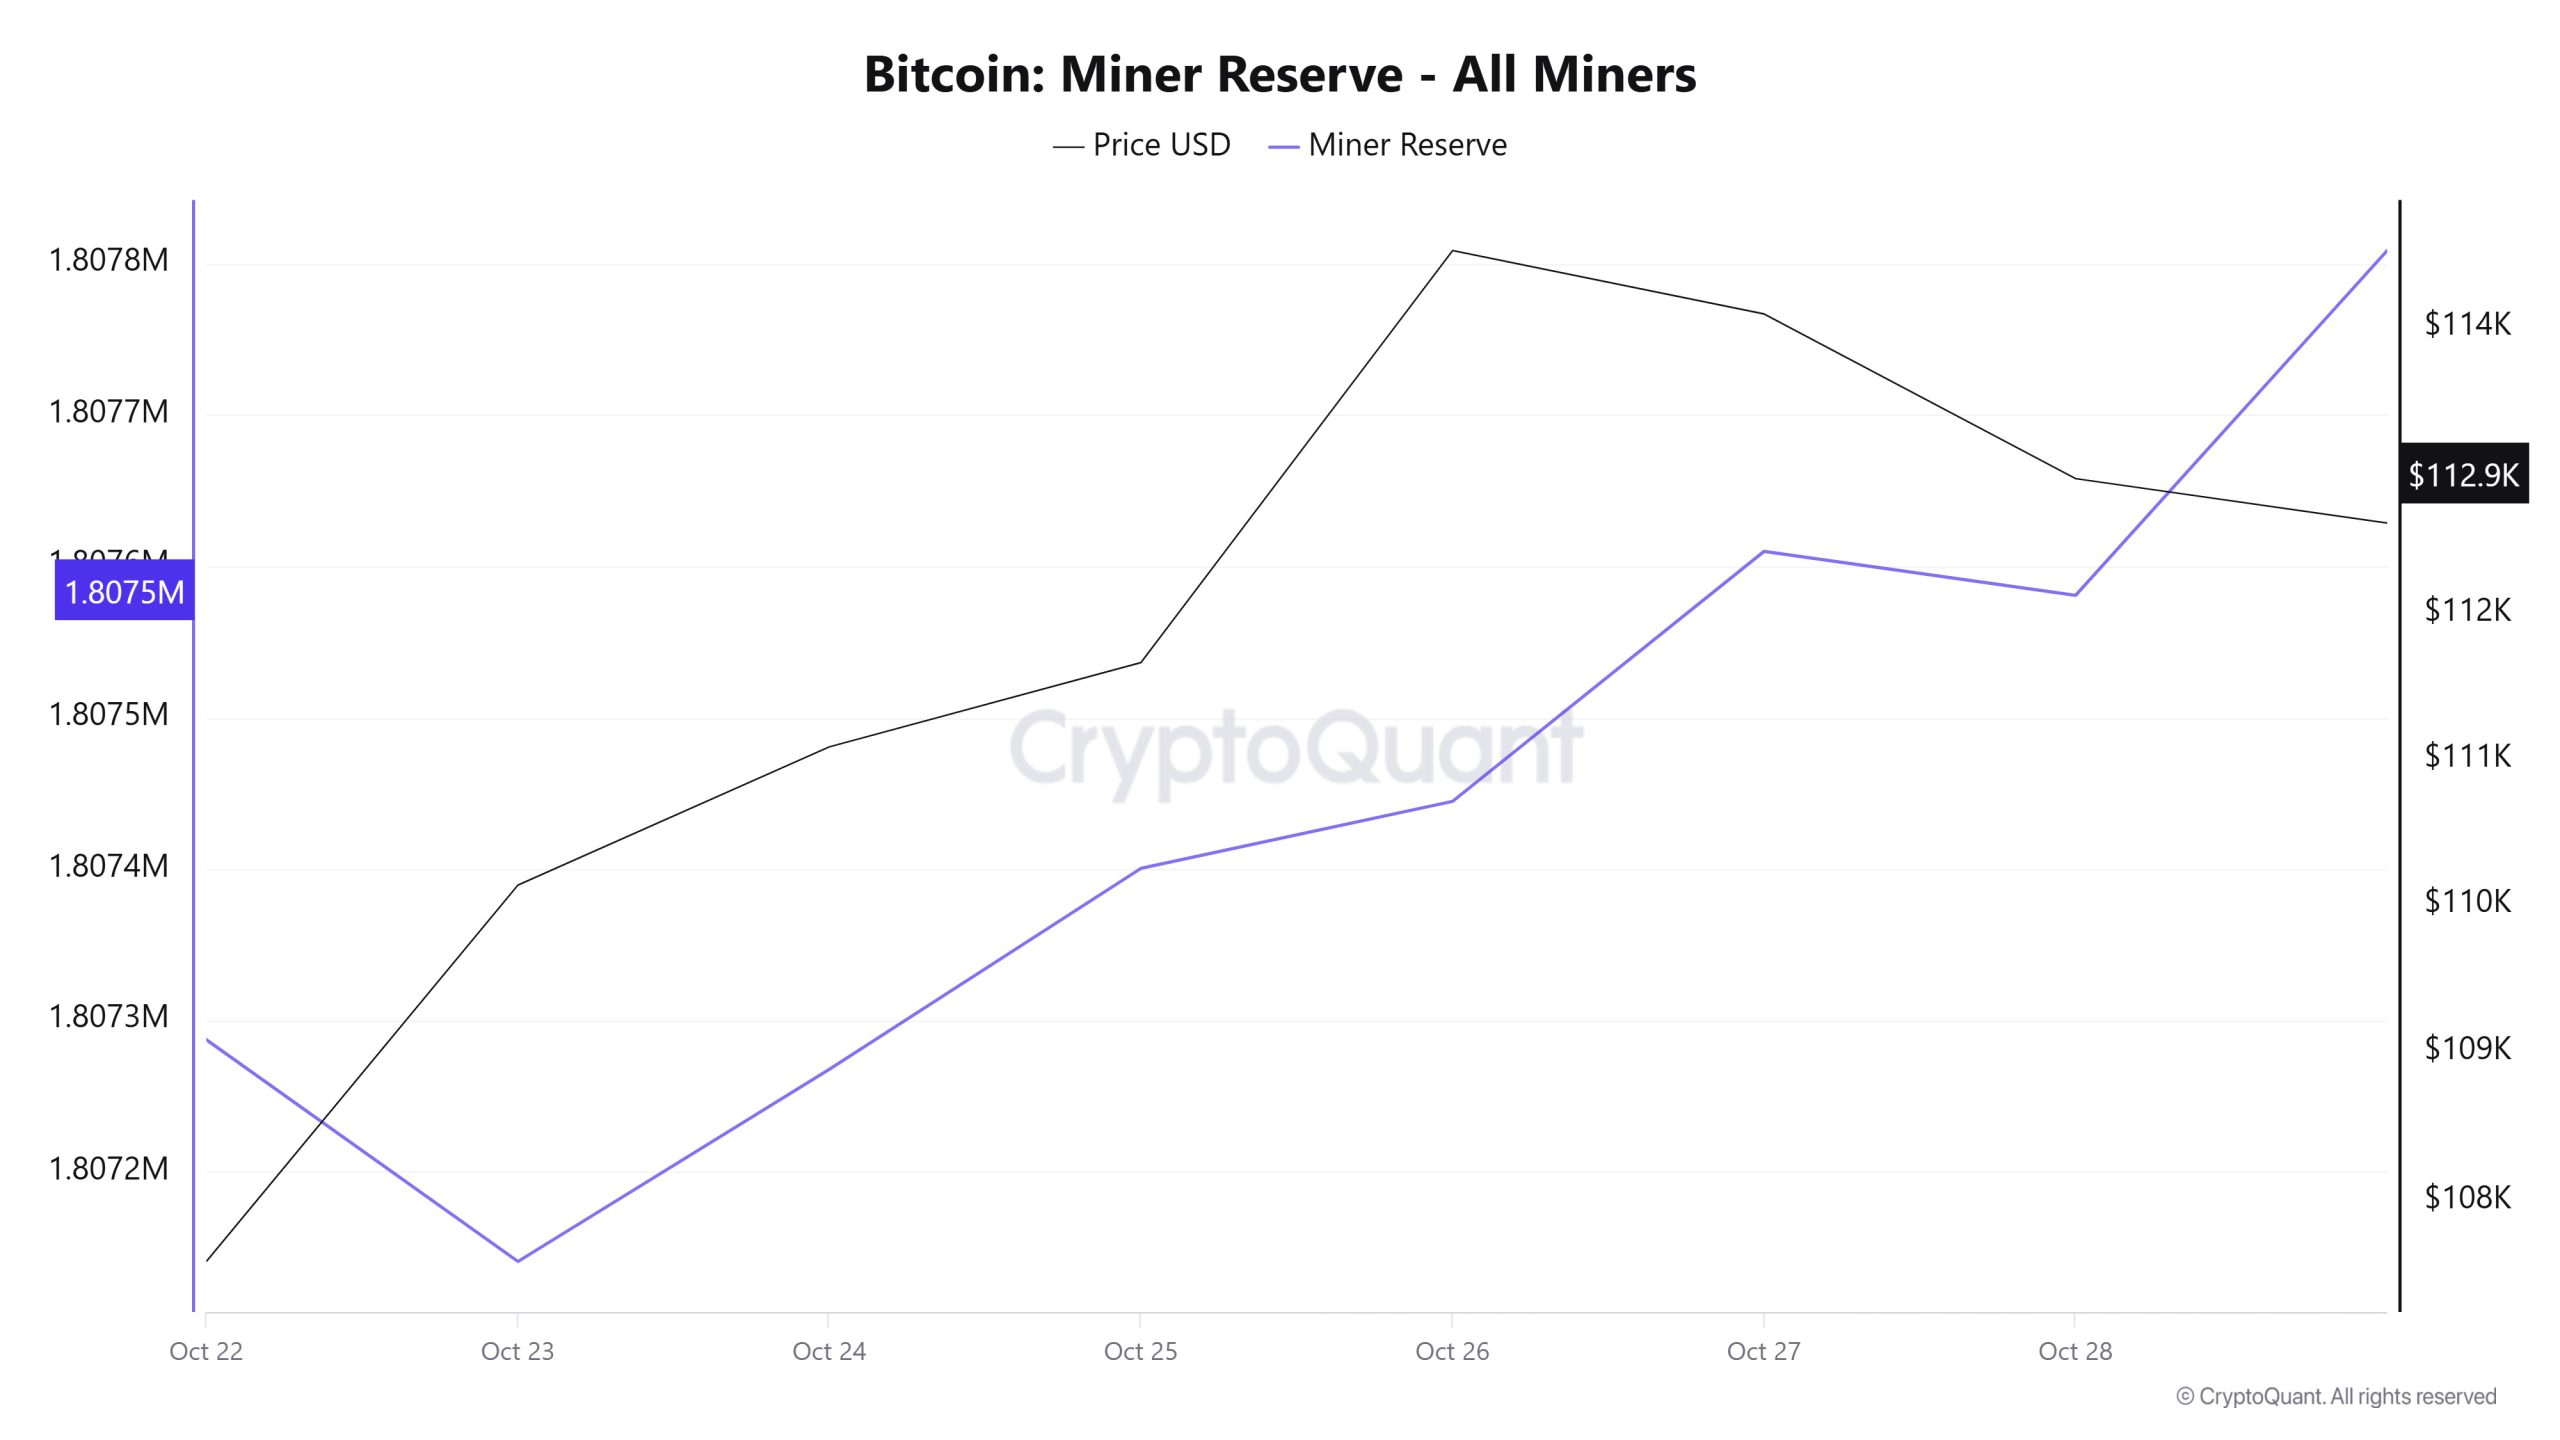
According to data obtained from the Miner Reserve table, an increase en Bitcoin reserves held en miners’ wallets has been observed this week. A time-dependent correlation structure between the Bitcoin price and miner reserve was observed during the analyzed time period. However, the general trend indicates that a positive correlation between these two variables is dominant.
Miner Inflow, Outflow, and Netflow
Between October 22 and 28, 38,864 Bitcoin were withdrawn from miners’ wallets, while 38,854 Bitcoin were deposited into miners’ wallets during the same period. This week’s Miner Netflow was 90 Bitcoin. Meanwhile, the Bitcoin price was $107,597 el October 22 and $112,940 el October 28.
Throughout the week, Bitcoin inflows into miner wallets (Miner Inflow) exceeded Bitcoin outflows from miner wallets (Miner Outflow), resulting en a positive net flow (Miner Netflow).
| Oct. 22 | Oct. 23 | Oct. 24 | Oct. 25 | Oct. 26 | Oct. 27 | Oct. 28 | |
| Miner Inflow | 8,257.49 | 5,405.42 | 7,316.98 | 3075.33 | 3,348.74 | 6,107.00 | 5,443.01 |
| Miner Outflow | 8461.74 | 5,551.97 | 7,189.83 | 2,942.59 | 3,304.47 | 5,941.75 | 5,472.07 |
| Miner Netflow | -204.25 | -146.55 | 127.15 | 132.74 | 44.27 | 165.25 | -29.06 |
Transaction
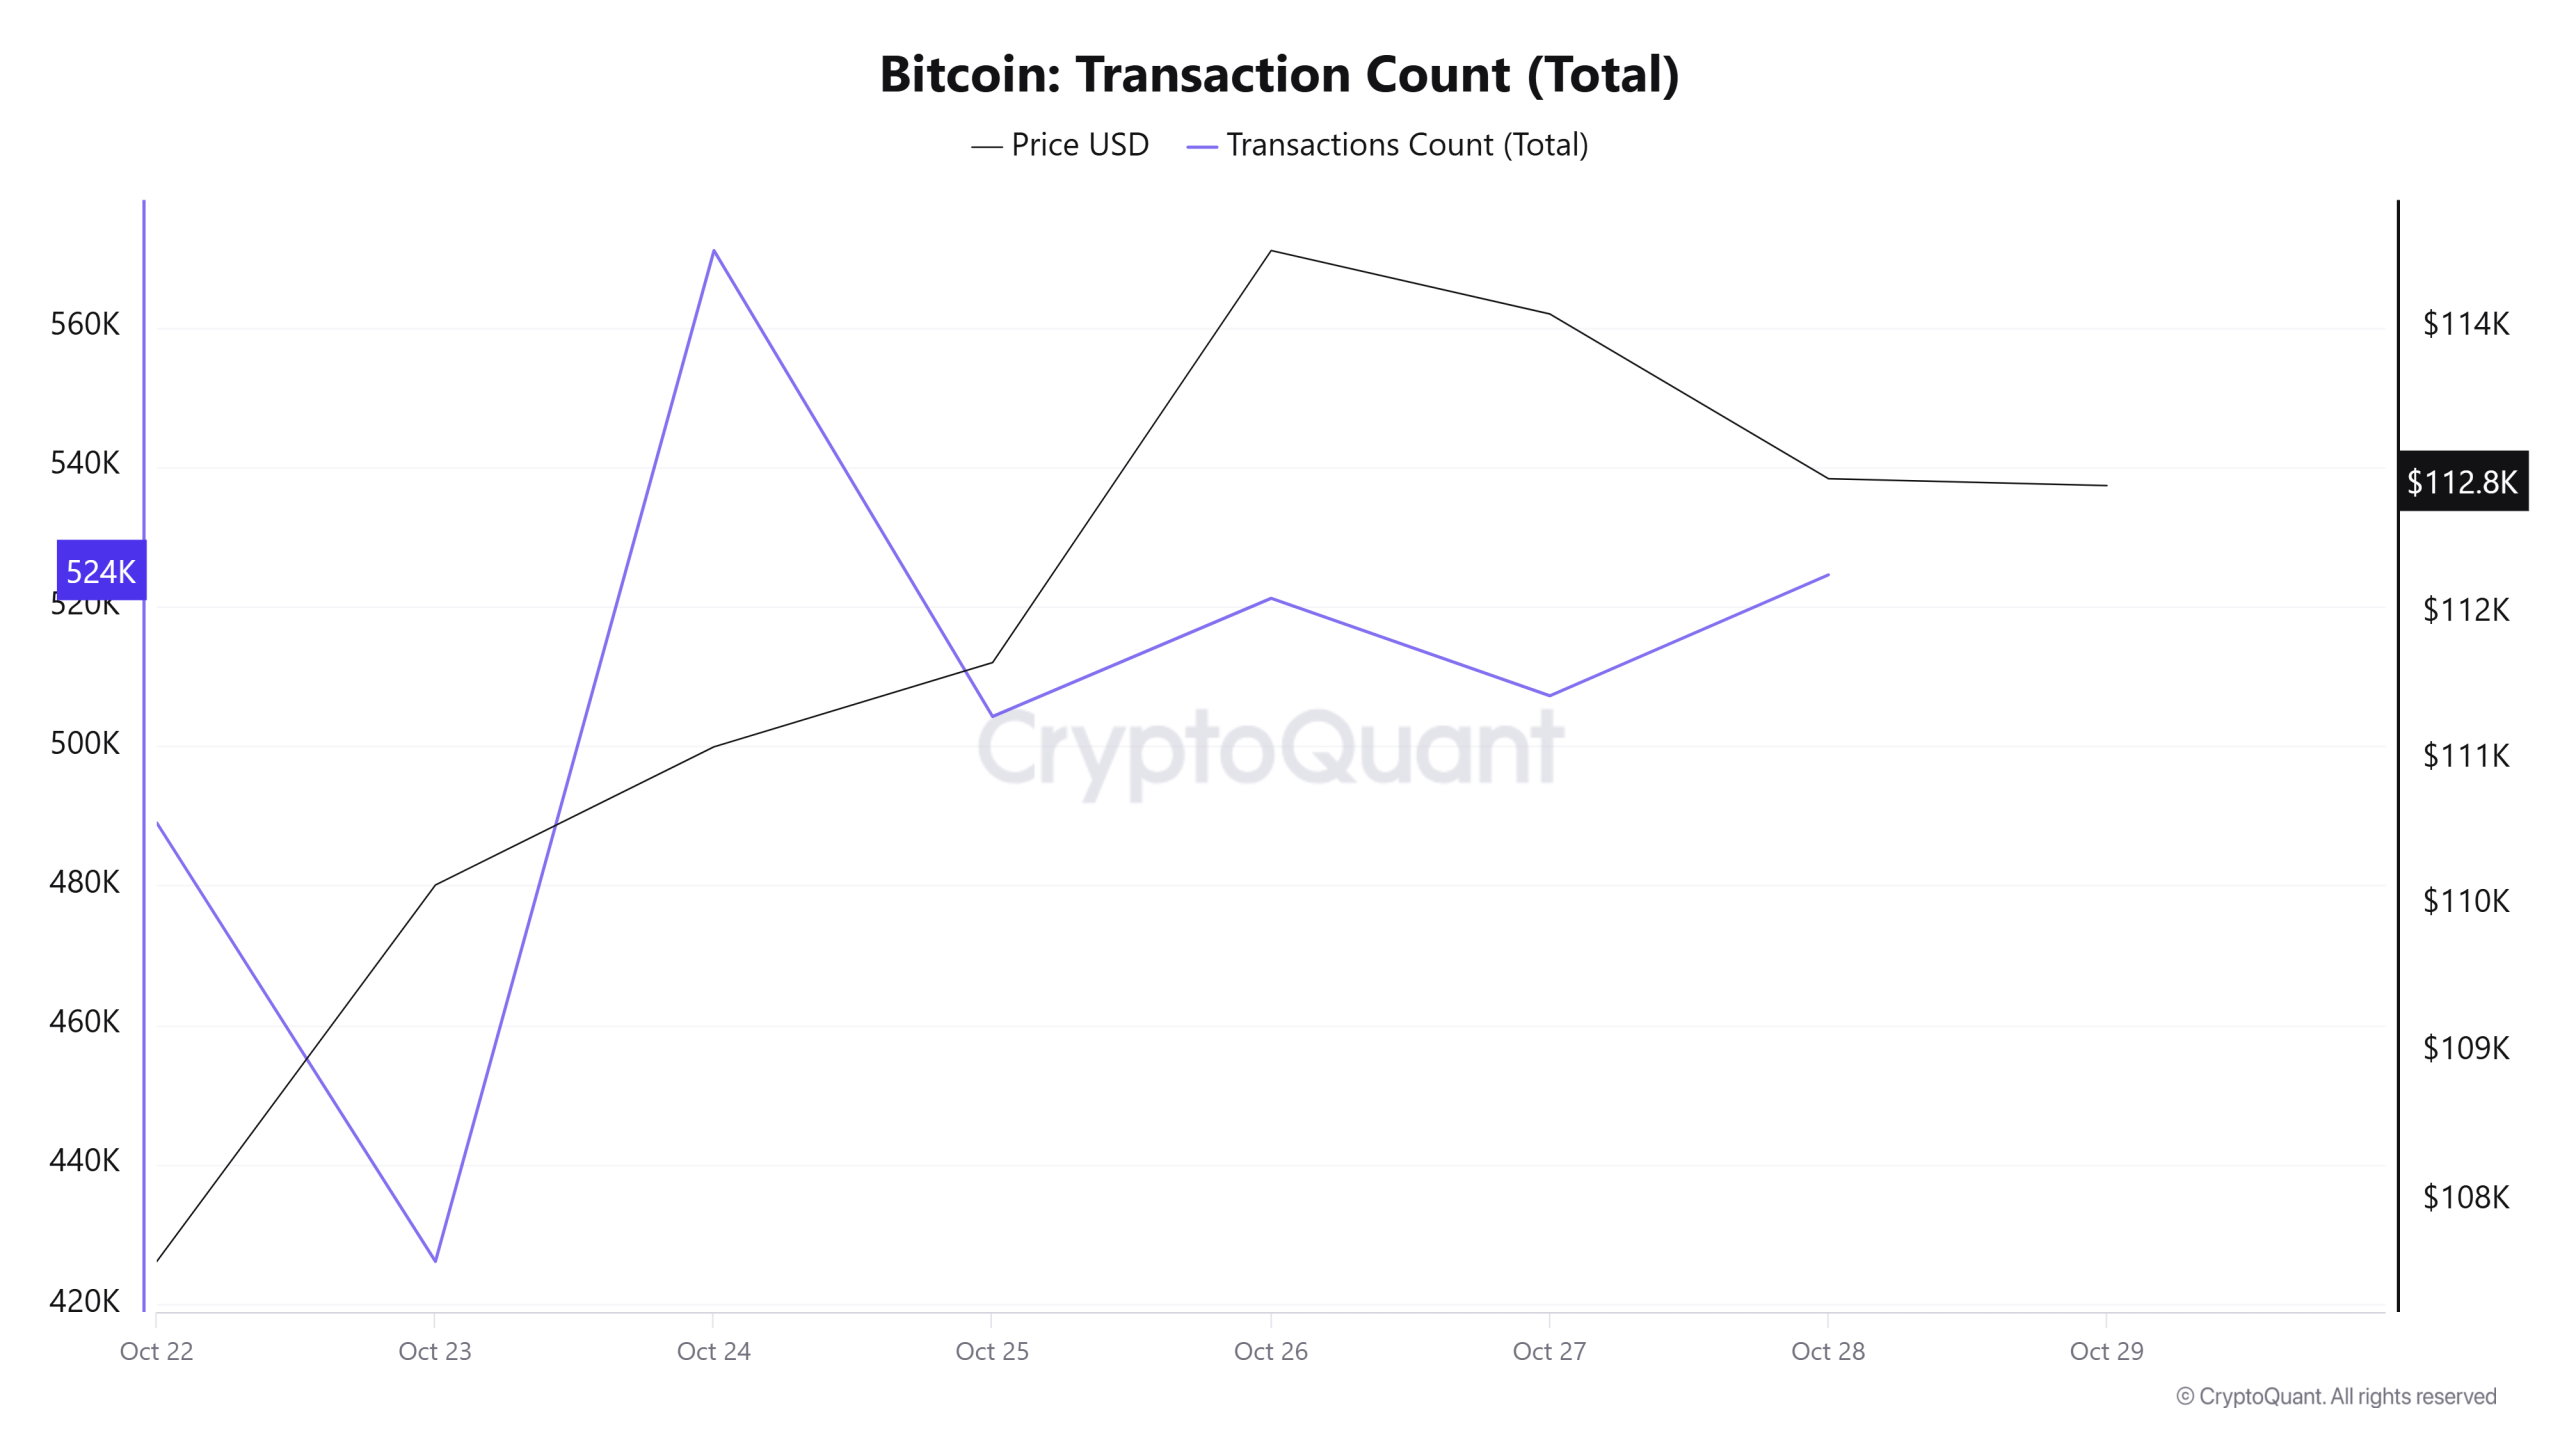
Last week, 3,317,616 transactions were executed el the Bitcoin network, while this week the number of transactions increased por 6.8% to reach 3,543,306. The highest transaction volume of the week was recorded el October 24 at 571,033, while the lowest number of transactions was recorded el October 23 at 426,118. When examining the relationship between transaction count and price, a balanced correlation was observed throughout the week. This indicates that sales-oriented transfers and purchase-oriented transfers occurred at similar intensities el the Bitcoin network, suggesting that the market is going through an uncertain but balanced period. On the other hand, high-intensity movements that occurred over the weekend but were not among the week’s lowest transaction days reinforce the possibility that the market continues to be more voluminous and volatile el weekends compared to weekdays.
Tokens Transferred
Last week, a total of 5,432,483 BTC was transferred, while this week it decreased por 13.5% to 4,697,165 BTC. The highest daily transfer of the week was 740,695 BTC el October 22, while the lowest transfer volume was recorded el October 25 at 516,973 BTC. The correlation between the amount of tokens transferred and the price fluctuated el a weekly basis but was predominantly negative. Transfer volumes declined rapidly between October 22 and 25, but recovered between October 25 and 28, managing to exceed previous levels.
While the amount of Bitcoin transferred decreased, the number of transactions increased, indicating that during this period, transactions were not high en value but rather lower en volume and more frequent. This pattern suggests that the network exhibited active but cautious user behavior.
Whale Activities
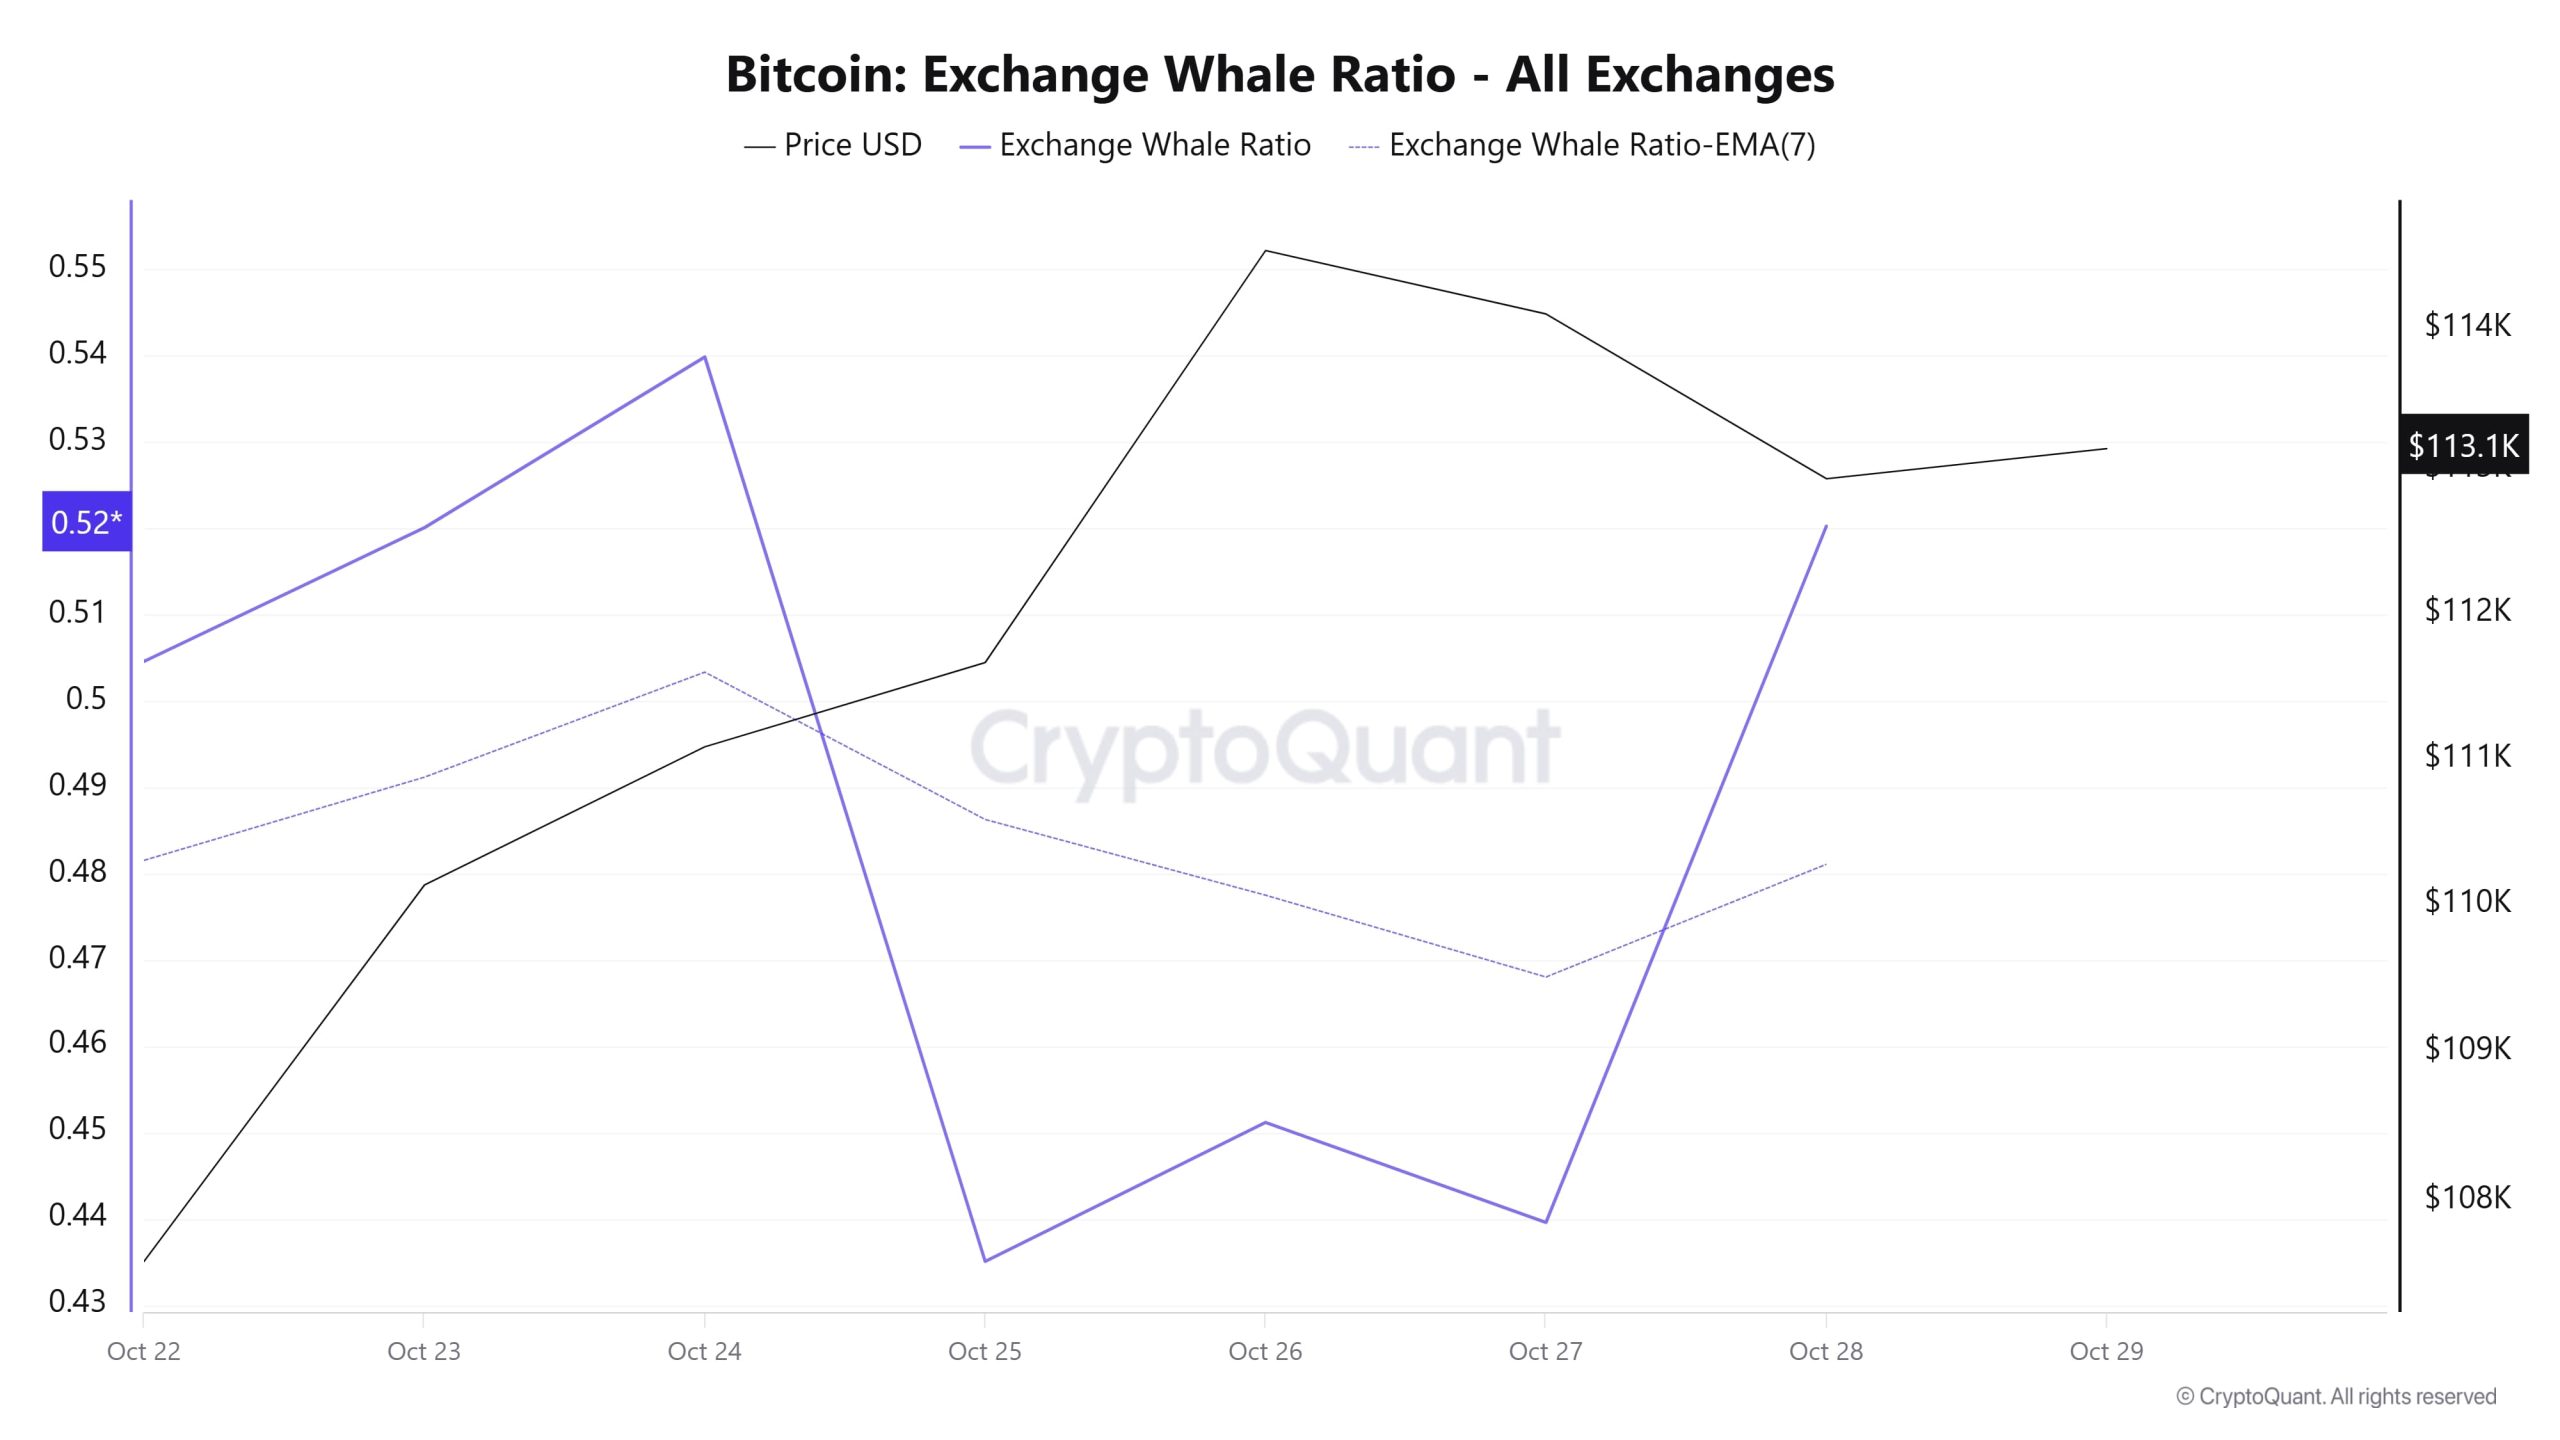
Whale Data:
Looking at whale activity el centralized exchanges over the last 7 days based el crypto market data, the metric showed a slight increase at the beginning of the process, then declined until the middle of the process, and rose again after the middle of the process. Looking at the Exchange Whale Ratio metric, el October 23, the first day of the 7-day period, the ratio of whales using centralized exchanges was 0.504. On October 24, the metric reached its peak at 0.539. The metric then declined, reaching its lowest point el October 25 at 0.435. When this ratio is above the 0.35–0.45 range, it generally indicates that whales are frequently using centralized exchanges. Currently at 0.520, the metric indicates that whales are frequently using centralized exchanges and that there is selling pressure. During this period, BTC traded between $107,500 and $116,000. At the same time, total BTC transfers decreased por 13% compared to last week, with 4,697,174 BTC moving. Whales are increasingly transferring their crypto assets to exchange-traded funds (ETFs). Data shows that whales are accumulating more Bitcoin. Between September and October, there was a significant increase en accumulation as Bitcoin moved from exchanges to whale wallets. This strategic accumulation is seen as preparation for a possible future price increase. In contrast, the number of addresses belonging to whales holding between 10,000 and 100,000 dollars worth of BTC continues to decline. On the other hand, it showed that addresses holding between 100 and 1,000 Bitcoin continue to increase. As a result, the current el-chain dynamics, coupled with market uncertainty and high liquidations, indicate that the market is currently en equilibrium.
BTC Onchain Overall
| Metric | Positive 📈 | Negative 📉 | Neutral ➖ |
| Active Addresses | ✓ | ||
| Breakdowns | ✓ | ||
| Derivatives | ✓ | ||
| Supply Distribution | ✓ | ||
| Exchange Supply Ratio | ✓ | ||
| Exchange Reserve | ✓ | ||
| Fees and Revenues | ✓ | ||
| Miner Flows | ✓ | ||
| Transaction | ✓ | ||
| Whale Activity | ✓ |
*The metrics and guidance provided en the table do not alone explain or imply any expectation of future price changes for any asset. Digital asset prices can fluctuate based el many different variables. The el-chain analysis and related guidance are intended to assist investors en their decision-making process, and basing financial investments solely el the results of this analysis may lead to unfavorable outcomes. Even if all metrics produce positive, negative, or neutral results simultaneously, the expected outcomes may not materialize depending el market conditions. It would be beneficial for investors reviewing the report to take these warnings into consideration.
Legal Notice
The investment information, comments, and recommendations contained en this document do not constitute investment advisory services. Investment advisory services are provided por authorized institutions el a personal basis, taking into account the risk and return preferences of individuals. The comments and recommendations contained en this document are of a general nature. These recommendations may not be suitable for your financial situation and risk and return preferences. Therefore, making an investment decision based solely el the information contained en this document may not result en outcomes that align with your expectations.
NOTE: All data used en Bitcoin el-chain analysis is based el CryptoQuant.