
Weekly Bitcoin Onchain Report – December 3
Active Addresses
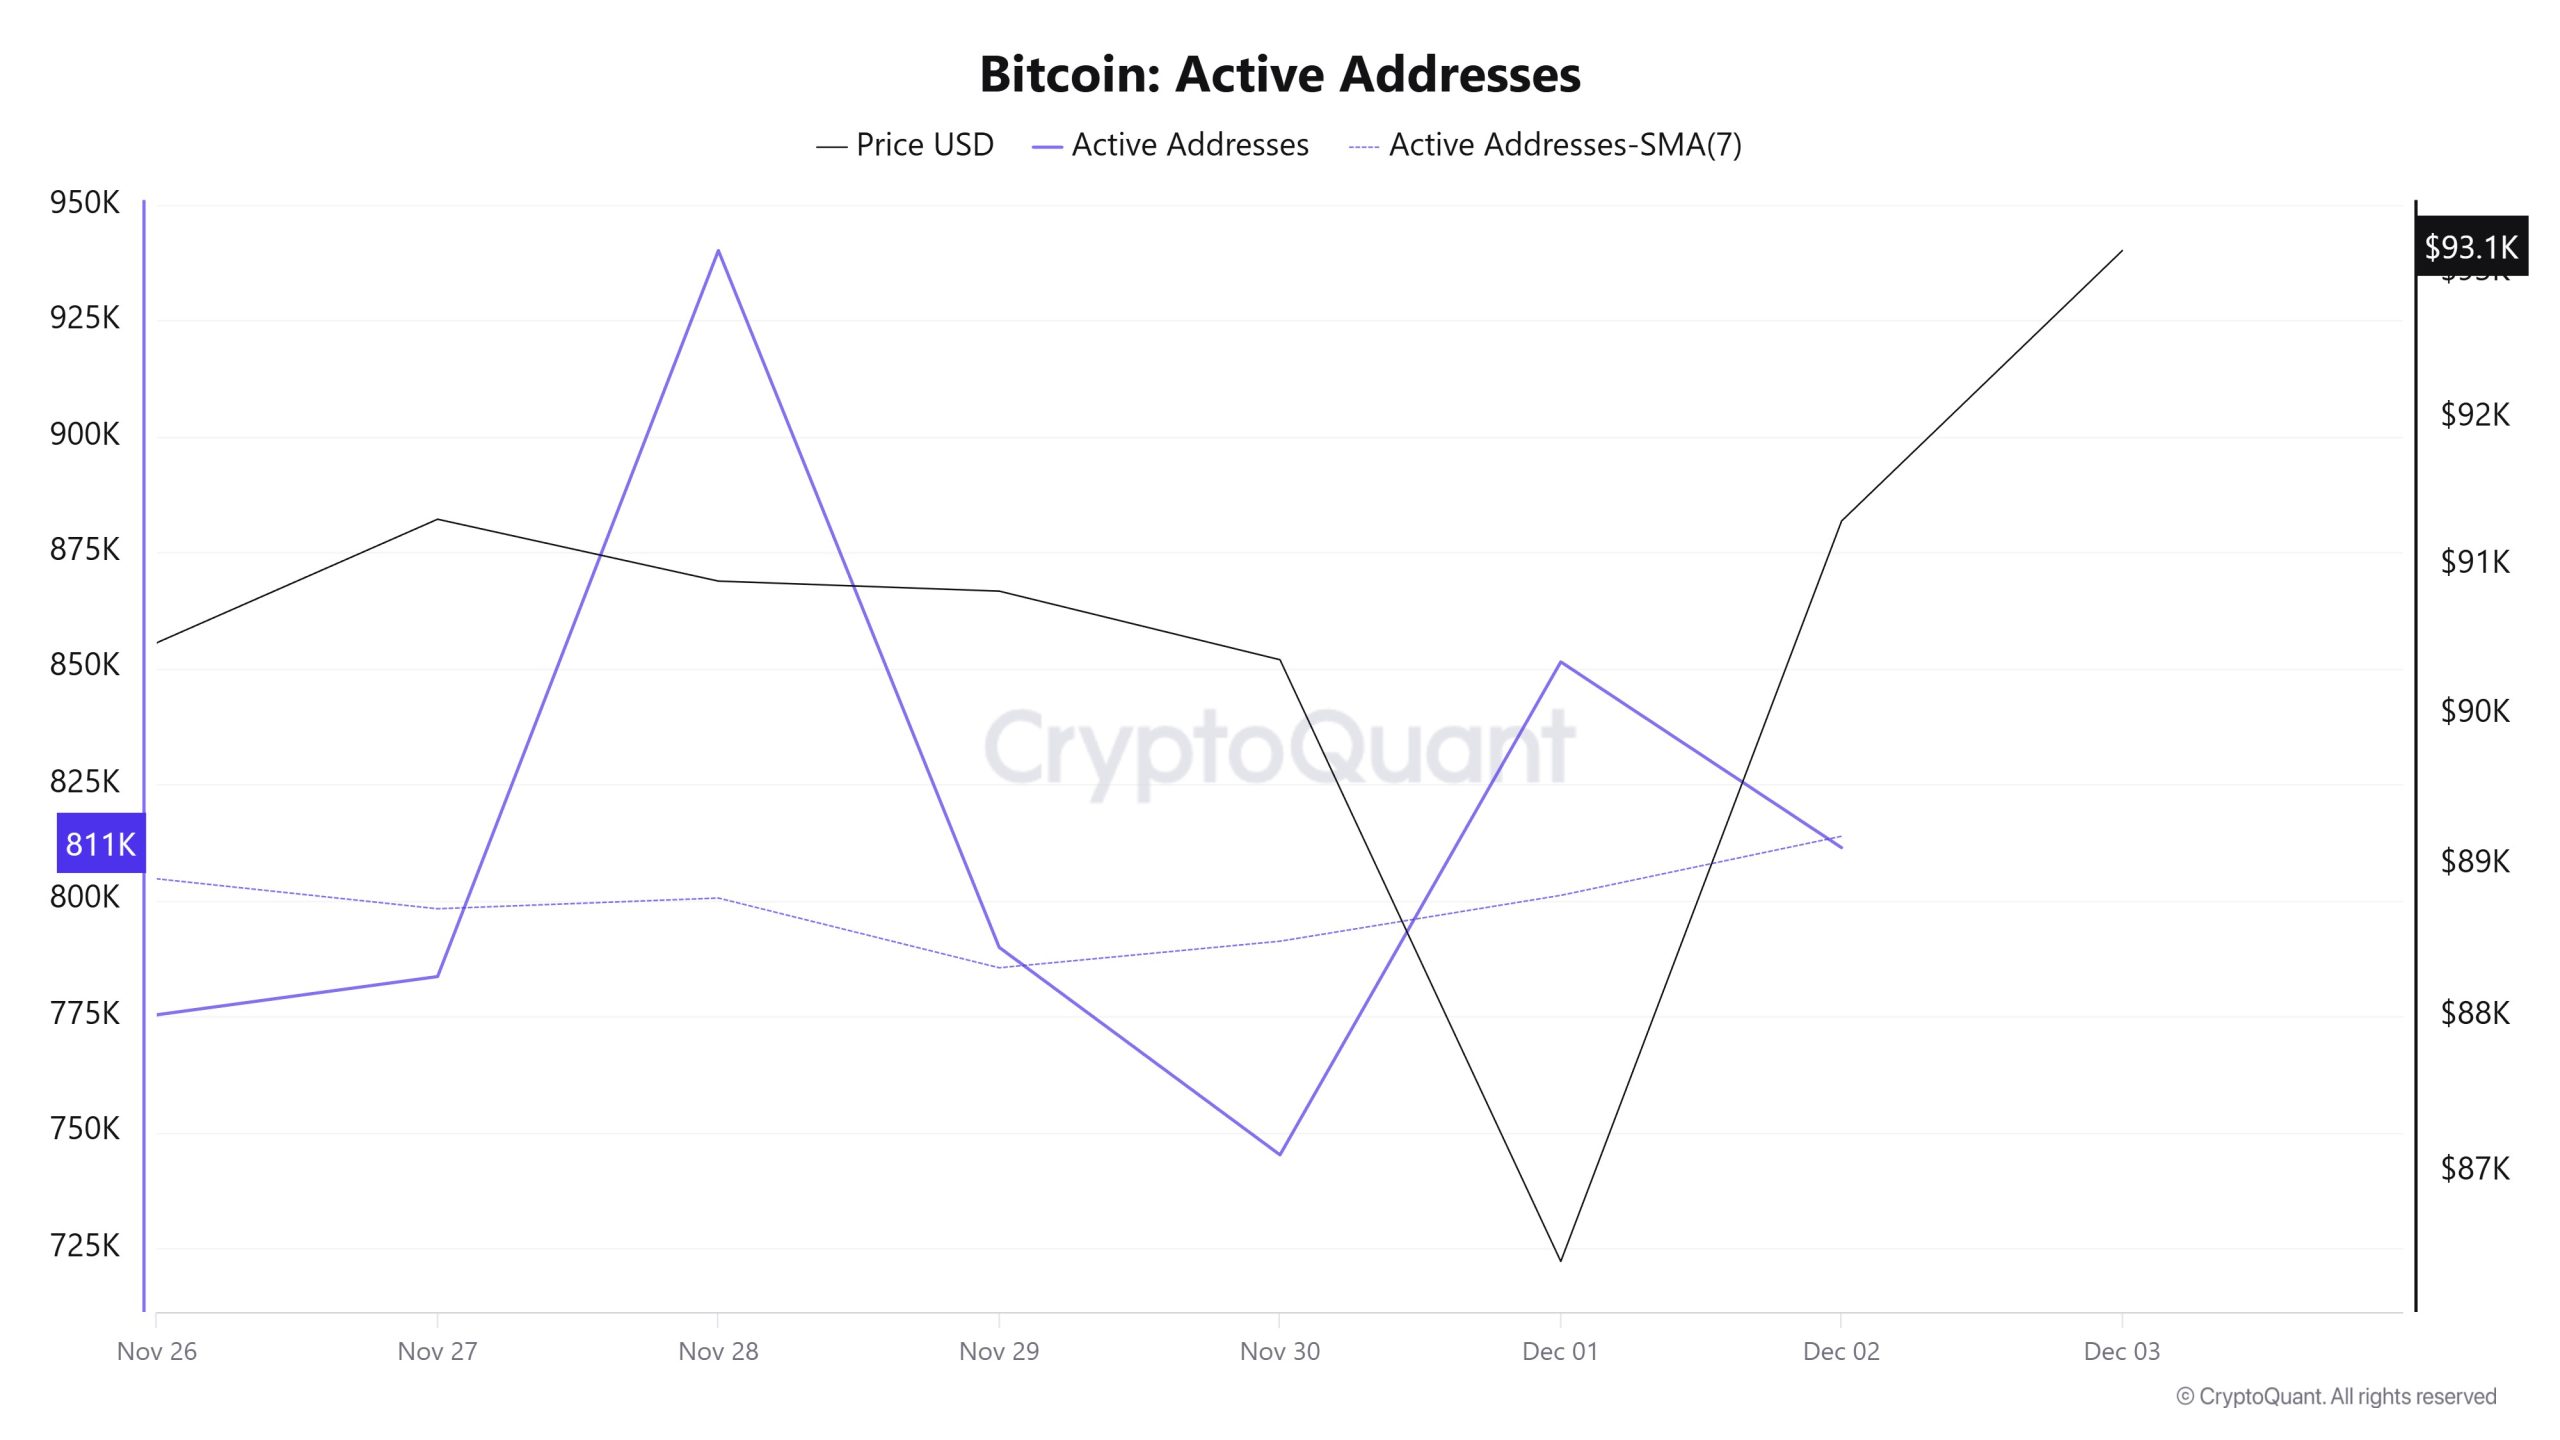
Between November 26 and December 3, 940,106 active addresses were added to the Bitcoin network. During this period, the Bitcoin price dropped to $86,000. From a technical perspective, the 7-day simple moving average (SMA) shows a downward trend.
Active Sending Addresses
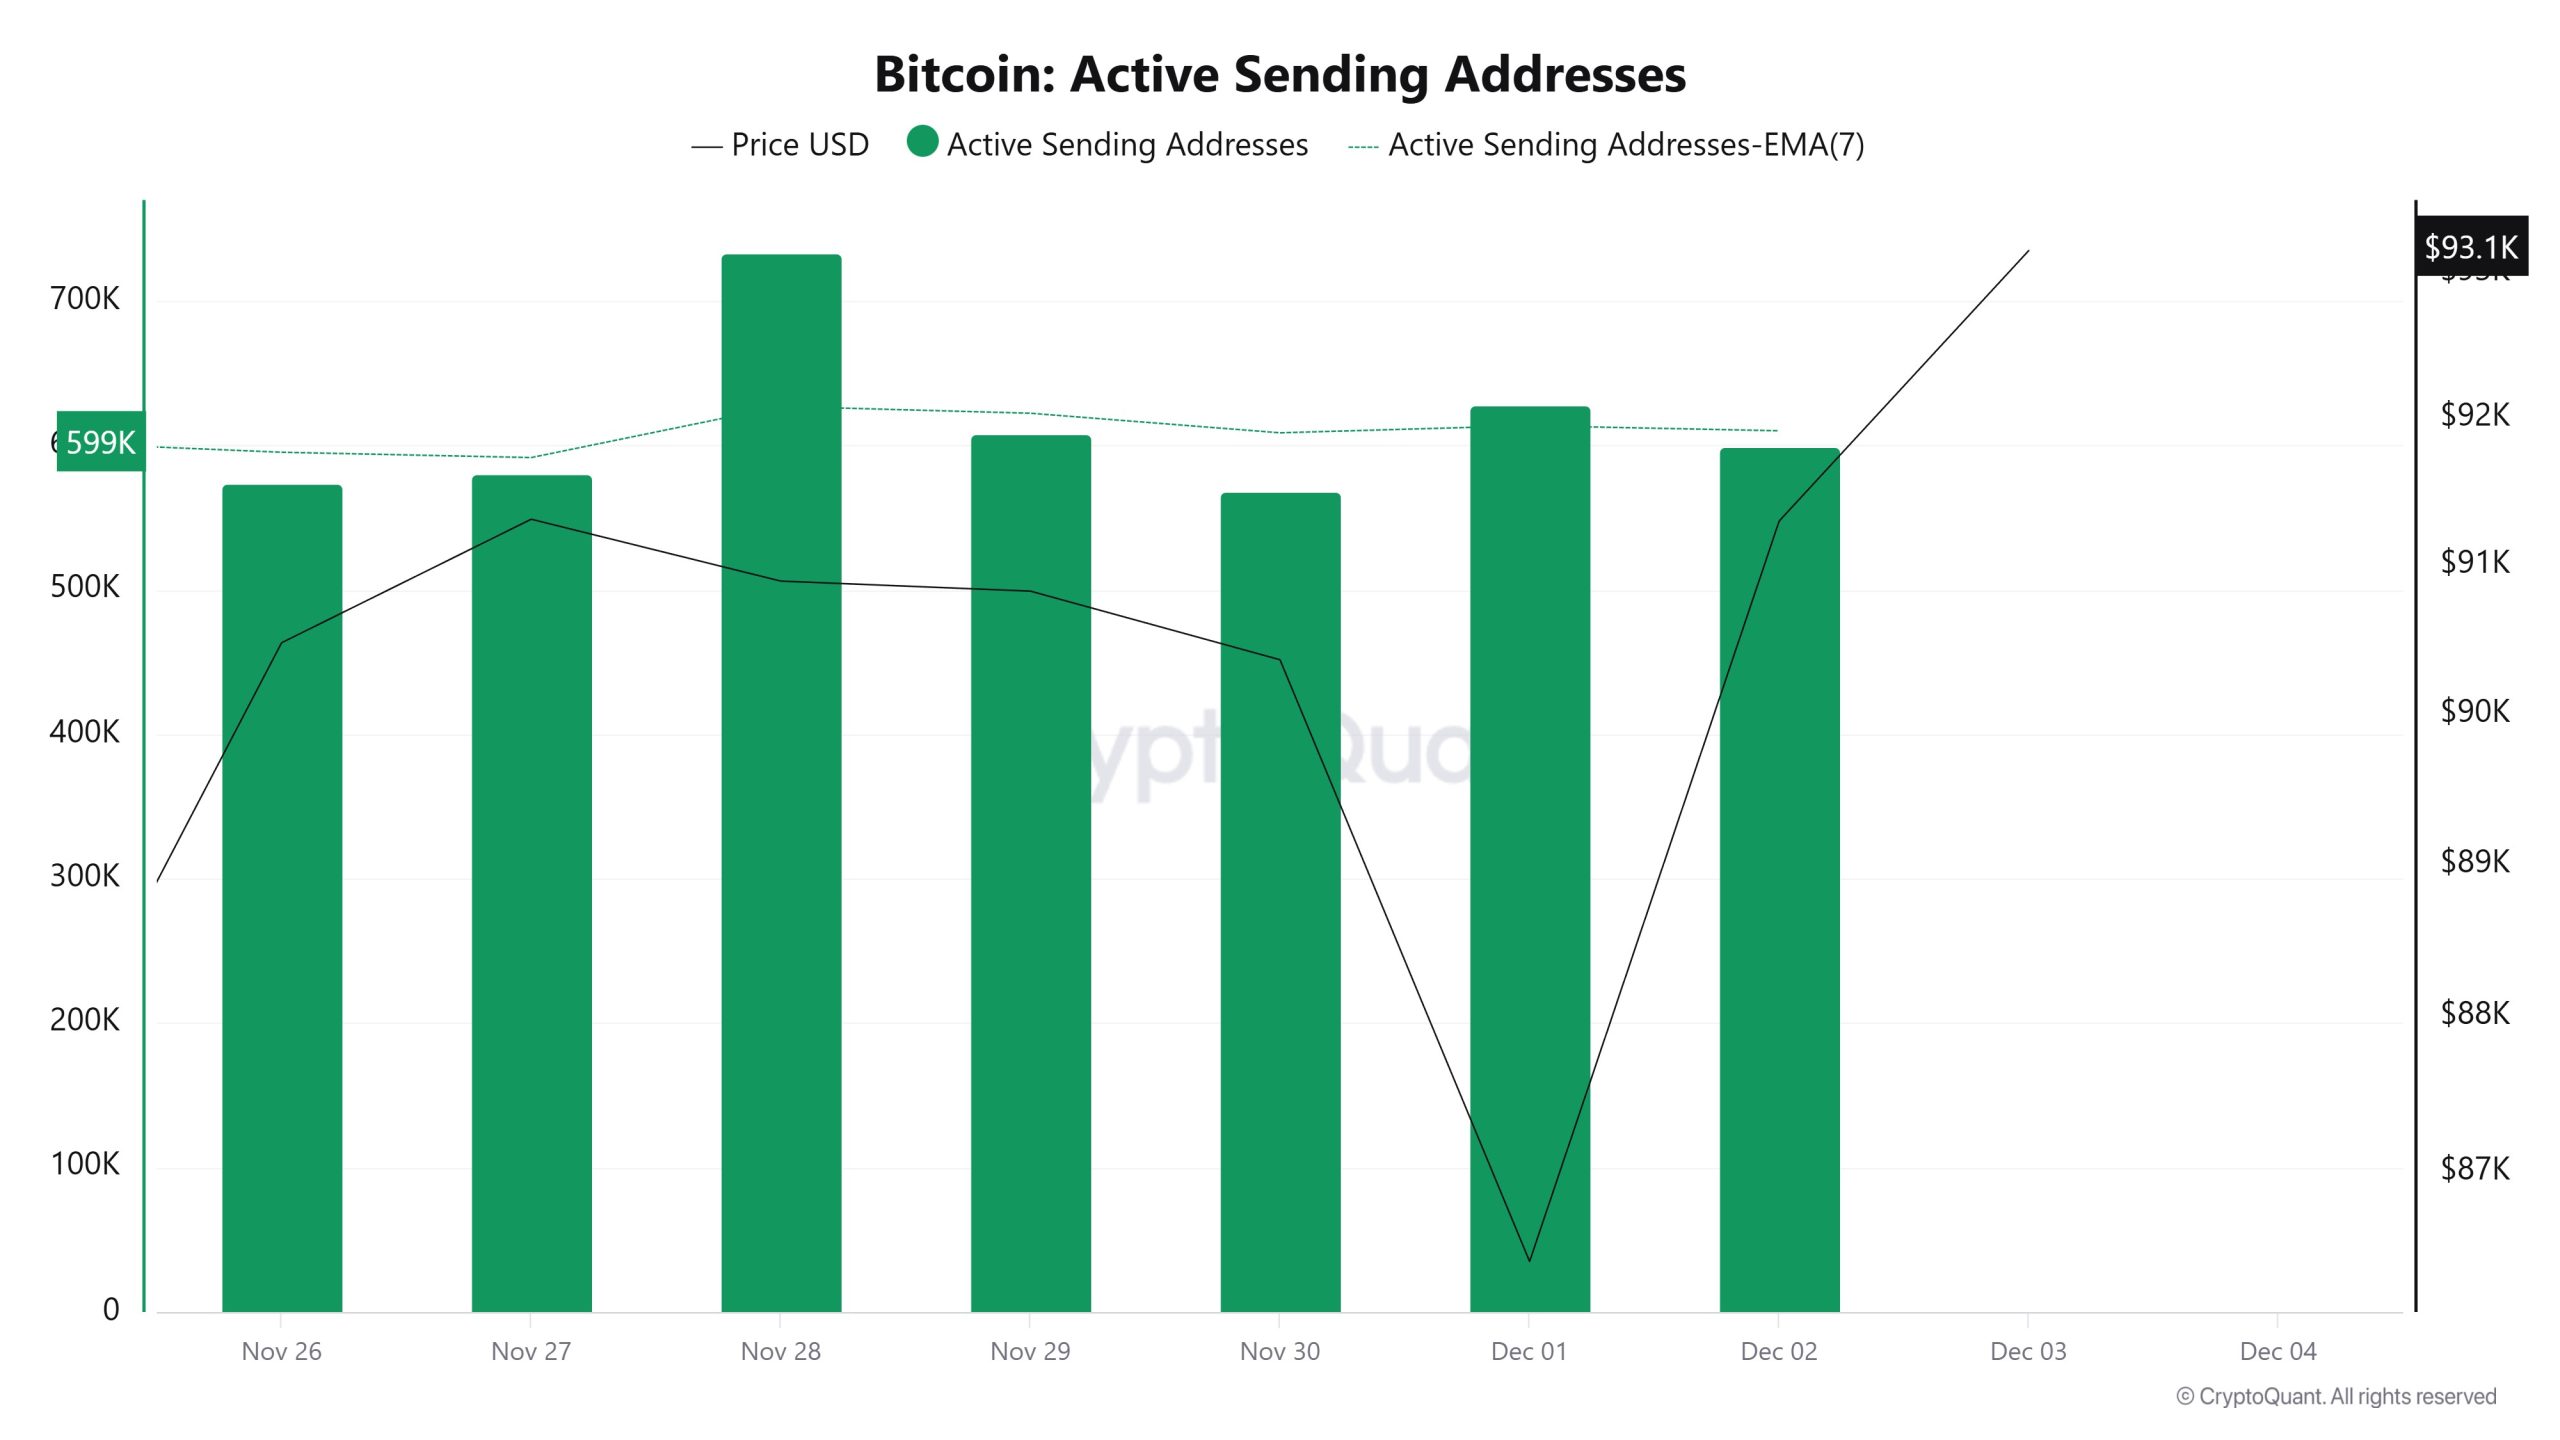
Between November 26 and December 3, an upward trend was observed in the “active sending addresses” metric. On the day the price reached its highest level, this metric stood at 733,115, indicating that user activity on the Bitcoin network was moving in parallel with the price. This data shows that the $86,000 level is supported not only by price but also by on-chain address activity, which is sales-based. Overall, the Active Sending Addresses metric followed a high trajectory during this period.
“Bitcoin Active Sending Addresses – Image to be added”
Active Receiving Addresses
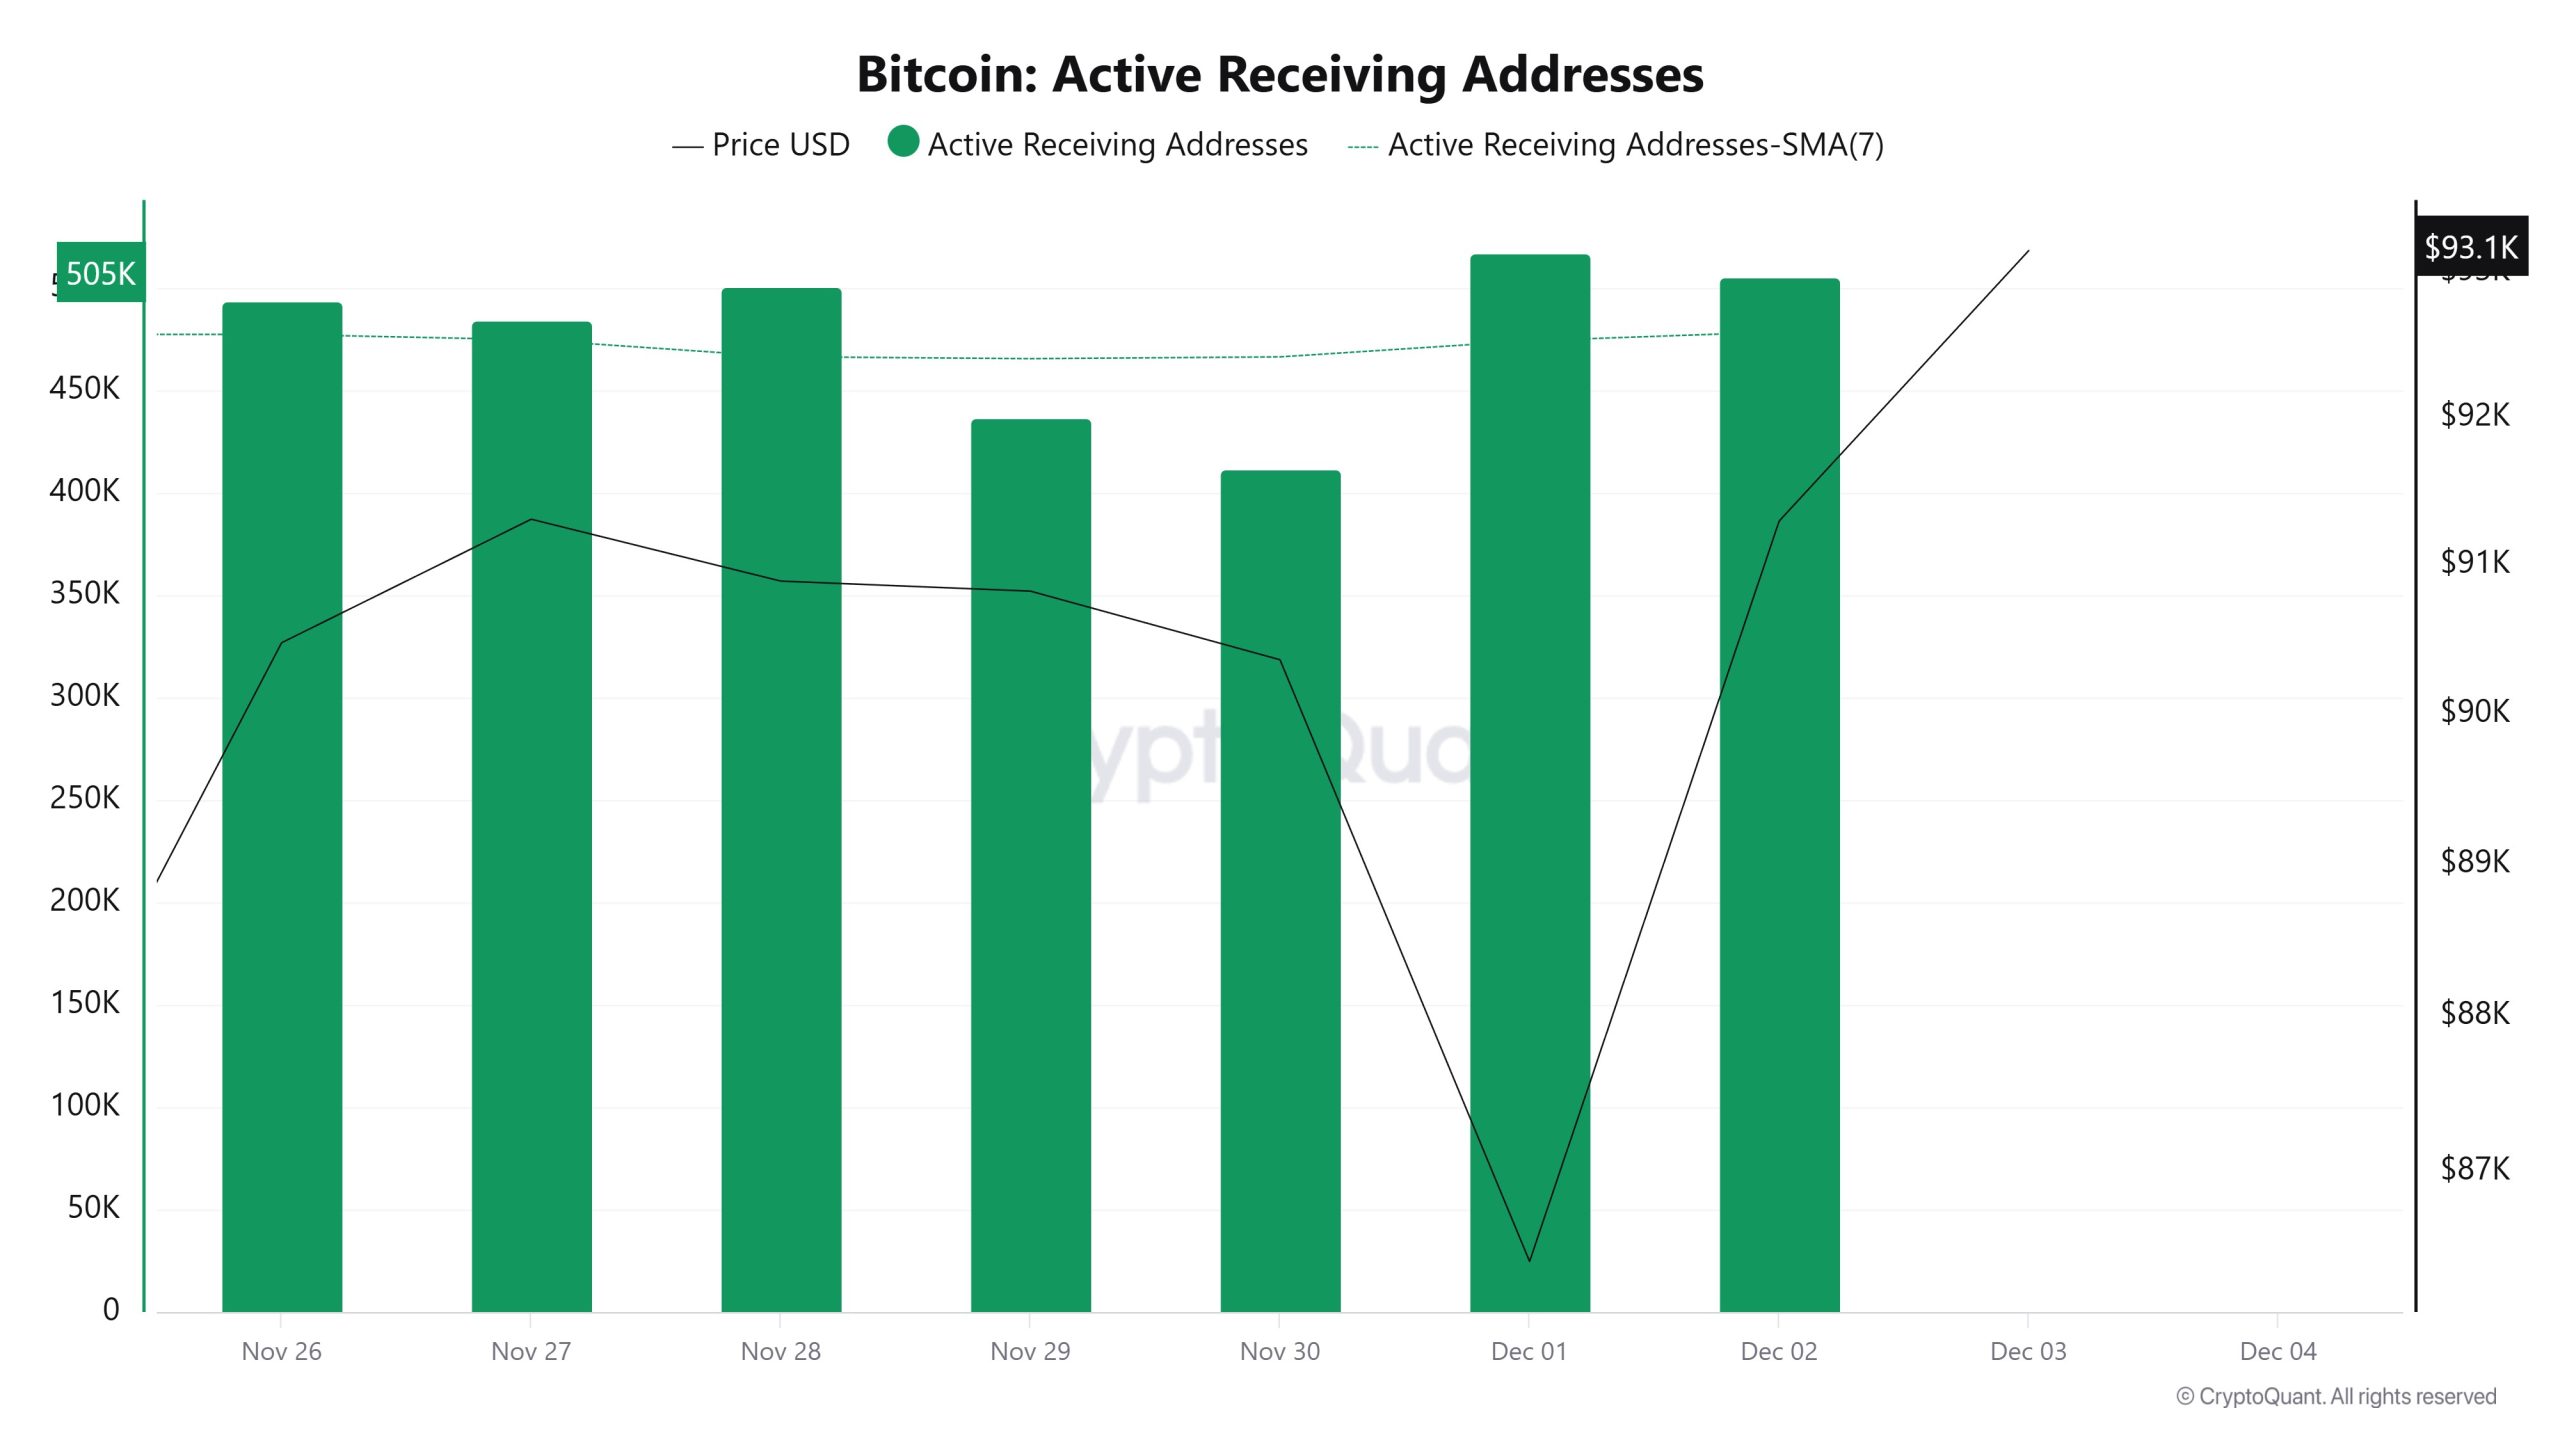
Between November 26 and December 3, active receiving addresses experienced a typical increase alongside the Black Line (price line). On the day the price reached its peak, active receiving addresses rose to 517,368 levels, indicating that buyers acquired Bitcoin at around the $84,000 level.
Breakdowns
MVRV
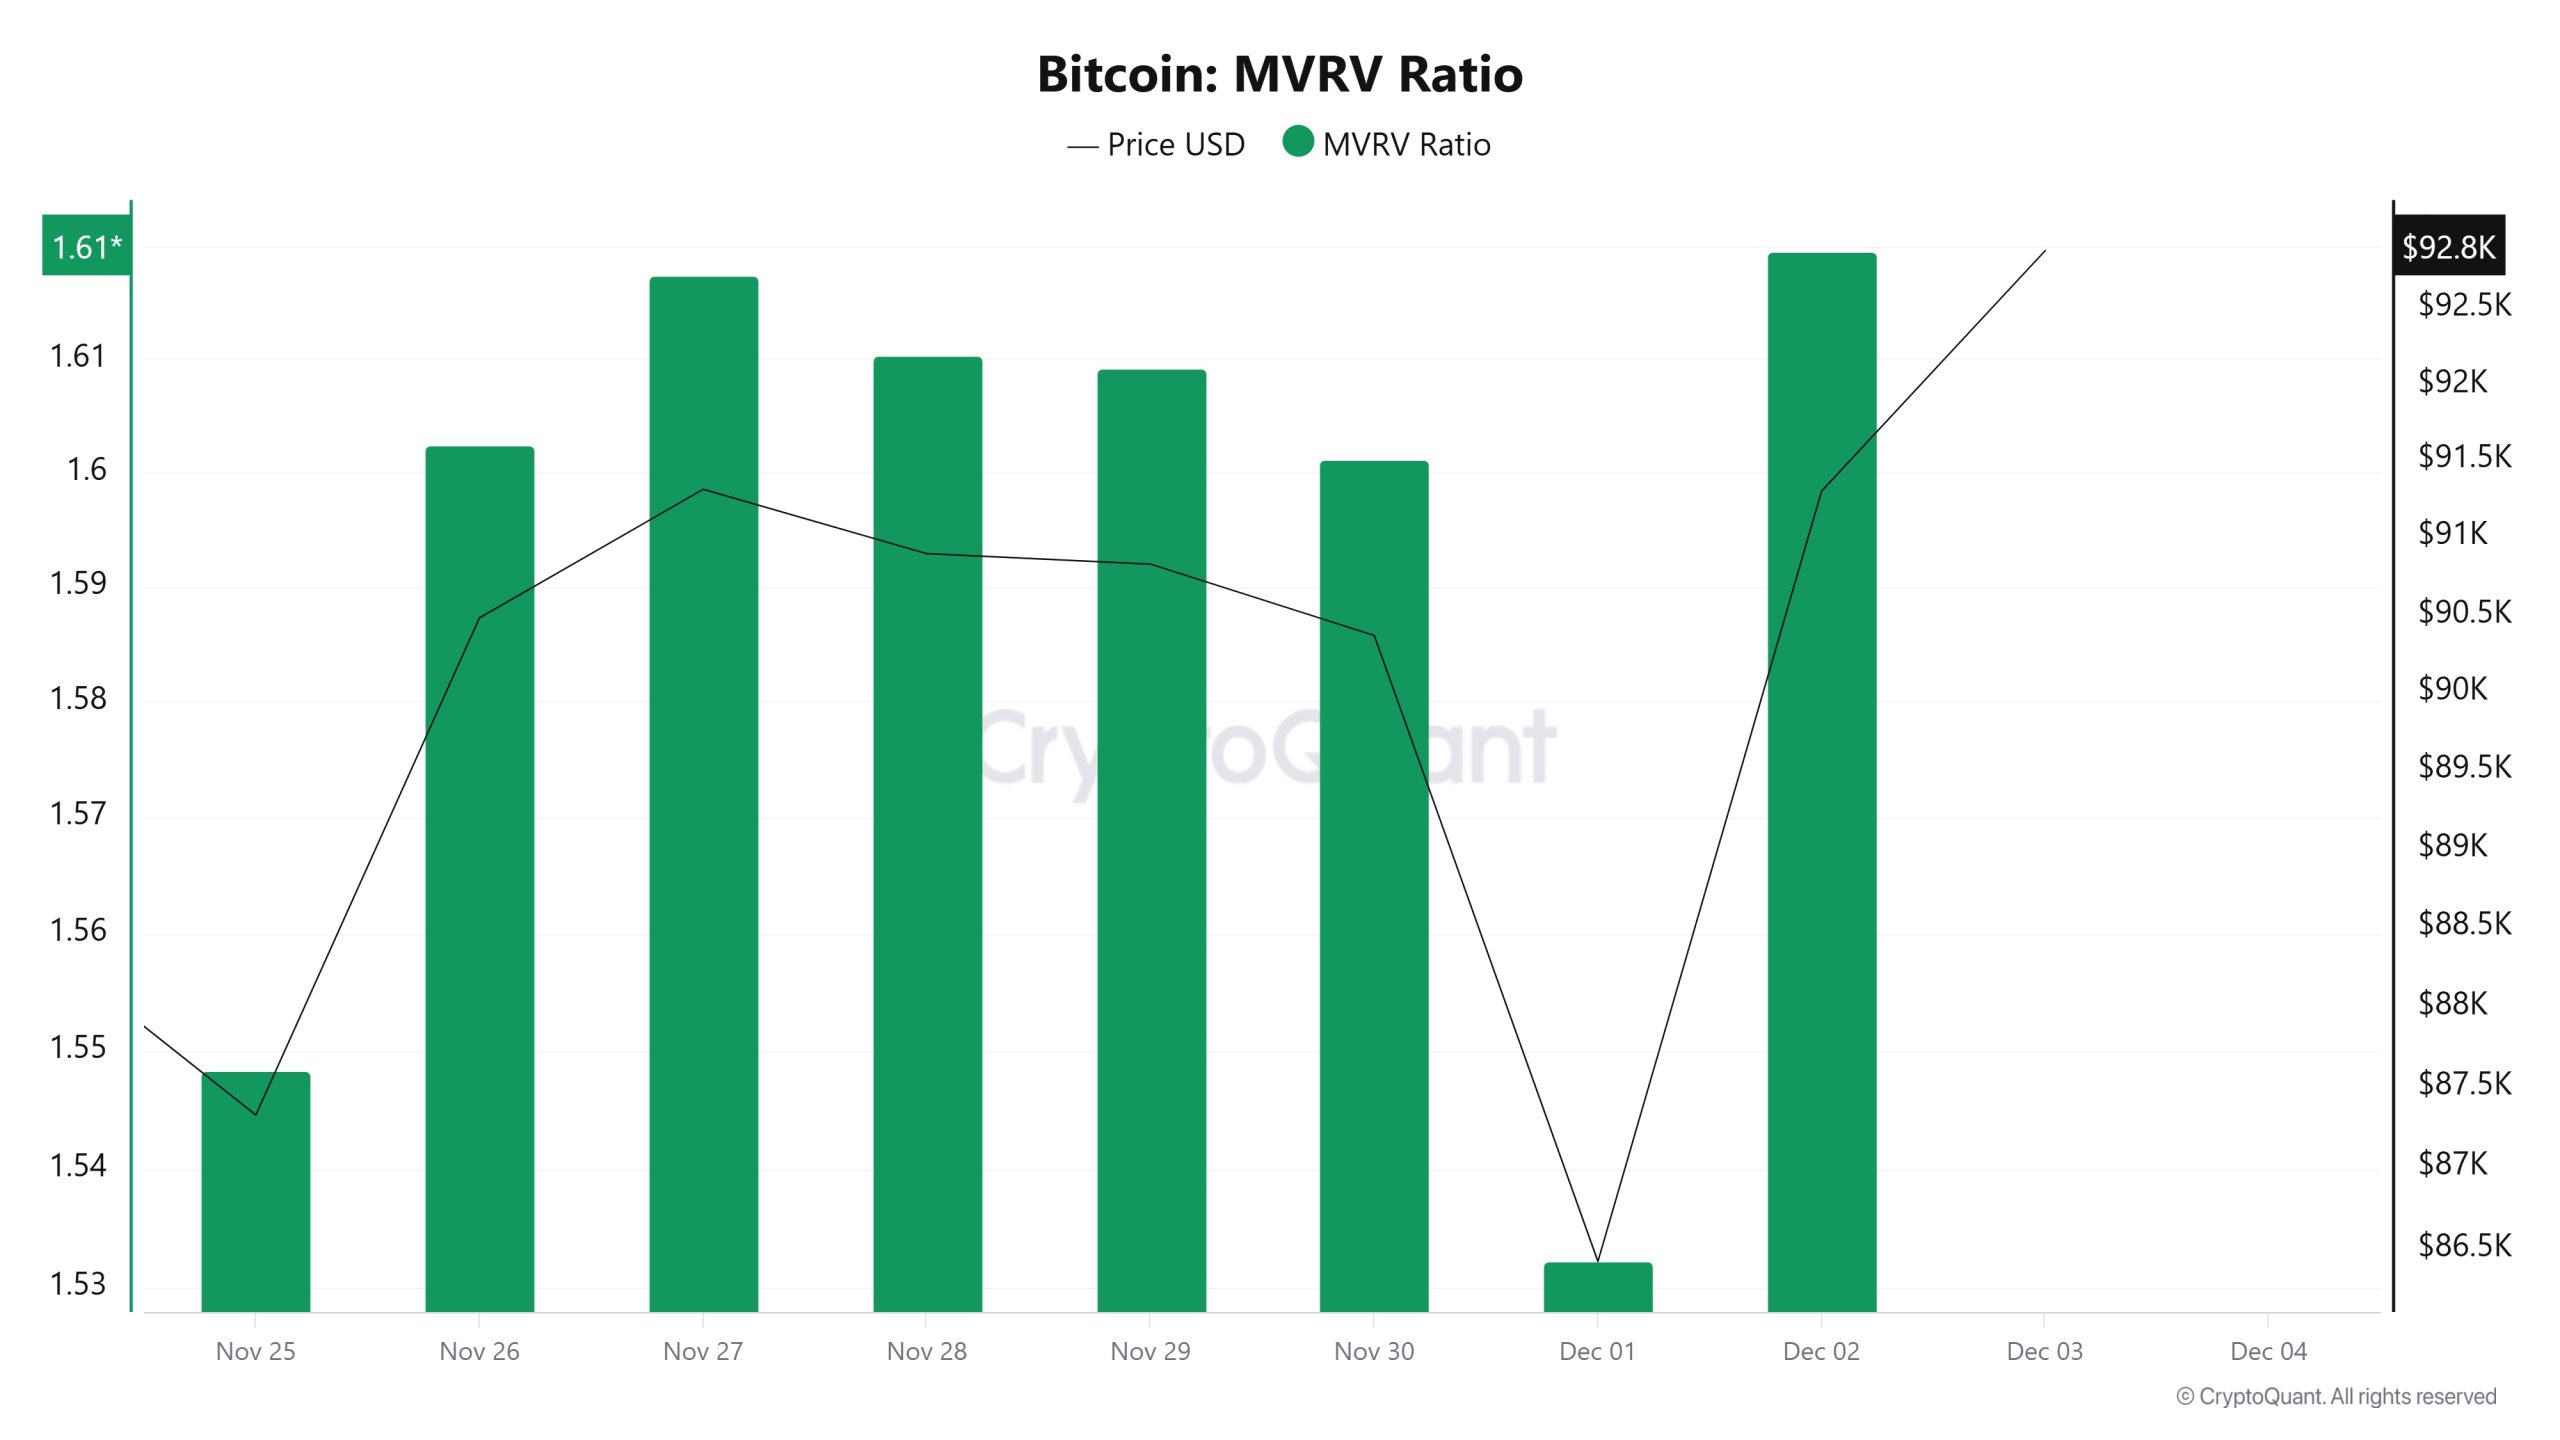
On November 26, while the Bitcoin price was trading at $90,479, the MVRV Ratio stood at 1.602.
As of December 2, the Bitcoin price rose to $91,301, recording a 0.91% increase, while the MVRV Ratio rose to 1.619, recording a 1.06% increase.
Realized Price
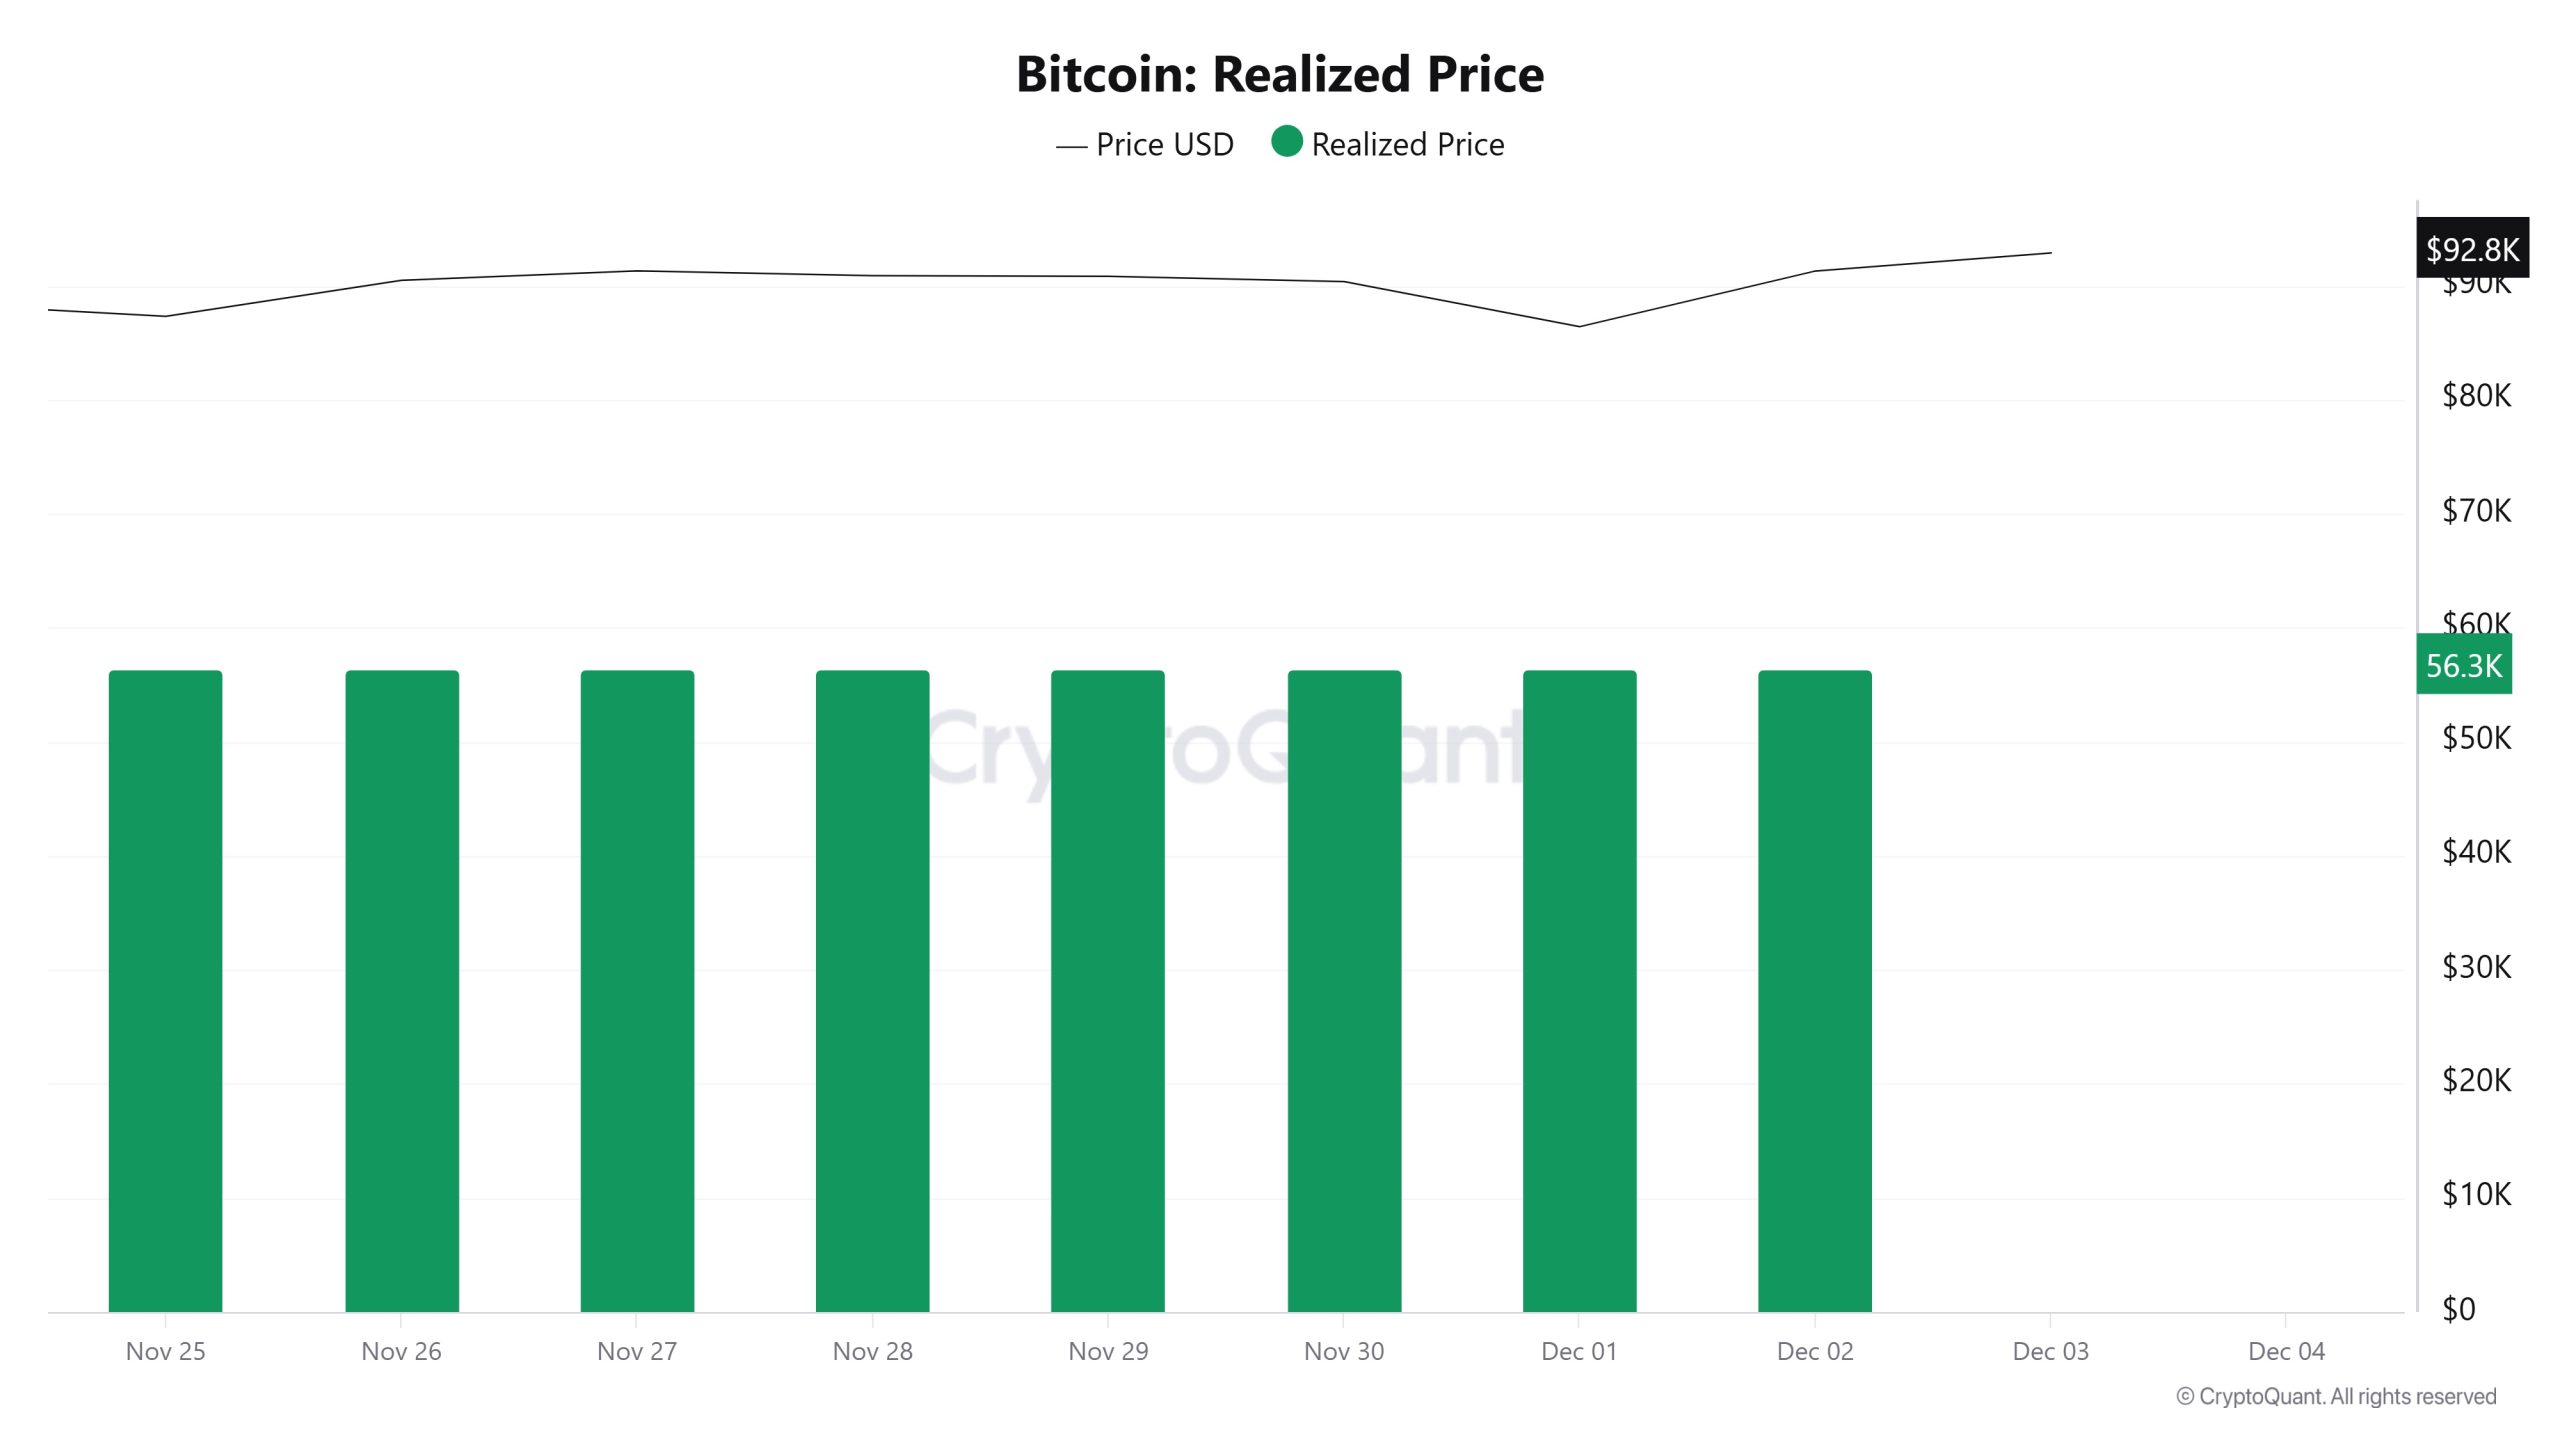
On November 26, while the Bitcoin price was trading at $90,479, the Realized Price was at 56,463.
As of December 2, the Bitcoin price rose to $91,301, while the Realized Price fell to $56,373, recording a 0.16% decline.
2.3. Spent Output Profit Ratio (SOPR)
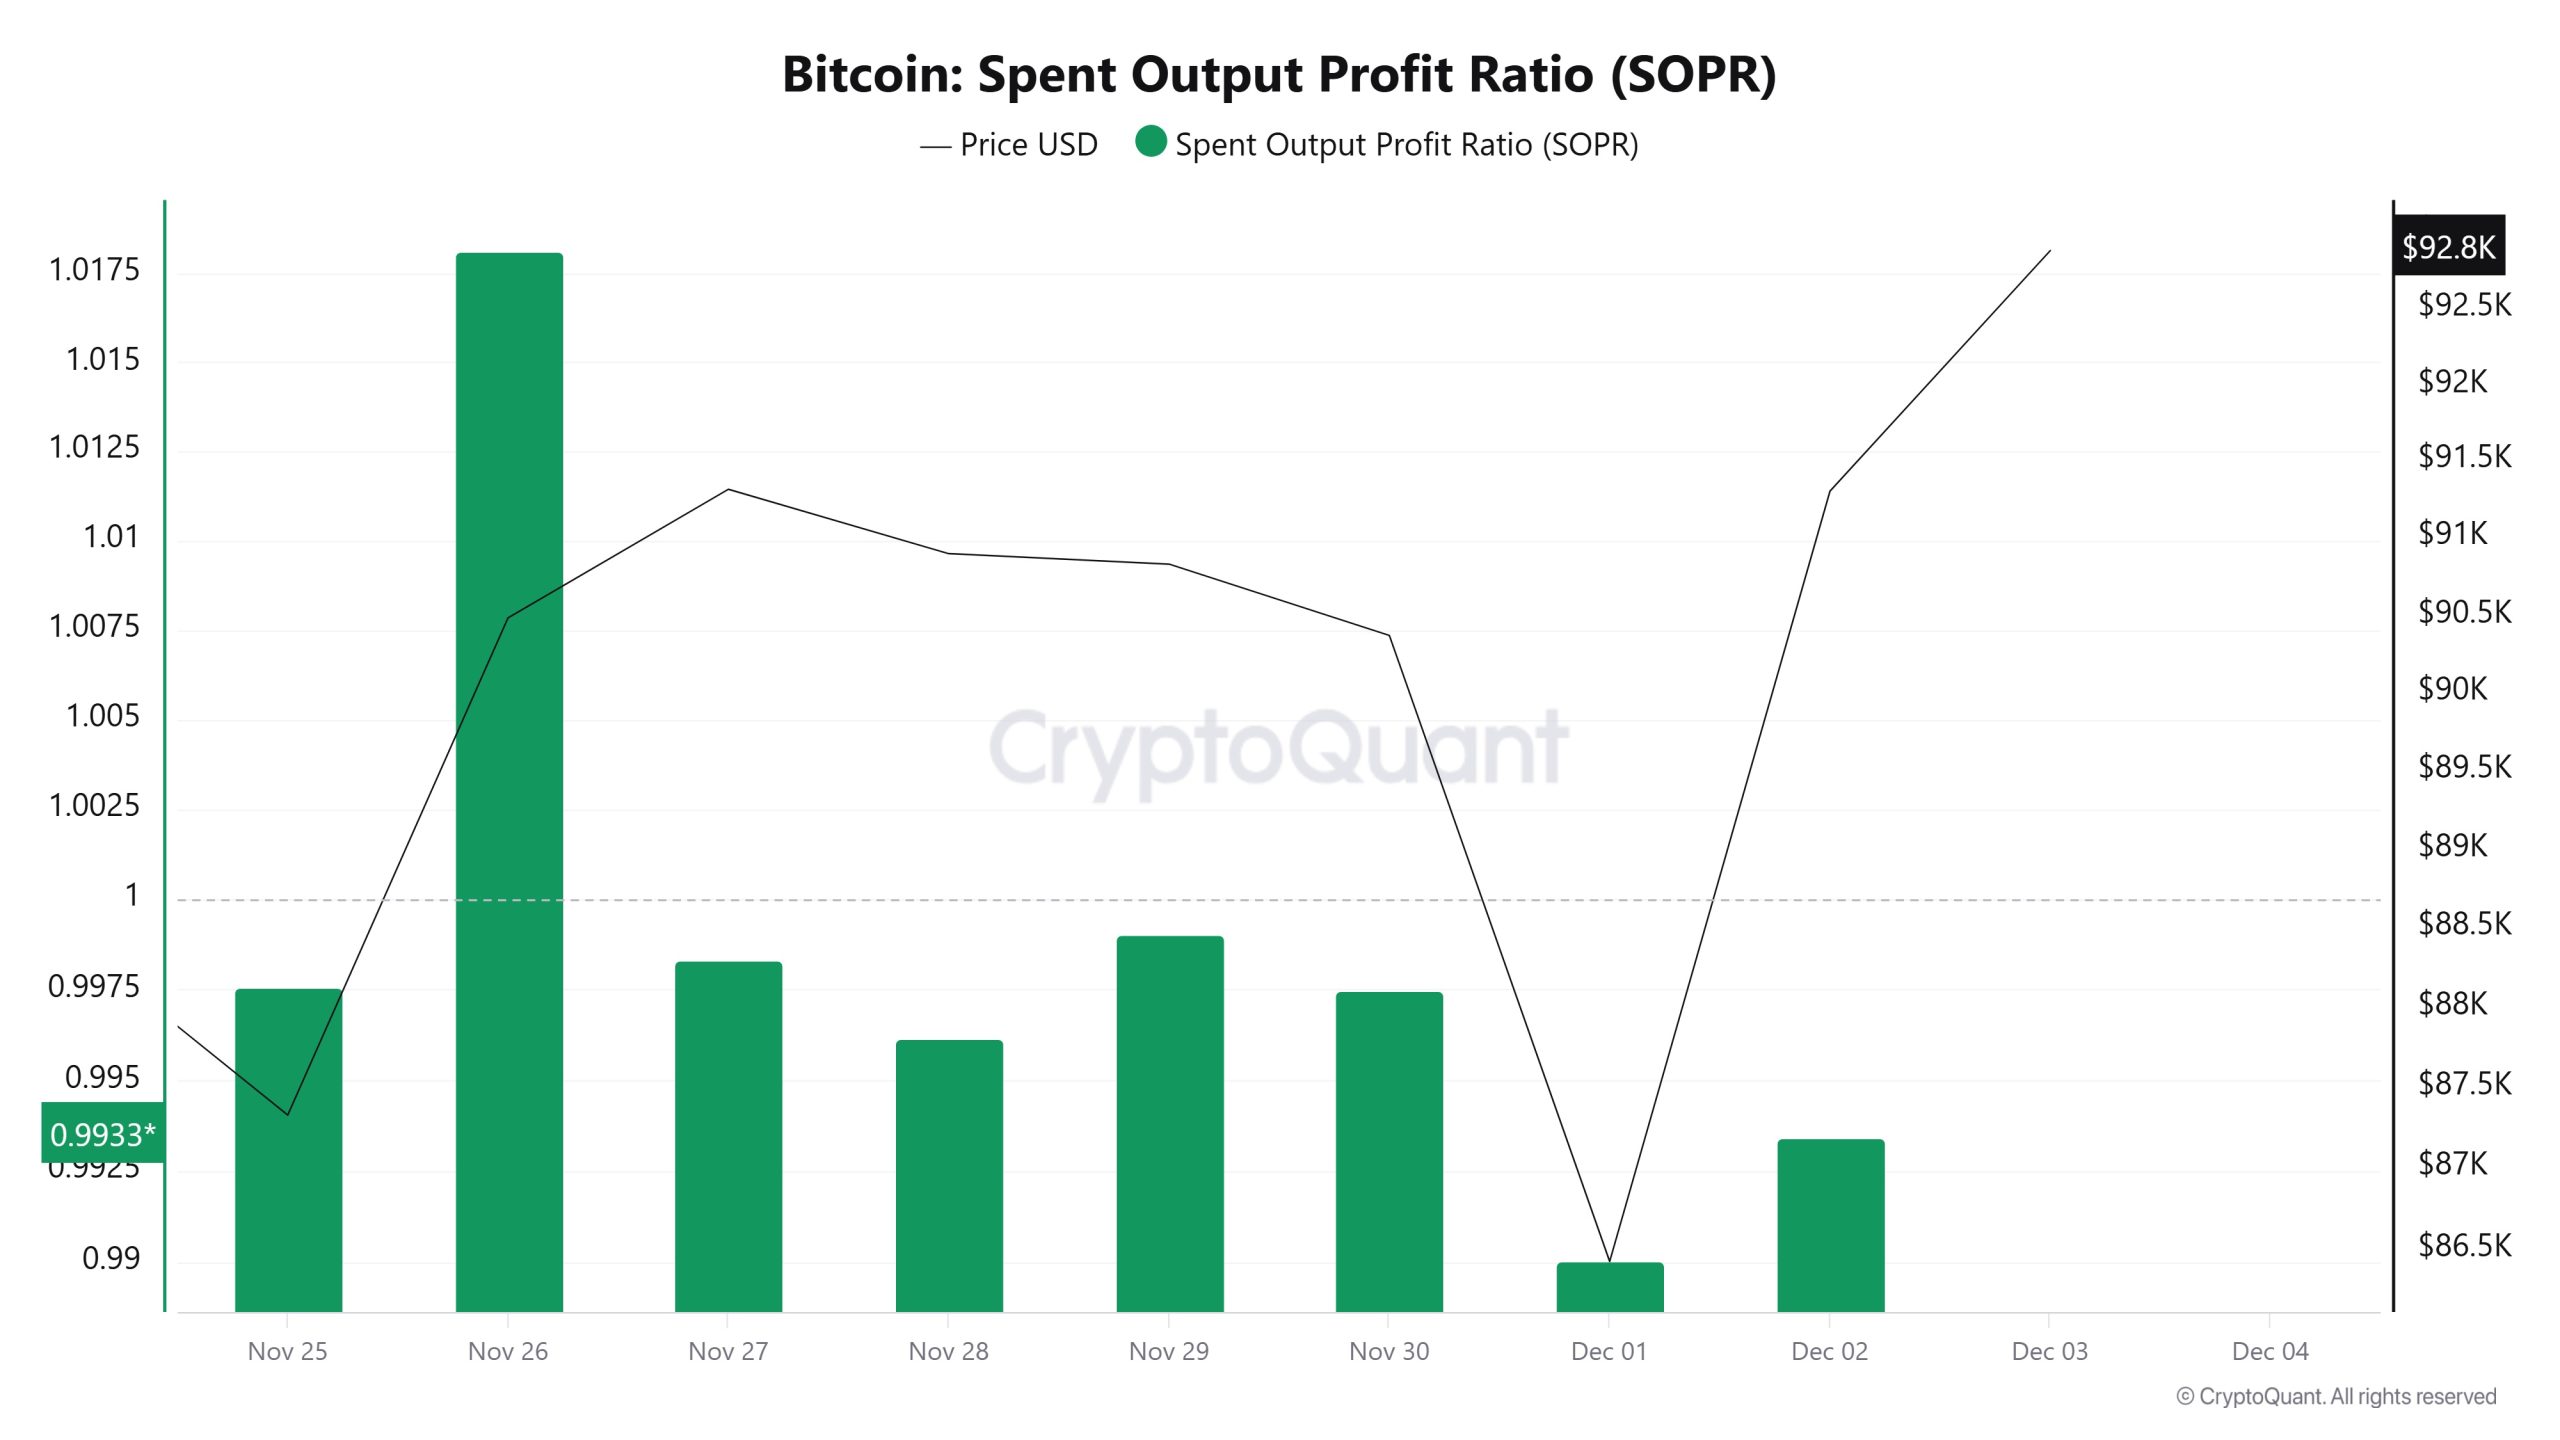
On November 26, while the Bitcoin price was trading at $90,479, the SOPR metric was at 1.018.
As of December 2, while the Bitcoin price rose to $91,301, the SOPR metric fell to 0.993, recording a 2.46% decline.
Derivatives
Open Interest
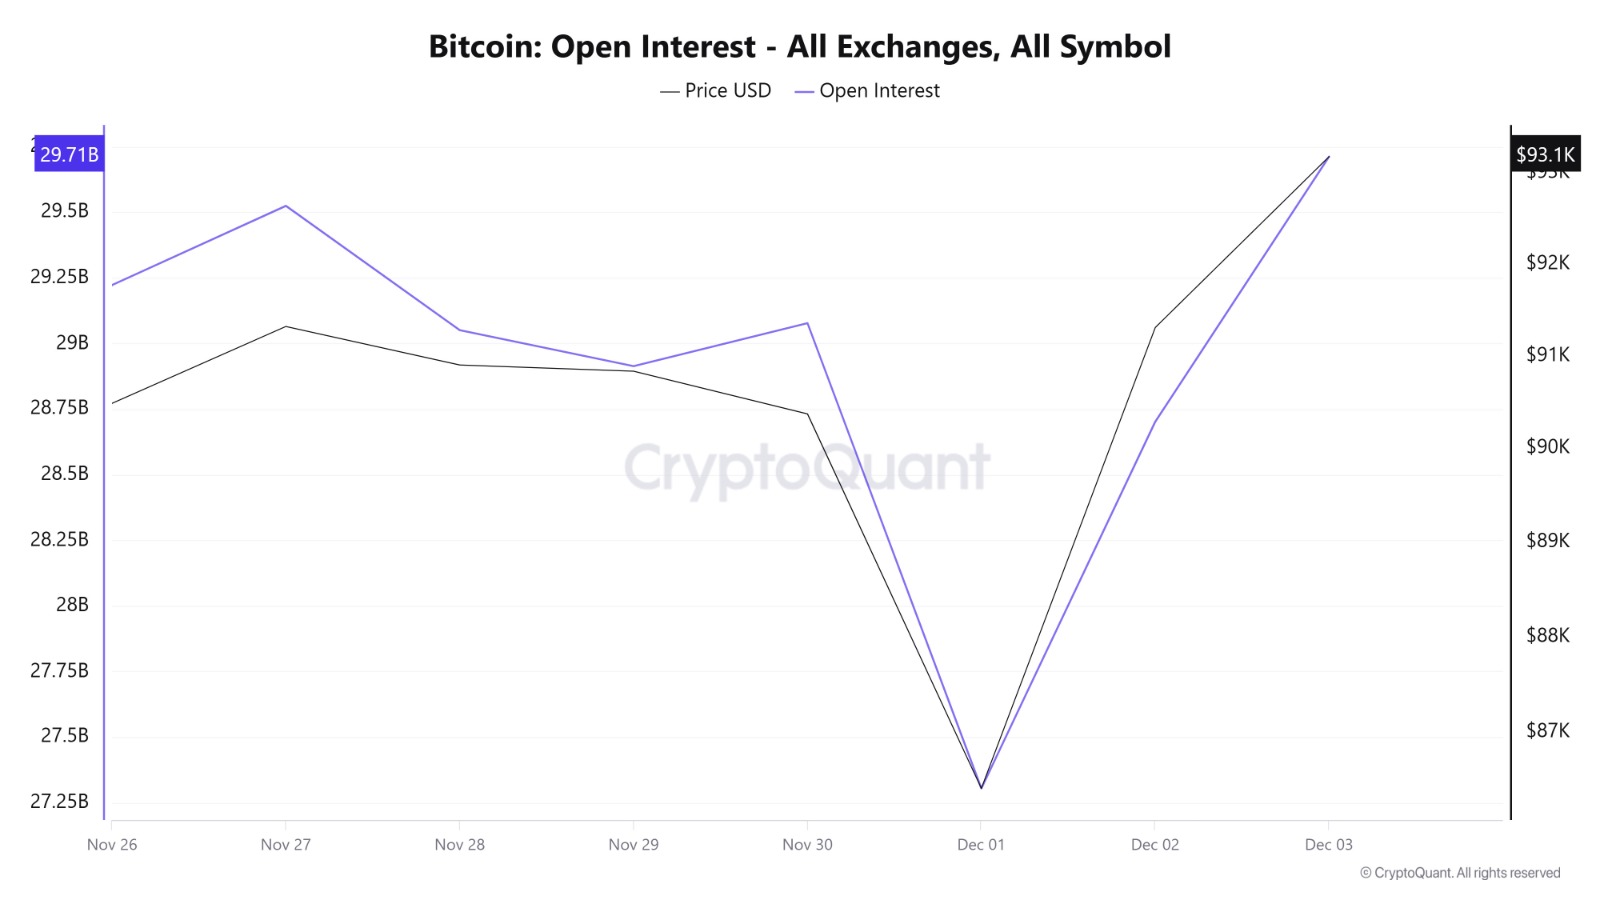
On November 26, when open interest was around $29.22 billion, the price hovered around $90,479. On November 27, as OI rose to $29.52 billion, the price also rose to $91,313. During the November 28-29 period, both data points showed a flat trend. While the price fluctuated between $90,894 and $90,827, open interest balanced between $29.05 billion and $28.91 billion. On November 30, with OI rising to $29.07 billion, the price climbed back to $90,365. However, on December 1, both the price and open interest experienced a significant decline. As the price fell to $86,418, OI declined to $27.30 billion. On December 2, a limited recovery was seen in both. As the price rises to $91,301, open interest climbs to $28.70 billion. Overall, the chart shows that the BTC price and open interest move in parallel, with the correlation becoming more pronounced during sharp pullbacks.
Funding Rate
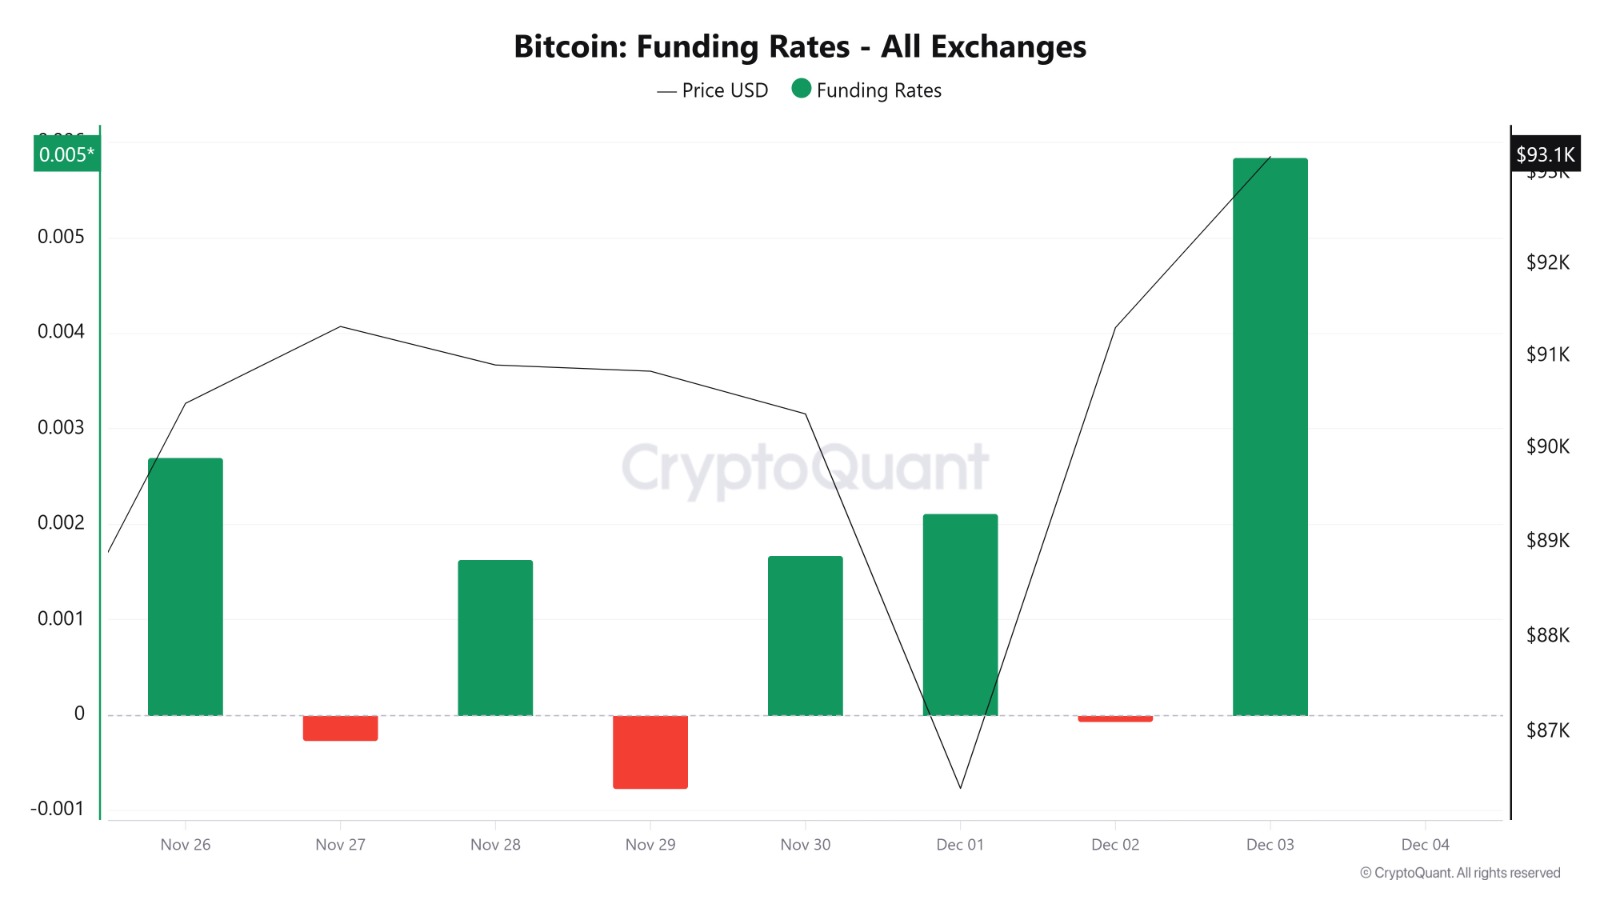
On November 26, funding rates were seen in positive territory. During this period, the price remained at $90,479. Between November 27 and 29, funding rates fluctuated, and with rates occasionally turning negative, the price moved sideways in the $90,827–91,313 range. On November 30, funding strengthened back into positive territory, while the price recovered towards the $90,365 level. On December 1, a significant rise in funding rates was notable, but during the same period, the price fell to $86,418, indicating increased short-side pressure. On December 2, the funding rate fell to nearly neutral levels, while the price rose to $91,301. The overall picture shows that funding rates directly reflect market sentiment and fluctuate in line with BTC price movements.
Long & Short Liquidations
Last week, as the BTC price fell from $91,300 to $86,400, long positions were predominantly liquidated. A total of $1.21 billion in long trades were liquidated, while $346 million in short positions were liquidated.
| Date | Long Volume (Million $) | Short Volume (Million $) |
|---|---|---|
| November 26 | 18.51 | 58.8 |
| November 27 | 172.18 | 41.5 |
| November 28 | 38.81 | 34.3 |
| November 29 | 7.98 | 2.44 |
| November 30 | 12.88 | 19.61 |
| December 1 | 788.4 | 66.01 |
| December 2 | 176.23 | 124.03 |
| Total | 1214.99 | 346.69 |
- Supply Distribution

Total Supply: Reached 19,956,449 units, an increase of approximately 0.03116% compared to last week.
New Supply: The amount of BTC produced this week was 6,216.
Velocity: The velocity, which was 12.34 last week, reached 12.35 as of December 1.
| Wallet Category | November 24, 2025 | 12/01/2025 | Change (%) |
|---|---|---|---|
| < 1 BTC | 8.4331% | 8.4458% | 0.1506% |
| 1 – 10 BTC | 11.3362% | 11.3270% | −0.0811% |
| 10 – 100 BTC | 23.2364% | 23.2121% | −0.1046% |
| 100 – 1k BTC | 27.8468% | 27.9735% | 0.4553% |
| 1k – 10k BTC | 21.0998% | 20.9876% | −0.531% |
| 10k+ BTC | 8.0471% | 8.0538% | 0.0832% |
According to the latest weekly data, the Bitcoin wallet distribution showed a mixed picture. The share of wallets with a balance of less than 1 BTC increased slightly to 8.4458%, while the proportion of wallets in the 1–10 BTC range fell slightly to 11.3270%. The 10–100 BTC band also experienced a limited decline, falling to 23.2121%. In contrast, the share of wallets in the 100–1,000 BTC range rose this week, reaching 27.9735%. The proportion of wallets in the 1,000–10,000 BTC range fell to 20.9876%, while the proportion of wallets with a balance of 10,000 BTC and above rose slightly to 8.0538%. In the overall view, fluctuations continued in small and medium-sized wallets, with a noticeable accumulation trend particularly in the 100–1,000 BTC range.
Exchange Supply Ratio
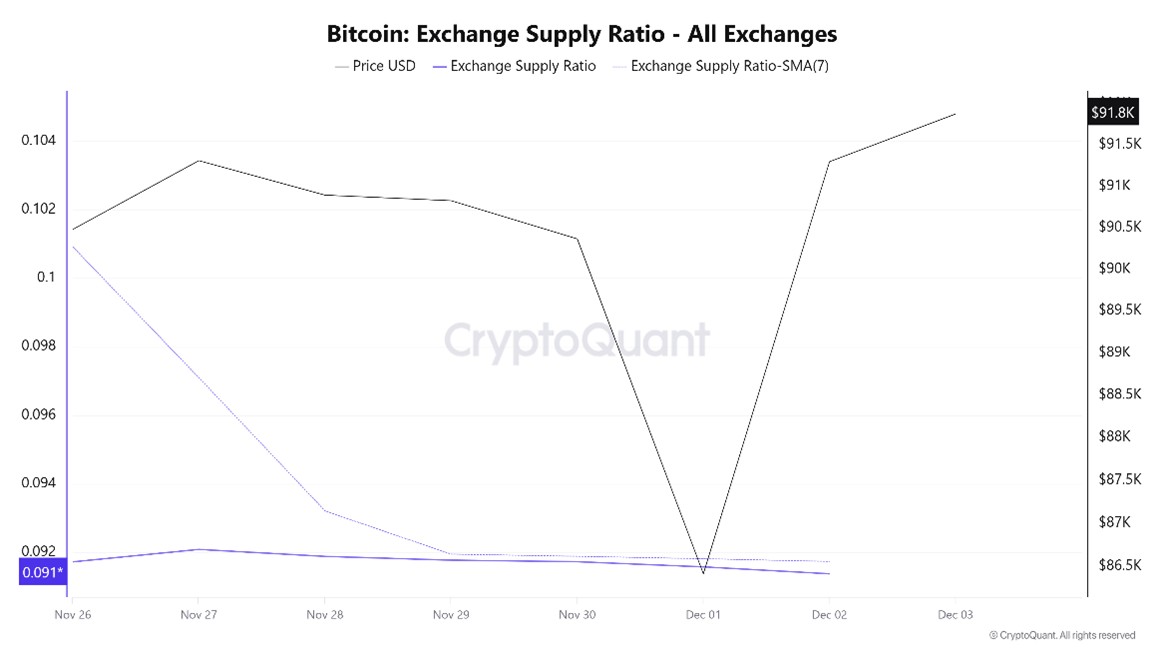
According to data obtained from the Bitcoin Exchange Supply Ratio table, which shows how much of the total supply of Bitcoins is held on exchanges, low rates have been observed this week. The general trend shows that as of December 1, there is a negative correlation between the Bitcoin price and the supply rate entering exchanges. This indicates that most Bitcoins are beginning to be withdrawn from wallets and that the market is not ready to buy.
Between November 26 and December 3, the Bitcoin Exchange Supply Ratio decreased from 0.09209285 to 0.09153762. During this period, the Bitcoin price rose from $85,000 to $91,000. In particular, the fact that these two variables moved in different directions this week indicates that, despite the price decline, the amount of Bitcoin supplied to exchanges has decreased and that long-term investors have likely begun to reduce their holdings. It appears that a general decline in the Bitcoin price may prevail.
Exchange Reserve
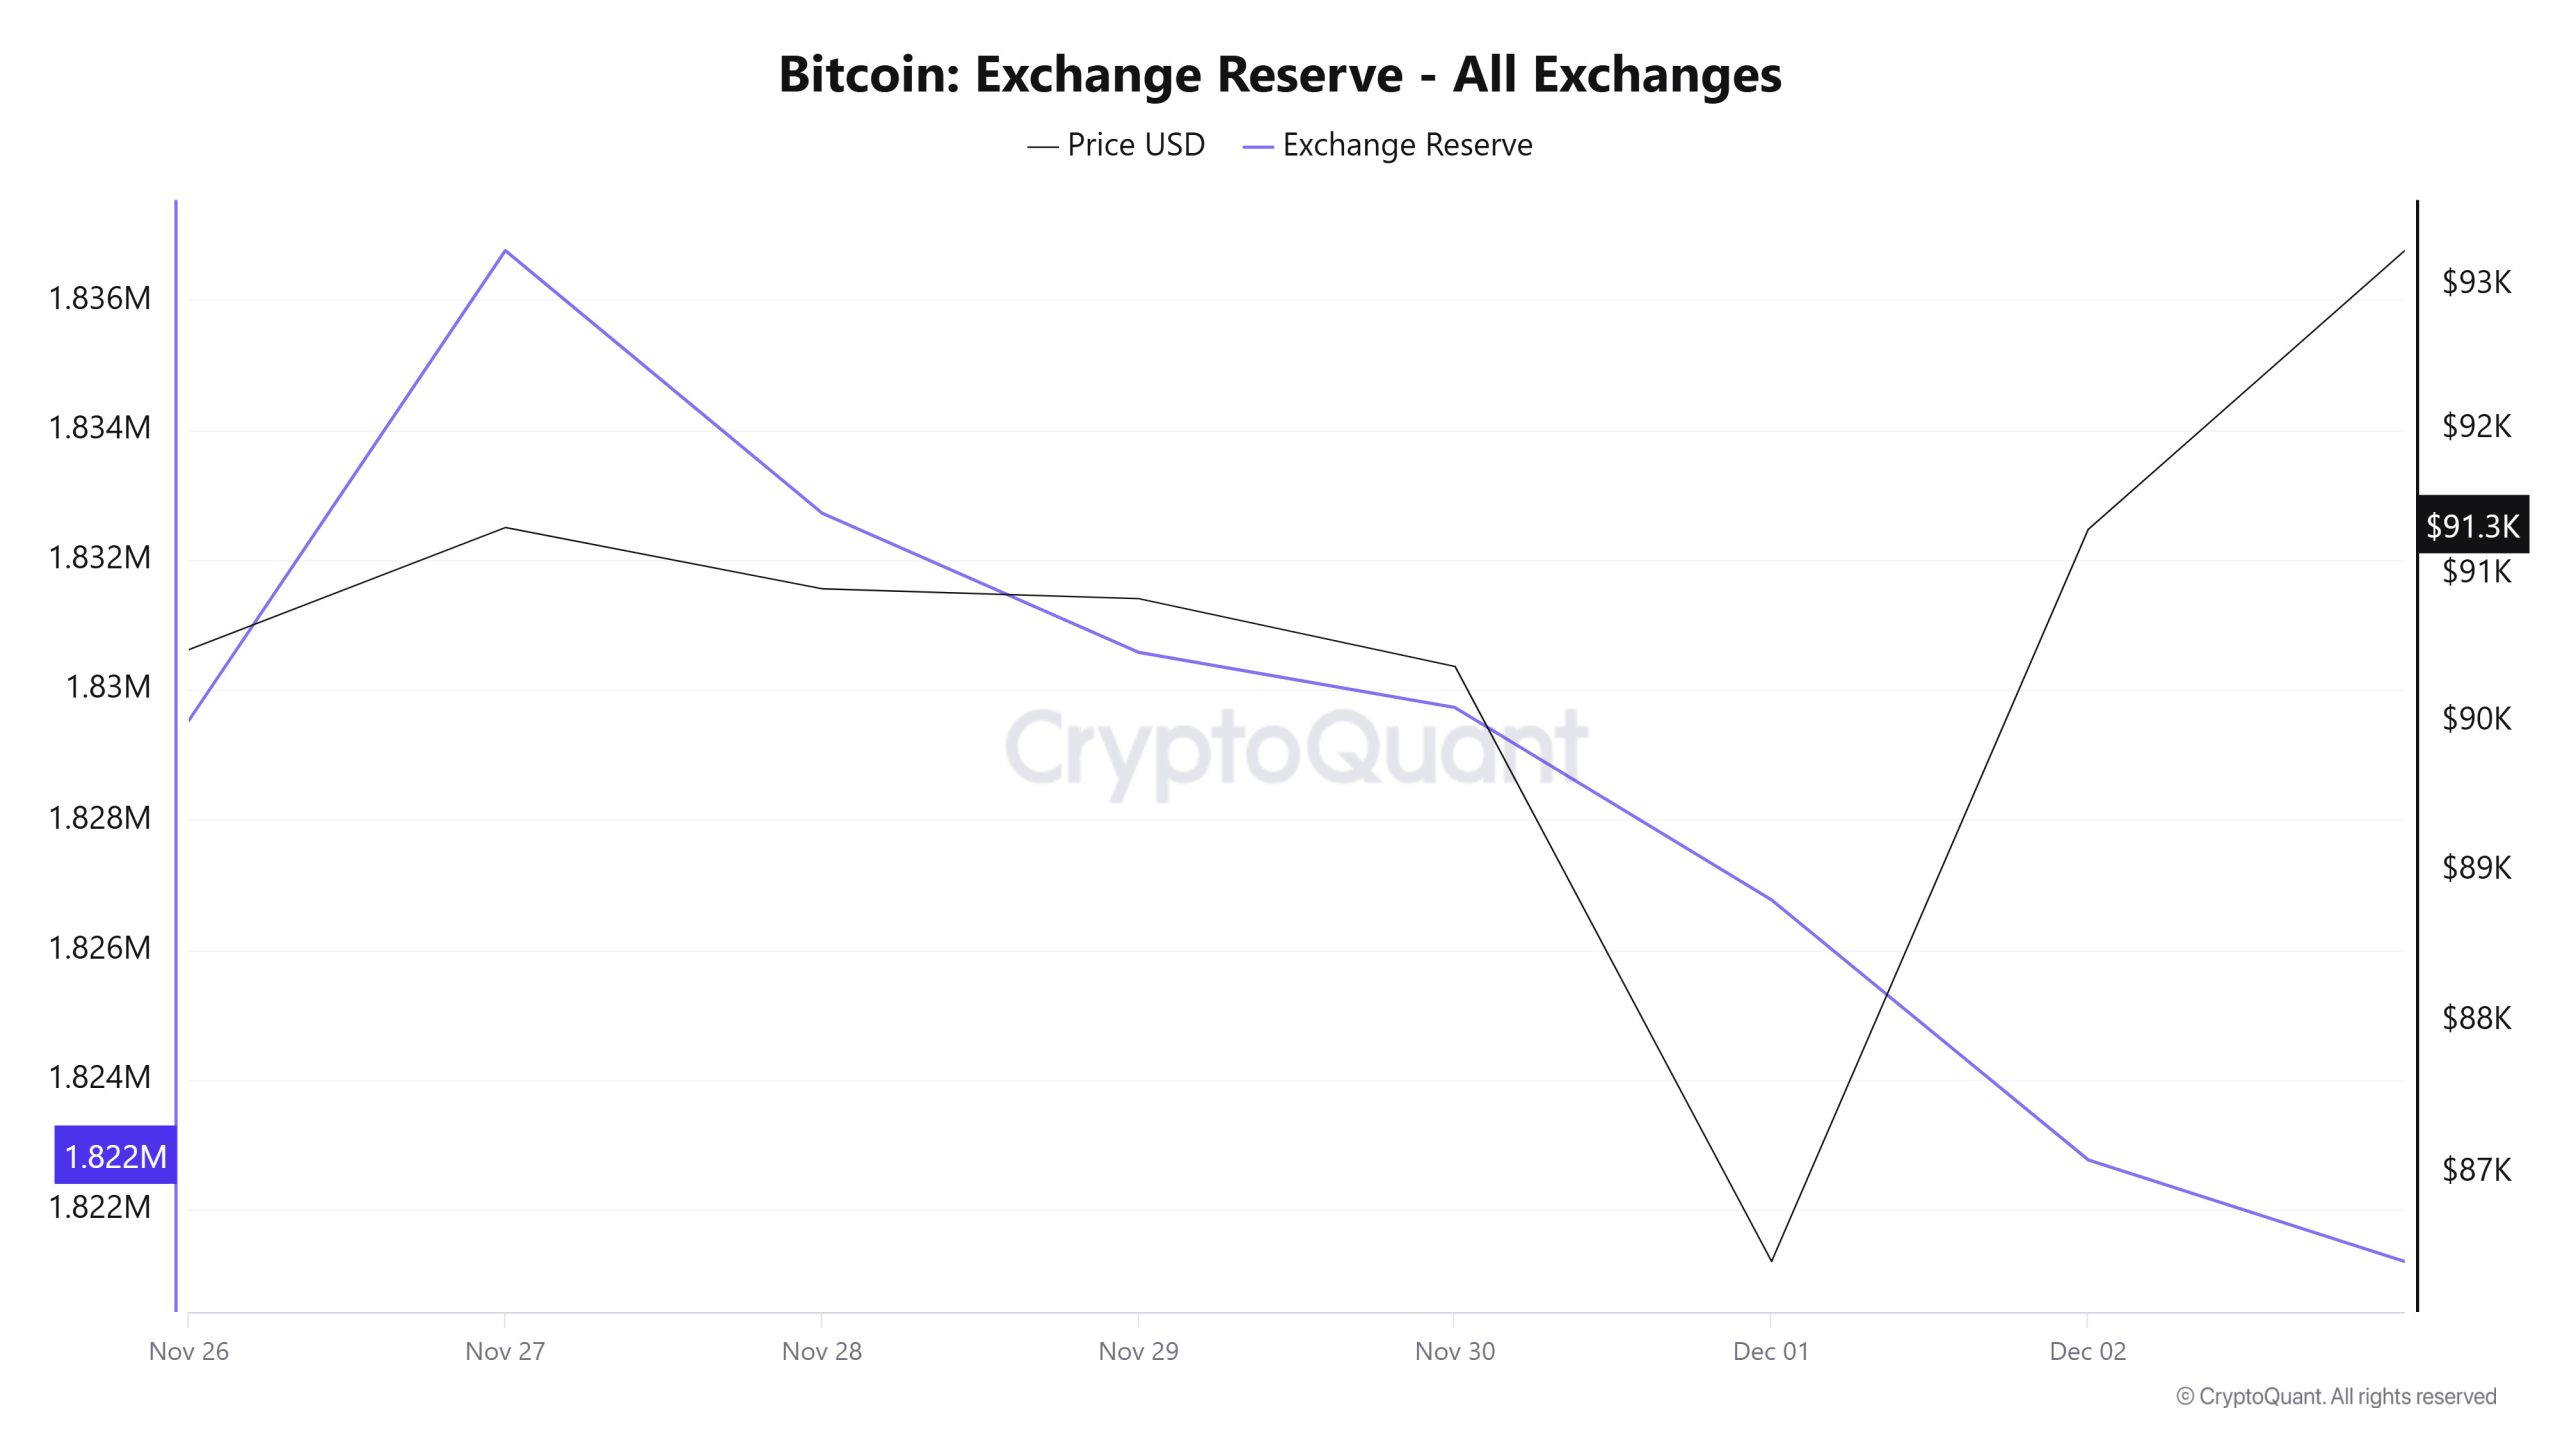
Between November 26 and December 2, 2025, Bitcoin reserves on exchanges fell from 1,833,670 BTC to 1,822,766 BTC, resulting in a net outflow of 10,904 BTC. During this period, reserves decreased by approximately 0.59%, while the BTC price rose from $87,331 to $91,301, recording a 4.55% increase in value. The decline in reserves while the BTC price was rising showed that investors continued to withdraw their BTC from exchanges rather than turning this rise into a selling opportunity. The steady recovery of the price after the outflows seen especially in the early days indicated that the accumulation trend continued in the market, albeit cautiously. Price fluctuations may continue in the short term, but the continued decline in reserves may support the upward movement.
| Date | 26-Nov | 27-Nov | 28-Nov | 29-Nov | 30-Nov | 01-Dec | 02-Dec |
|---|---|---|---|---|---|---|---|
| Exchange Inflow | 27,158 | 40,167 | 29,815 | 8,124 | 8,559 | 40,433 | 30,936 |
| Exchange Outflow | 31,302 | 32,862 | 33,856 | 10,266 | 9,409 | 43,395 | 34,935 |
| Exchange Netflow | -4,144 | 7,305 | -4,041 | -2,143 | -850 | -2,962 | -4,000 |
| Exchange Reserve | 1,829,527 | 1,836,761 | 1,832,720 | 1,830,578 | 1,829,727 | 1,826,766 | 1,822,766 |
| BTC Price | 87,331 | 91,313 | 90,895 | 90,827 | 90,366 | 86,418 | 91,301 |
Fees and Revenues
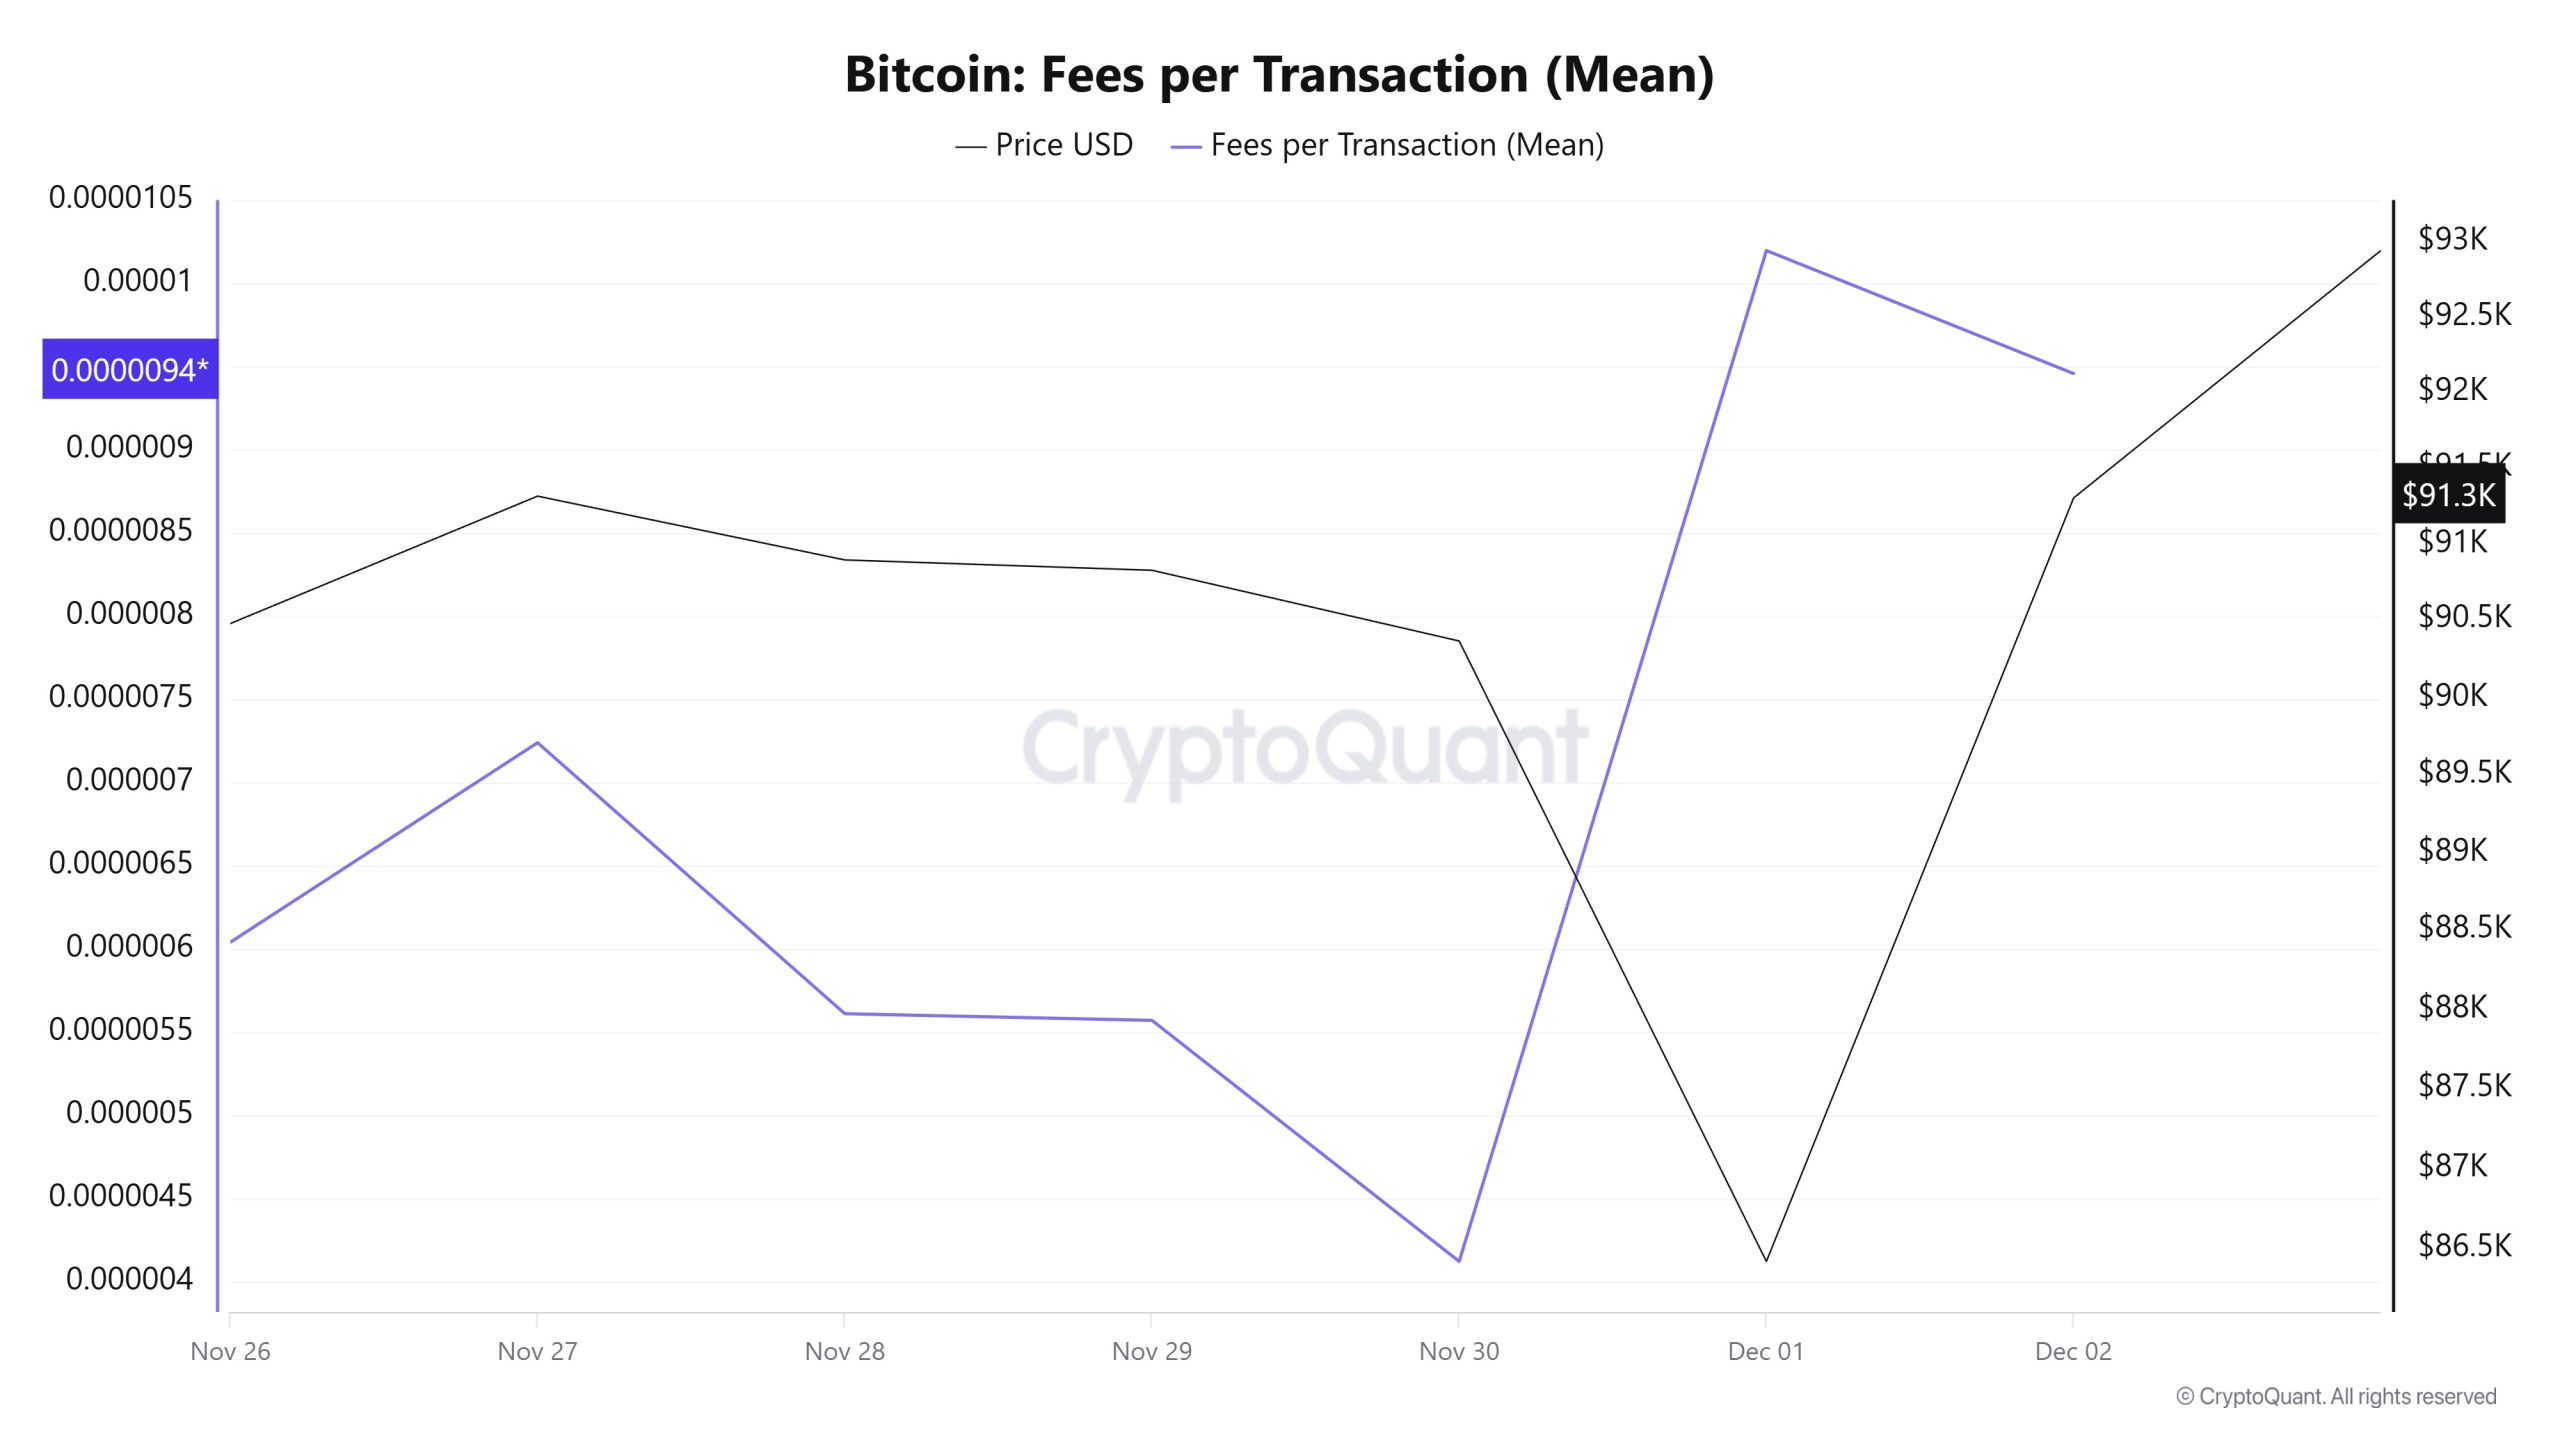
When examining the Bitcoin Fees per Transaction (Mean) data between November 26 and December 2, it is seen that the indicator reached 0.00000604 on November 26, the first day of the week.
A fluctuating trend was observed until November 30, and on that date, the indicator recorded its lowest value of the week at 0.00000412.
In this context, as a result of the increase in Bitcoin price volatility as of November 30, the indicator regained momentum and followed a positive trend due to the impact of price volatility.
On December 2, the last day of the weekly period, the indicator closed the week at 0.00000946.
Bitcoin: Fees (Total)
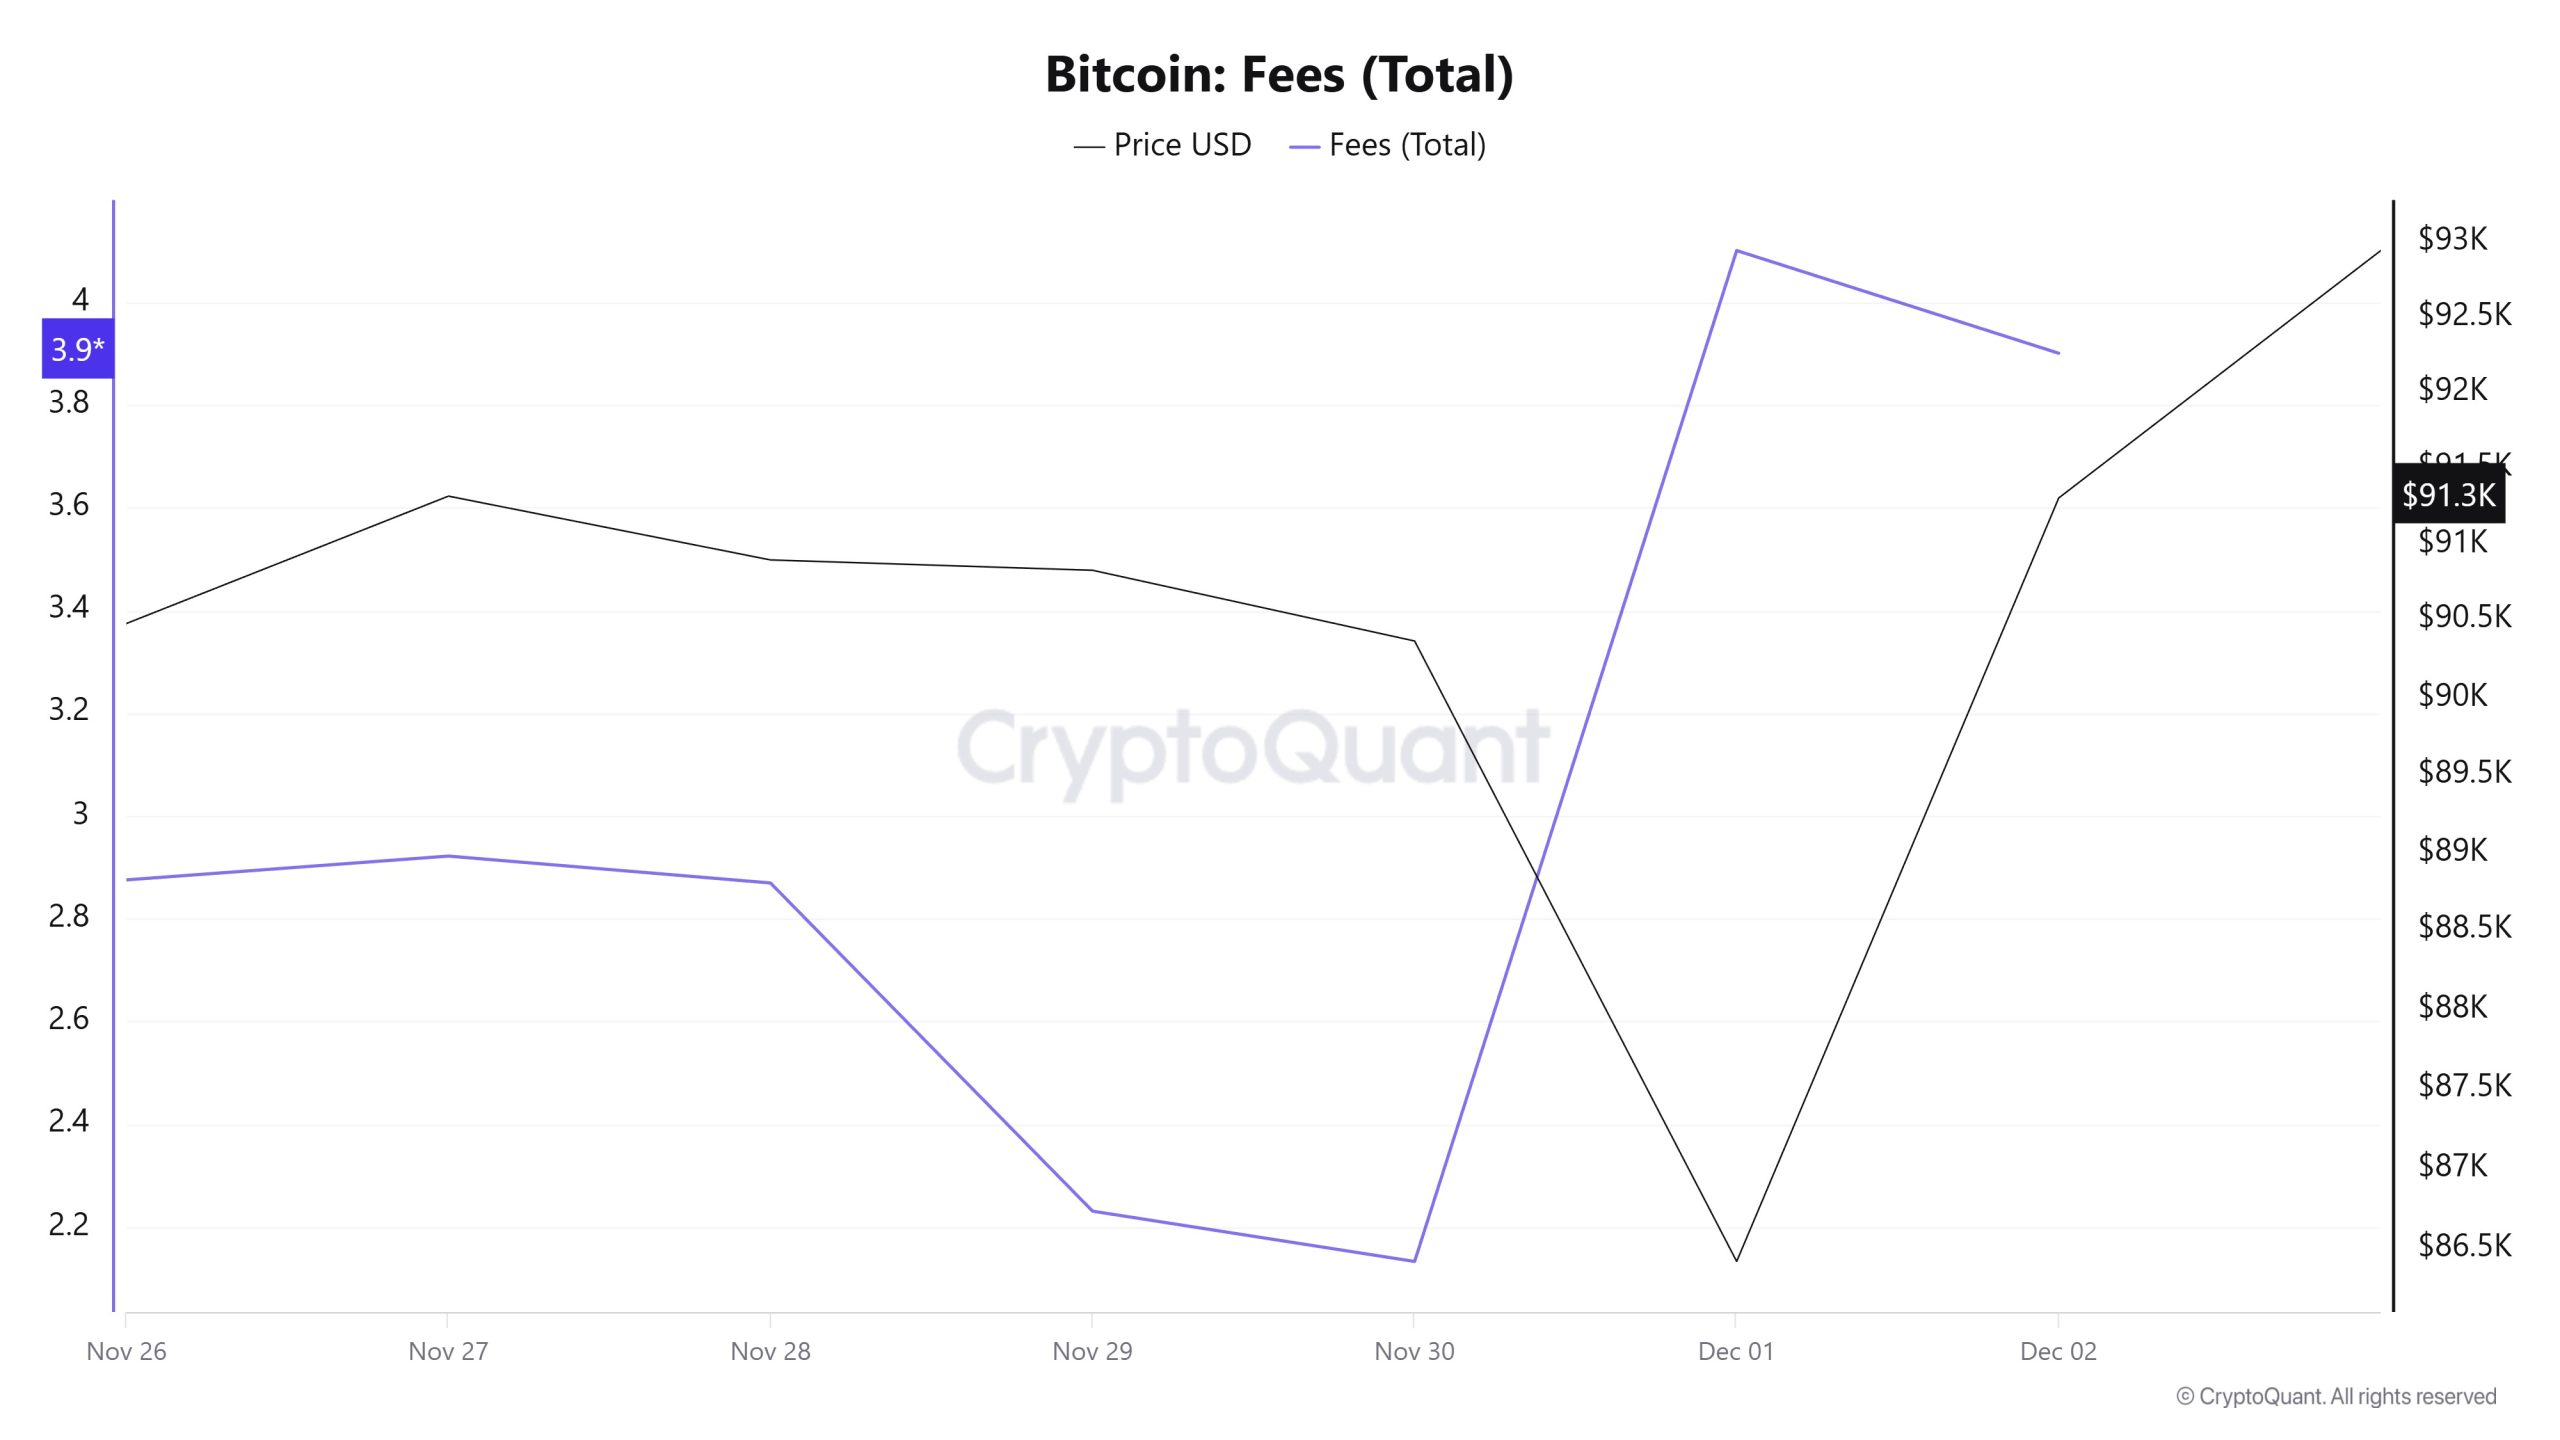
Similarly, when examining the Bitcoin Fees (Total) data between November 26 and December 2, it is seen that the indicator reached 2.87570114 on November 26, the first day of the week.
A fluctuating trend was observed until November 30, and on this date, the indicator recorded the week’s lowest value at 2.13313532.
In this context, as a result of the increase in Bitcoin price volatility as of November 30, the indicator regained momentum and followed a positive trend due to the impact of price volatility.
On December 2, the last day of the weekly period, the indicator closed the week at 3.90062288.
Miner Flows
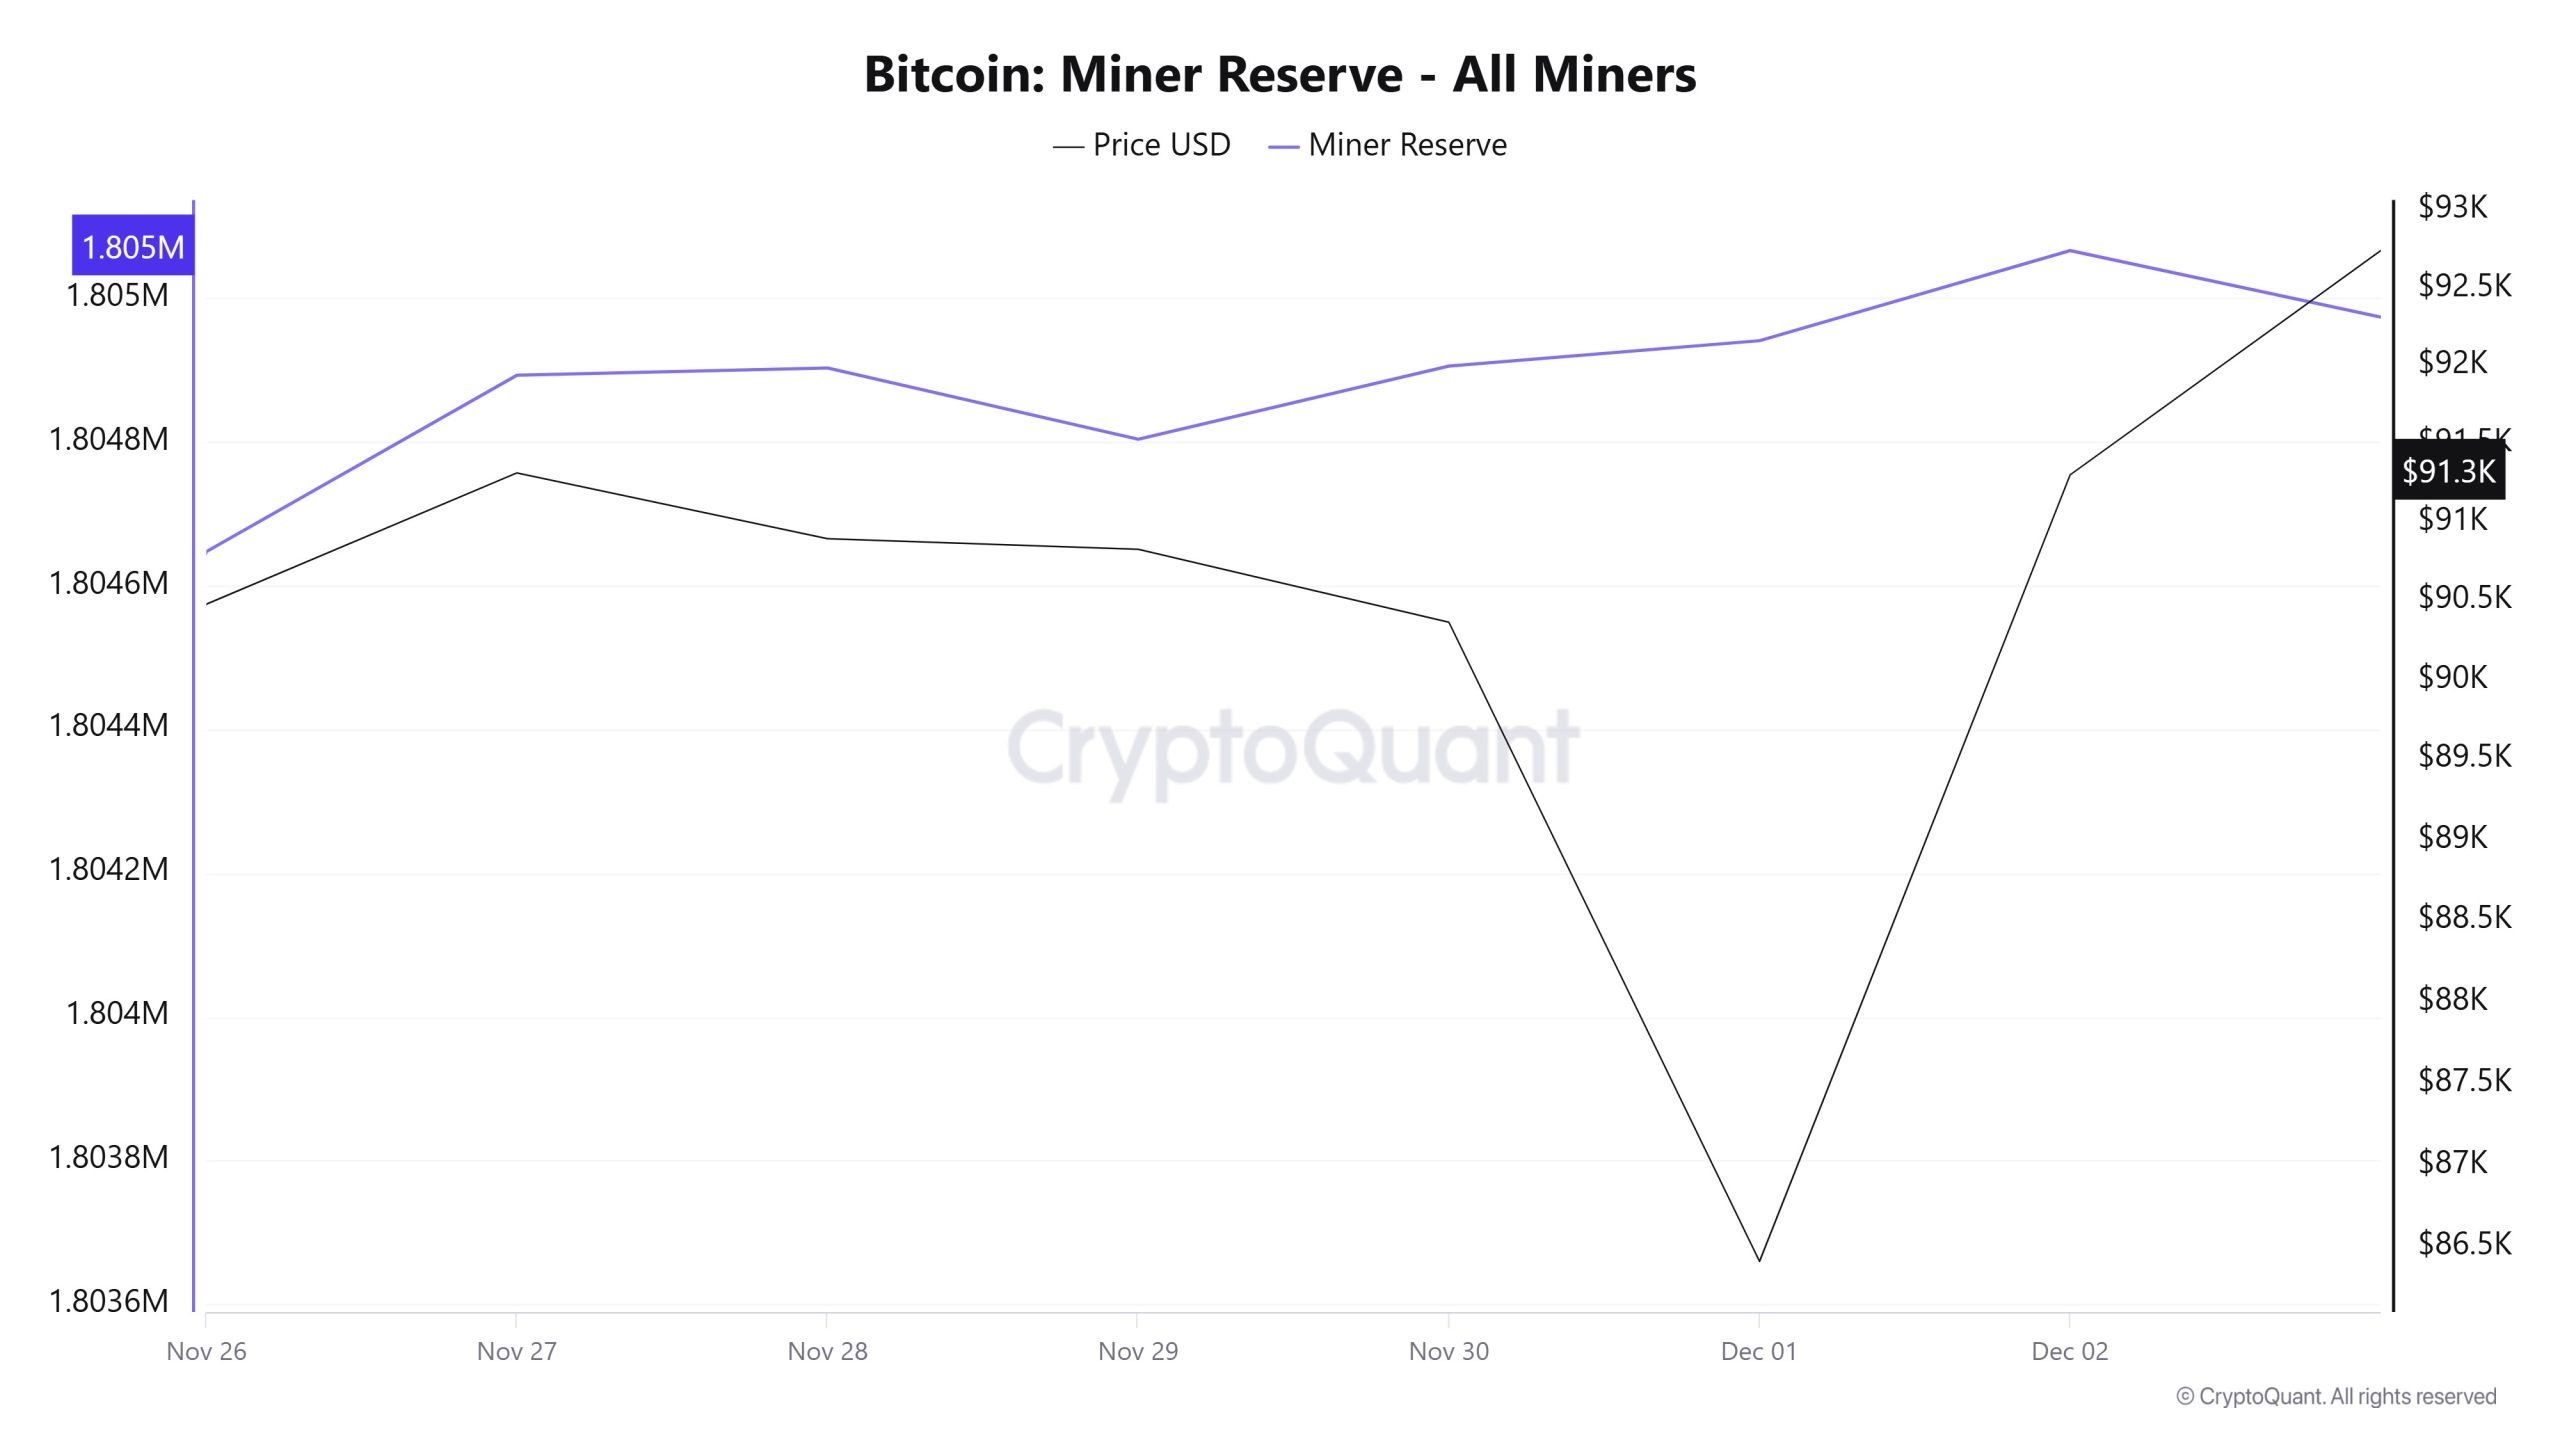
According to data obtained from the Miner Reserve table, an increase in Bitcoin reserves held in miners’ wallets was observed this week. A time-dependent correlation structure between the Bitcoin price and miner reserve was observed during the period under review. However, the general trend shows that a negative correlation between these two variables is dominant.
Miner Inflow, Outflow, and Netflow
Between November 26 and December 2, 47,055 Bitcoin flowed out of miners’ wallets, while 48,458 Bitcoin flowed into miner wallets during the same period. This week’s Miner Netflow was 1,403 Bitcoin. Meanwhile, the Bitcoin price was $90,479 on November 26 and $91,301 on December 2.
Throughout the week, Bitcoin inflows into miner wallets (Miner Inflow) exceeded Bitcoin outflows from miner wallets (Miner Outflow), resulting in a positive net flow (Miner Netflow).
| Nov. 26 | Nov. 27 | Nov. 28 | Nov. 29 | Nov. 30 | Dec. 1 | Dec. 2 | |
|---|---|---|---|---|---|---|---|
| Miner Inflow | 9,451.46 | 9,320.46 | 7,413.95 | 3,237.88 | 3,245.00 | 8,343.13 | 7,446.87 |
| Miner Outflow | 8,463.77 | 9,078.31 | 7,403.94 | 3,337.02 | 3,143.15 | 8,307.88 | 7,321.40 |
| Miner Netflow | 987.70 | 242.15 | 10.01 | -99.14 | 101.85 | 35.25 | 125.48 |
Transaction
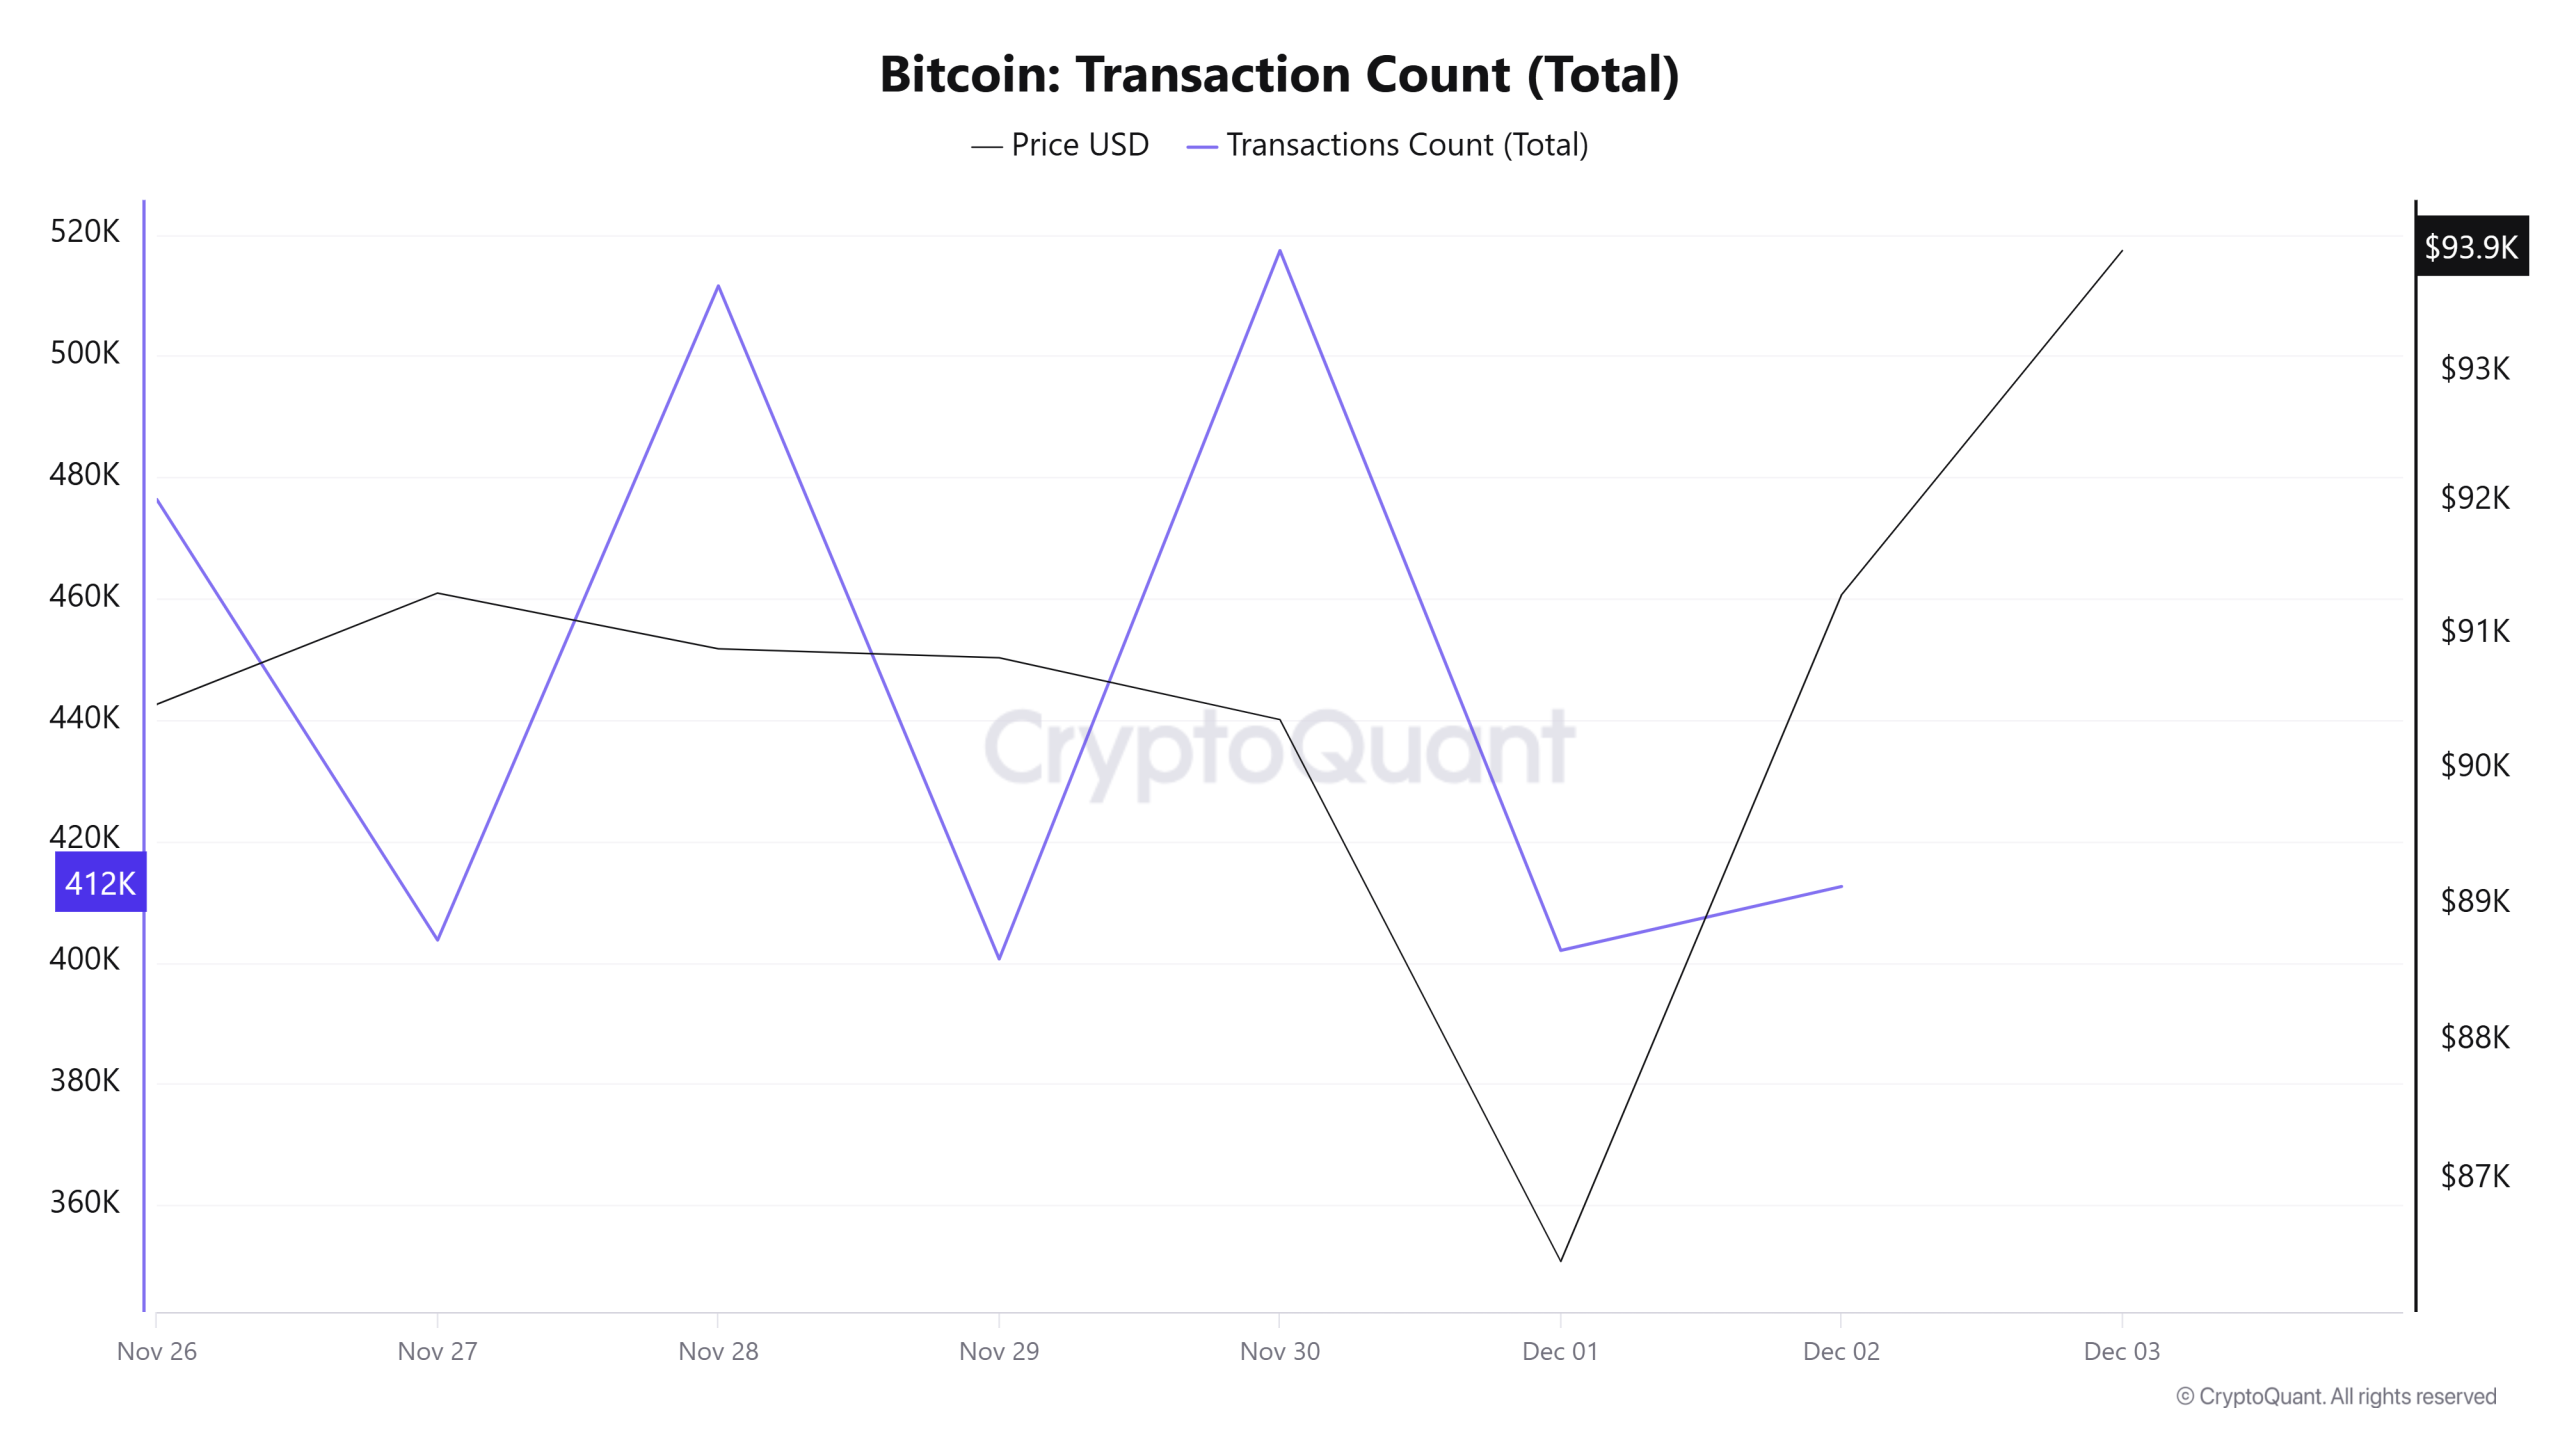
Last week, 2,676,366 transactions took place on the Bitcoin network, while this week the number rose to 3,124,007, recording an increase of approximately 16.7%. The highest transaction volume of the week was measured at 517,367 on November 30, while the lowest transaction volume was 400,566 on November 29.
Looking at the transaction count graph, a distinctly harmonic fluctuation pattern stands out for the period covering November 26–30. Furthermore, the weekend network activity intensity that has been noticeable for the past few weeks appears to have been maintained during this period. The general trend is as follows: If the price is moving sharply downward, on-chain activity generally intensifies on weekends. Conversely, if the price is flat or trending upward, network usage shifts to weekdays.
Although the price is trending upward in the current period, the fact that on-chain activity peaks on weekends indicates that whether this pattern will repeat will only become clear with data from the next period. Nevertheless, the current movements strongly suggest that a local bottom may have formed last week.
Tokens Transferred
While a total of 7,772,454 BTC was transferred in the previous period, this week it decreased by 31.46% to 5,327,523 BTC. The highest daily transfer of the week was 921,161 BTC on December 2, while the lowest transfer volume was 560,186 BTC on November 29. The correlation between the amount of tokens transferred and price remained negatively weighted on a weekly basis.
While the amount of Bitcoin transferred decreased significantly, the increase in the number of transactions indicates that there was a concentration of less consistent and lower-volume transactions during this period. This picture may indicate that the impact of a larger number of smaller-value user movements on the price became more apparent during this period.
Whale Activities
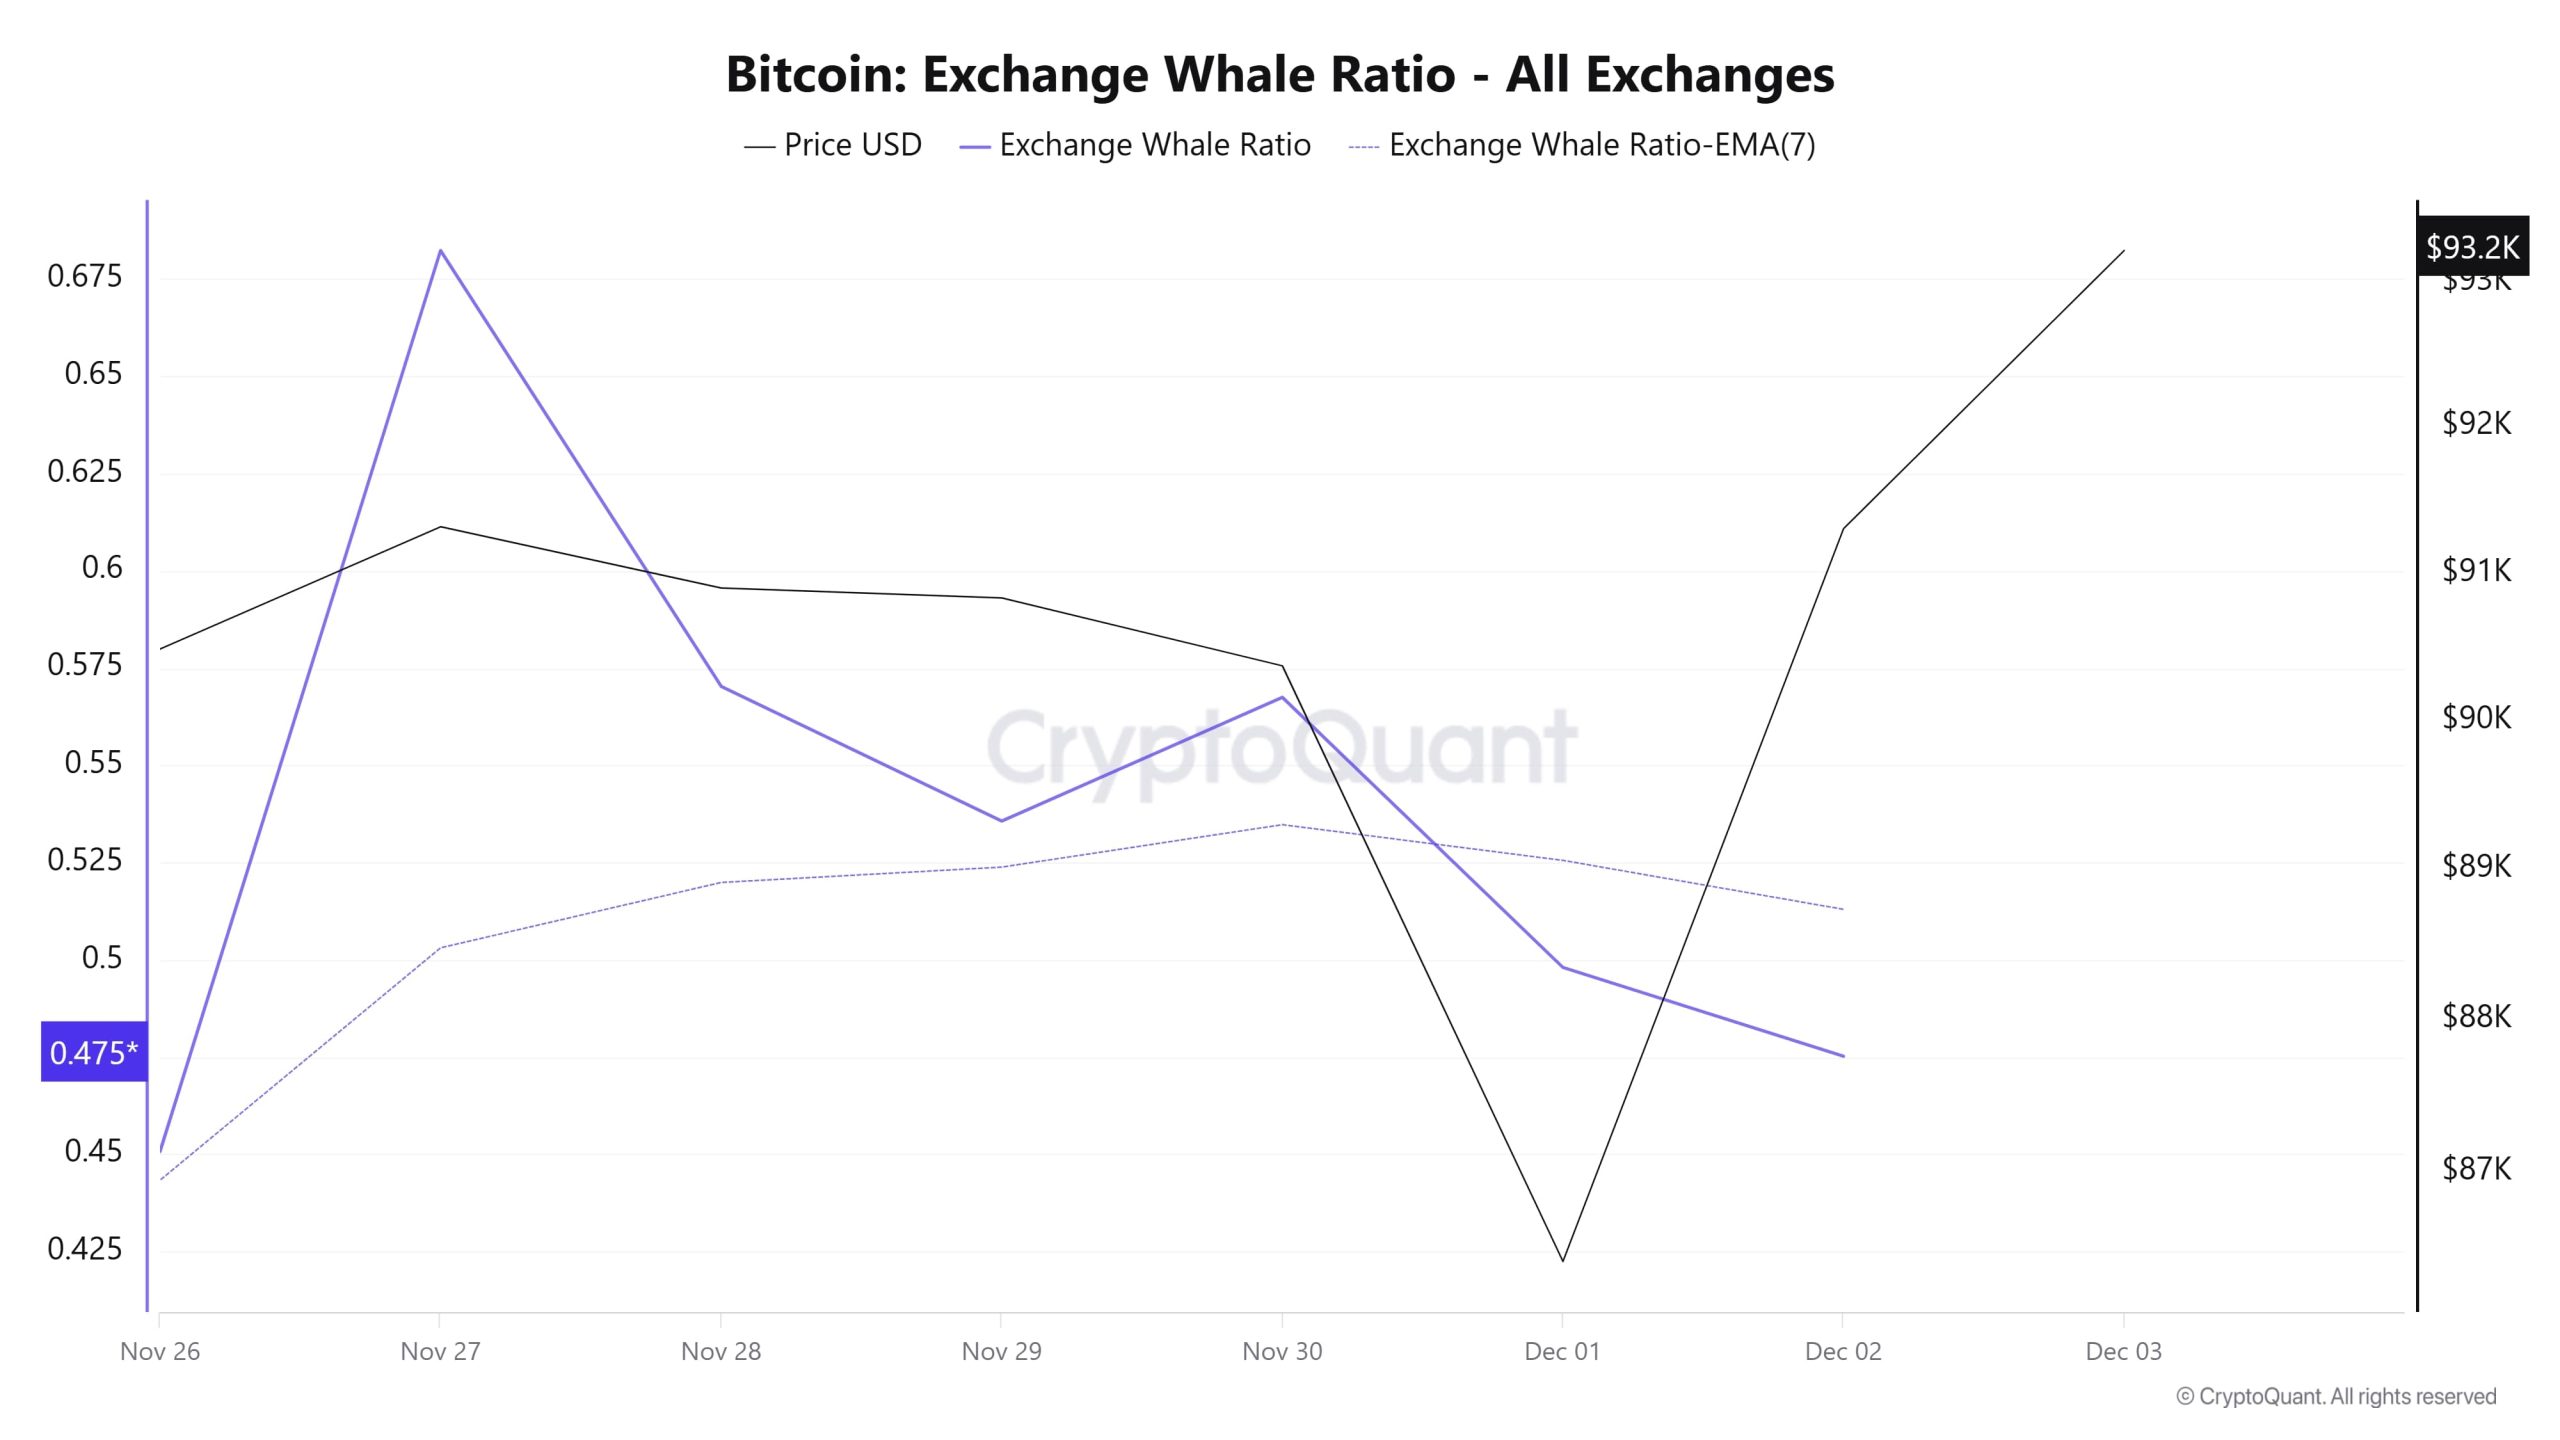
Whale Data:
Looking at whale activity on centralized exchanges over the past 7 days based on cryptocurrency market data, we see an initial rise followed by a decline in momentum and volume for the remainder of the period. Looking at the Exchange Whale Ratio metric, on November 26, the first day of the 7-day period, the ratio of whales using centralized exchanges was 0.450, marking the lowest point of the period. It reached its peak on November 27, reaching a value of 0.682. When this ratio is above the 0.35–0.45 band, it generally means that whales are frequently using centralized exchanges. Currently at 0.475, the metric shows that whales continue to use centralized exchanges frequently. During this period, the price fluctuated between $93,800 and $84,000. This indicated that the buying and selling competition among whales on centralized exchanges remained balanced. At the same time, total BTC transfers decreased by 31% compared to last week, with 5,327,523 BTC moving. The data shows that whales are not selling in a panic but are being quite selective about where they accumulate. While the number of holdings with over 1,000 BTC is increasing, some whales appear to have started accumulating again. Large whale cost basis clusters are located between $83,000 and $89,000. This could mean that if the price remains at this level, whales may be preparing to accumulate again. Ultimately, this contrast between retail panic and institutional confidence has become the defining feature of the current market environment.
BTC Onchain Overall
| Metric | Positive 📈 | Negative 📉 | Neutral ➖ |
|---|---|---|---|
| Active Addresses | ✓ | ||
| Breakdowns | ✓ | ||
| Derivatives | ✓ | ||
| Supply Distribution | ✓ | ||
| Exchange Supply Ratio | ✓ | ||
| Exchange Reserve | ✓ | ||
| Fees and Revenues | ✓ | ||
| Miner Flows | ✓ | ||
| Transaction | ✓ | ||
| Whale Activities | ✓ |
*The metrics and guidance provided in the table do not alone explain or imply any expectation regarding future price changes in any asset. The prices of digital assets can fluctuate based on numerous different variables. The on-chain analysis and related guidance are intended to assist investors in their decision-making process, and basing financial investments solely on the results of this analysis may lead to unfavourable outcomes. Even if all metrics simultaneously produce positive, negative, or neutral results, the expected outcomes may not materialize depending on market conditions. It would be beneficial for investors reviewing the report to take these warnings into consideration.
Legal Notice
The investment information, comments, and recommendations contained in this document do not constitute investment advisory services. Investment advisory services are provided by authorized institutions on a personal basis, taking into account the risk and return preferences of individuals. The comments and recommendations contained in this document are of a general nature. These recommendations may not be suitable for your financial situation and risk and return preferences. Therefore, making an investment decision based solely on the information contained in this document may not result in outcomes that align with your expectations.
NOTE: All data used in Bitcoin on-chain analysis is based on CryptoQuant.
