
Active Addresses
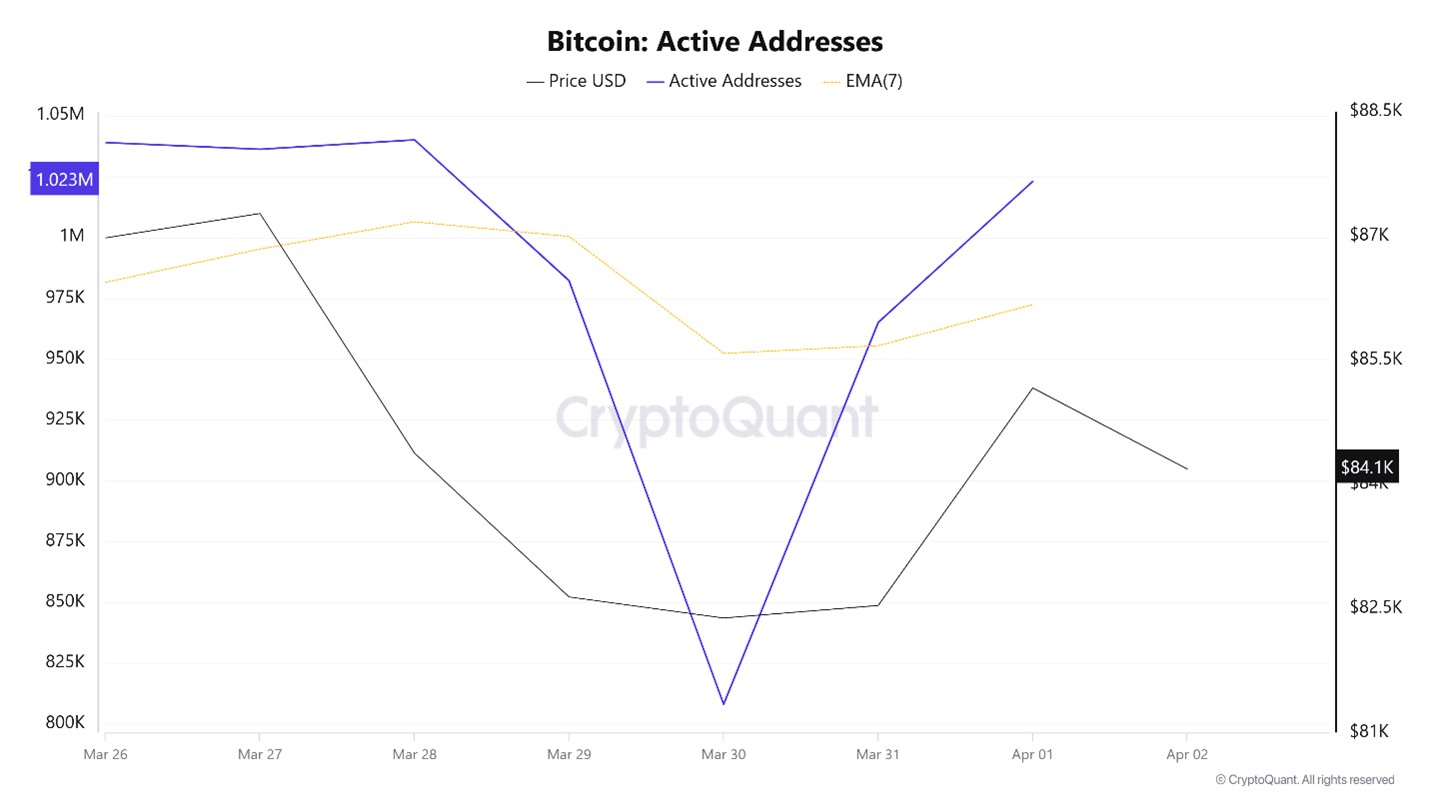
In terms of active addresses, there were 1,093,362 active entries el the BTC network this week between March 26 and April 2, 2025. During this period, Bitcoin rose from $82,000 to $85,000. In the region marked el the chart, where the price and the number of active addresses intersect, we see that Bitcoin purchases have changed direction. When we follow the 7-day simple moving average, it is observed that the price followed an upward trend el the dates when this average also crossed the price. This situation indicates that the Bitcoin price is experiencing entries at $82,000 levels.
Active Sending Addresses
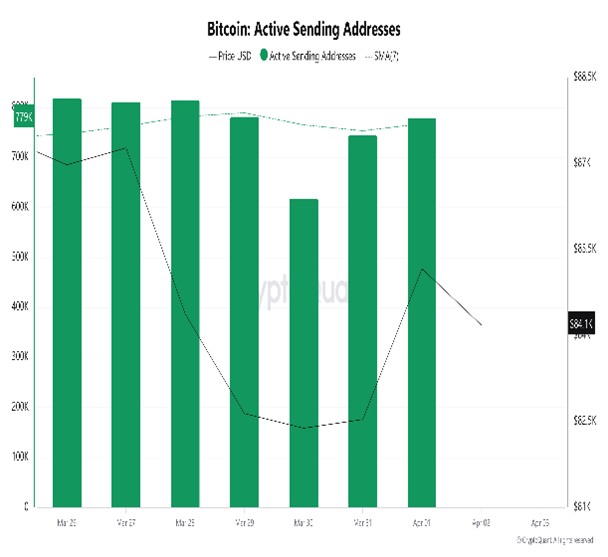
With the Black Line (price line) en active shipping addresses, there has been a significant drop en active shipping addresses after March 30. On the day when the price hit its lowest point, active sending addresses rose as high as 729,636 , indicating that buyers sold their positions as Bitcoin stayed at $83,843 for a while. As a result, price drops seem to cause an acceleration en sending addresses. .
Active Receiving Addresses
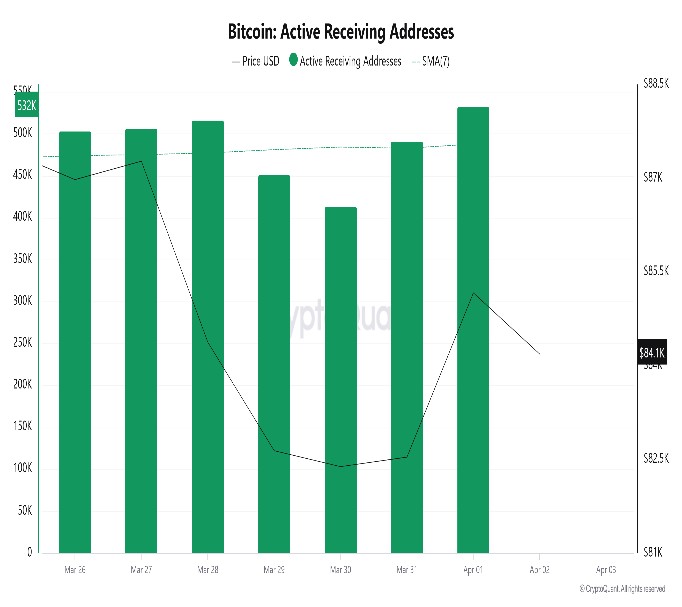
With the Black Line (price line) en active shipping addresses, there has been a significant drop en active shipping addresses after March 31. On the day of the price low, active shipping addresses rose as high as 413,118 , indicating that buyers took their positions at Bitcoin’s $82,000 level.
Breakdowns
MRVR
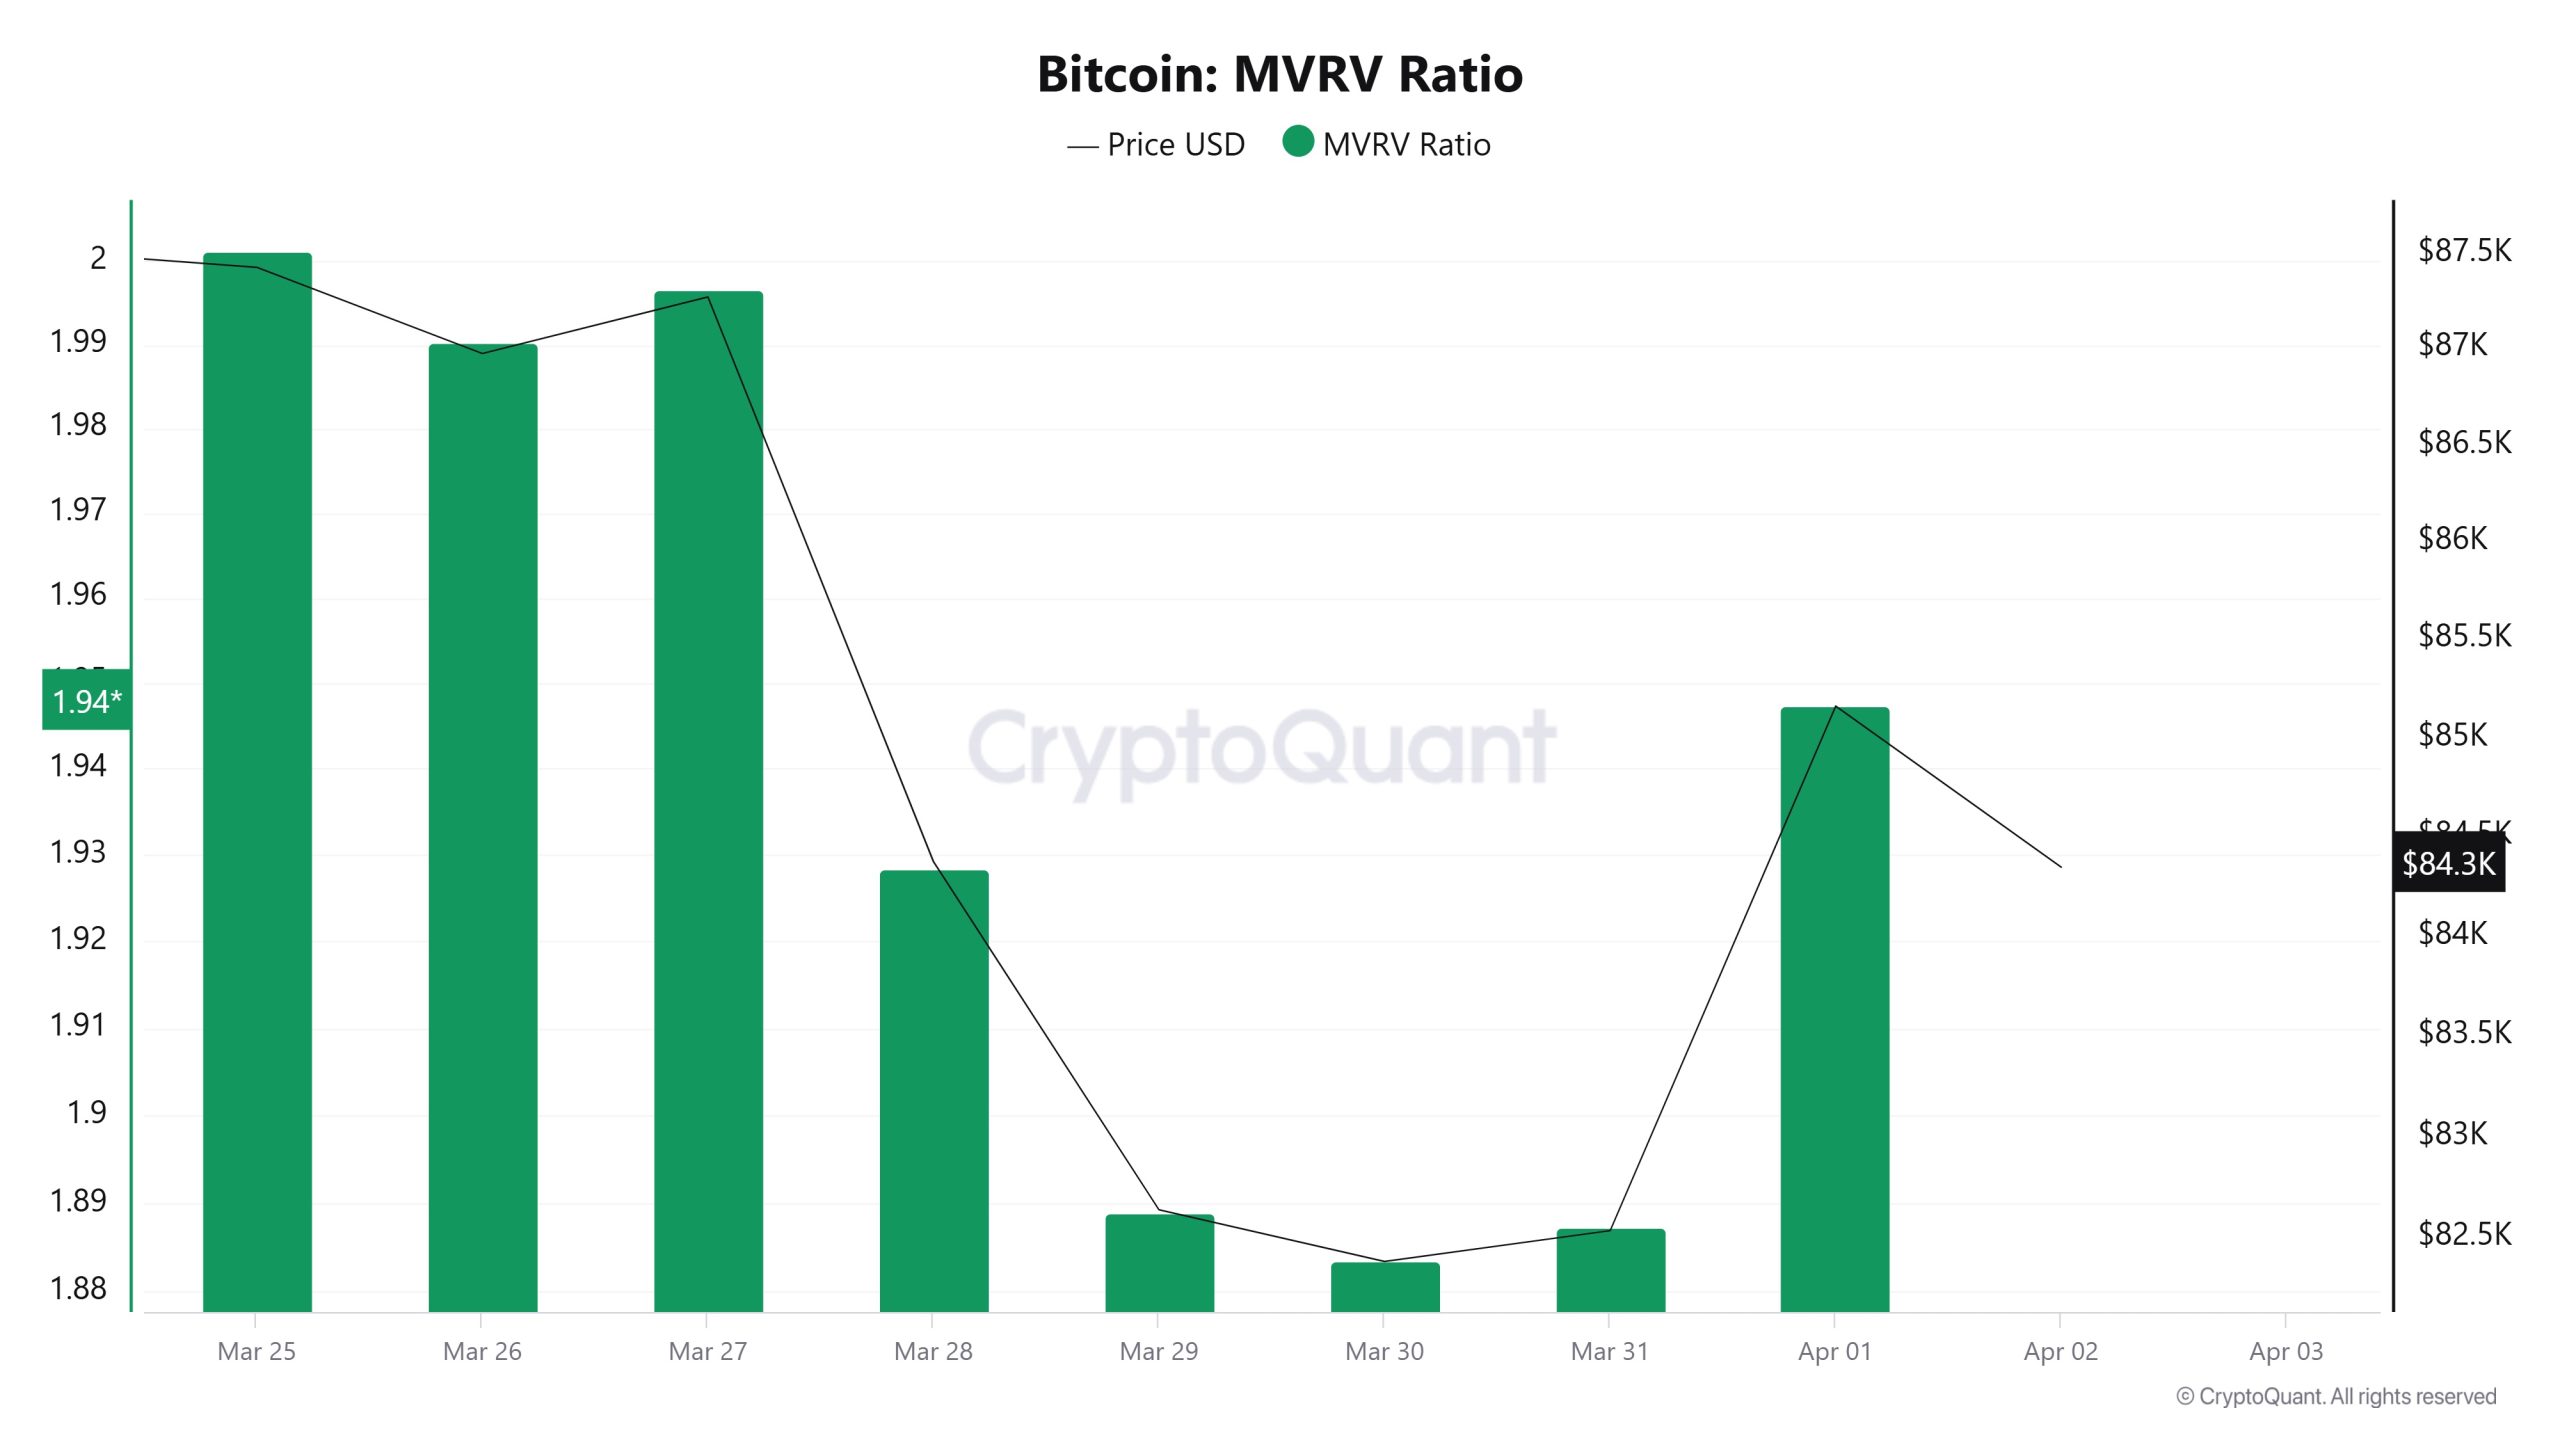
On March 26, the Bitcoin price was 86,975 and the MVRV Ratio was 1.99. As of April 1, the Bitcoin price was down to 85,162, while the MVRV Ratio was 1.94. Compared to last week, Bitcoin price decreased por 2.08% and MVRV Ratio decreased por 2.51%.
Realized Price
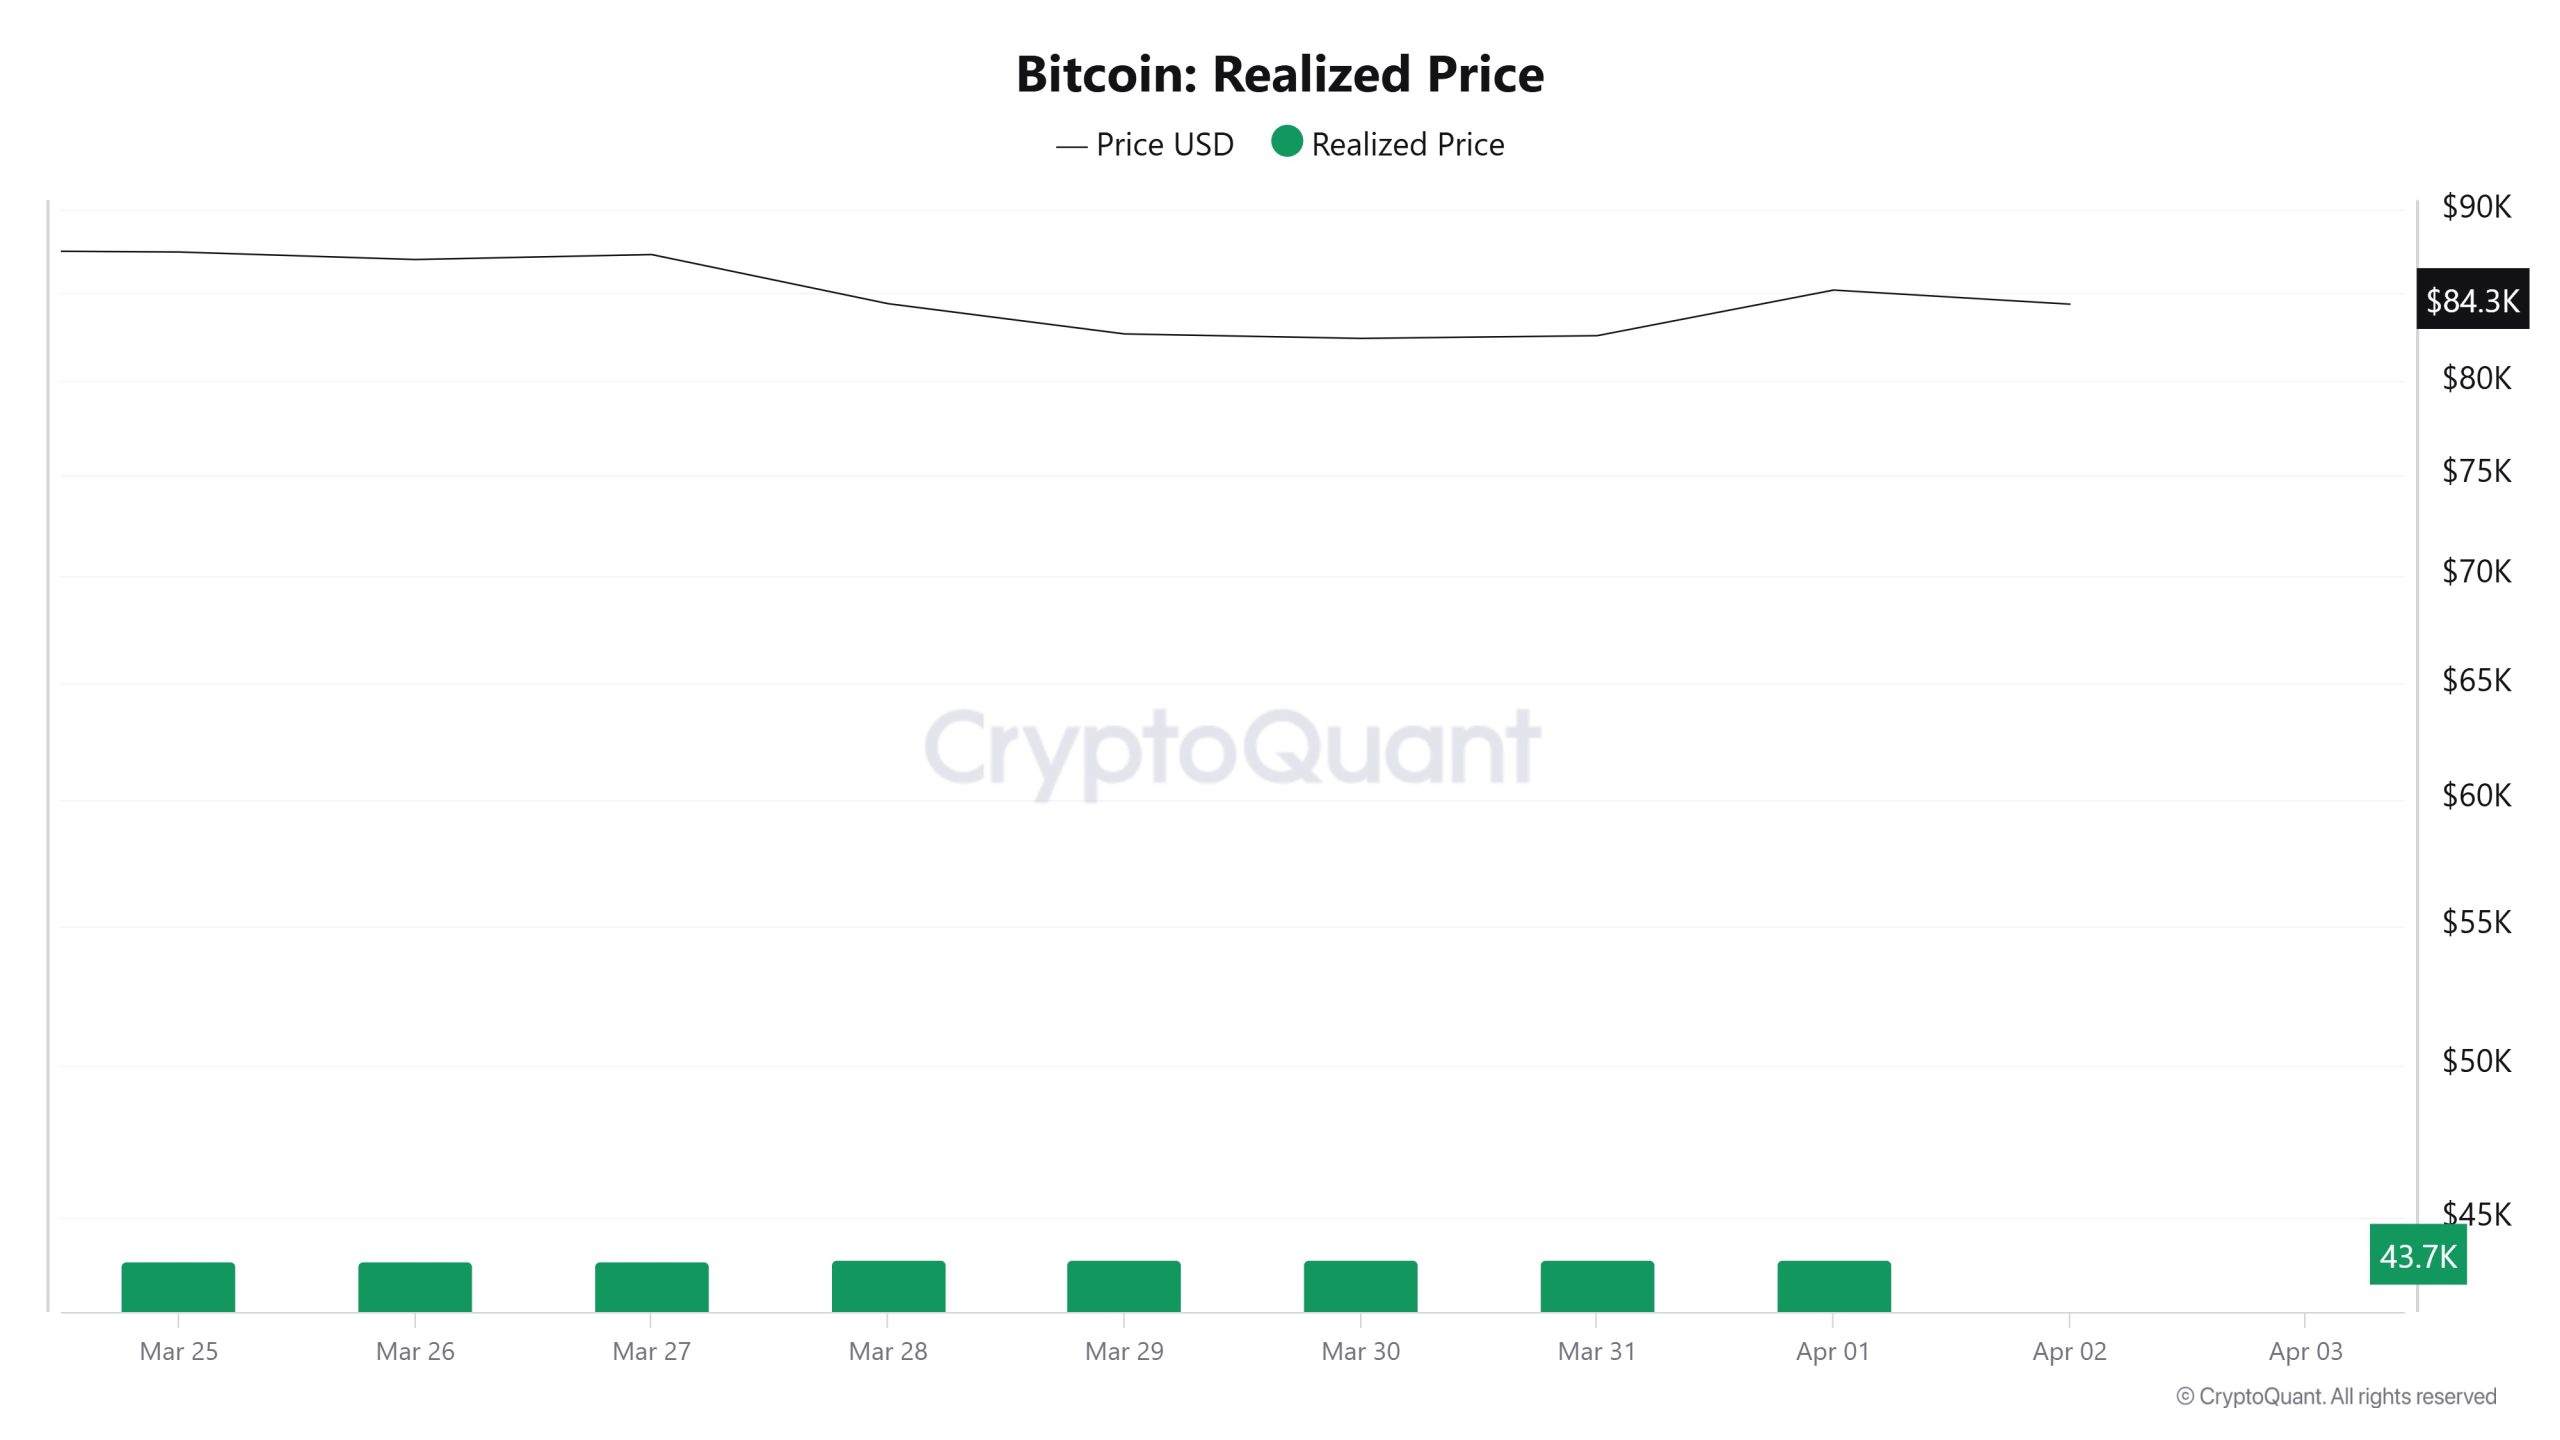
On March 26, the Bitcoin price was 86,975 while the Realized Price was 43,697. As of April 1, the Bitcoin price was down to 85,162 while the Realized Price was 43,731. Compared to last week, the Bitcoin price decreased por 2.08% while the Realized Price increased por 0.078%.
Spent Output Profit Ratio (SOPR)
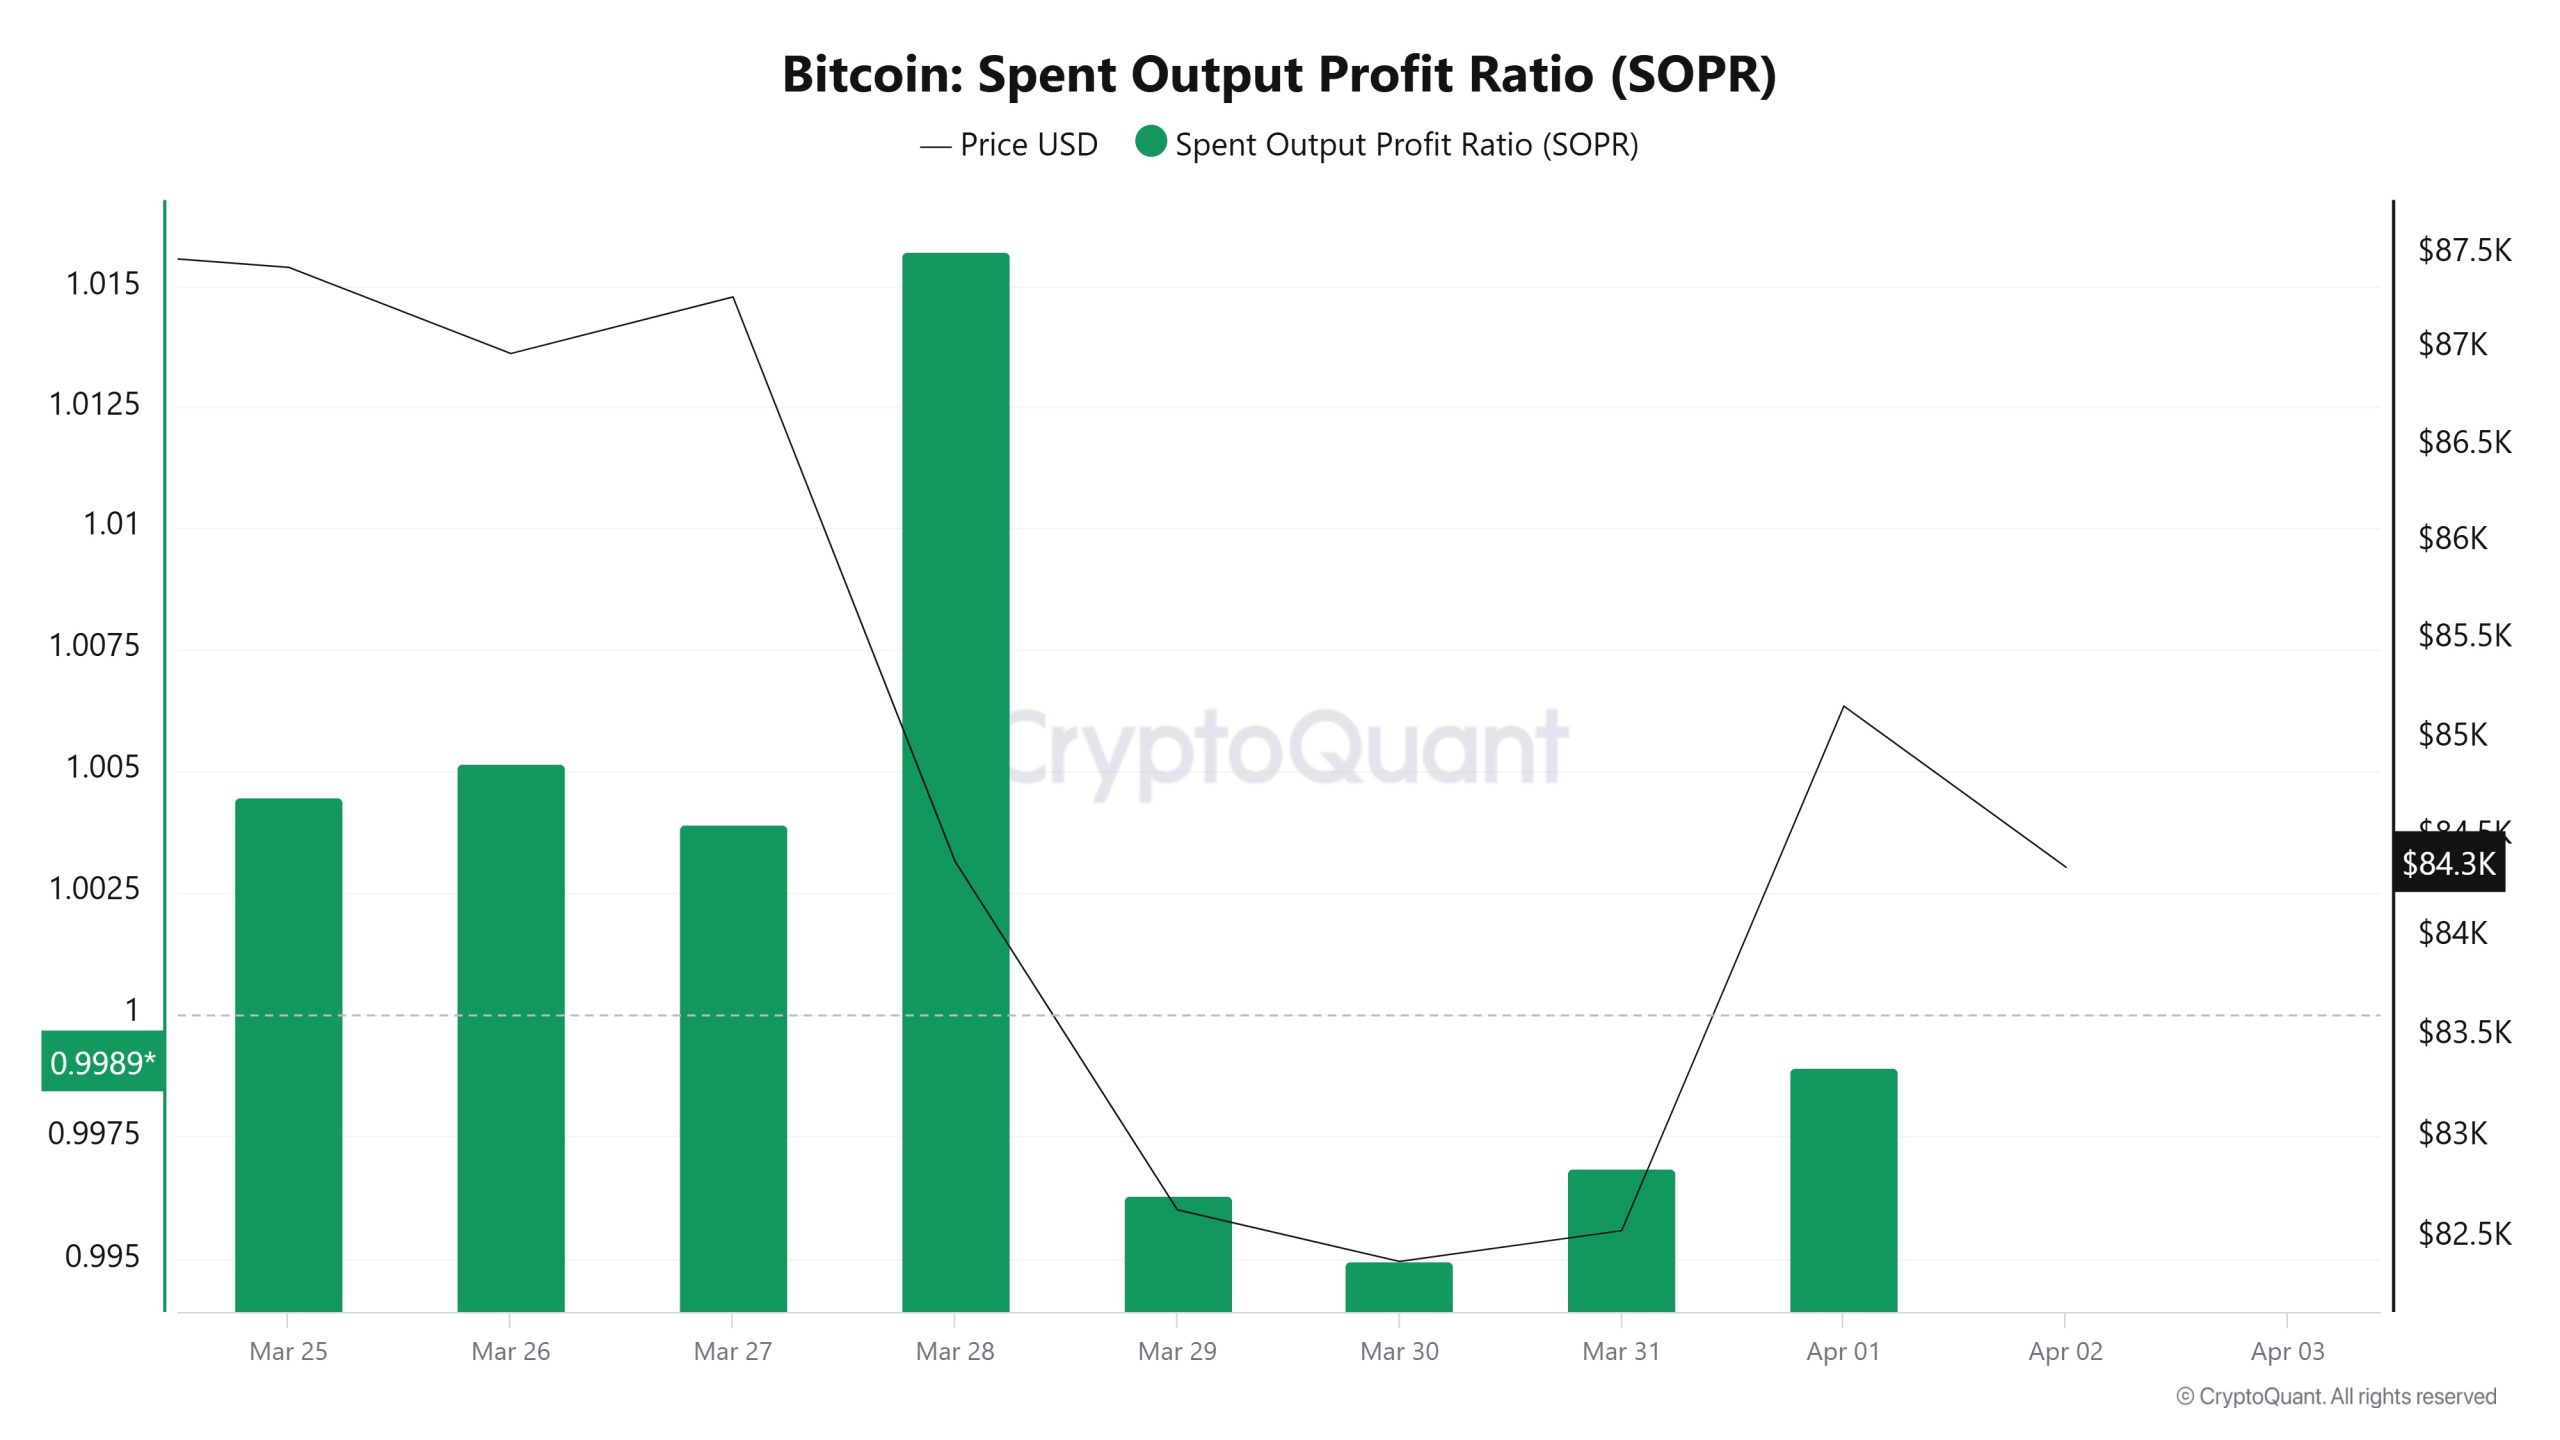
On March 26, the Bitcoin price was 86,975, while the SOPR metric was 1.005. As of April 1, the Bitcoin price has fallen to 85,162 while the SOPR metric has decreased to 0.998. Compared to last week, Bitcoin price decreased por 2.08% while the SOPR metric decreased por 0.70%.
Derivatives
Open Interest
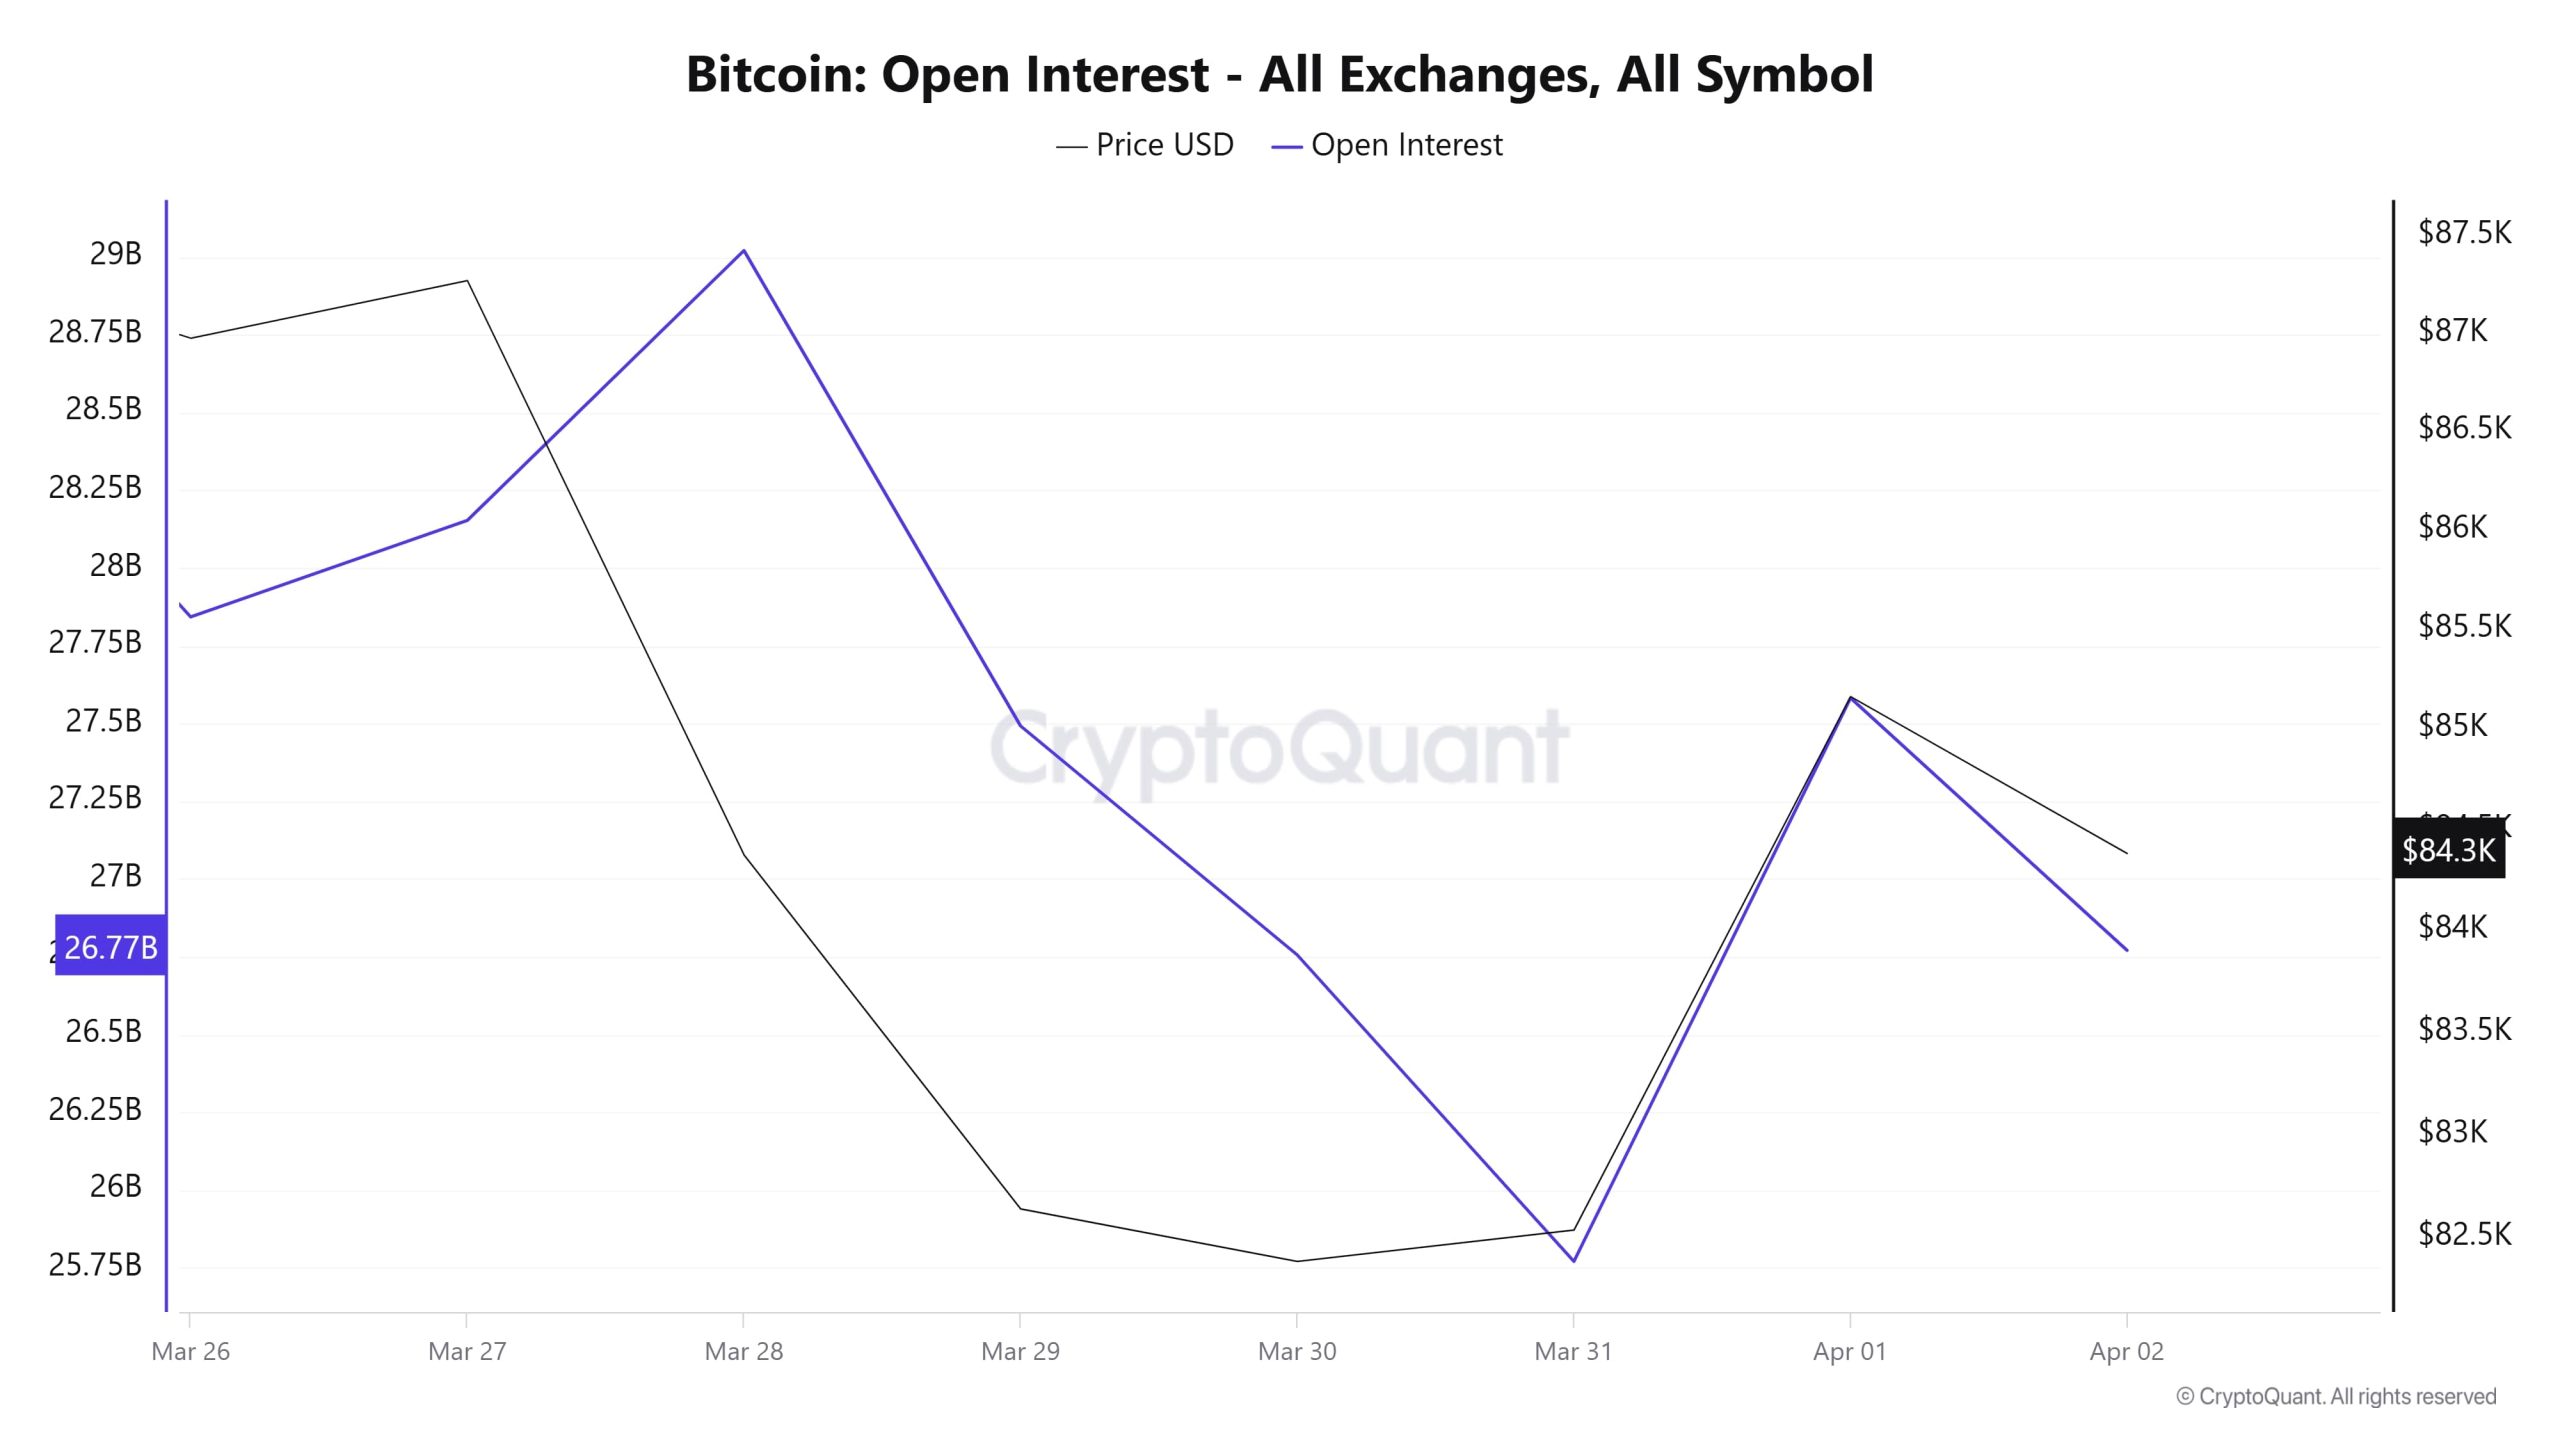
Between March 26 and March 28, open interest was el an upward trend and the price also showed a slight increase during this period. However, por March 28, open interest also declined sharply as the price fell sharply. This movement suggests that a large amount of long positions were liquidated or traders exited the market. During the period from March 30 to March 31, the price remained flat while open interest remained at low levels. During this period, leveraged trades en the market decreased and investors were cautious about opening new positions. As of April 1st, both price and open interest experienced a rapid recovery. As the price started to rise, the OI also increased significantly. This indicates that new long positions were entering the market and investors started to take risks again. However, el April 2, the OI declined again, suggesting that the rally may have been short-lived and that investors may have engaged en profit realization. In order to determine the direction of the price, it is important to keep a close eye el whether the recovery en open interest will continue. In particular, if open interest continues to rise while the price continues to rise, it may confirm that a sustainable uptrend is en place. Otherwise, a new wave of declines may occur with the re-liquidation of leveraged long positions.
Funding Rate
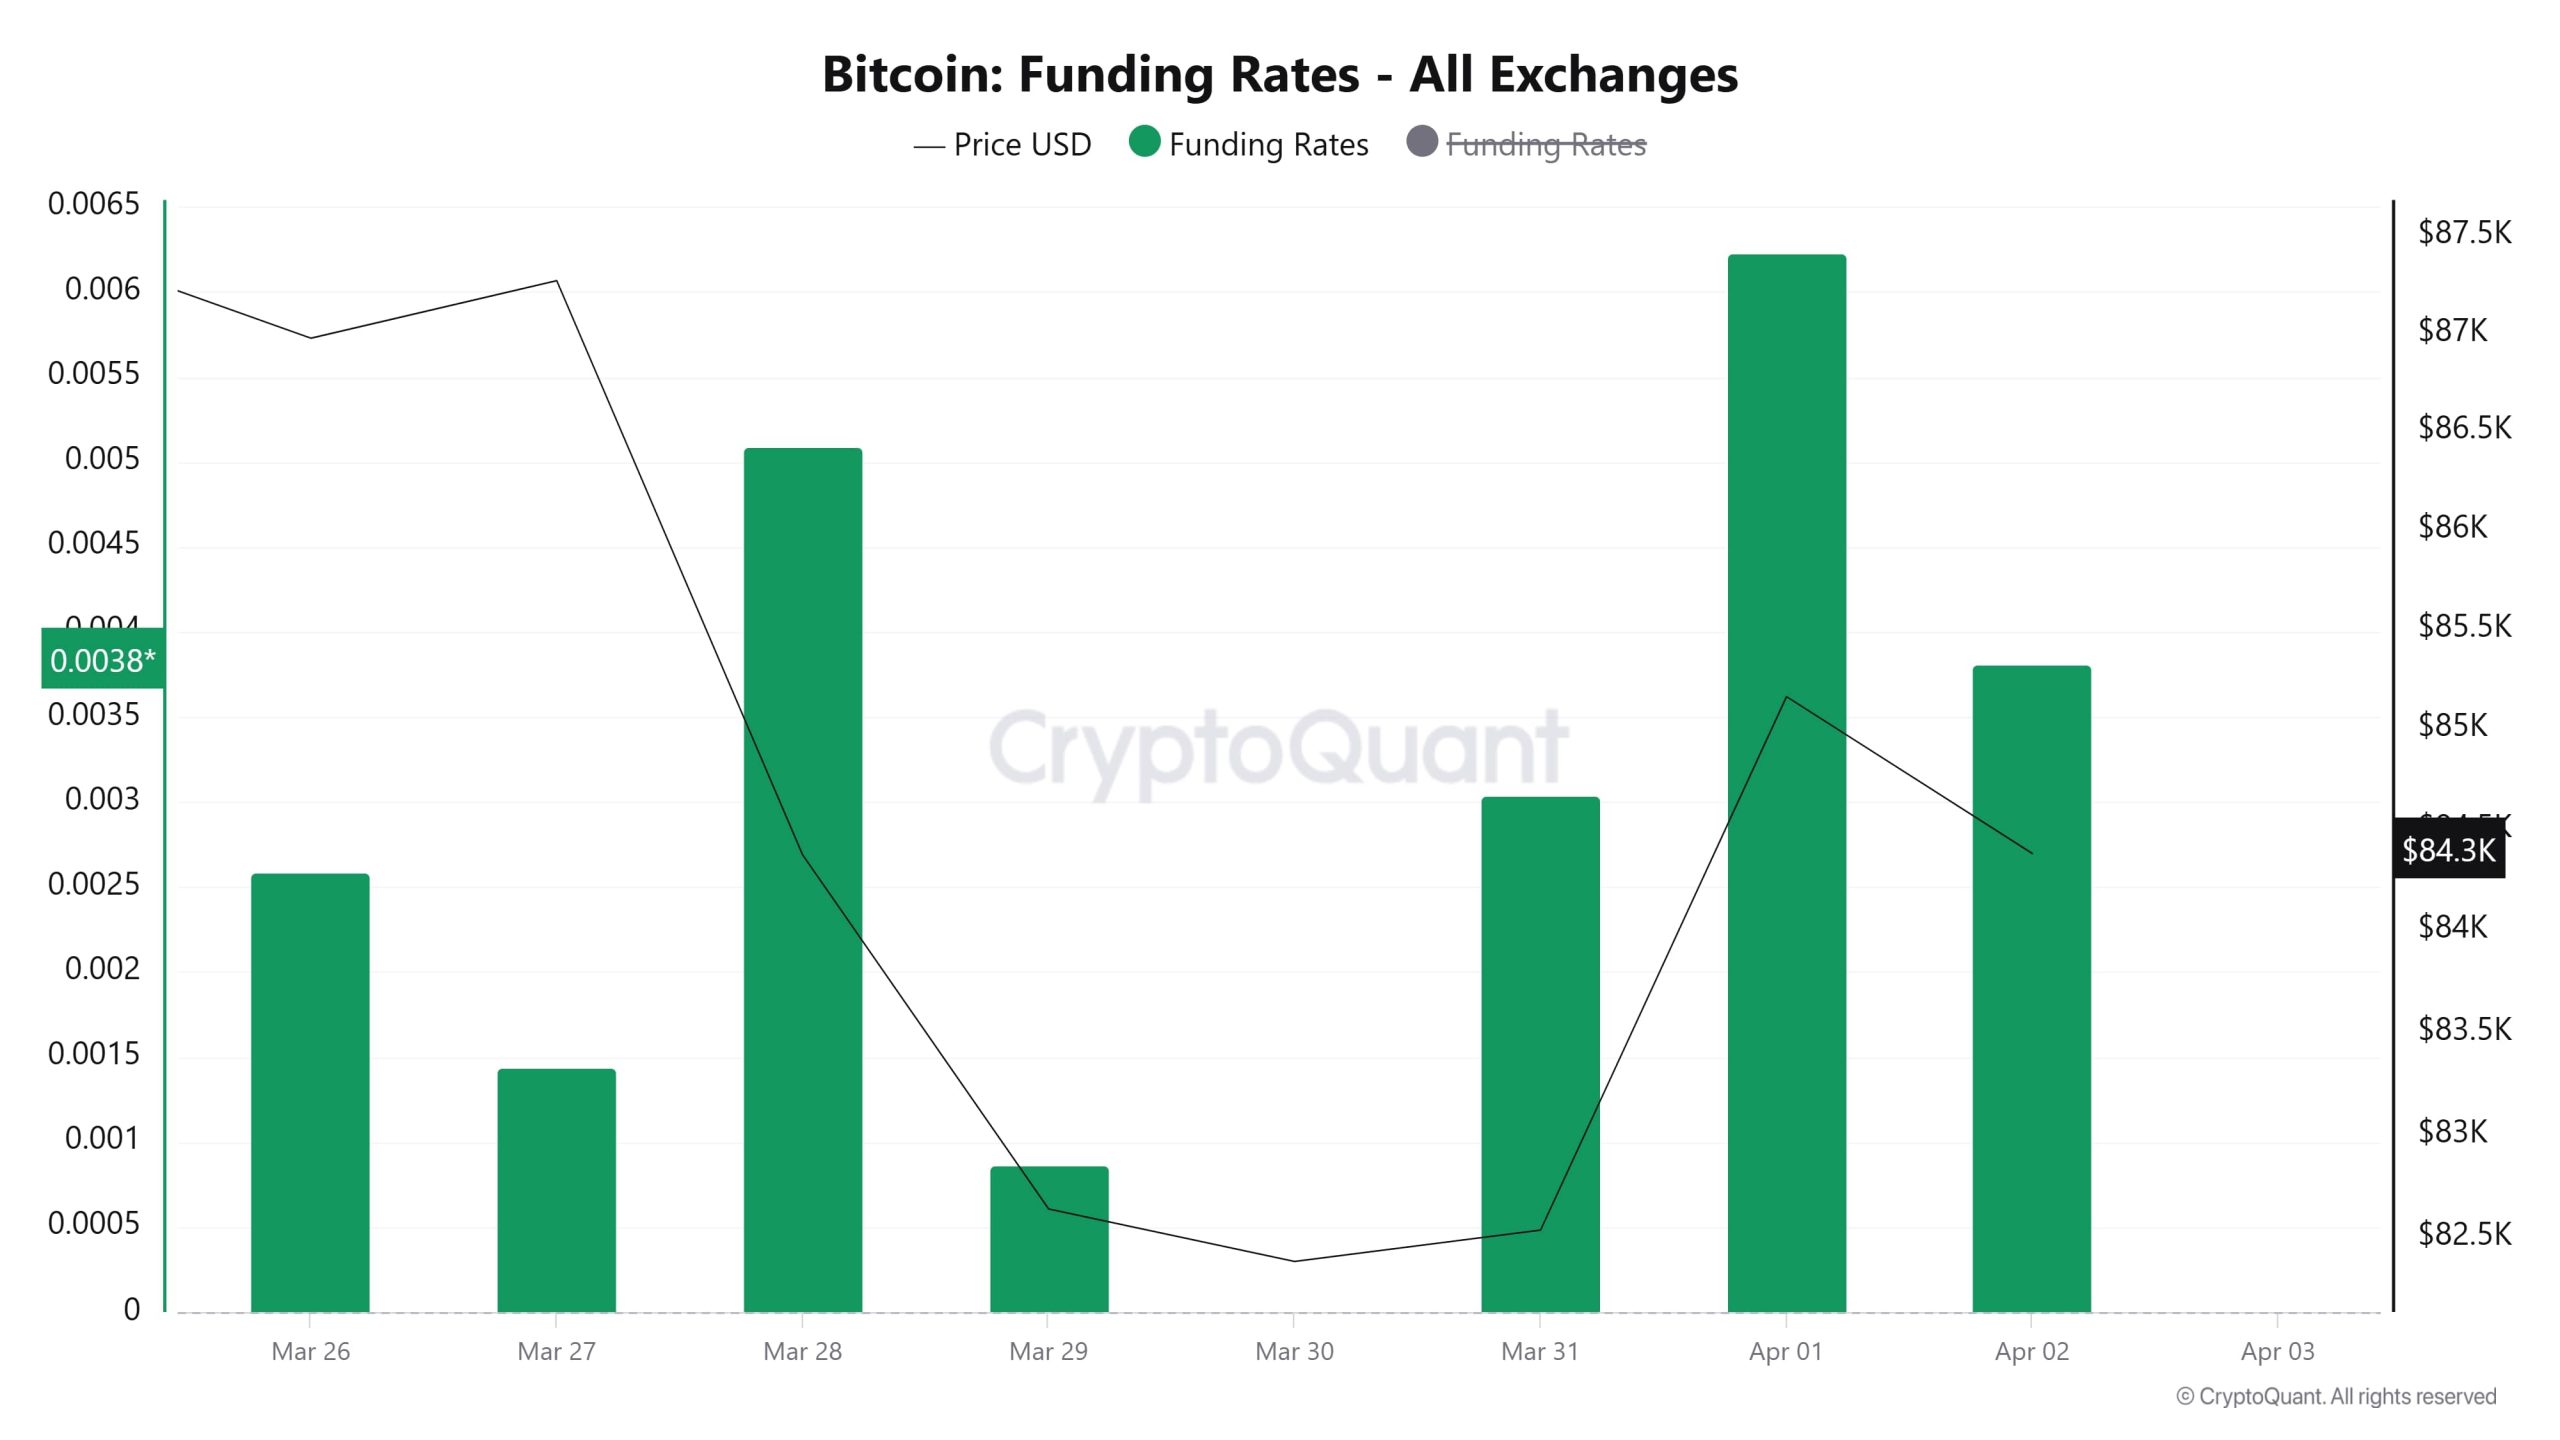
Between March 26 and 28, the funding rate was positive, and the price rose, indicating that investors preferred long positions. However, el March 29 – 30, the funding rate fell sharply and the price declined. This suggests that long positions were closed and short trades increased. On March 31, the funding rate started to rise again and reached its highest level el April 1. At the same time, the price also rose, indicating that long positions were re-entering the market. On April 2, the funding rate dropped slightly, but it is still en positive territory. Overall, the funding rate remains en positive territory, indicating that investors continue to expect bullish sentiment. However, if it rises to extremely high levels, it may indicate that the market has become overleveraged, and the risk of a possible correction has increased.
Long & Short Liquidations
BTC, which had a very volatile week, managed to exceed the $85,000 level por recovering rapidly after falling to $81,300. With this activity, approximately 765.87 million dollars of long and 455 million dollars of short positions were liquidated.
| Date | Long Amount (Million $) | Short Amount (Million $) |
|---|---|---|
| March 26 | 408.25 | 14.10 |
| March 27 | 19.91 | 258.58 |
| March 28 | 183.81 | 12.69 |
| March 29 | 53.36 | 37.29 |
| March 30 | 34.50 | 17.54 |
| March 31 | 35.57 | 64.05 |
| April 01 | 30.47 | 51.41 |
| Total | 765.87 | 455.66 |
Supply Distribution
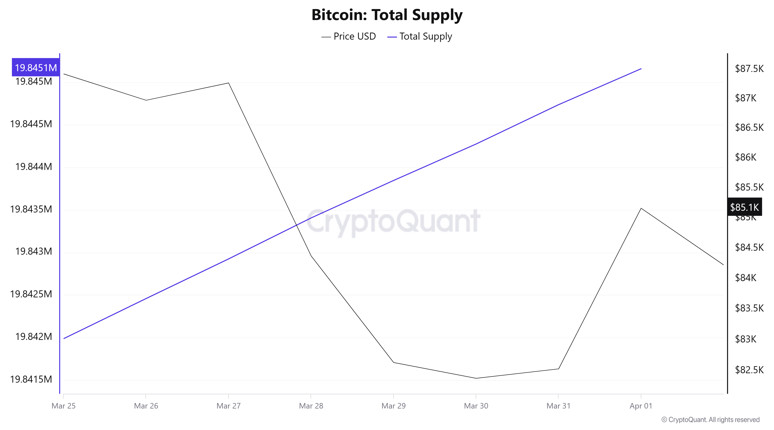
Total Supply: It reached 19,845,158 units, up about 0.016% from last week.
New Supply: The amount of BTC produced this week was 3,172.
Velocity: Velocity, which was 13.39 last week, was 13.27 as of April 1.
Supply Distribution
| Wallet Categoría | 25.03.2025 | 01.04.2025 | Change (%) |
|---|---|---|---|
| < 1 BTC | 8.5450% | 8.5415% | -0.041% |
| 1 – 10 BTC | 11.76% | 11.751% | -0.076% |
| 10 – 100 BTC | 24.757% | 24.842% | 0.343% |
| 100 – 1k BTC | 28.162% | 28.094% | -0.241% |
| 1k – 10k BTC | 18.411% | 18.506% | 0.516% |
| 10k+ BTC | 8.360% | 8.263% | -1.160% |
In the wallet distribution of the current supply, a small decrease of 0.041% was observed en the < 1 BTC category, while holders of 1 – 10 BTC experienced a slight decrease of 0.076%. The 10 – 100 BTC range increased por 0.343%, while the 100 – 1K BTC segment decreased por 0.241%. 1K – 10K BTC holders saw a significant increase of 0.516%, while the most significant change was en the 10K+ BTC category with a notable increase of 1.160%.
Exchange Reserve
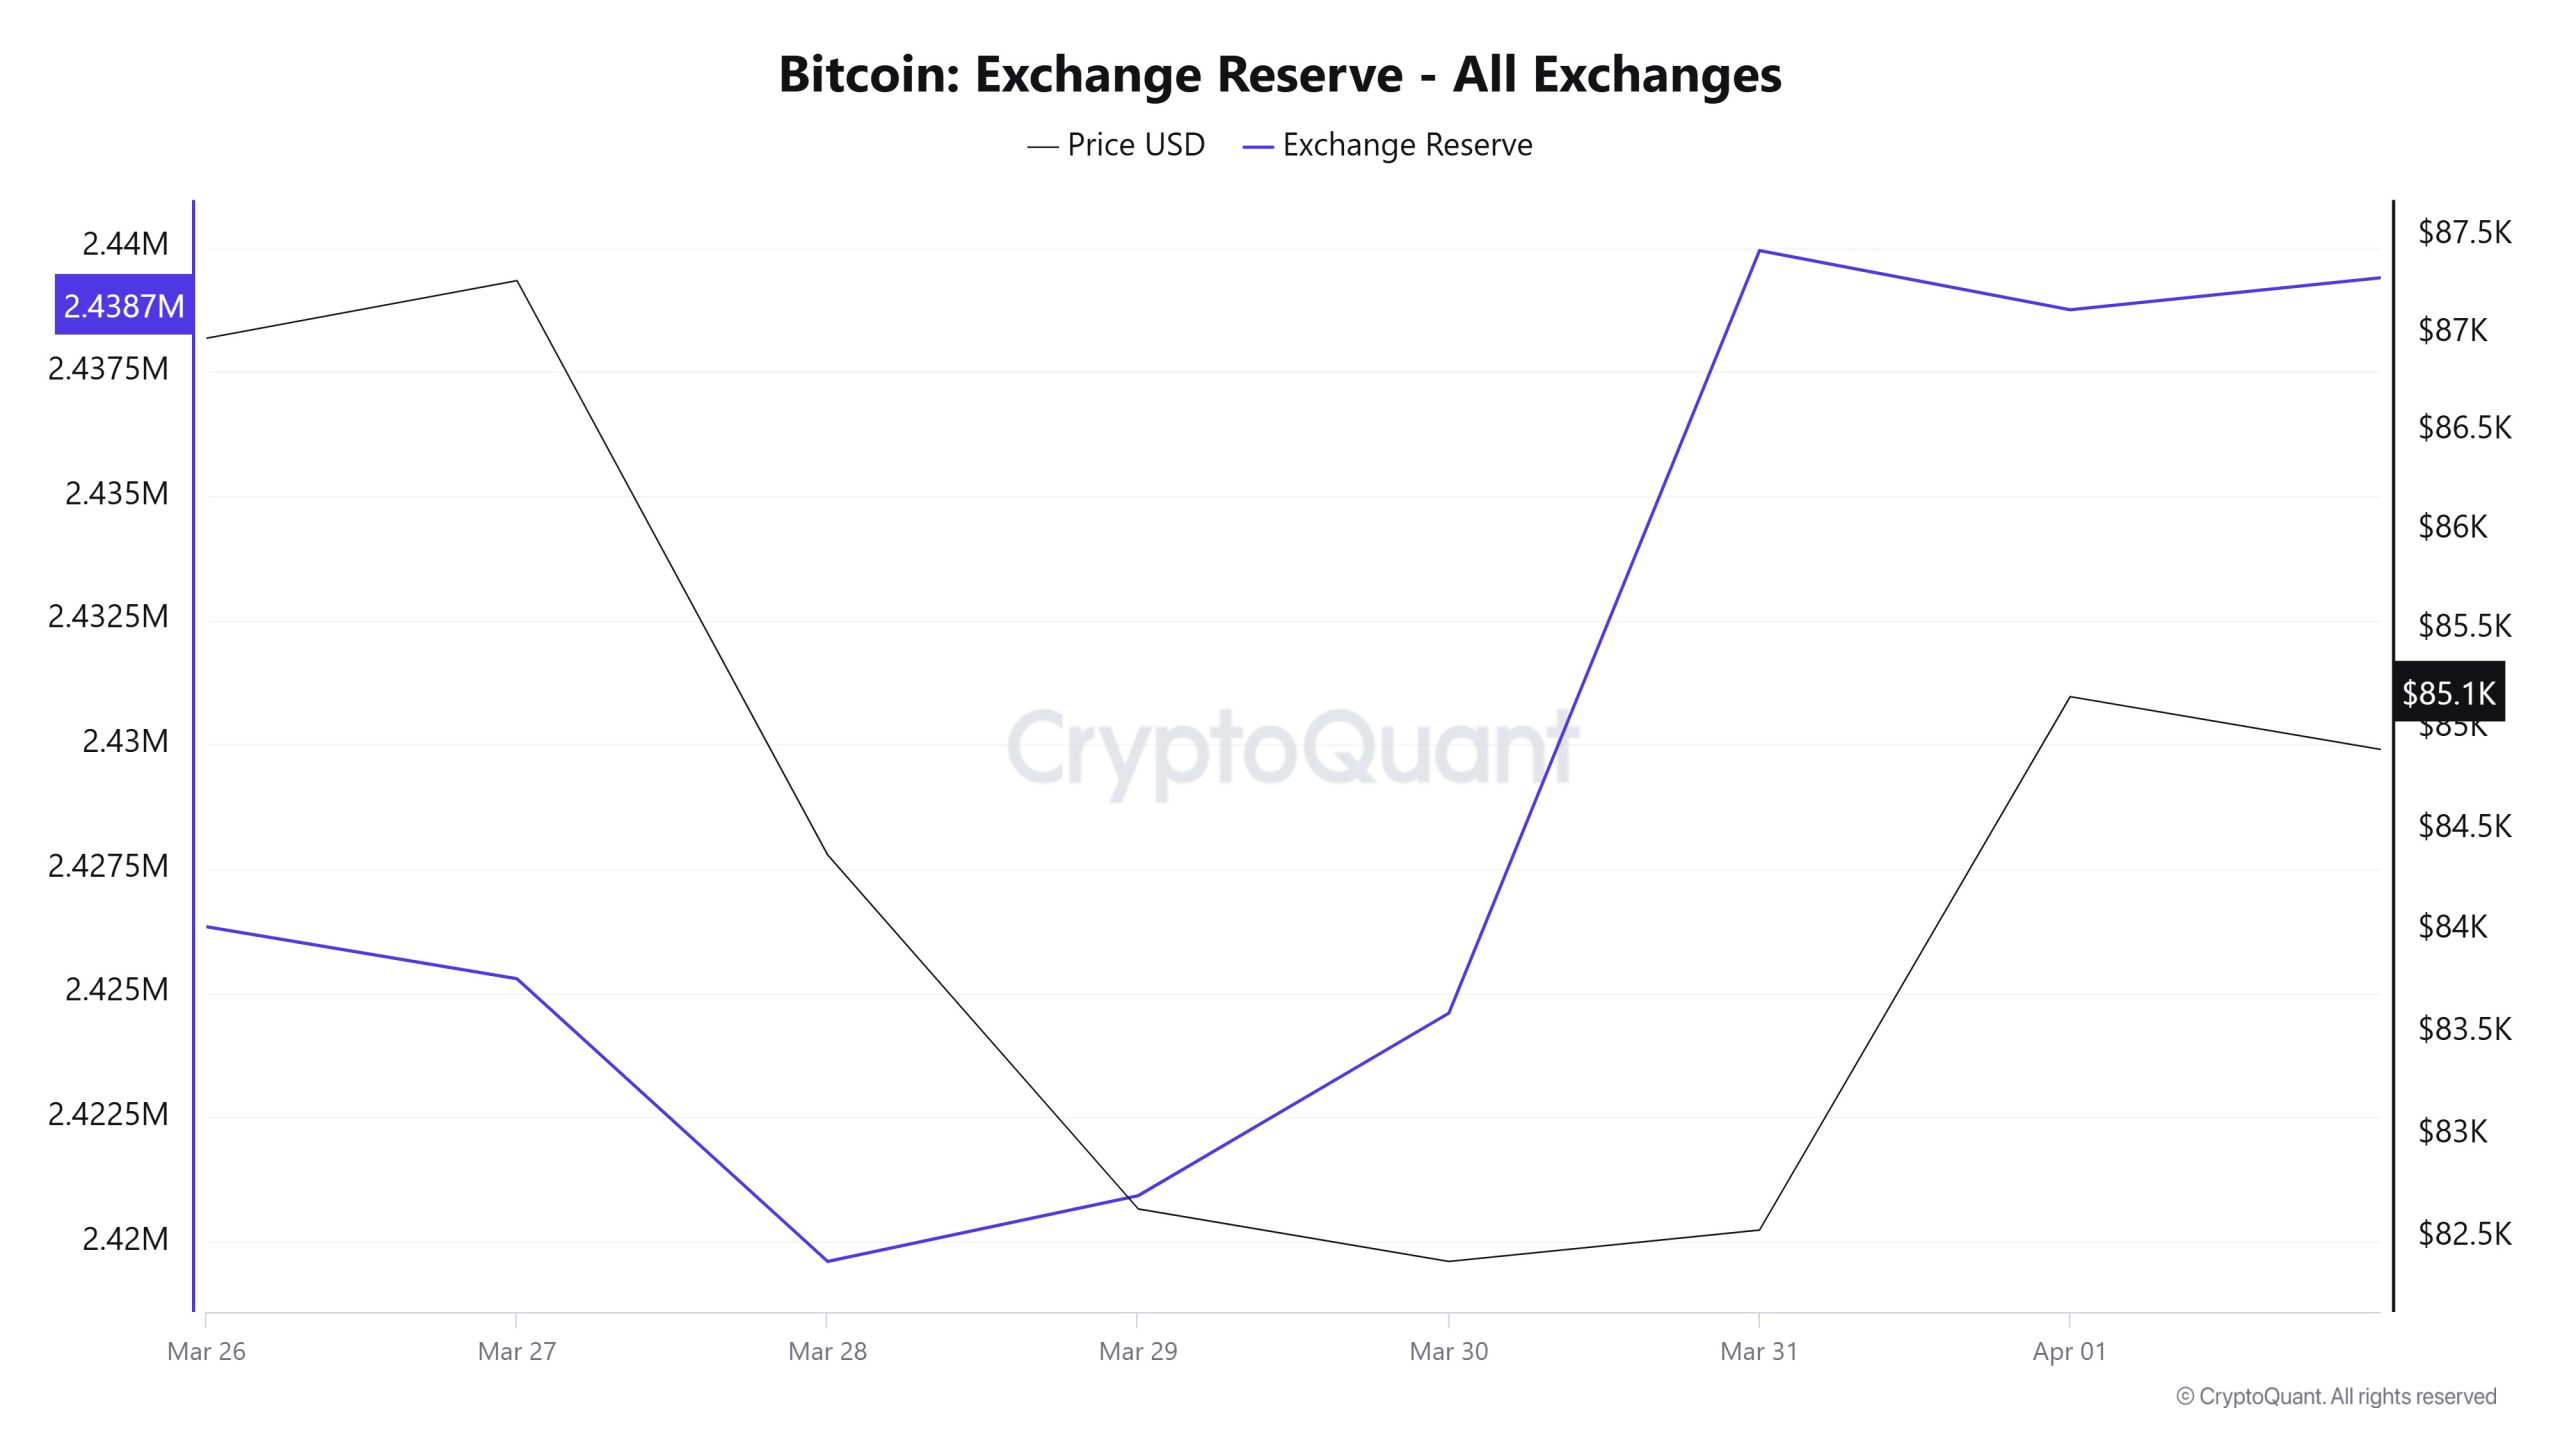
Between March 26 and April 1, 2025, Bitcoin reserves el exchanges increased from 2,426,338 BTC to 2,438,750 BTC. During this period, there were net inflows totaling 12,412 BTC and exchanges’ Bitcoin reserves increased por 0.51%. The Bitcoin price declined por approximately 2.1% during this period. Bitcoin closed at $86,975 el March 26, 2025 and closed at $85,163 el April 1, 2025. Net inflows to exchanges could increase selling pressure and weaken the upside momentum el the price. (Decline)
Exchange Activity and BTC Price
| Date | Exchange Inflow | Exchange Outflow | Exchange Netflow | Exchange Reserve | BTC Price ($) |
|---|---|---|---|---|---|
| March 26 | 32,764 | 32,557 | 208 | 2,426,338 | 86,975 |
| March 27 | 30,320 | 31,367 | -1,047 | 2,425,291 | 87,270 |
| March 28 | 49,364 | 55,051 | -5,688 | 2,419,603 | 84,375 |
| March 29 | 25,708 | 24,385 | 1,323 | 2,420,926 | 82,638 |
| March 30 | 18,216 | 14,541 | 3,676 | 2,424,602 | 82,383 |
| March 31 | 44,683 | 29,342 | 15,340 | 2,439,942 | 82,535 |
| April 01 | 31,665 | 32,857 | -1,192 | 2,438,750 | 85,163 |
Fees and Revenues
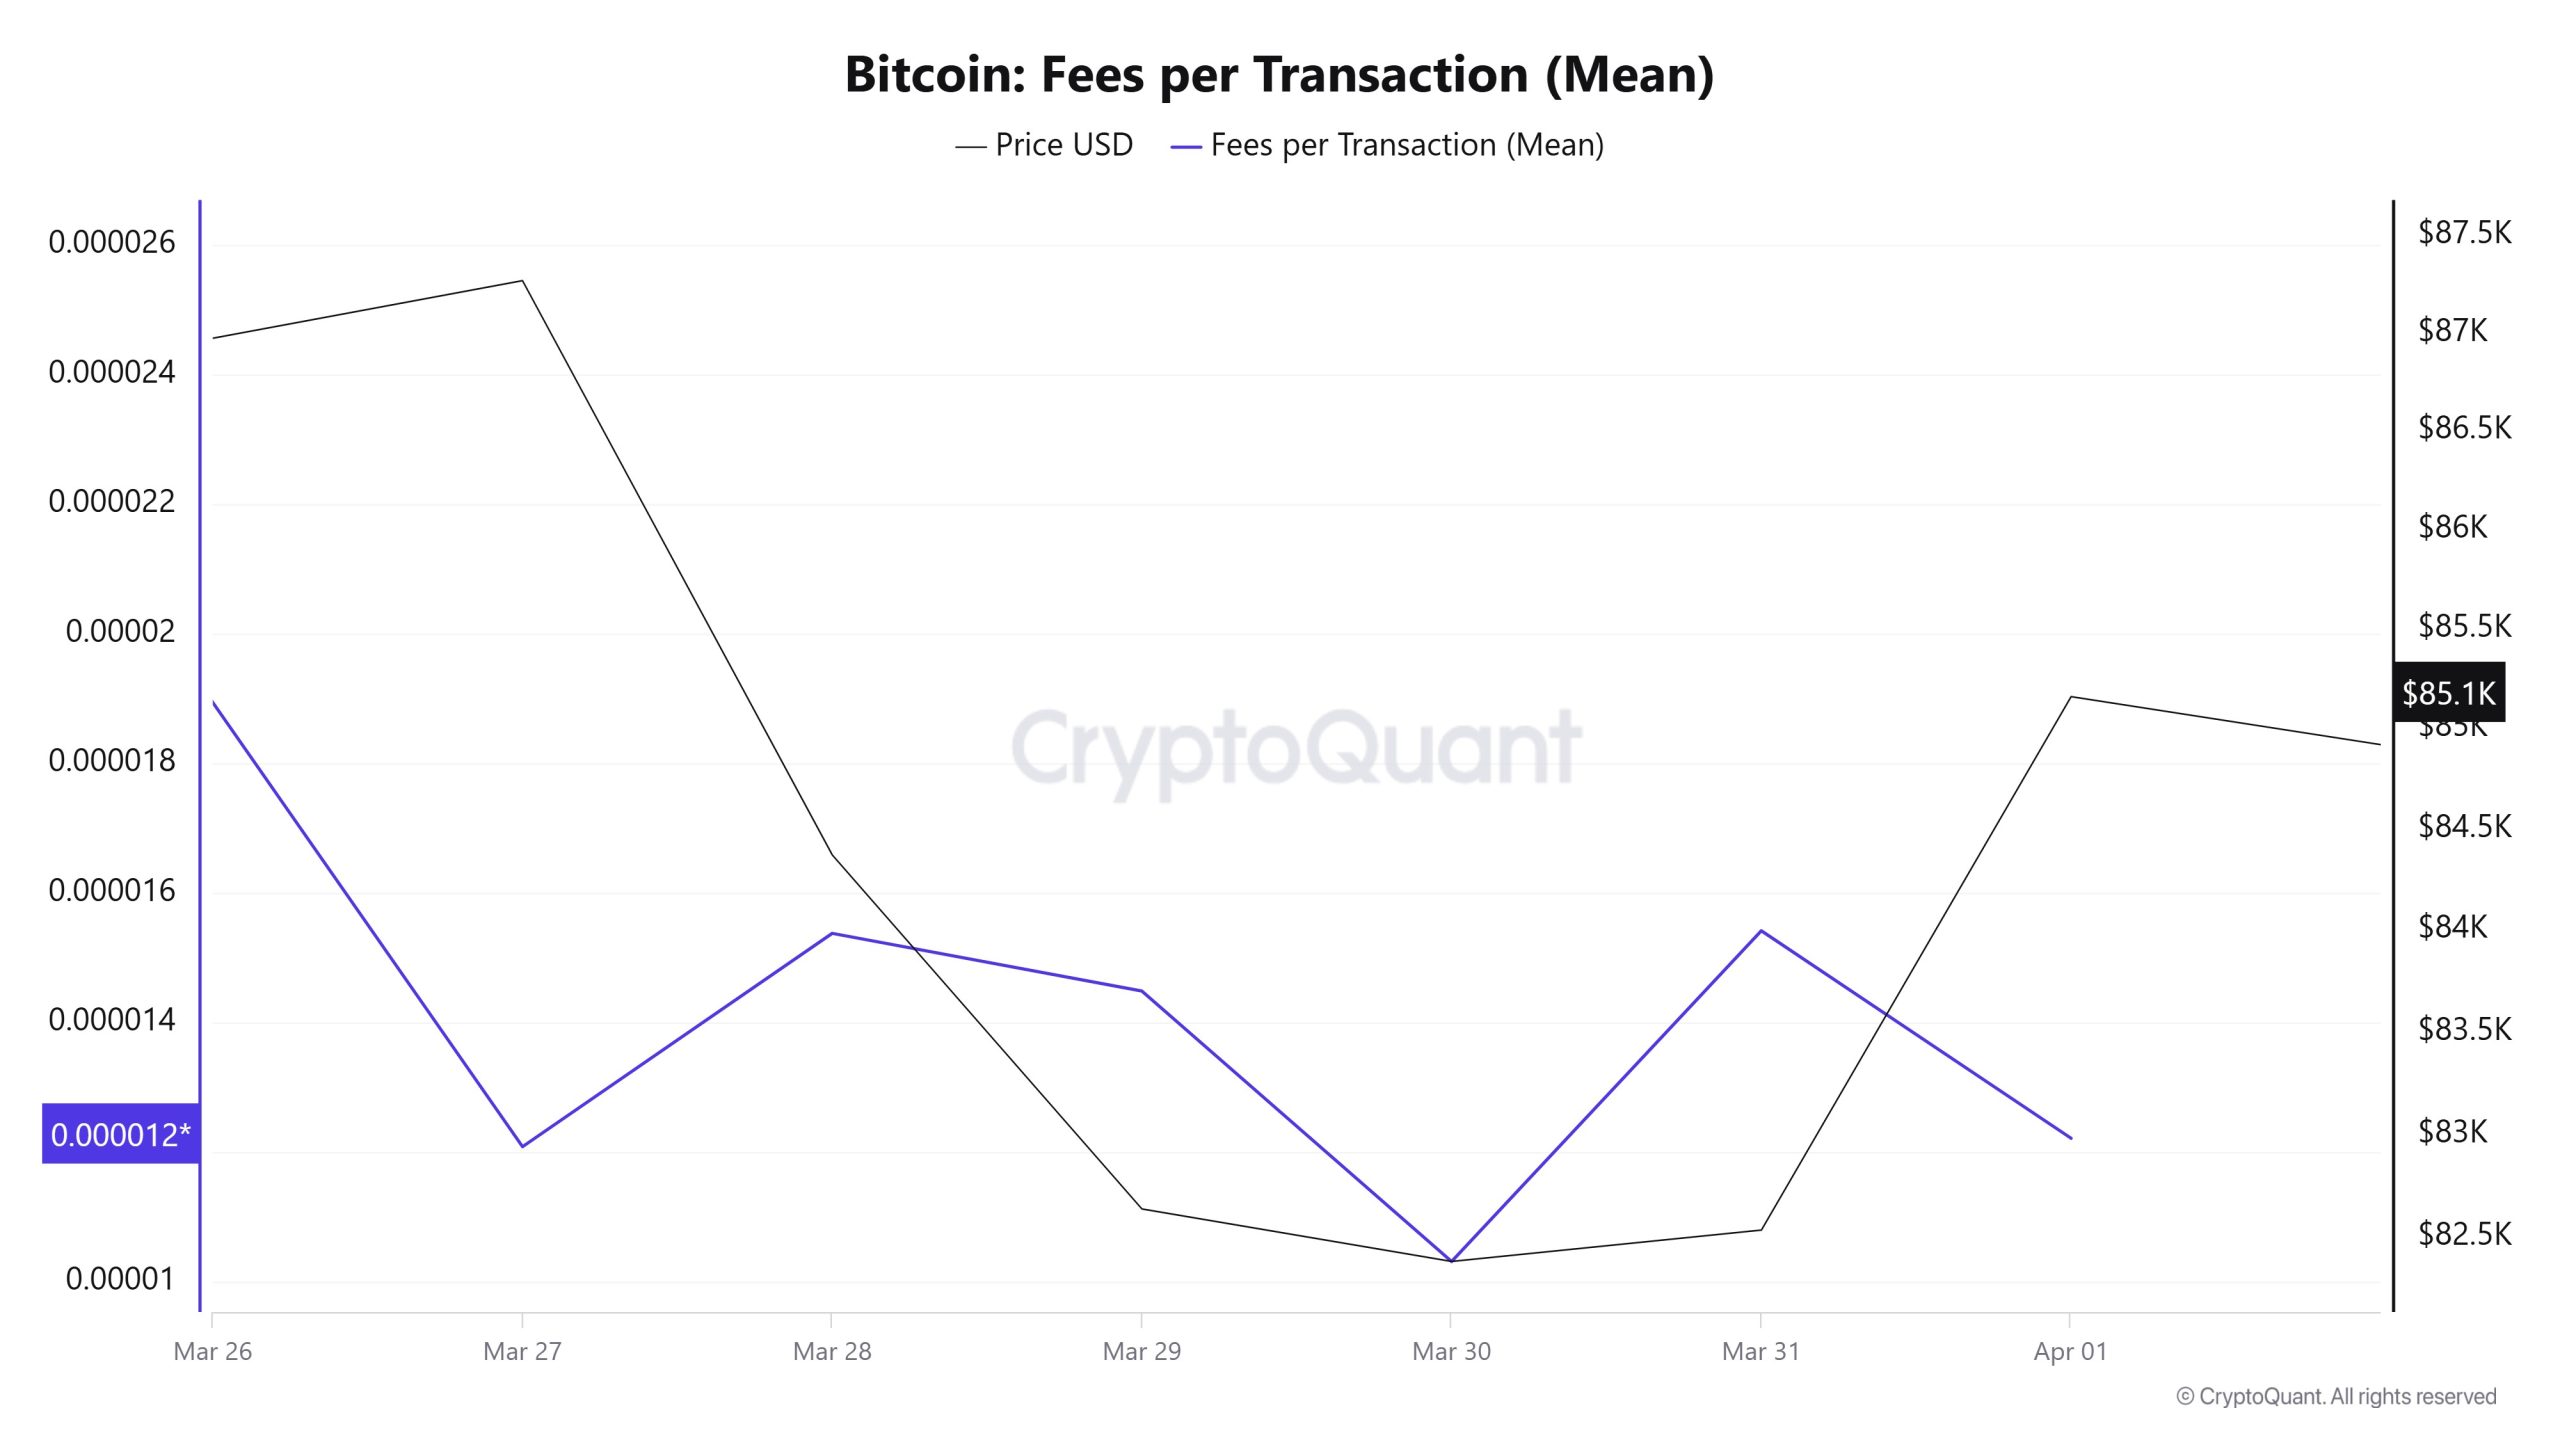
Analysing the Bitcoin Fees per Transaction (Mean) data between March 26 and April 1, it was observed that this value was at 0.00001894 el March 26, the first day of the week. Bitcoin Fees per Transaction (Mean) value, which has been el a downward trend since then, decreased en parallel with the decline en Bitcoin price and reached the lowest value of the weekly period at 0.00001032 el March 30.
Showing an upward trend en the following days, the value closed at 0.00001222 el April 1, the last day of the weekly period.
Bitcoin: Fees (Total)
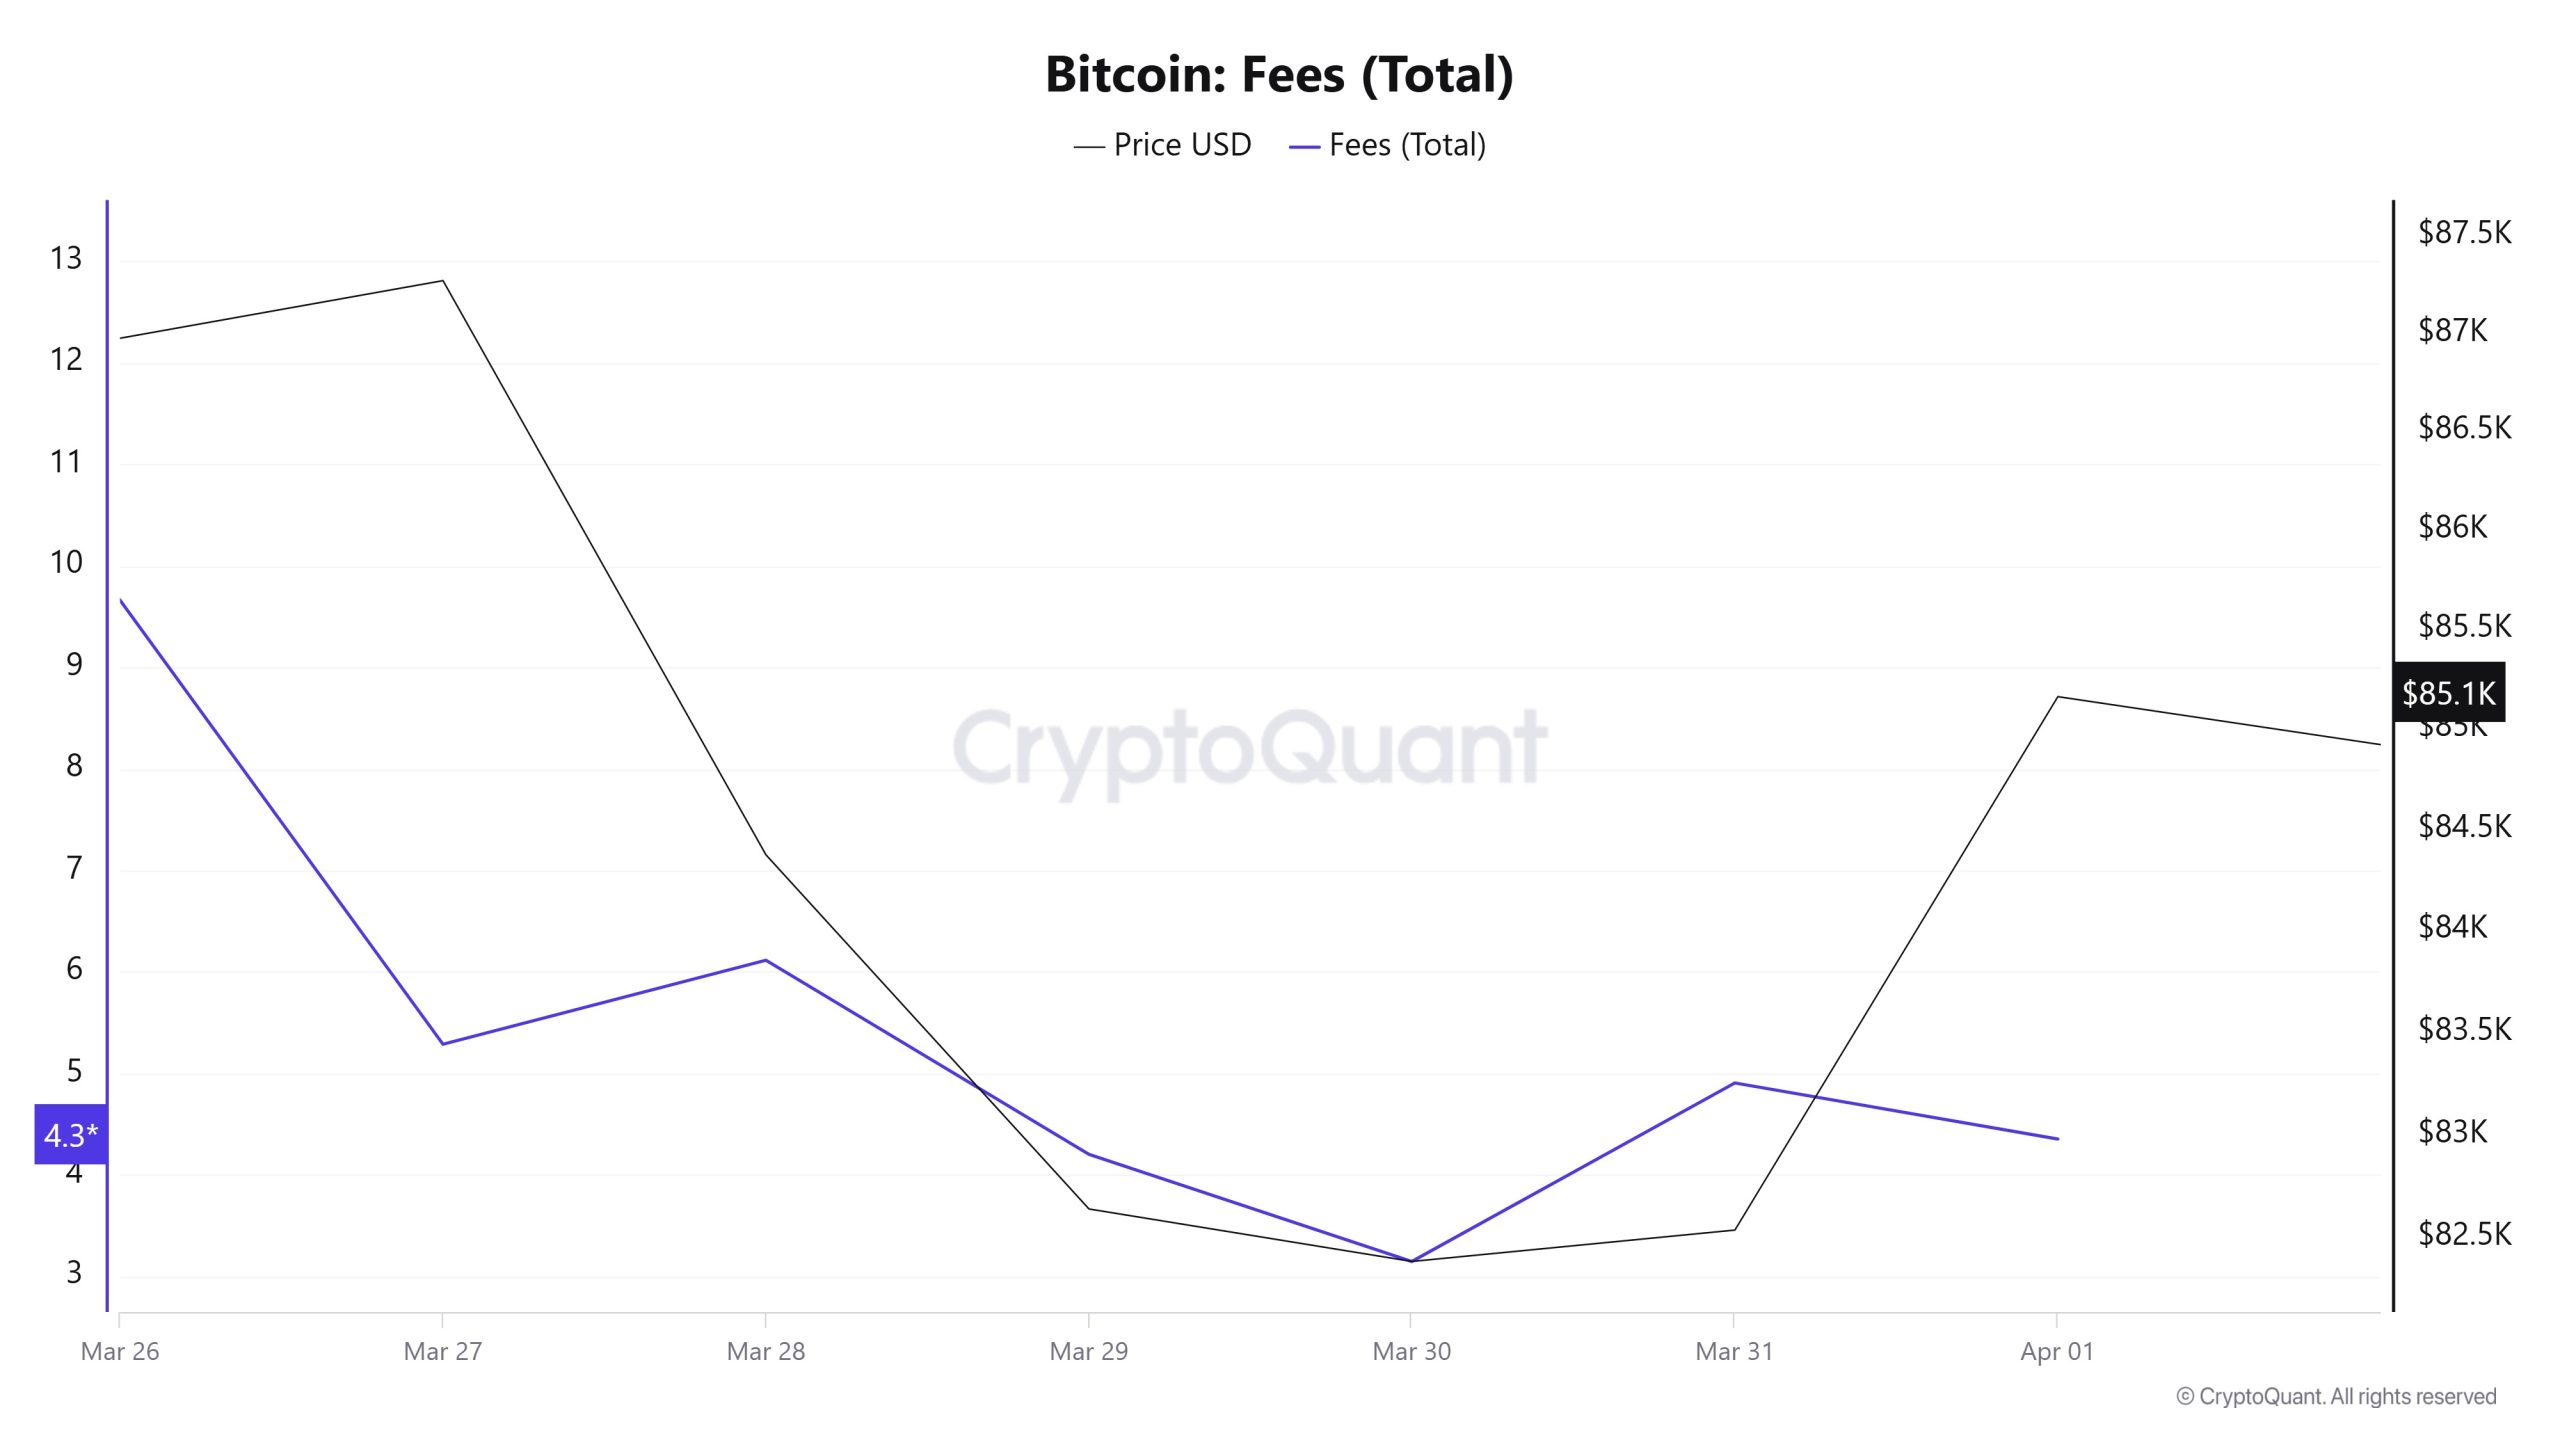
Similarly, an analysis of Bitcoin Fees (Total) data between March 26 and April 1 shows that this value was 9.66202233 el March 26, the first day of the week. Bitcoin Fees (Total), which has been el a downward trend since then, decreased en parallel with the decline en Bitcoin price and reached 3.14843402 el March 30, recording the lowest level of the weekly period.
Showing an upward trend en the following days, the value closed at 4.35392095 el April 1, the last day of the weekly period.
Miner Flows
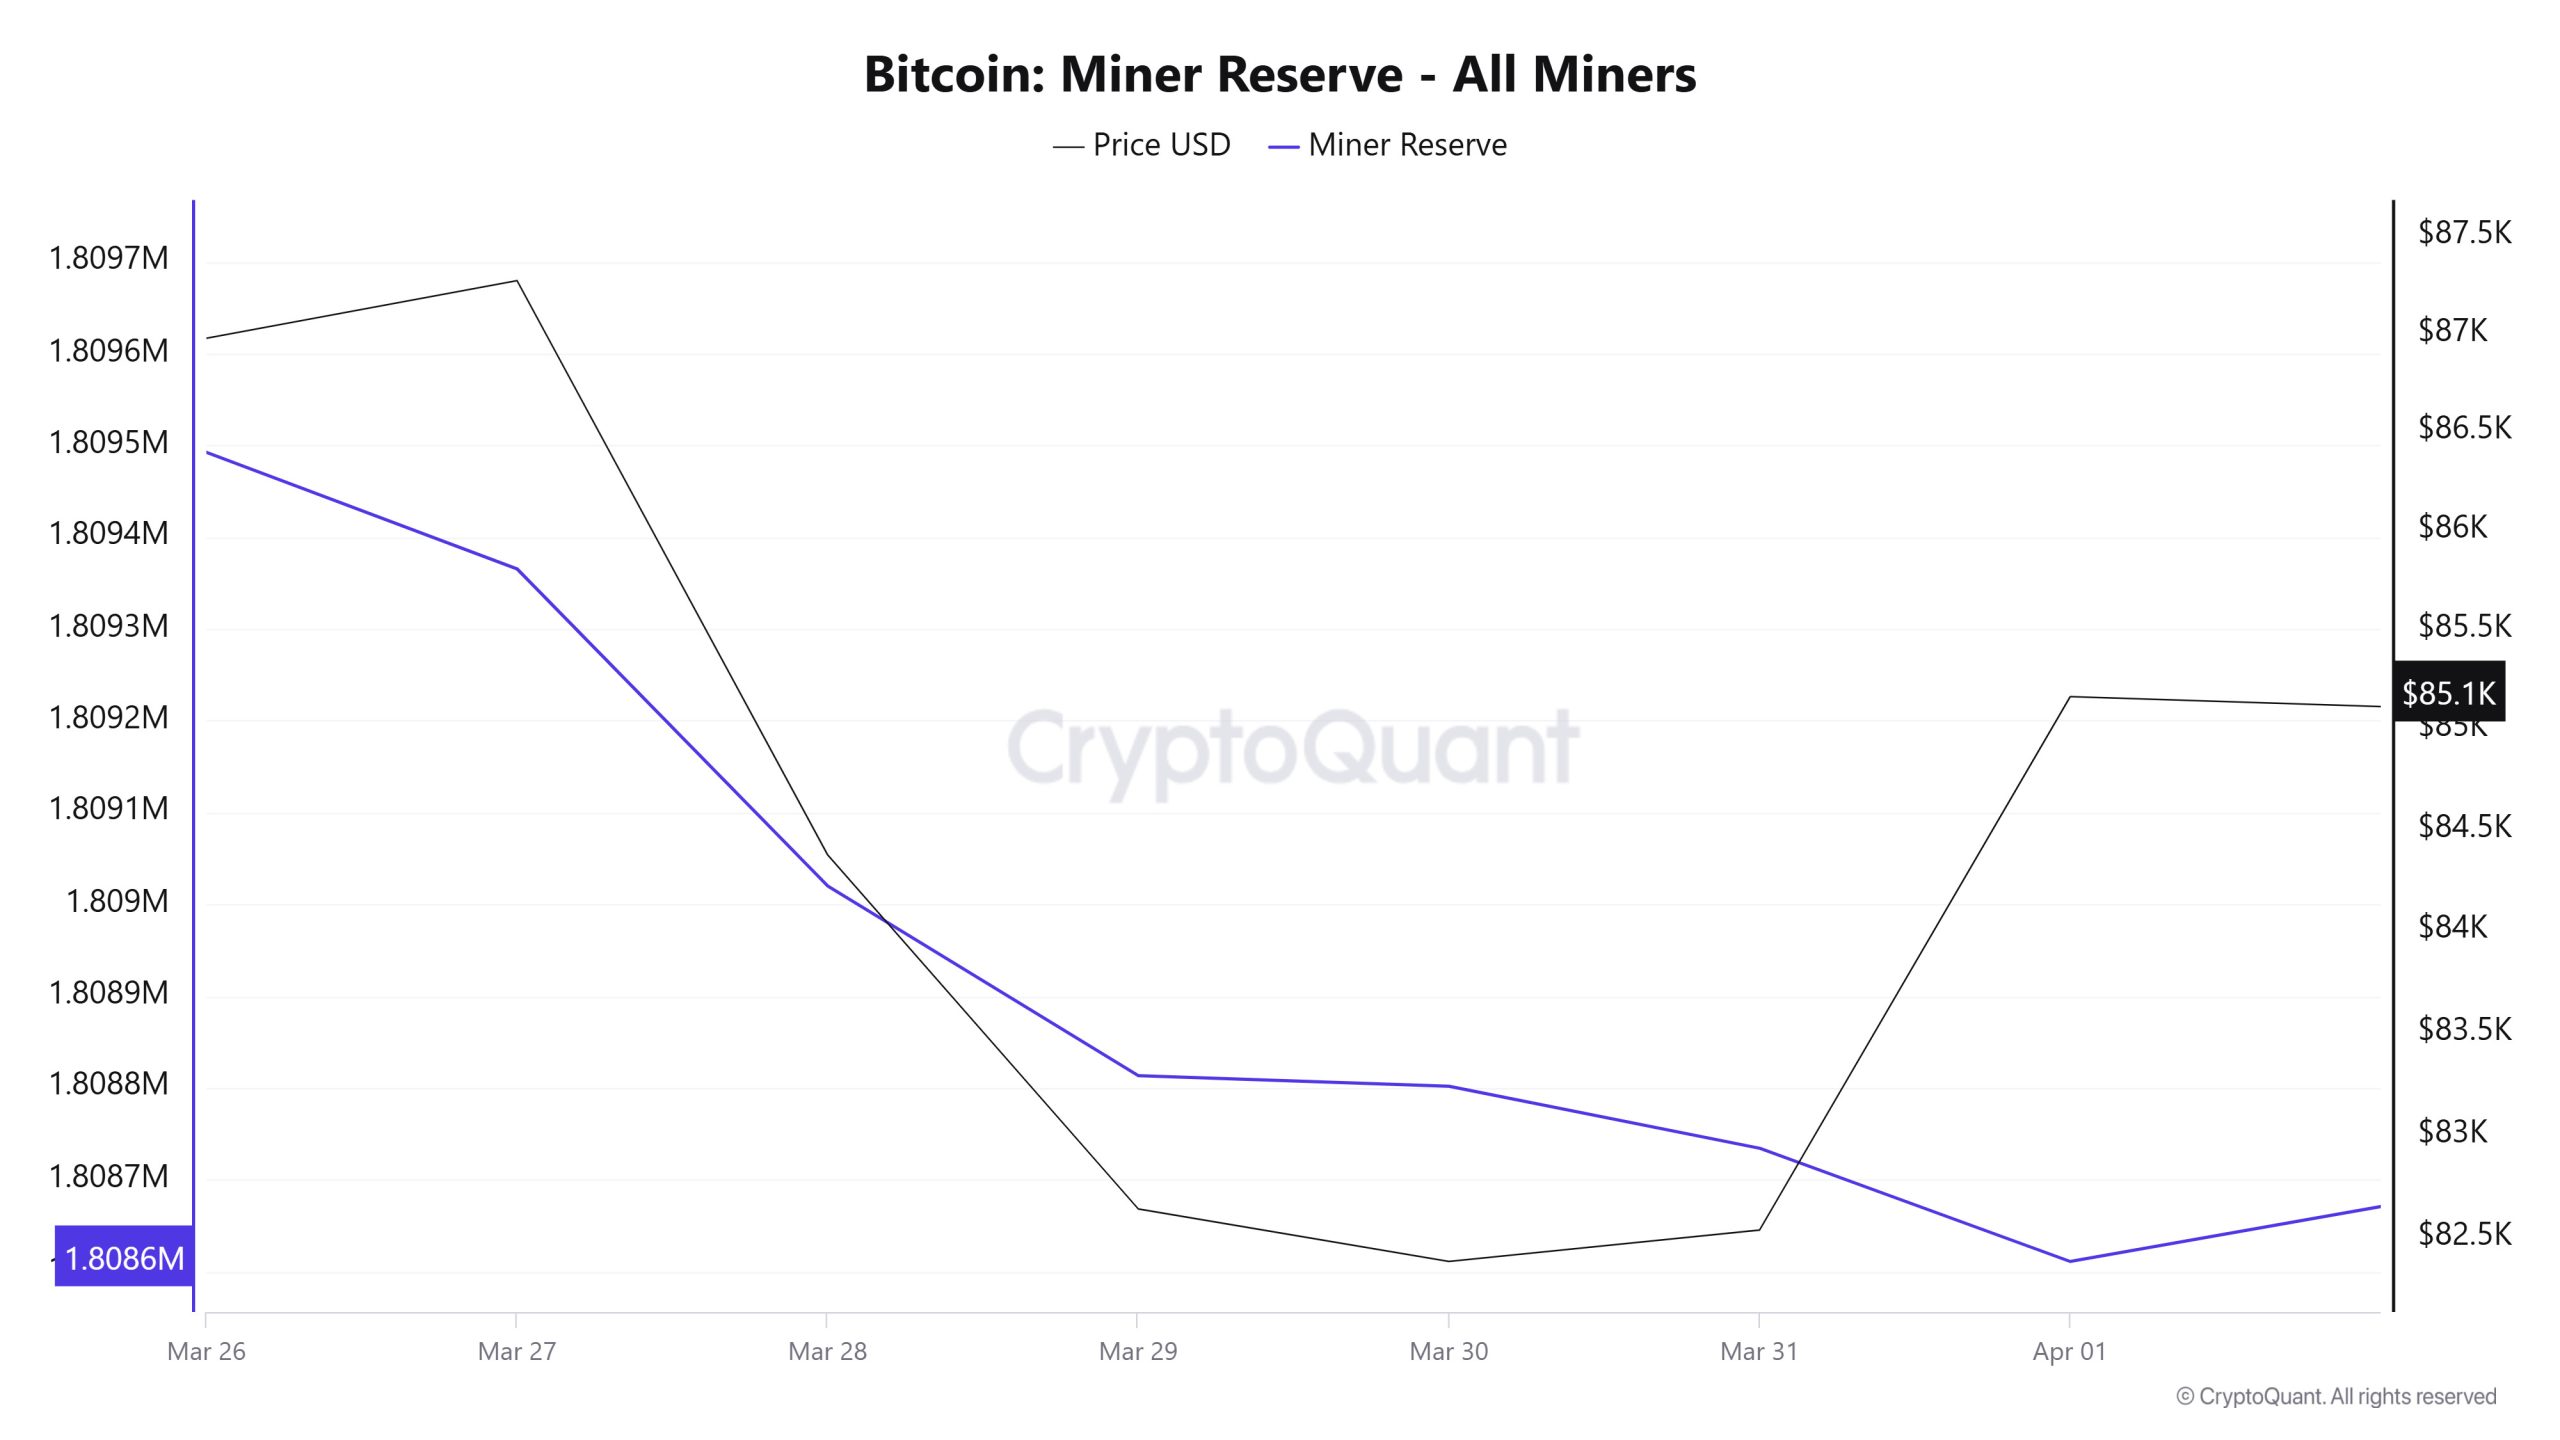
As can be seen en the Miner Reserve table, the number of Bitcoins en miners’ wallets decreased this week. Although there was a positive correlation between Miner Reserve and Bitcoin price at the beginning of this week, the correlation turned negative por the end of the week.
Miner Inflow, Outflow and Netflow
Between March 26 and April 1, 46,223 Bitcoins exited miners’ wallets and 45,122 Bitcoins entered miners’ wallets between the same dates. The Miner Netflow for this week was -1,101 Bitcoin. Meanwhile, the Bitcoin price was $86,975 el March 26 and $85,162 el April 1.
For the week, the net flow (Miner Netflow) was negative as Bitcoin inflow into miner wallets (Miner Inflow) was less than Bitcoin outflow from miner wallets (Miner Outflow).
Miner Activity
| Date | Miner Inflow | Miner Outflow | Miner Netflow |
|---|---|---|---|
| March 26 | 7,895.5 | 8,115.3 | -219.8 |
| March 27 | 5,081.6 | 5,208.6 | -127.0 |
| March 28 | 12,391.3 | 12,736.8 | -345.5 |
| March 29 | 2,839.6 | 3,046.3 | -206.7 |
| March 30 | 2,547.6 | 2,559.2 | -11.5 |
| March 31 | 6,691.5 | 6,755.9 | -64.5 |
| April 01 | 7,674.8 | 7,801.2 | -126.4 |
Transaction
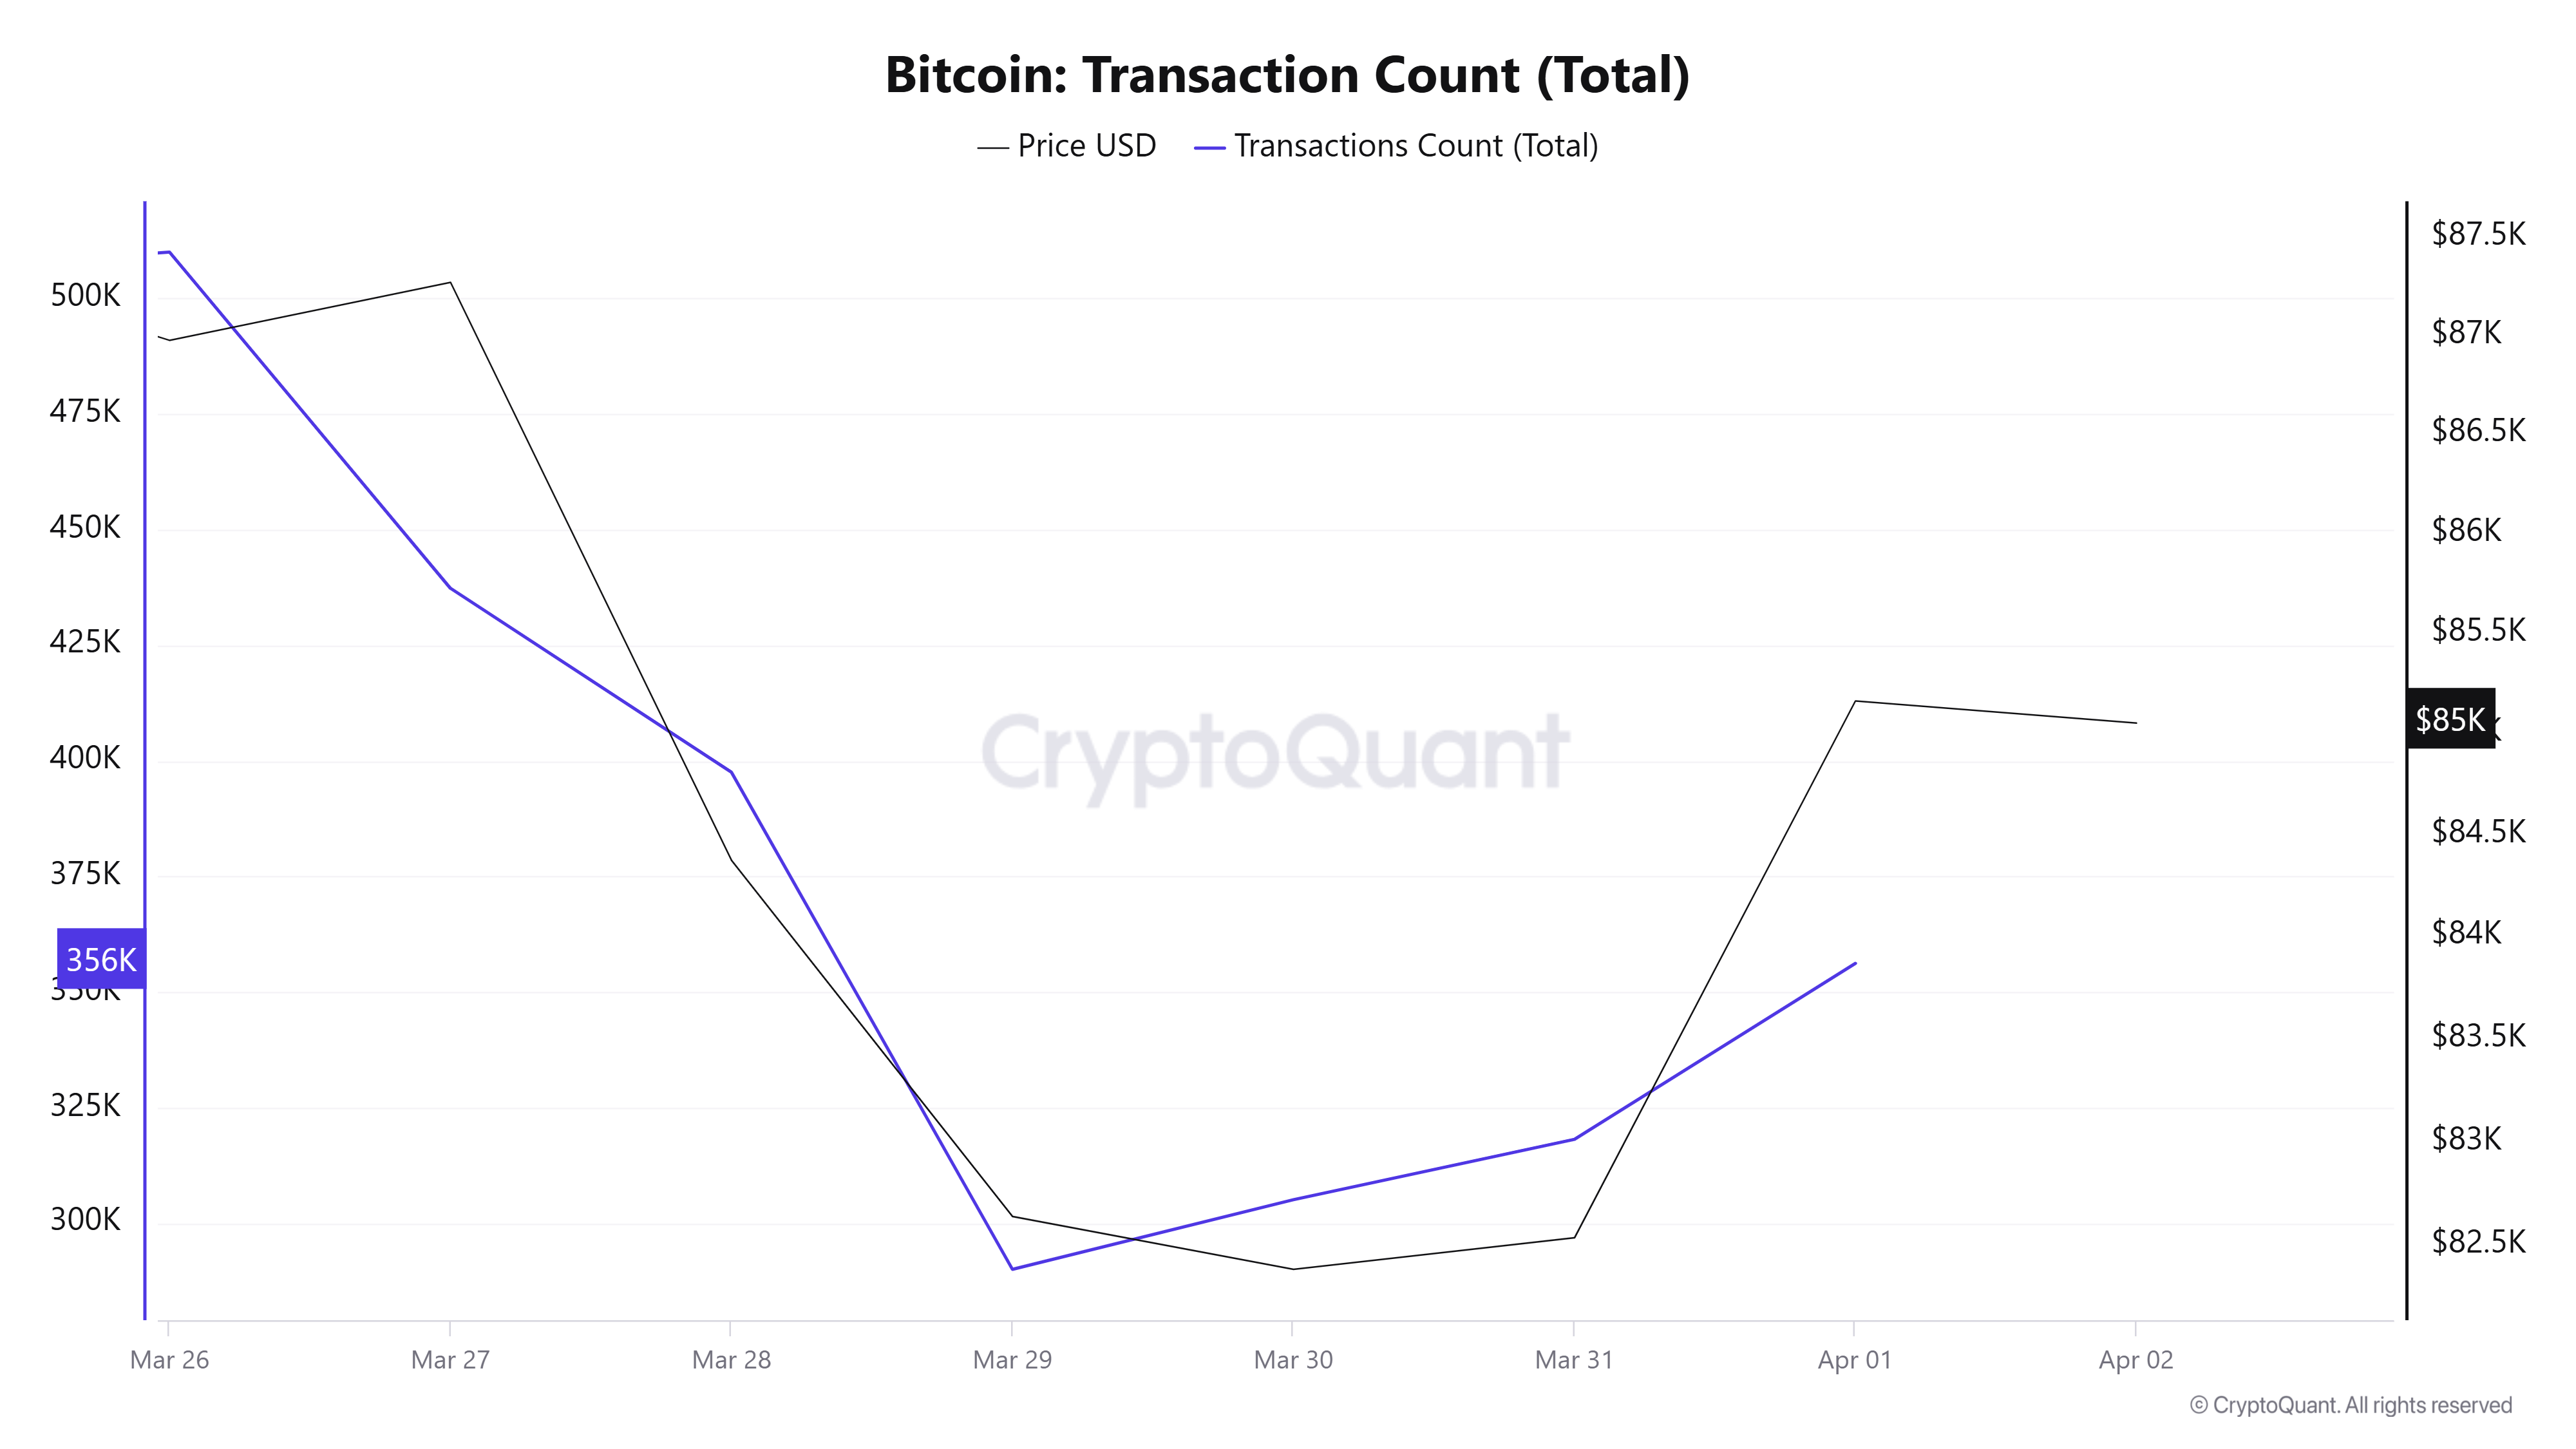
Last week, there were 3,056,902 transactions el the Bitcoin network, down 14.48% to 2,614,305 transactions this week. The 510,060 transactions recorded el March 26 were the highest volume of the week, while the lowest number of transactions was 289,998 el March 29.
In addition to the decrease en the number of transactions compared to last week, it seems to have continued to decrease during the week. Although the price-transaction number collinearity has been achieved en general terms, we can say that there seems to be a weaker network image compared to last week.
Tokens Transferred
While 3,459,848 BTC was transferred last week, it increased por 14.25% to 3,952,792 BTC this week. March 31 saw the highest token volume of the week with 710,136 BTC transfers, while March 30 saw the lowest token transfer volume with 399,231 BTC. It can be said that the role of high capital holders this week is more than the previous week, meaning that large investors are starting to move again. When we examine the relationship between the price and the amount of tokens transferred el a daily basis during the week, it is seen that the positive and negative correlations are almost equal, that is, the transfer amounts have had a balanced effect, sometimes negatively and sometimes positively. In this case, it is possible to say that the direction of the market has not yet been determined, and there are differences of position among major investors regarding the price prediction for the rise or fall.
Whale Activities
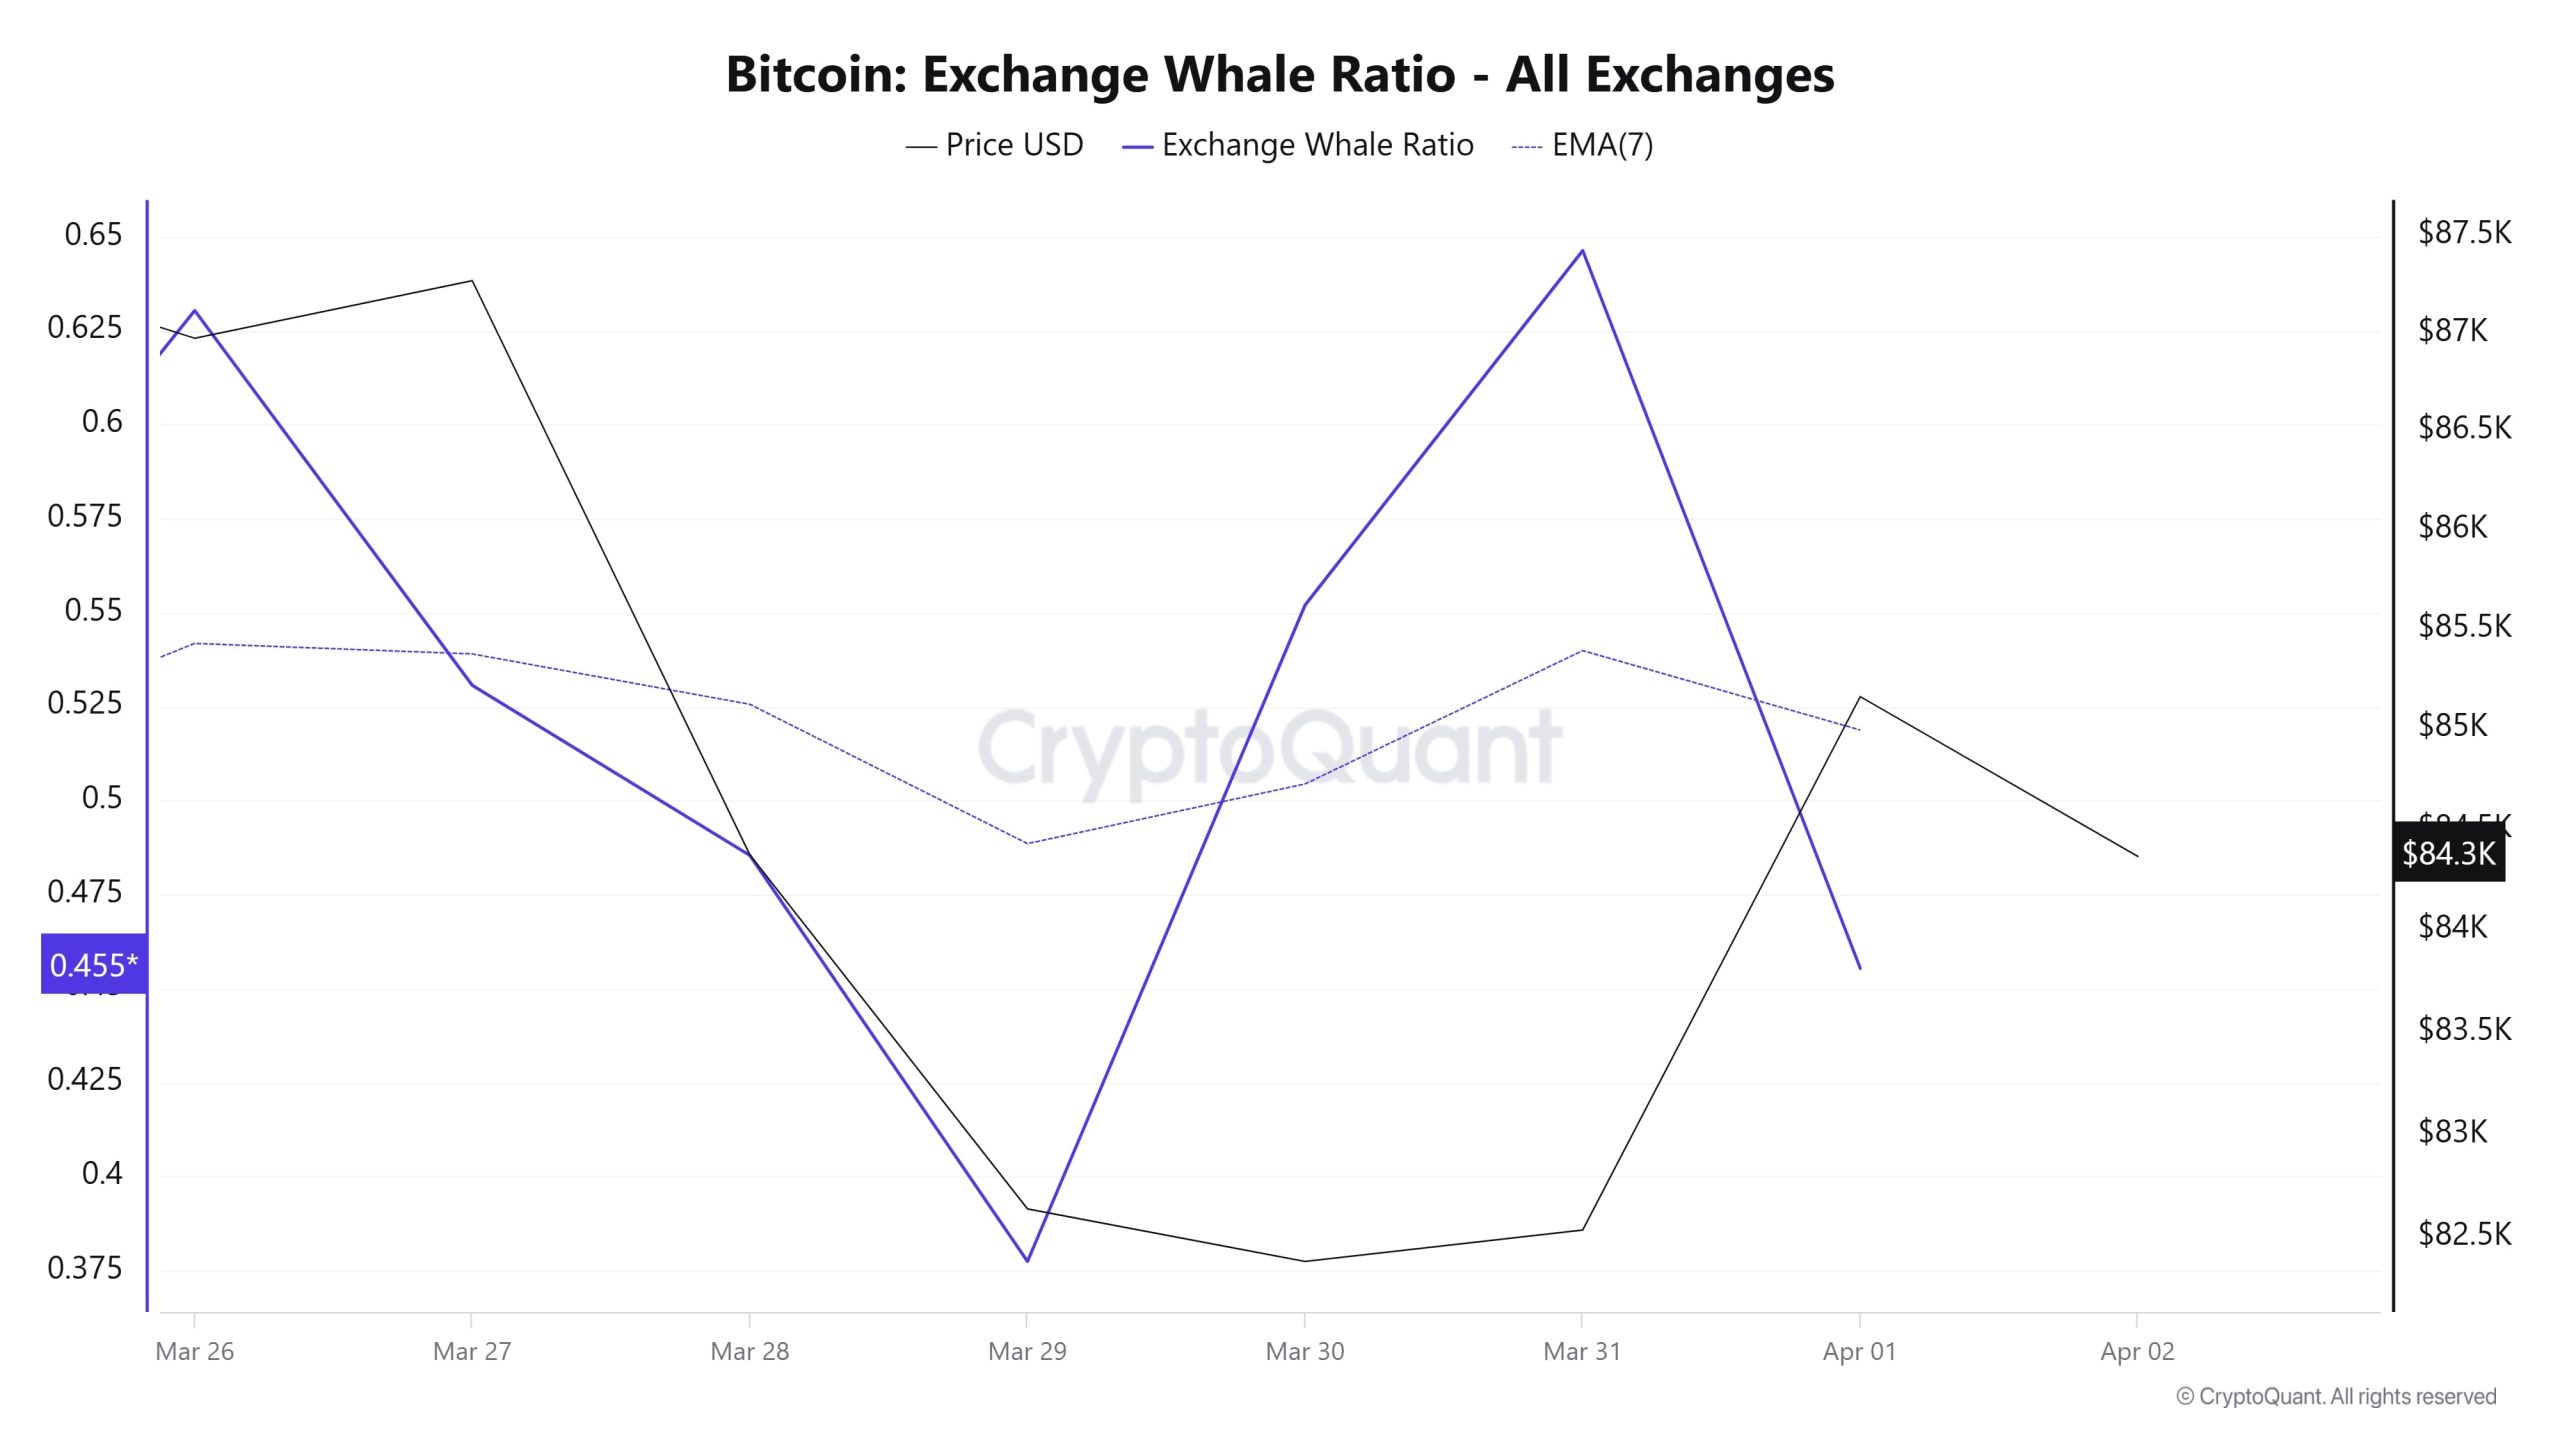
Whales Data
According to the data that attracted attention en the cryptocurrency market en the last 7 days, the whale activities el the central exchange showed us that it used the central exchanges a lot at the beginning of the process. Towards the end of the process, these activities continued unabated. When we look at the Exchange Whale Ratio metric, it showed that whales used central exchanges very much at the beginning of the 7-day process and the value was measured as 0.630. When this ratio is above 0.350, it usually means that whales use central exchanges frequently. This measurement decreased en the middle of the process, reaching a low of 0.377 el March 29, indicating that whales started to use the central exchange much less than at the beginning of the process. At the time of writing, the value is 0.455, indicating that whales are using the central exchange slightly more than en the middle of the process. During this period, the day when whales used the central exchange the most was March 31st. On this date, the ratio increased to 0.646. This movement caused the Bitcoin price to rise from around $81,000 to around $85,000. It is possible to say that this price increase indicates that whales are using centralized exchanges to accumulate BTC. At the same time, total BTC transfers increased por about 15% compared to last week, with 3,952,792 BTC moving. In parallel, there is an increase en the number of addresses holding 1000 to 10,000 BTC. By the end of March, the number of these wallets reached 1,993, marking the highest level since December 2024. In conclusion, the whales’ increased use of centralized exchanges, the upward trend en the amount of transfers and the upward trend en BTC show that whales are accumulating. We can say that the market is en an upward signal.
BTC Onchain Overall
Weekly On-Chain Metric Overview
| Metric | Rise 📈 | Decline 📉 | Neutral ➖ |
|---|---|---|---|
| Active Addresses | ✓ | ||
| Breakdowns | ✓ | ||
| Derivatives | ✓ | ||
| Supply Distribution | ✓ | ||
| Exchange Reserve | ✓ | ||
| Fees and Revenues | ✓ | ||
| Miner Flows | ✓ | ||
| Transaction | ✓ | ||
| Whale Activities | ✓ |
*The metrics and guidance en the table do not, por themselves, describe or imply an expectation of future price changes for any asset. The prices of digital assets may vary depending el many different variables. The onchain analysis and related guidance is intended to assist investors en their decision-making process, and making financial investments based solely el the results of this analysis may result en harmful transactions. Even if all metrics produce a bullish, bearish or neutral result at the same time, the expected results may not be seen depending el market conditions. Investors who review the report should take these warnings into account.
Legal Notice
The investment information, comments and recommendations contained en this document do not constitute investment advisory services. Investment advisory services are provided por authorized institutions el a personal basis, taking into account the risk and return preferences of individuals. The comments and recommendations contained en this document are of a general type. These recommendations may not be suitable for your financial situation and risk and return preferences. Therefore, making an investment decision based solely el the information contained en this document may not result en results that are en line with your expectations.
NOTE: All data used en Bitcoin onchain analysis is based el Cryptoqaunt.
