
Active Addresses
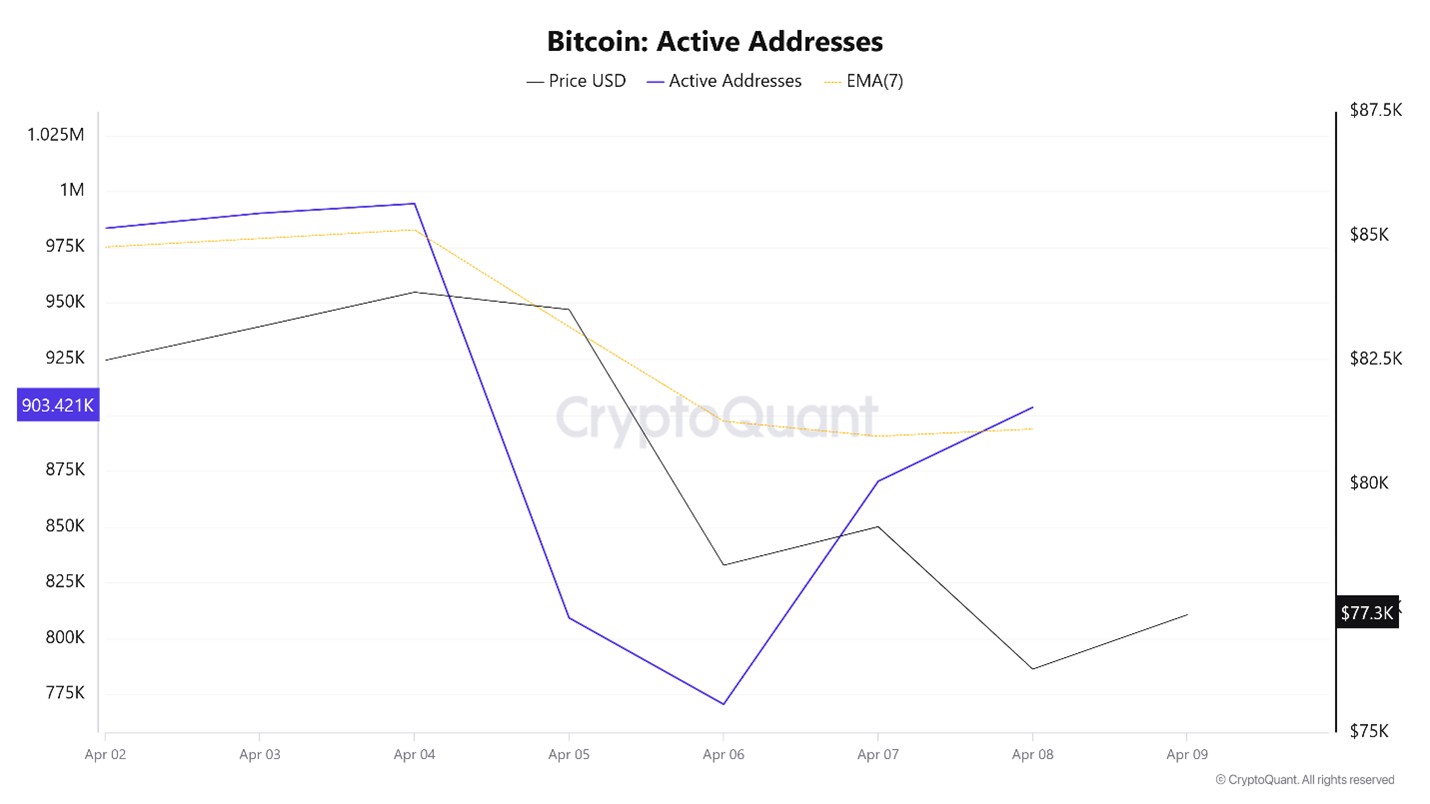
In terms of active addresses, there were 994,546 active entries to the BTC network between April 2 and April 9, 2025 this week. During this period, Bitcoin fell from $83,000 to $73,000. In the region marked el the chart, where the price and the number of active addresses intersect, we see that Bitcoin purchases have changed direction. When we follow the 7-day simple moving average, it is observed that the price followed an upward trend el the dates when this average also crossed the price. This situation indicates that the Bitcoin price is experiencing entries from the $ 83,000 levels.
Active Sending Addresses
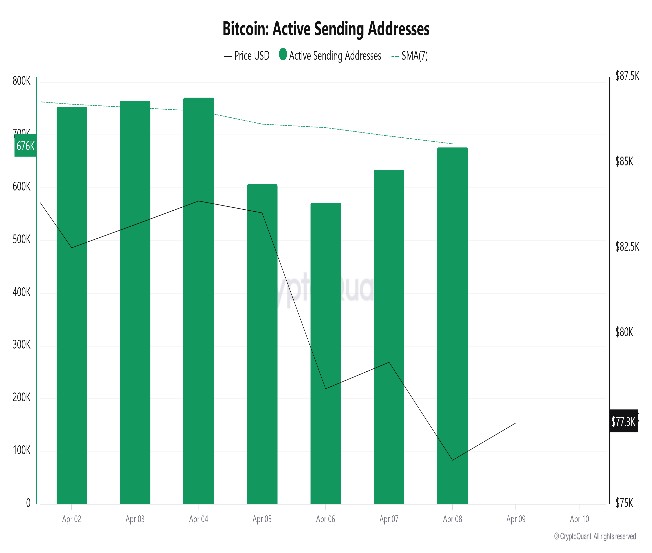
With the Black Line (price line) en active shipping addresses, there has been a significant drop en active shipping addresses after April 4. On the day when the price hit its lowest point, active sending addresses rose as high as 771,416 , indicating that buyers sold their positions as Bitcoin stayed around the $83,000 level for a while. As a result, price drops seem to cause an acceleration en sending addresses.
Active Receiving Addresses
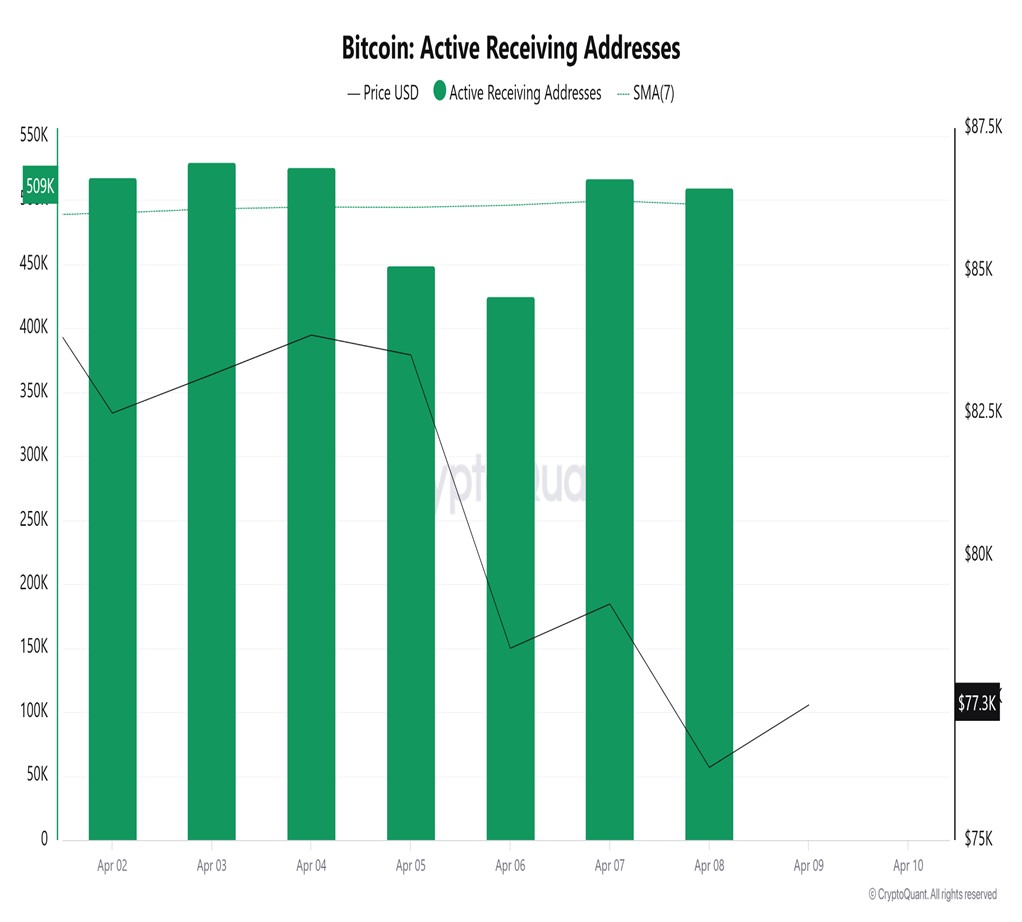
With the Black Line (price line) en active shipping addresses, there has been a significant drop en active shipping addresses after April 8. On the day when the price hit its lowest point, active shipping addresses rose as high as 509,531 , indicating that buyers took their positions at Bitcoin’s $76,000 levels.
Breakdowns
MRVR
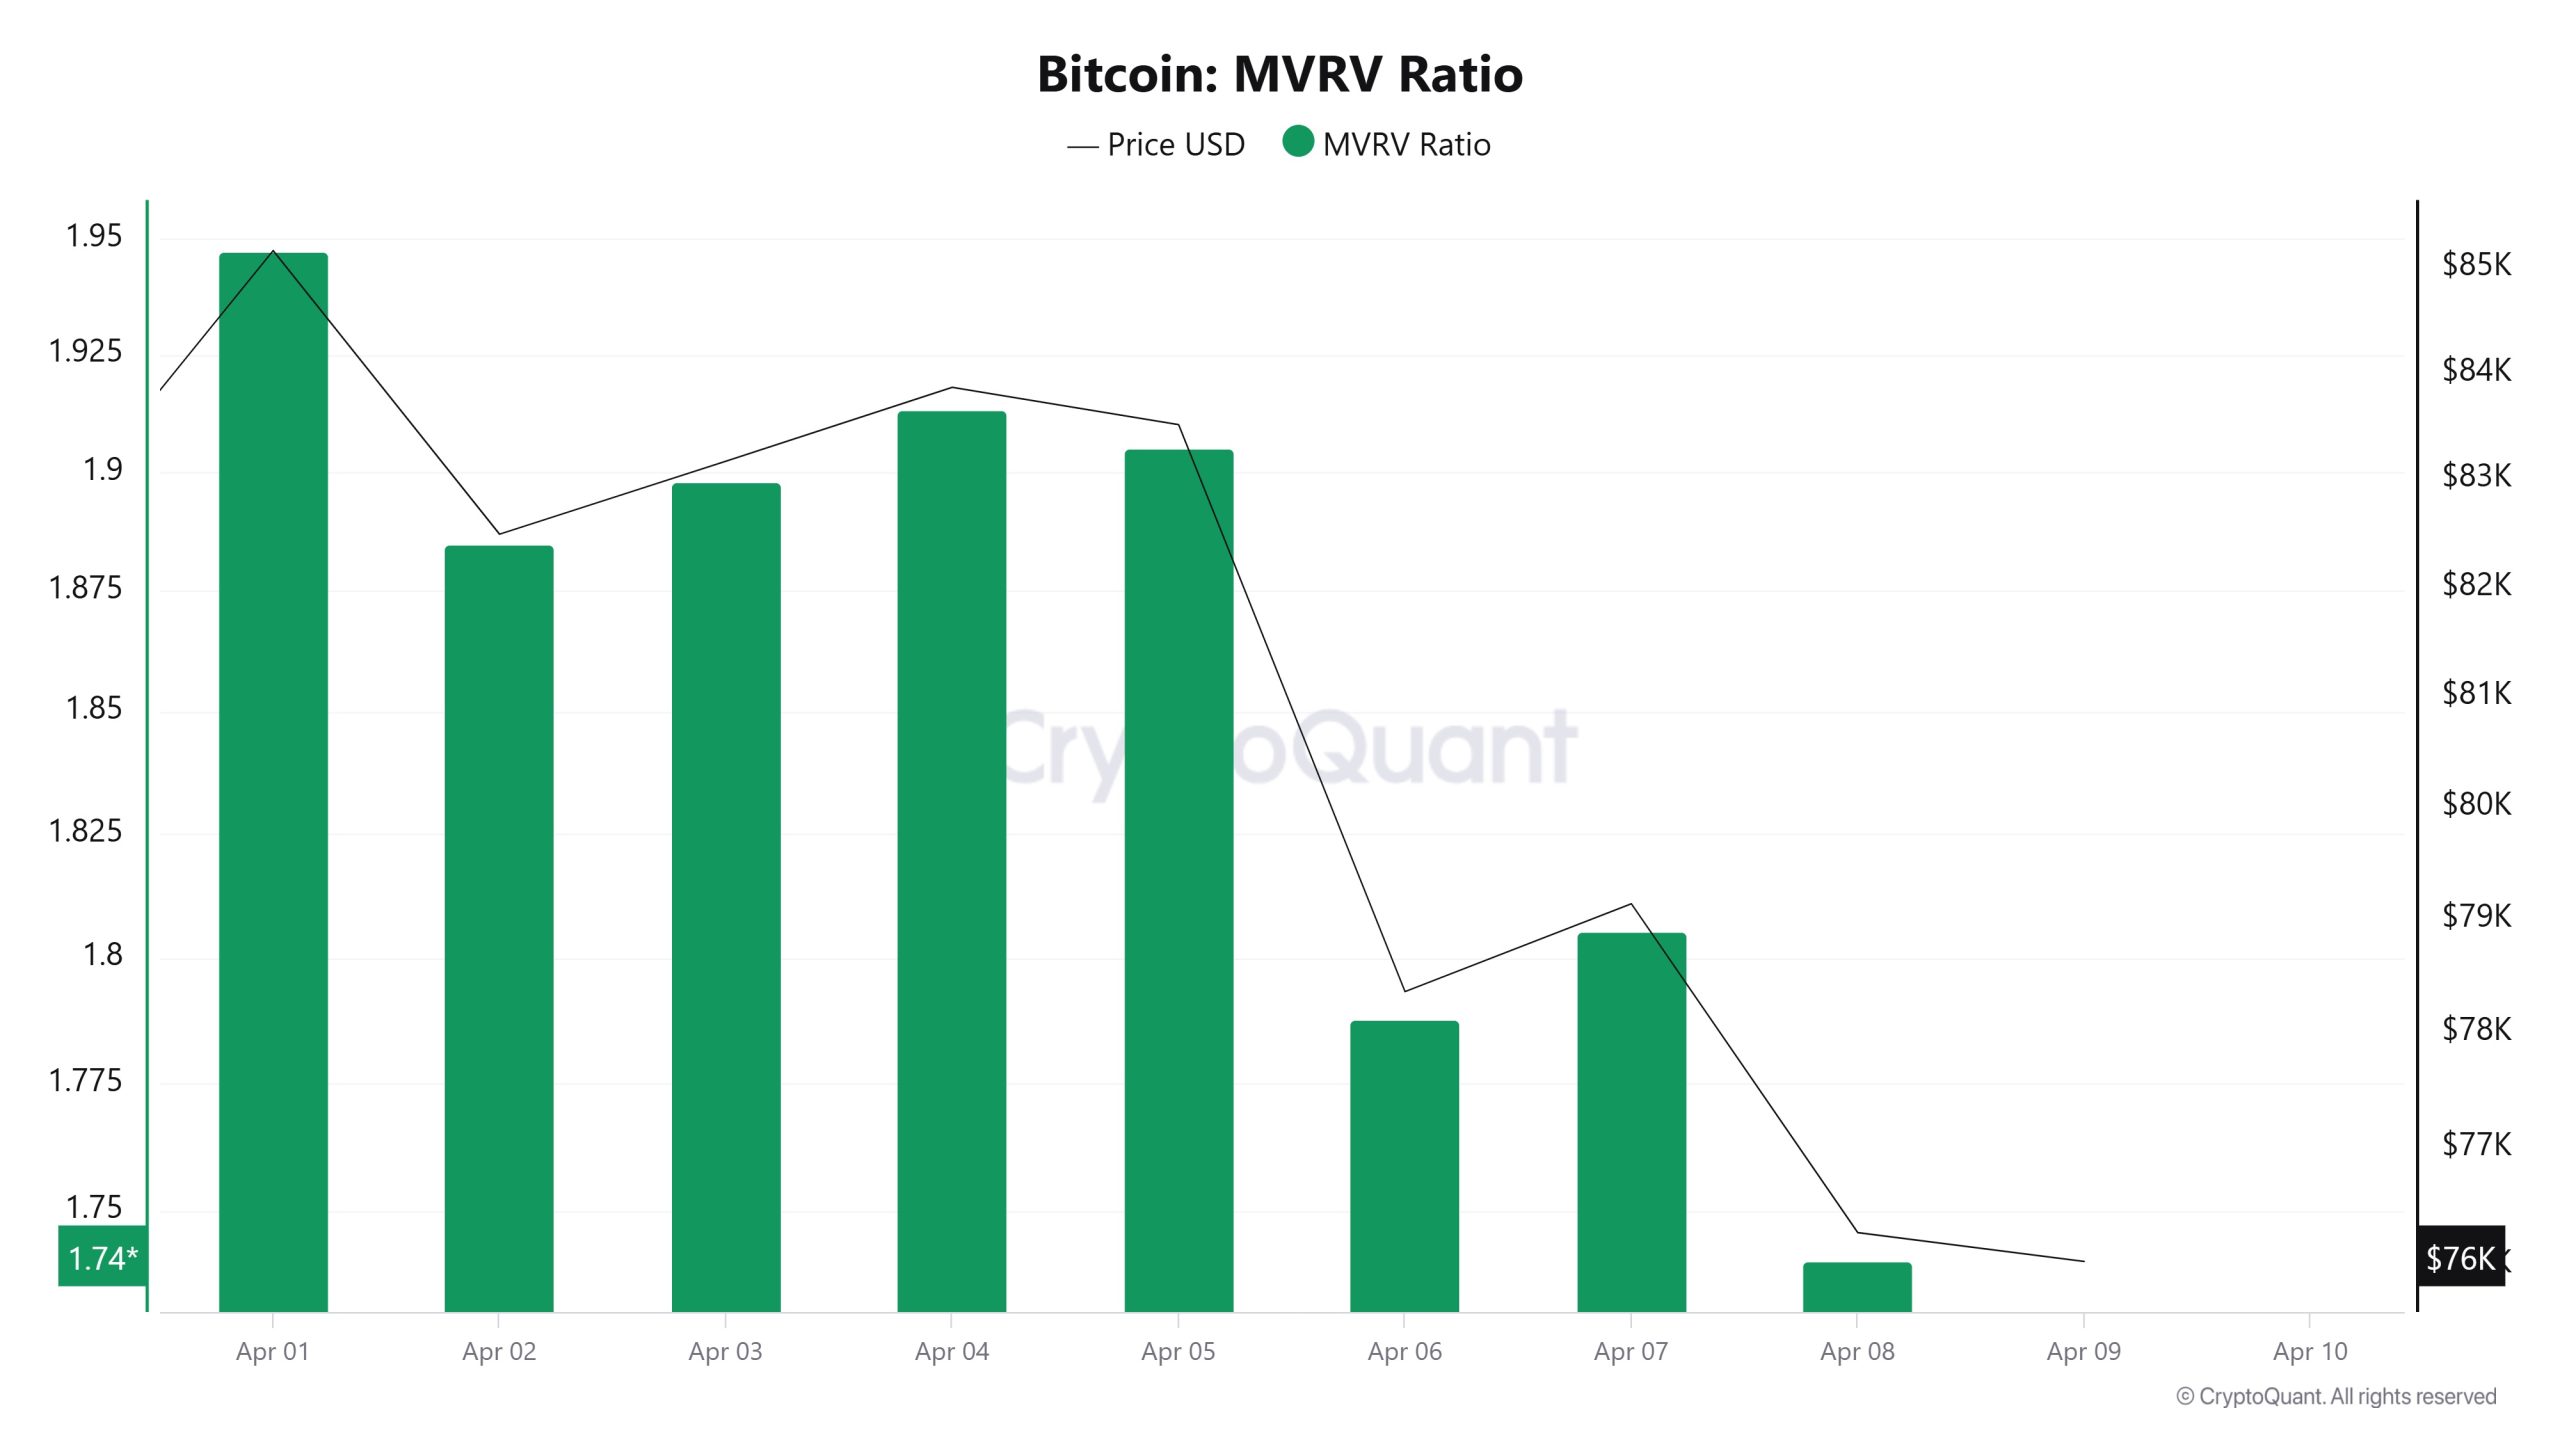
On April 2, Bitcoin price was 82,495 while MVRV Ratio was 1.88. As of April 8, the Bitcoin price was down to 76,276, while the MVRV Ratio was 1.74. Compared to last week, there was a 7.54% decrease en Bitcoin price and a 7.45% decrease en MVRV Ratio.
Realized Price
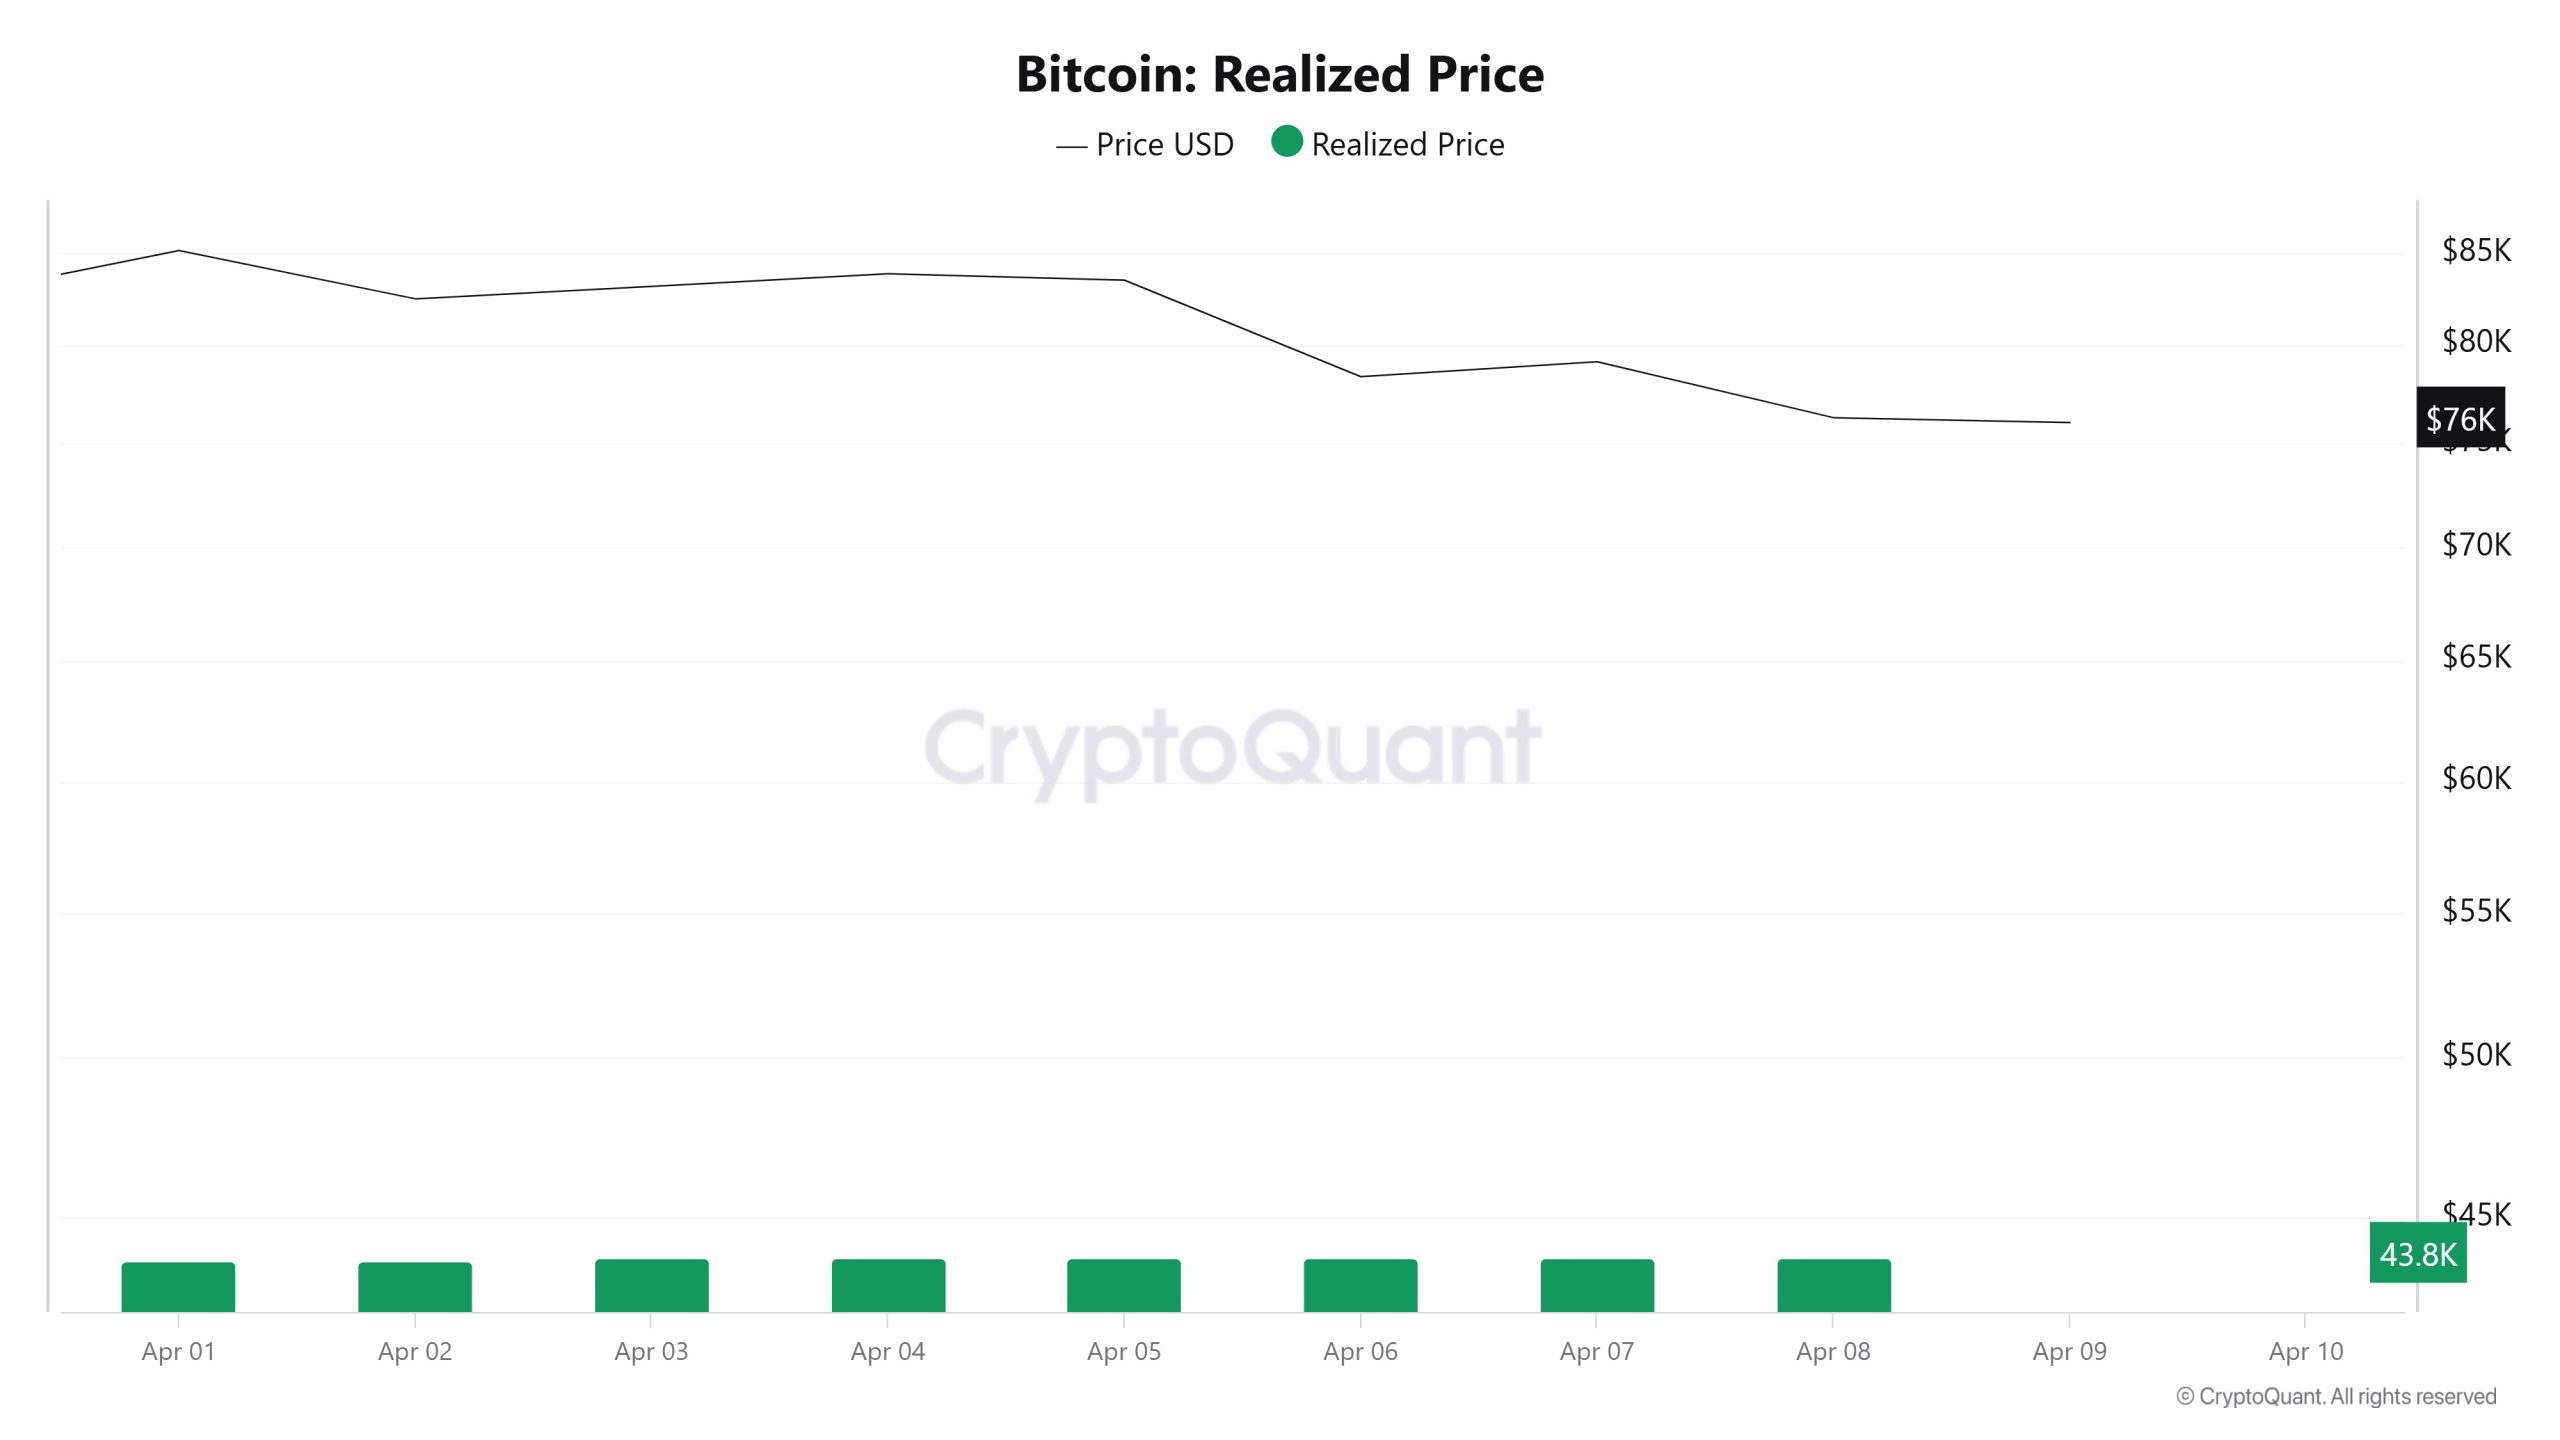
On April 2, Bitcoin price was 82,495 while Realized Price was 43,767. As of April 8, Bitcoin price decreased to 76,276 while Realized Price increased to 43,831. Compared to last week, Bitcoin price decreased por 7.54% while Realized Price increased por 0.15%.
Spent Output Profit Ratio (SOPR)
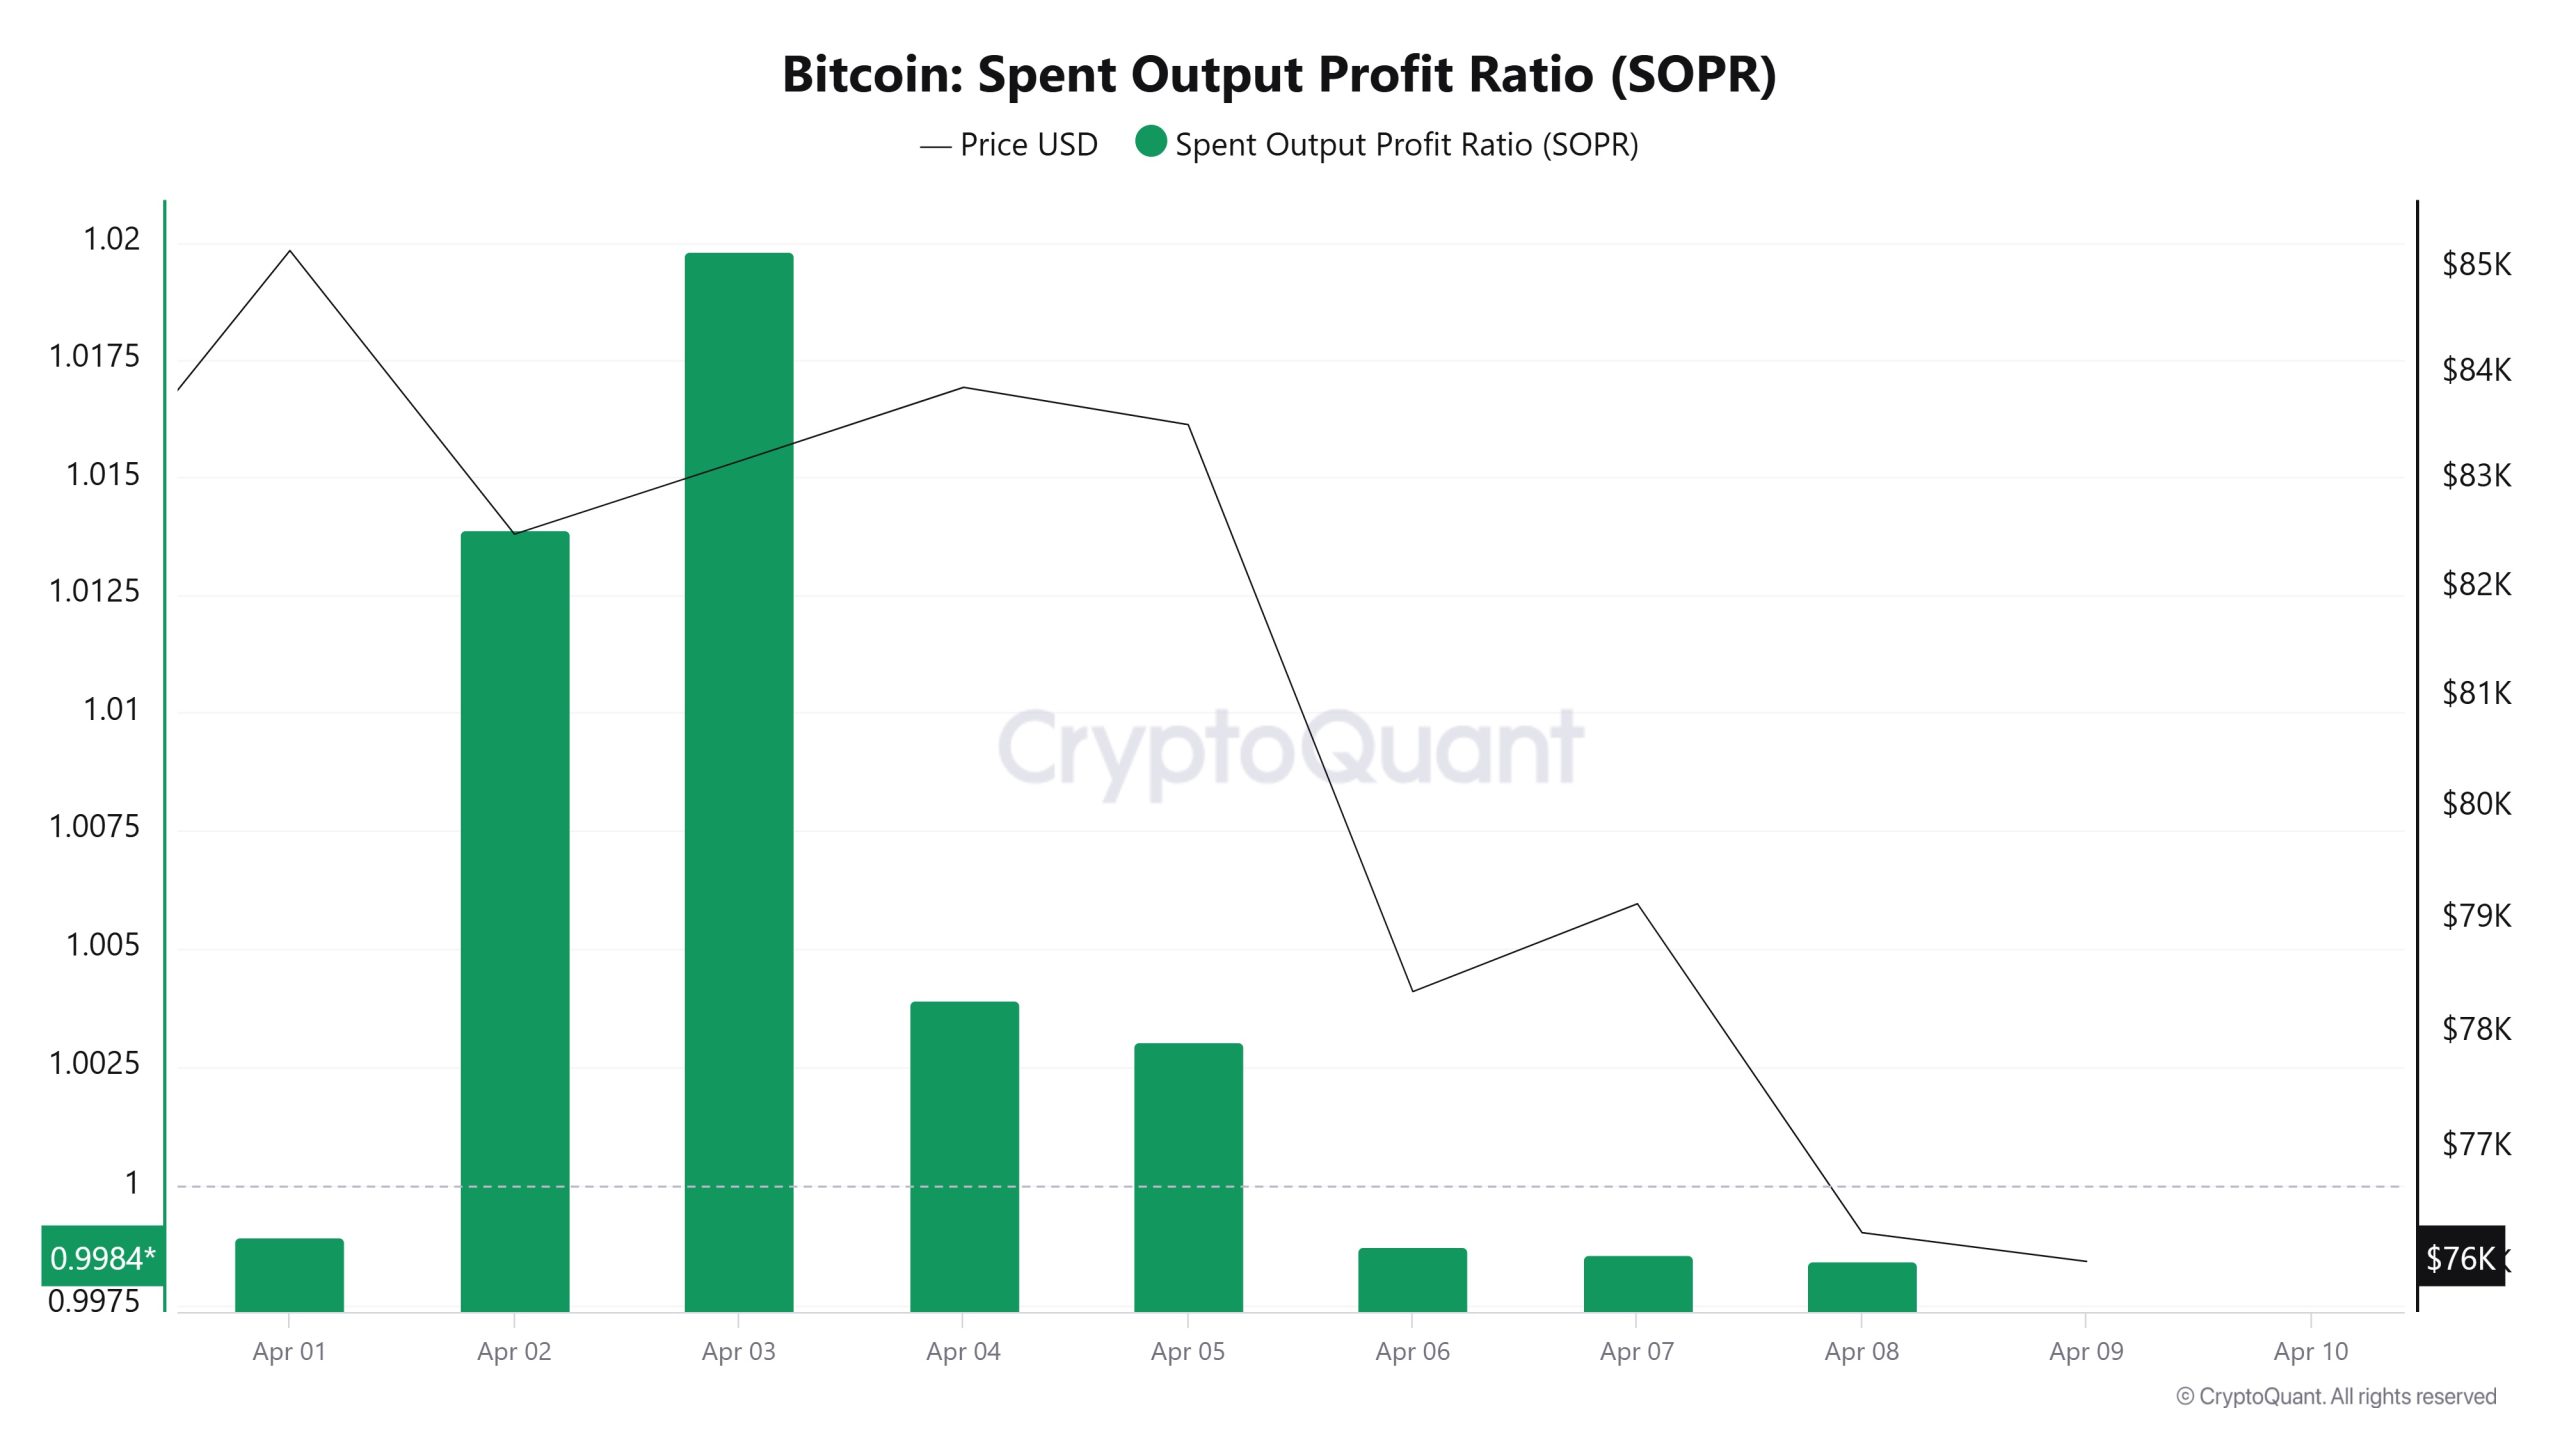
On April 2, the Bitcoin price was 82,495 while the SOPR metric was 1.013. As of April 8, the Bitcoin price was down to 76,276 while the SOPR metric was 0.9984. Compared to last week, Bitcoin price decreased por 7.54% while the SOPR metric decreased por 1.44%.
Derivatives
Open Interest
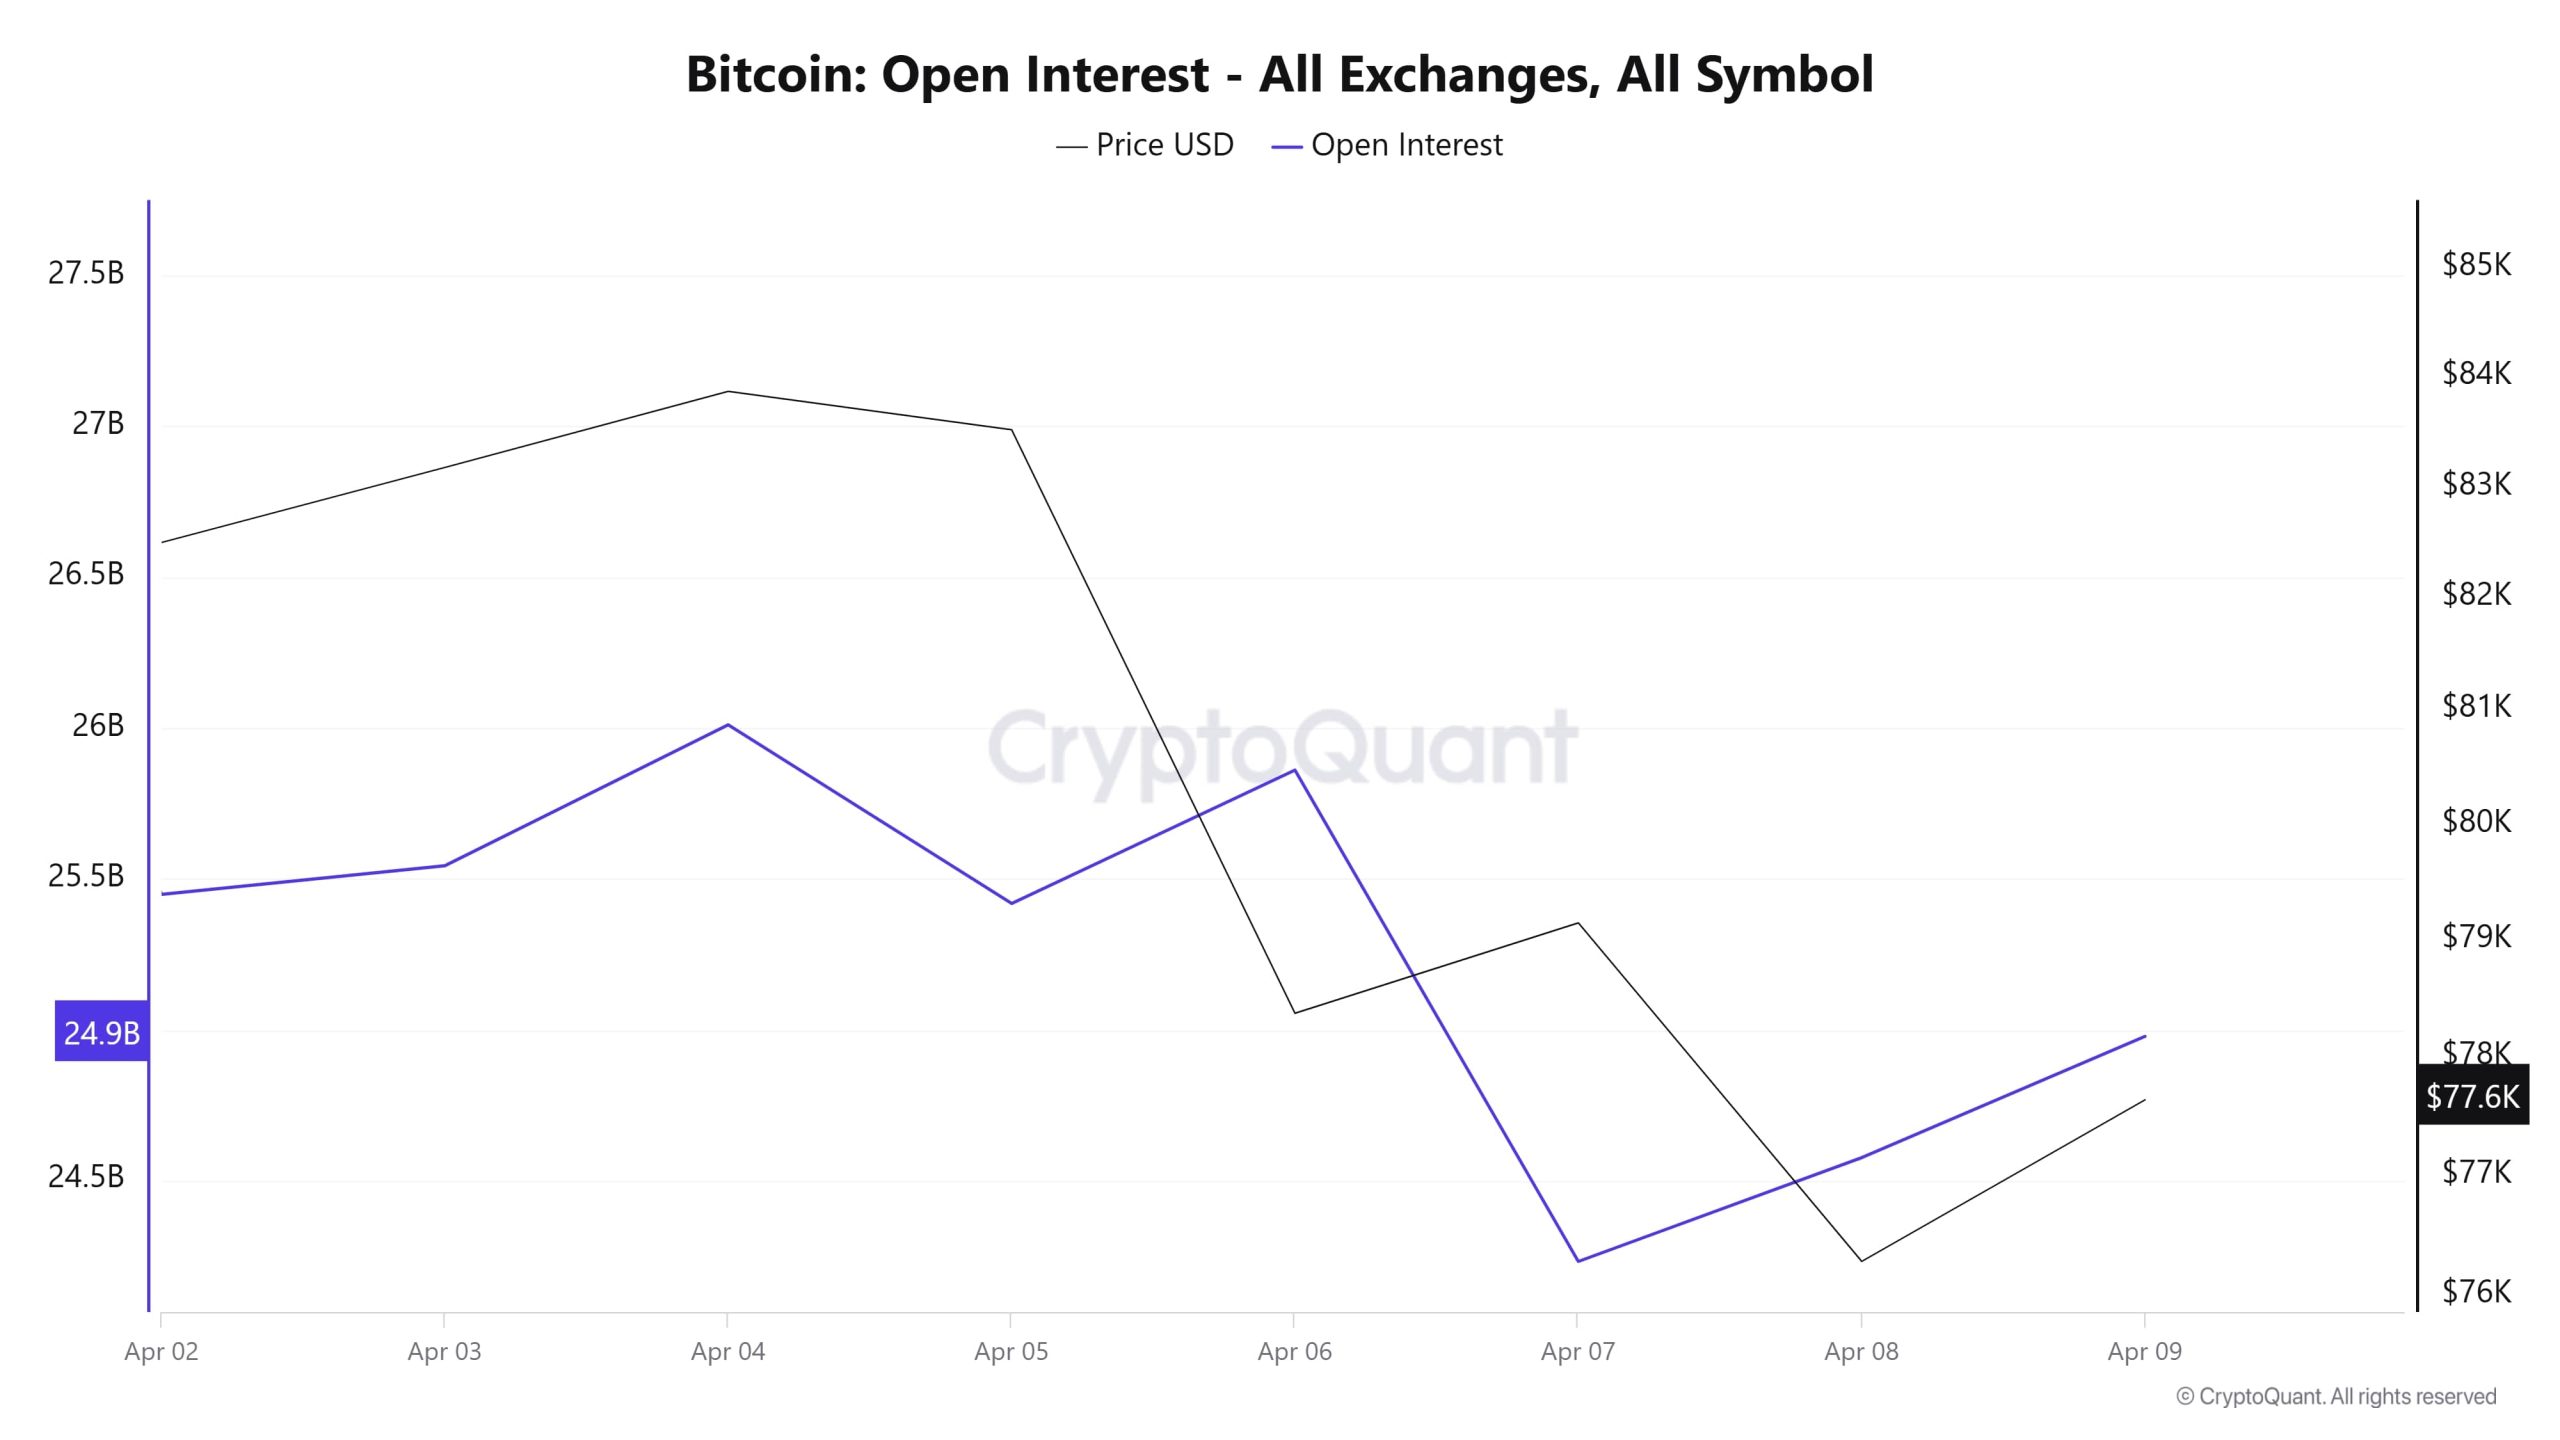
On April 4, open interest exceeded $26 billion, up from about $24.9 billion el April 2. This increase indicates that new leveraged positions are being added to the market and investors are taking bullish positions. However, the direction changes as of April 5. A sharp decline en open interest begins and this continues until April 7 at $24.5 billion. The Bitcoin price also retreated from levels close to $85,000 to $76,000 during this period. This synchronized decline shows that leveraged positions are being liquidated and a significant retracement is taking place.
The impact of macro developments en the background of this decline is also noteworthy. In particular, the US’s plans to impose tariffs el products was a factor that reduced the risk appetite en global markets. The potential protectionist steps of the US put pressure not only el traditional markets but also el risky asset classes such as crypto. After April 7, open interest started to recover, indicating that positions were re-entering the market. The fact that the price partially accompanied this recovery may suggest that the market has started to digest this news flow en the short term. However, it should be noted that while open interest is increasing again, the price is still showing a limited recovery. This suggests an early reopening of speculative positions but a cautious price reaction. In sum, this chart clearly reflects both short-term liquidations and the impact of macro news el the market.
Funding Rate
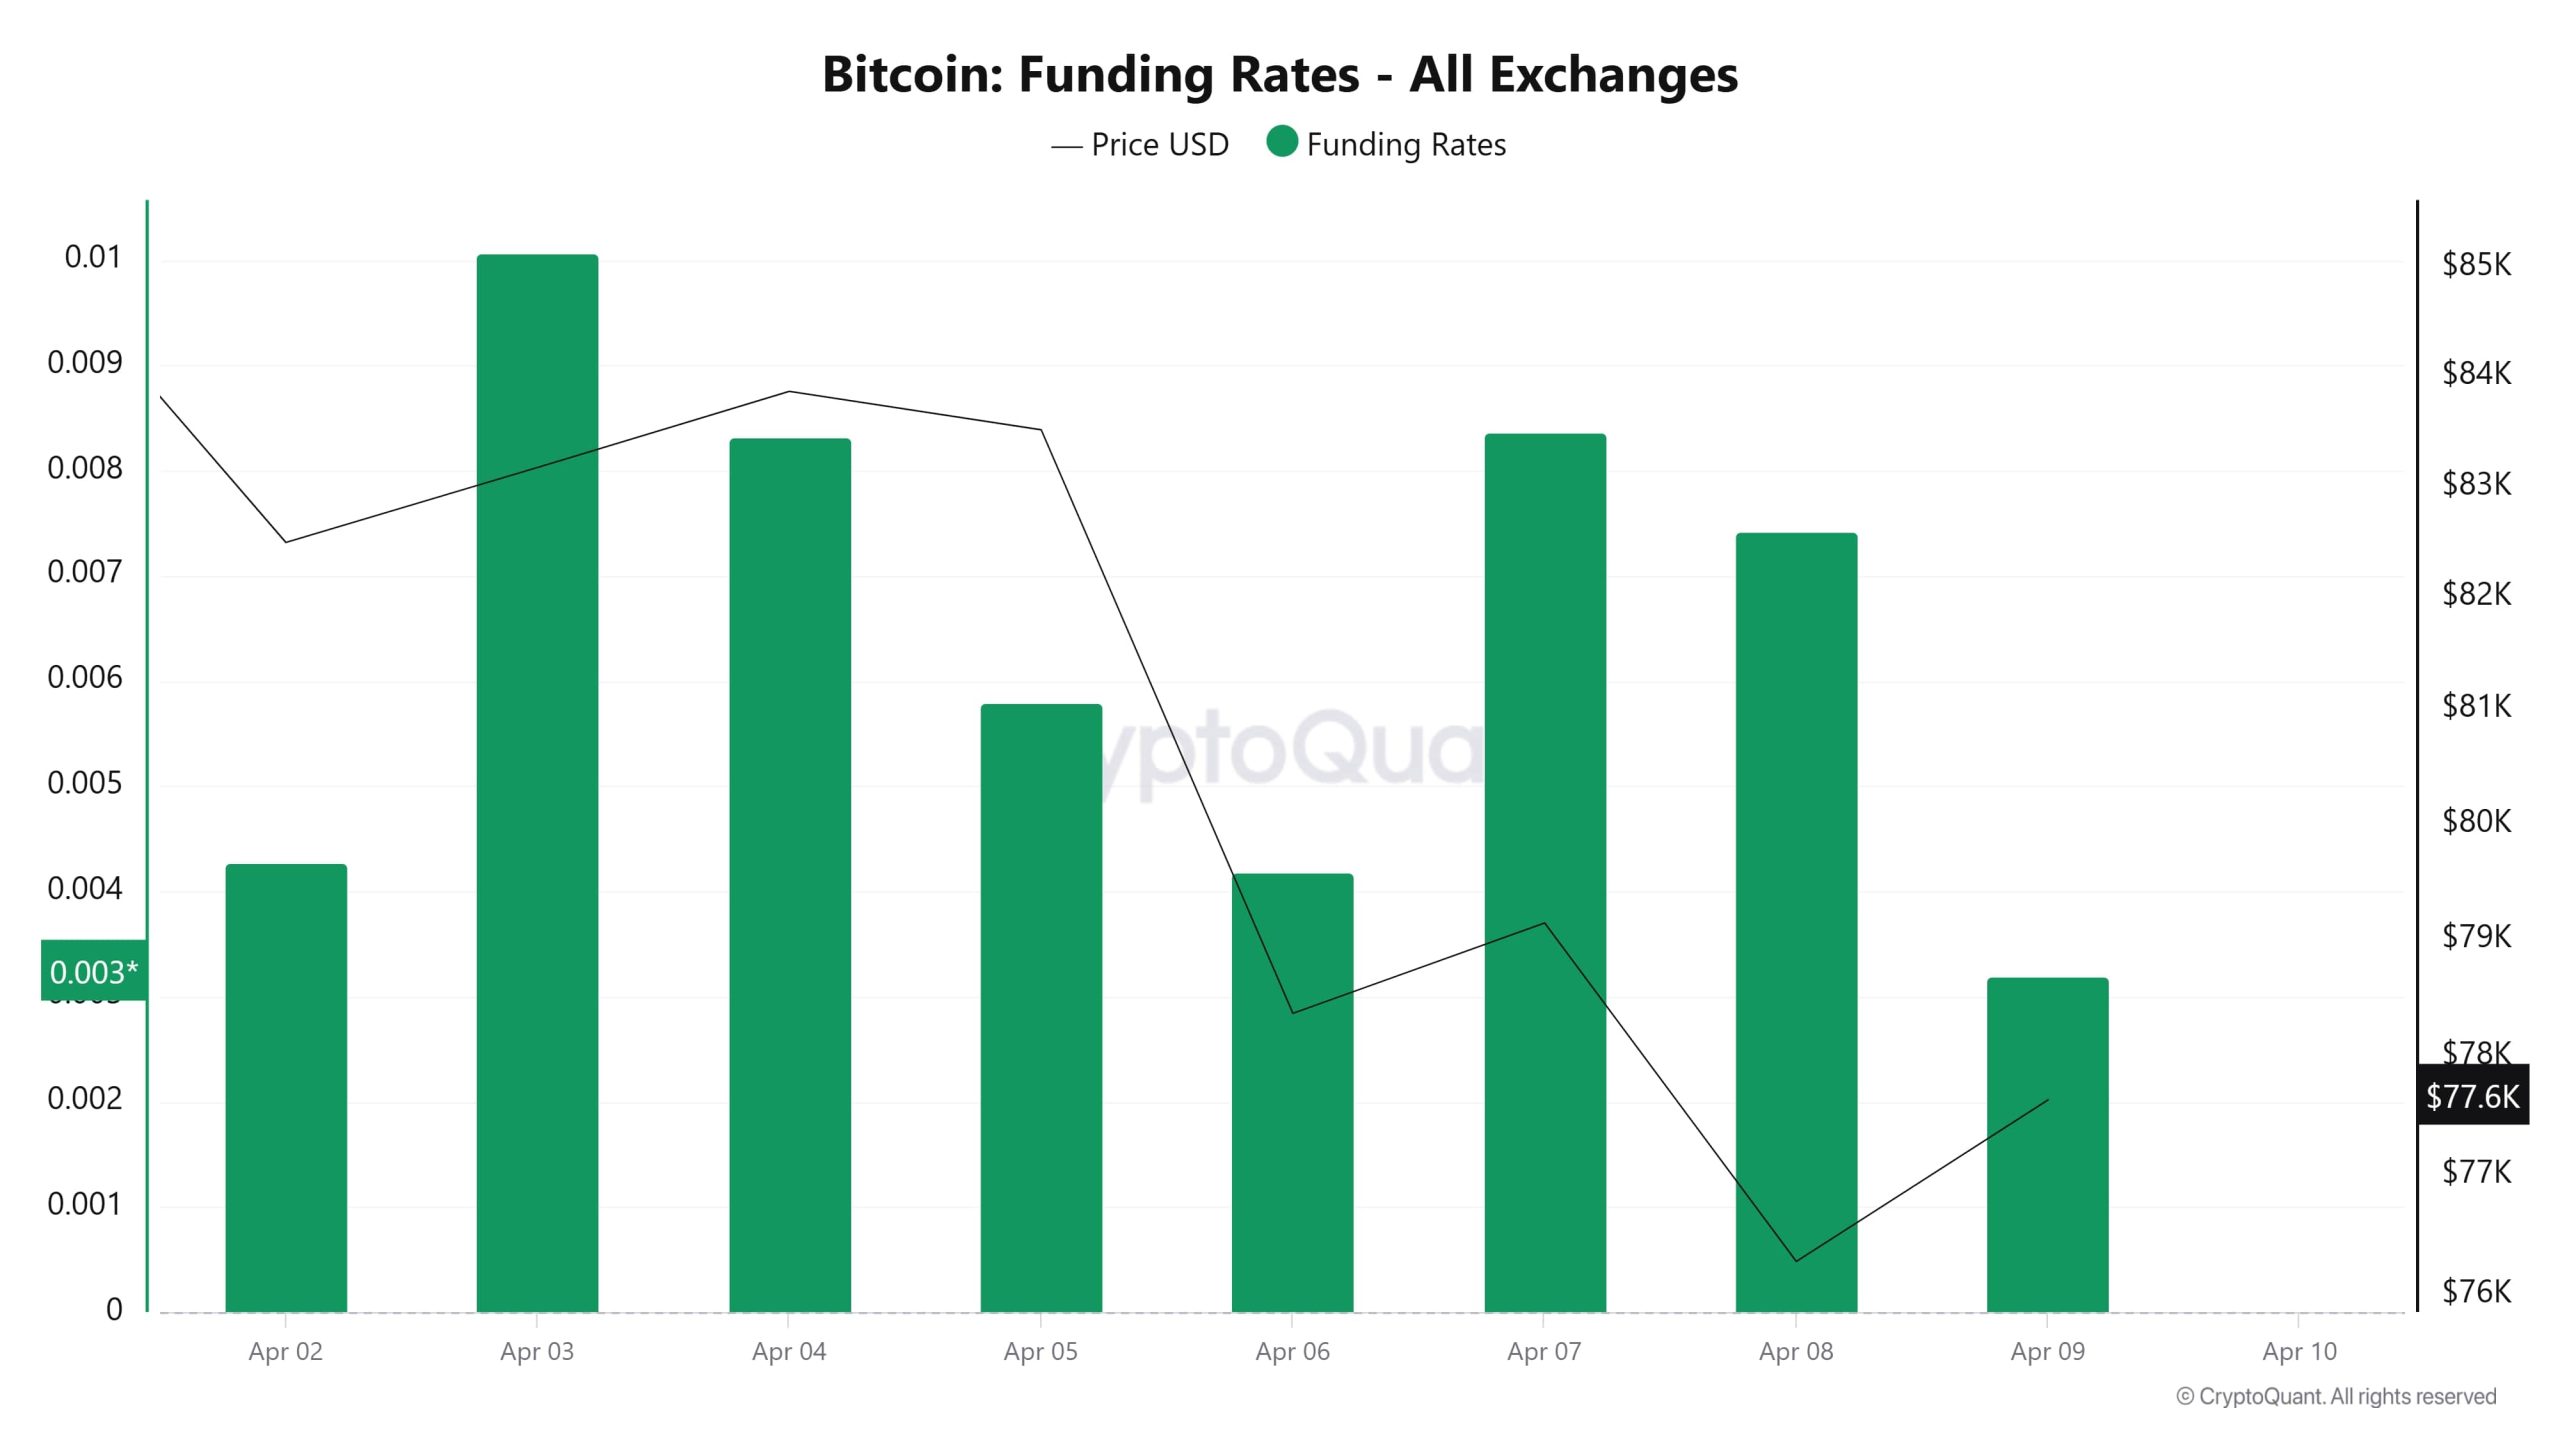
Last week funding rate remained positive en general. This shows that the market is predominantly en long positions. On April 3-4, the rates are quite high and the price is also el the upside. However, after April 5, the funding rate falls and the price declines sharply. This is en line with the liquidation of excessive long positions.
What is noteworthy is that the funding rate rose again el April 7-8 when the price was at low levels. This suggests that investors continued to open long positions despite the decline, i.e. they were trying to buy at the bottom. However, this suggests that the market is still fragile and open to new liquidations.
Long & Short Liquidations
With the US tariffs imposed el China, BTC, which fell sharply, caused the liquidation of a long position of $ 1 billion 140 million. At the same time, the volatility el the price led to the liquidation of $494 million worth of short positions.
| Date | Long Amount (Million $) | Short Amount (Million $) |
|---|---|---|
| April 02 | 69.69 | 159.50 |
| April 03 | 40.19 | 27.77 |
| April 04 | 55.51 | 39.40 |
| April 05 | 66.06 | 27.99 |
| April 06 | 588.09 | 22.88 |
| April 07 | 245.68 | 187.48 |
| April 08 | 74.82 | 29.78 |
| Total | 1140.04 | 494.80 |
Supply Distribution
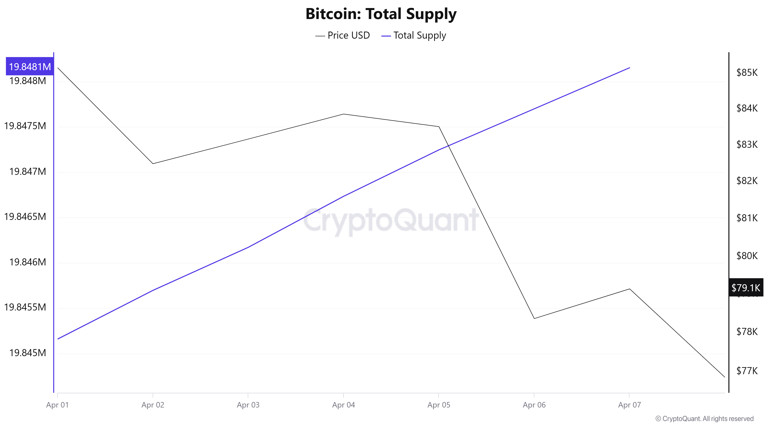
Total Supply: Increased por about 0.015% compared to last week to 19,848,152 units.
New Supply: The amount of BTC produced this week was 2,994.
Velocity: Velocity, which was 13.27 last week, was 13.19 as of April 7.
| Wallet Categoría | 01.04.2025 | 07.04.2025 | Change (%) |
|---|---|---|---|
| < 1 BTC | 8.5415% | 8.5391% | -0.0281% |
| 1 – 10 BTC | 11.751% | 11.7255% | -0.2170% |
| 10 – 100 BTC | 24.842% | 24.8084% | -0.1353% |
| 100 – 1k BTC | 28.094% | 28.0508% | -0.1538% |
| 1k – 10k BTC | 18.506% | 18.5207% | 0.0794% |
| 10k+ BTC | 8.263% | 8.3551% | 1.1146% |
In the wallet distribution of the current supply, a small decrease of 0.028% was observed en the < 1 BTC category, while 1 – 10 BTC holders experienced a slight decrease of 0.217%. In the 10 – 100 BTC range, a decrease of 0.135% was noted, while the 100 – 1K BTC segment shrank por 0.154%. 1K – 10K BTC holders saw a slight increase of 0.079%, while the most significant change was a significant increase of 1.115% en the 10K+ BTC category.
Exchange Reserve
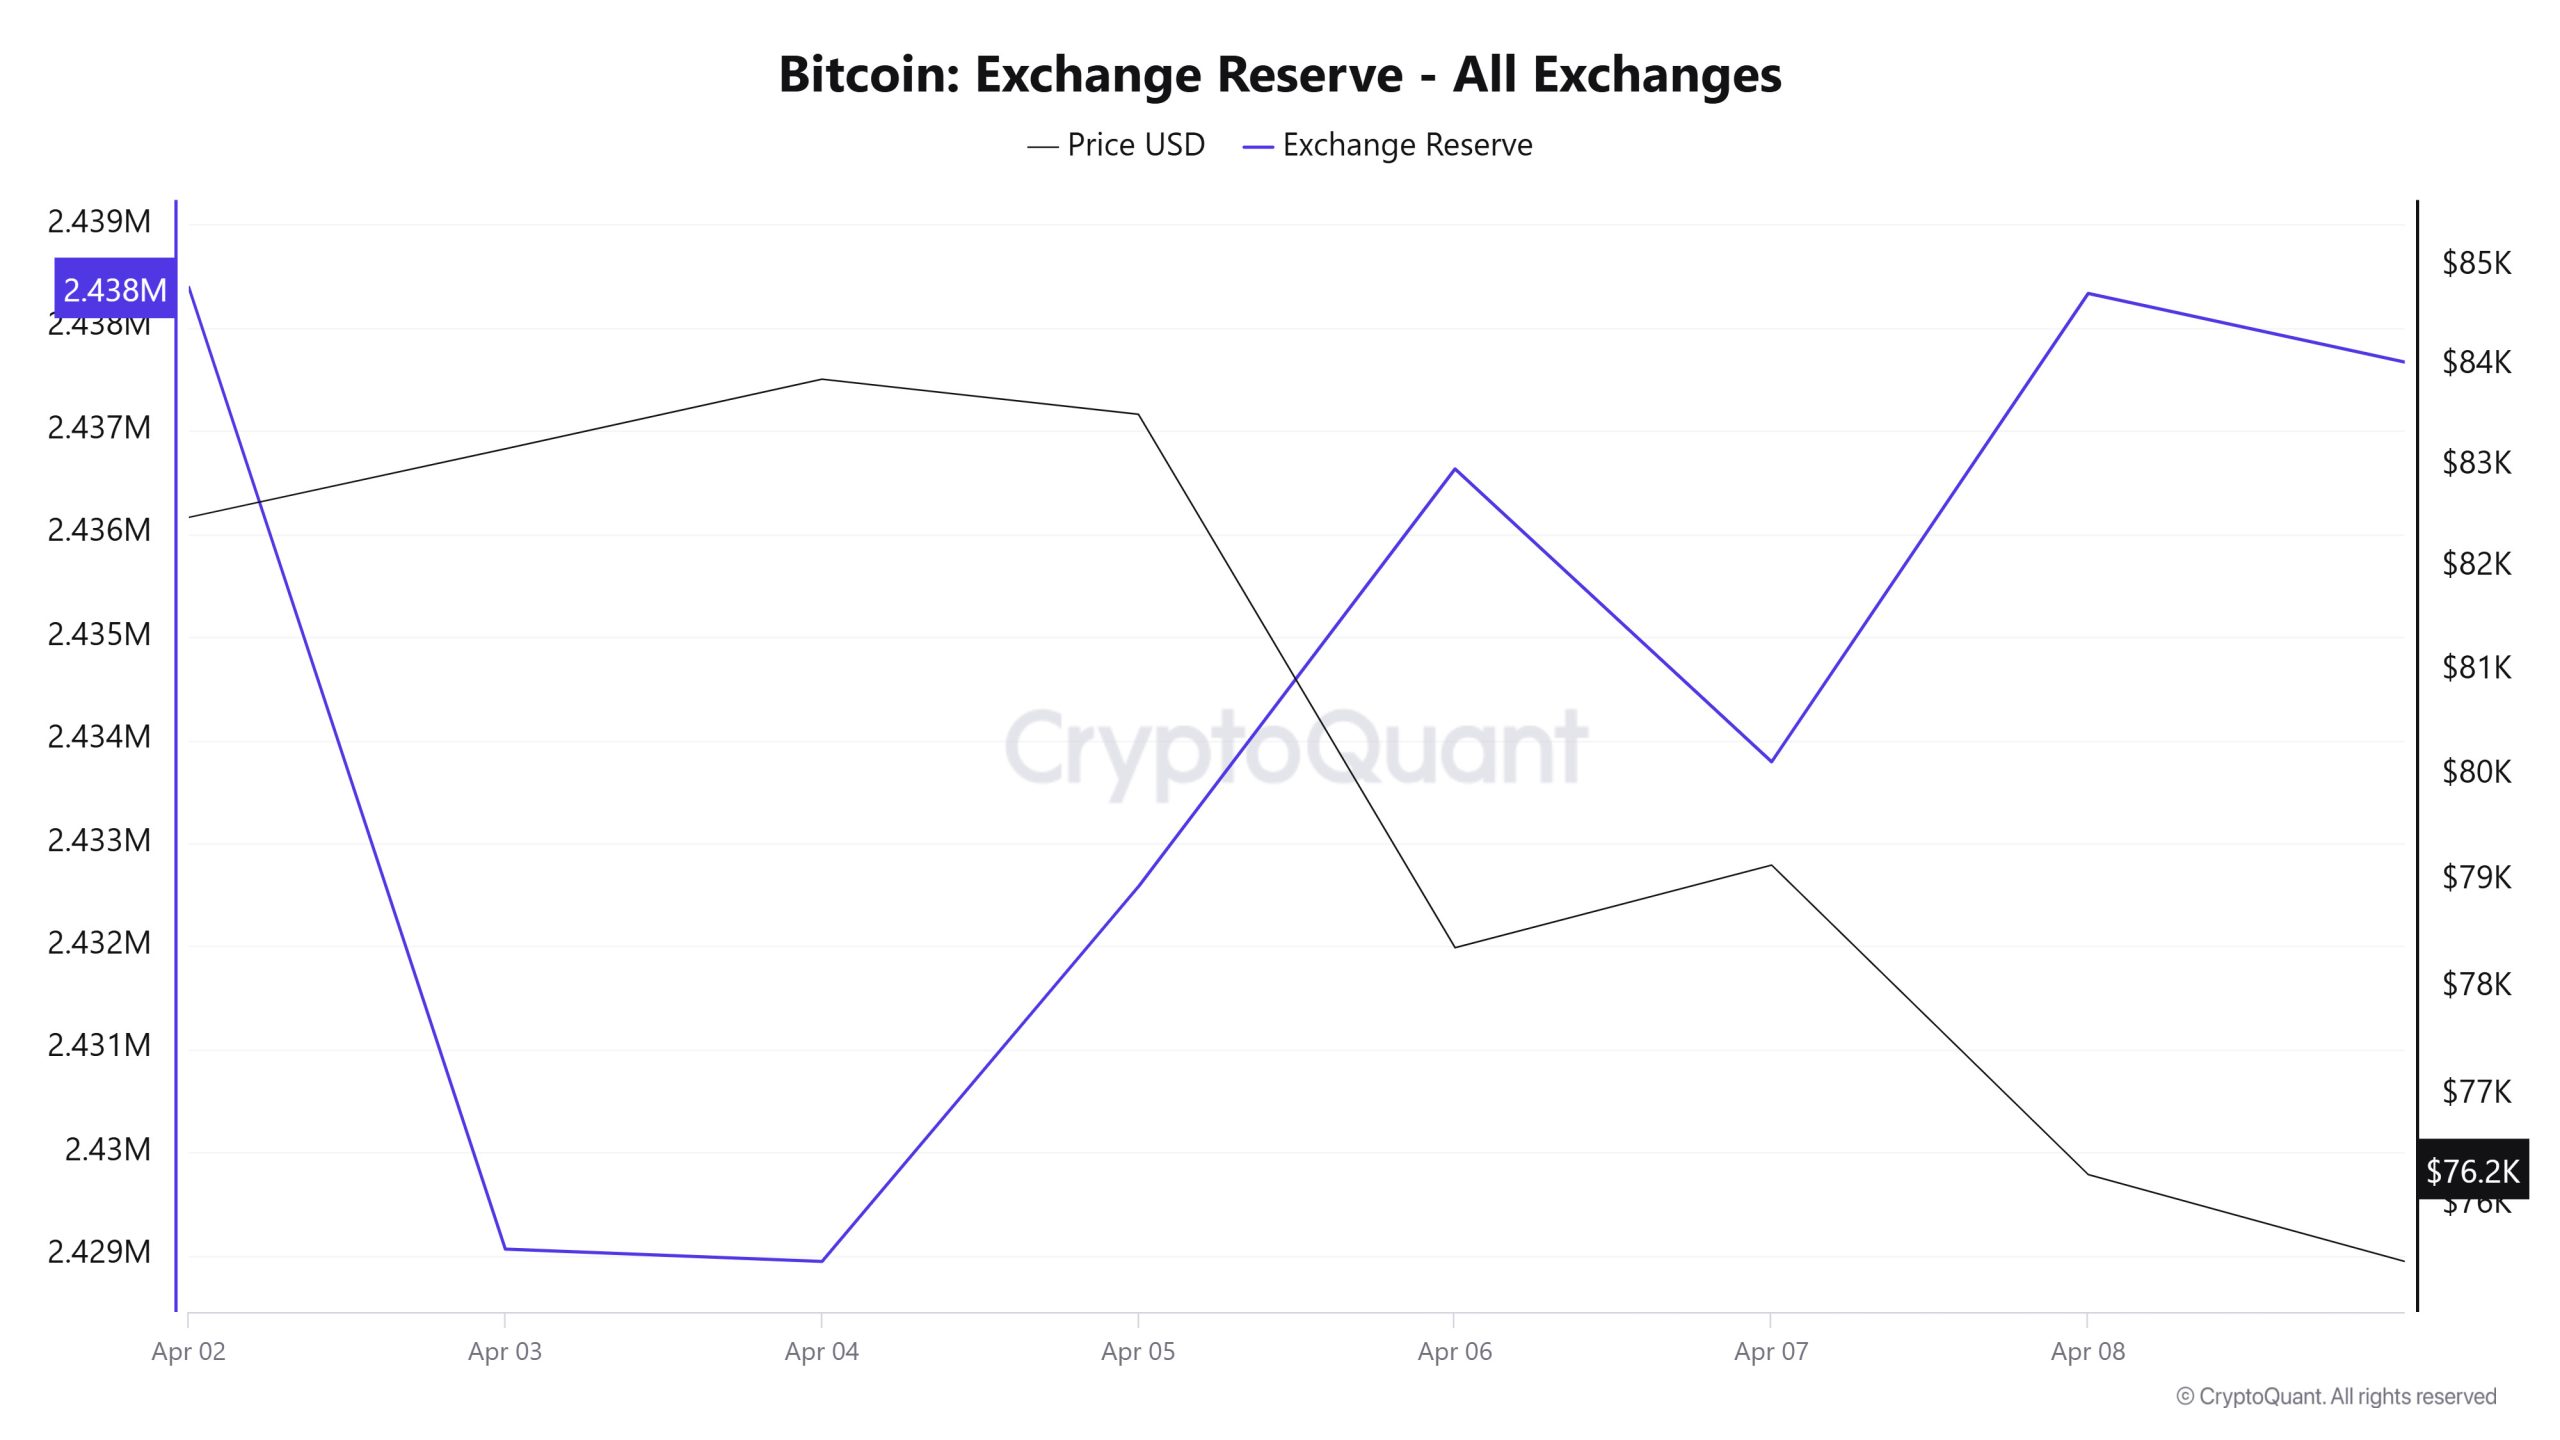
Between April 2-8, 2025, Bitcoin reserves el exchanges decreased slightly from 2,438,393 BTC to 2,438,334 BTC. During this period, there was a total net outflow of 59 BTC and exchanges’ Bitcoin reserves decreased por 0.0024%. The Bitcoin price fell por approximately 7.5% en the same period. Bitcoin, which closed at $82,495 el April 2, 2025, closed at $76,277 el April 8, 2025. Bitcoin reserves el exchanges have not changed significantly, with reserve data suggesting a neutral trend. The decline en Bitcoin price may have been triggered por the negative impact el investor sentiment due to the economic war environment caused por the recent increase en global tariffs.
| Date | 2-Apr | 3-Apr | 4-Apr | 5-Apr | 6-Apr | 7-Apr | 8-Apr |
|---|---|---|---|---|---|---|---|
| Exchange Inflow | 39,693 | 44,741 | 42,637 | 15,599 | 21,681 | 60,006 | 39,249 |
| Exchange Outflow | 40,051 | 54,071 | 42,757 | 11,962 | 17,629 | 62,848 | 34,705 |
| Exchange Netflow | -357 | -9,330 | -120 | 3,637 | 4,052 | -2,842 | 4,544 |
| Exchange Reserve | 2,438,393 | 2,429,063 | 2,428,943 | 2,432,580 | 2,436,632 | 2,433,790 | 2,438,334 |
| BTC Price | 82,495 | 83,173 | 83,865 | 83,516 | 78,368 | 79,144 | 76,277 |
Fees and Revenues
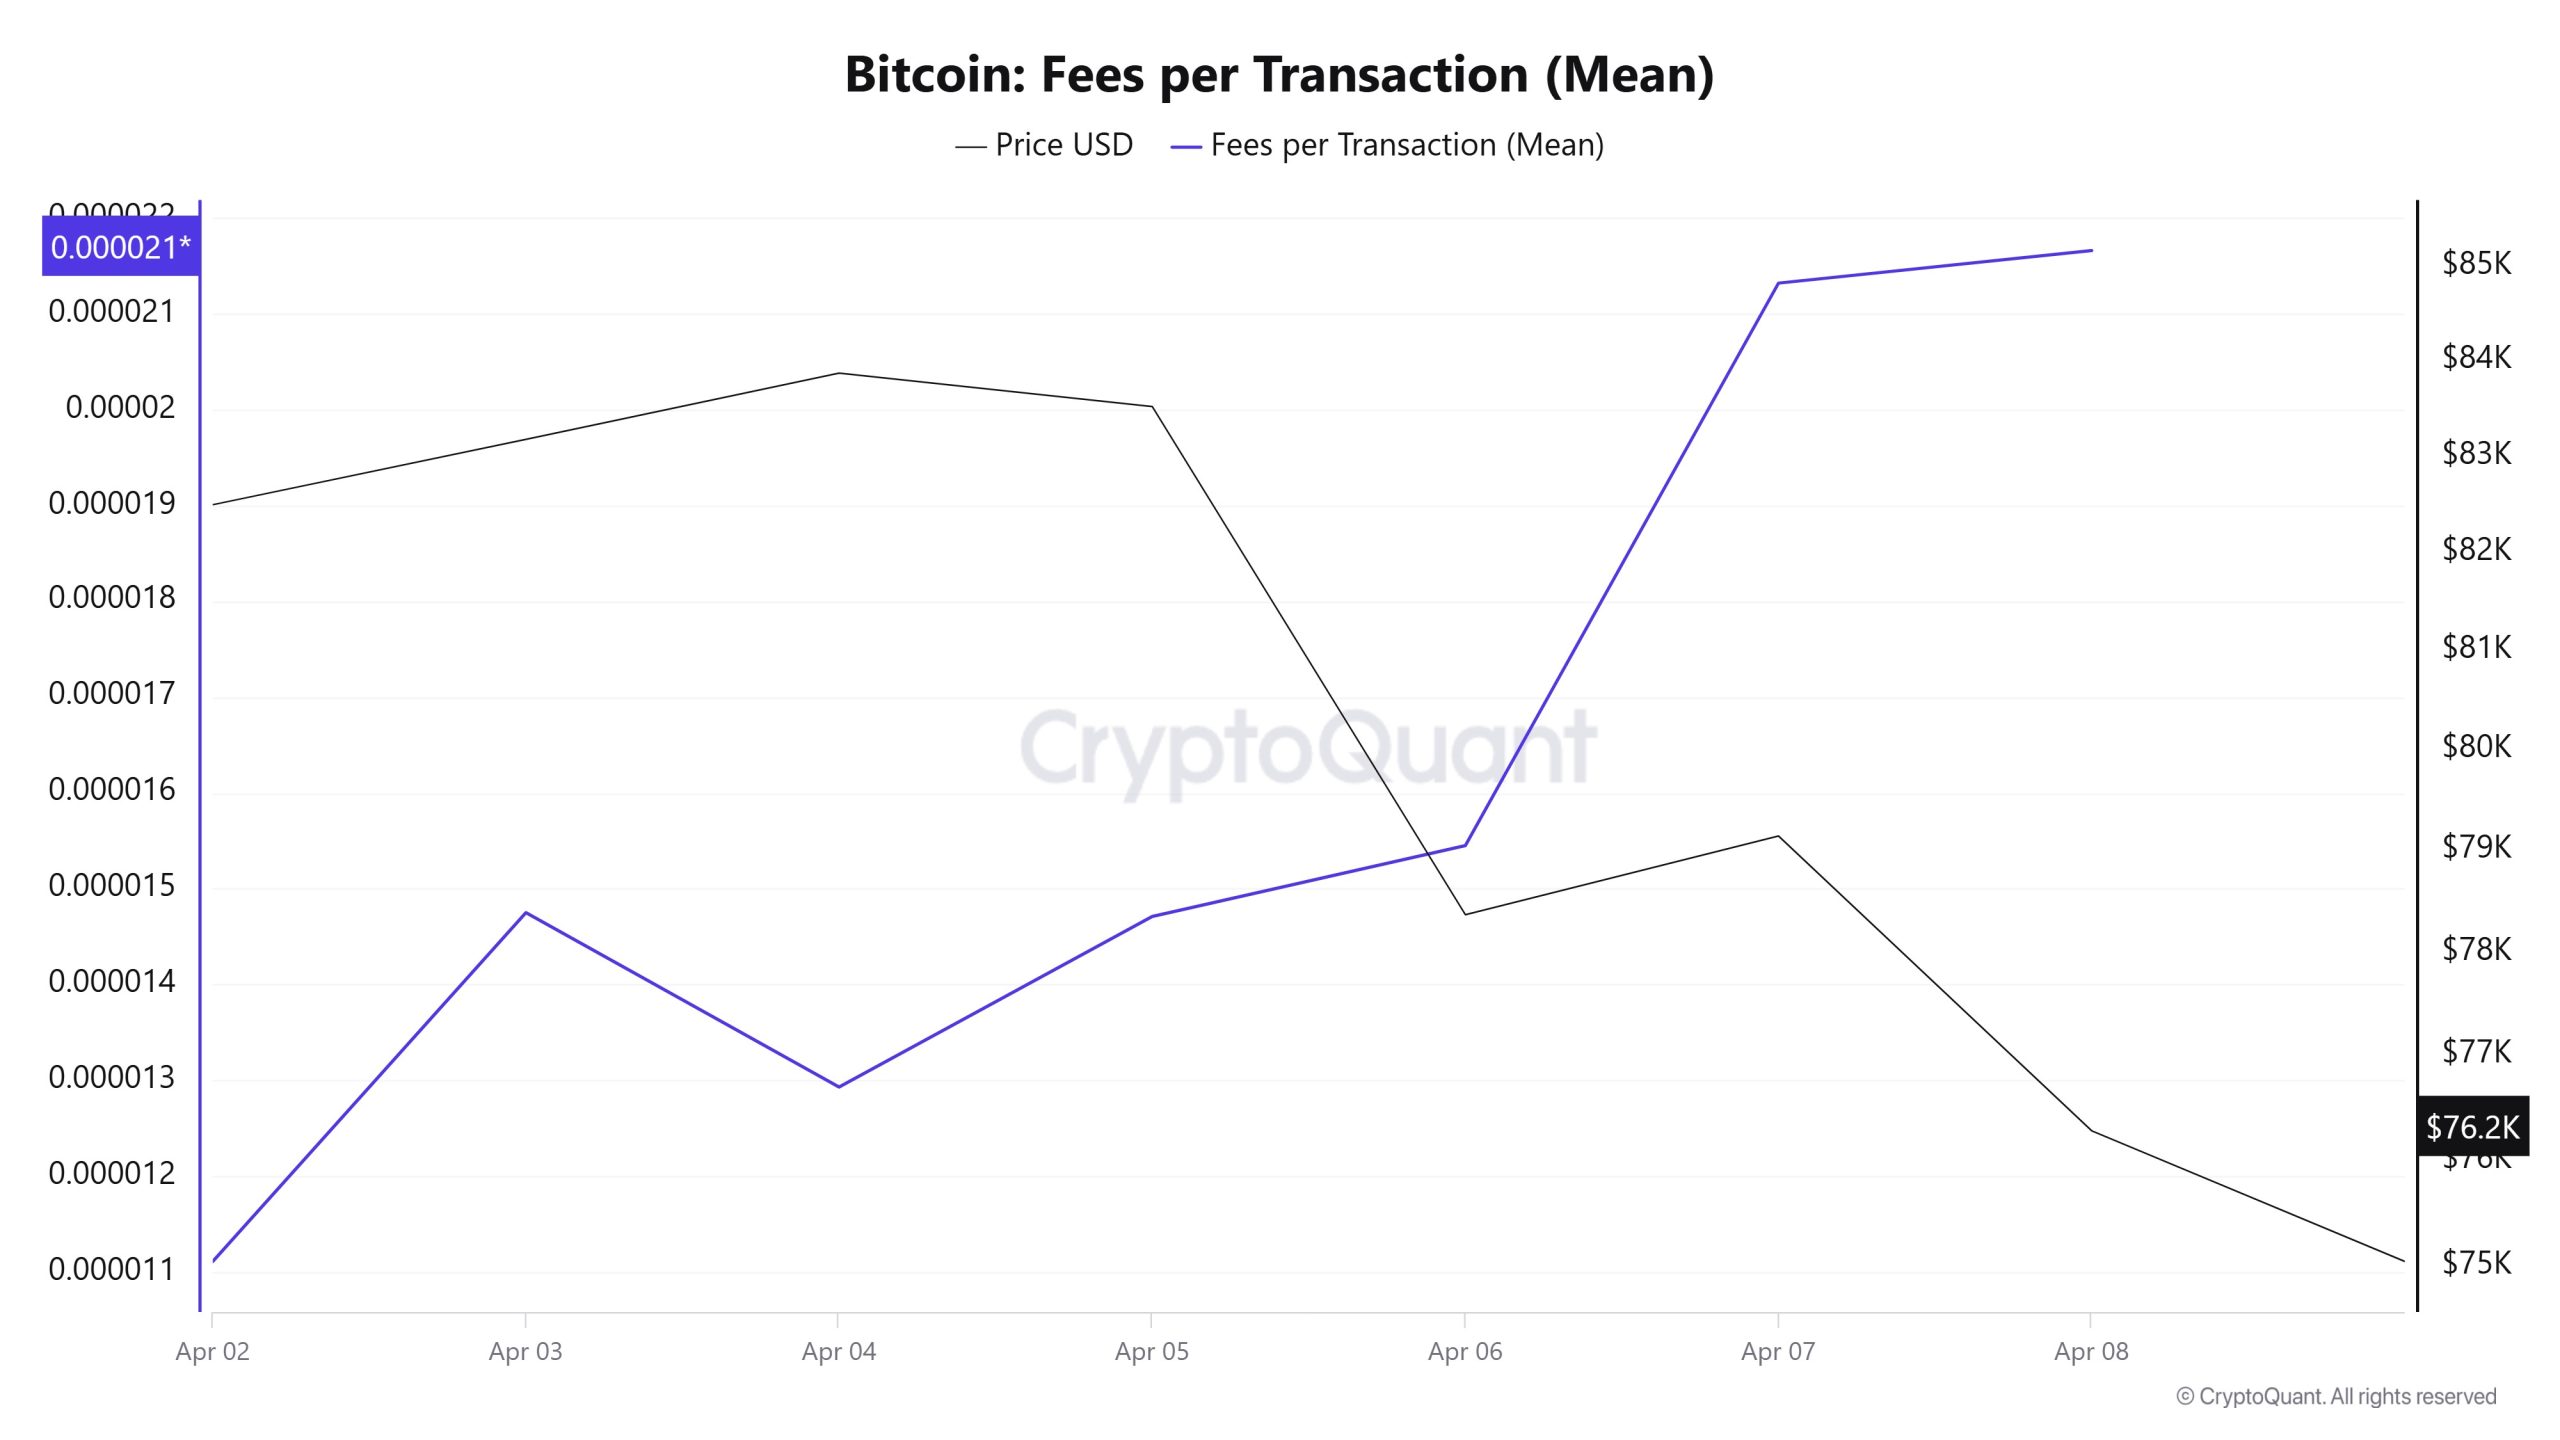
Analysing the Bitcoin Fees per Transaction (Mean) data between April 2- April 8, it was seen that this value was at the level of 0.00001111 el April 2, the first day of the week. Since then, Bitcoin Fees per Transaction (Mean) value, which has shown an upward trend with the sharp movements en Bitcoin price due to the tariffs announced por Trump, decreased to 0.00001293 el April 4.
The value, which showed an upward trend en the following days, closed at 0.00002166 el April 8, the last day of the weekly period, as the highest value of the week.
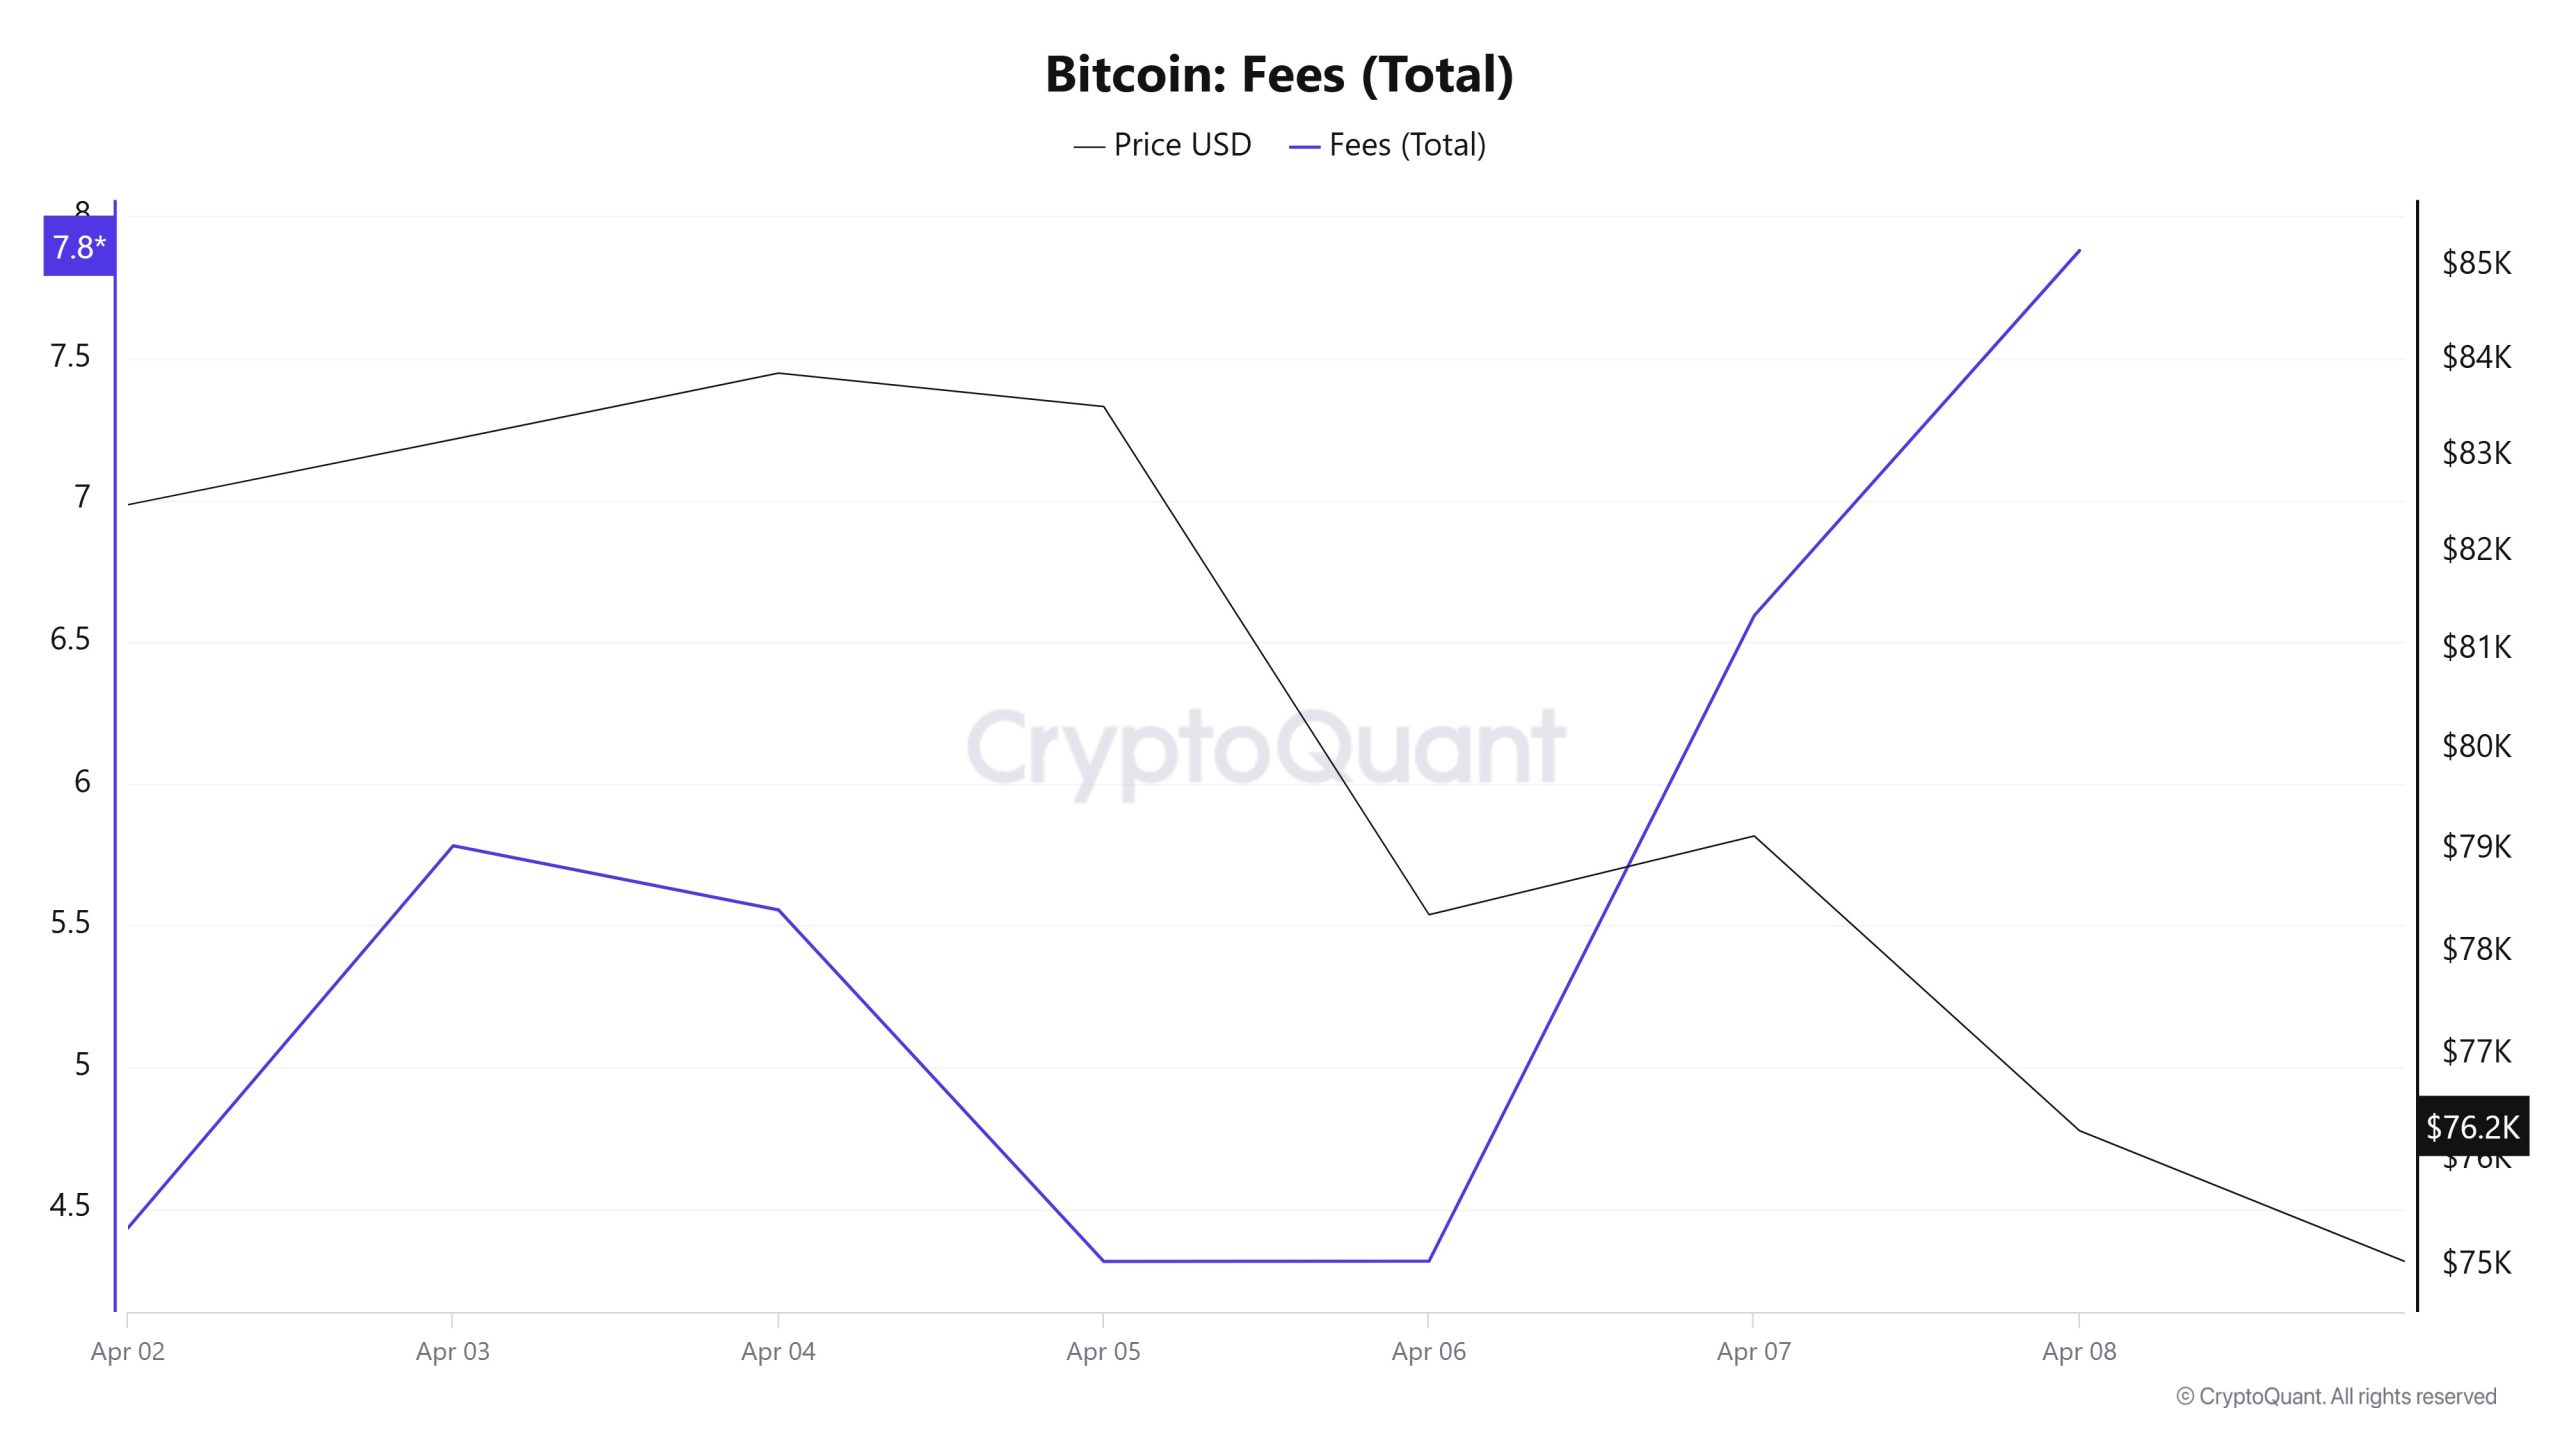
Similarly, when Bitcoin Fees (Total) data between April 2 and April 8 were analyzed, it was observed that this value was at 4.43354893 el April 2, the first day of the week. Bitcoin Fees (Total) value, which showed a downward trend after rising slightly from this date, followed a horizontal course el March 5-6.
Showing an upward trend en the following days, the value closed at 7.88027275 el April 8, the last day of the weekly period, as the highest value of the week.
Miner Flows
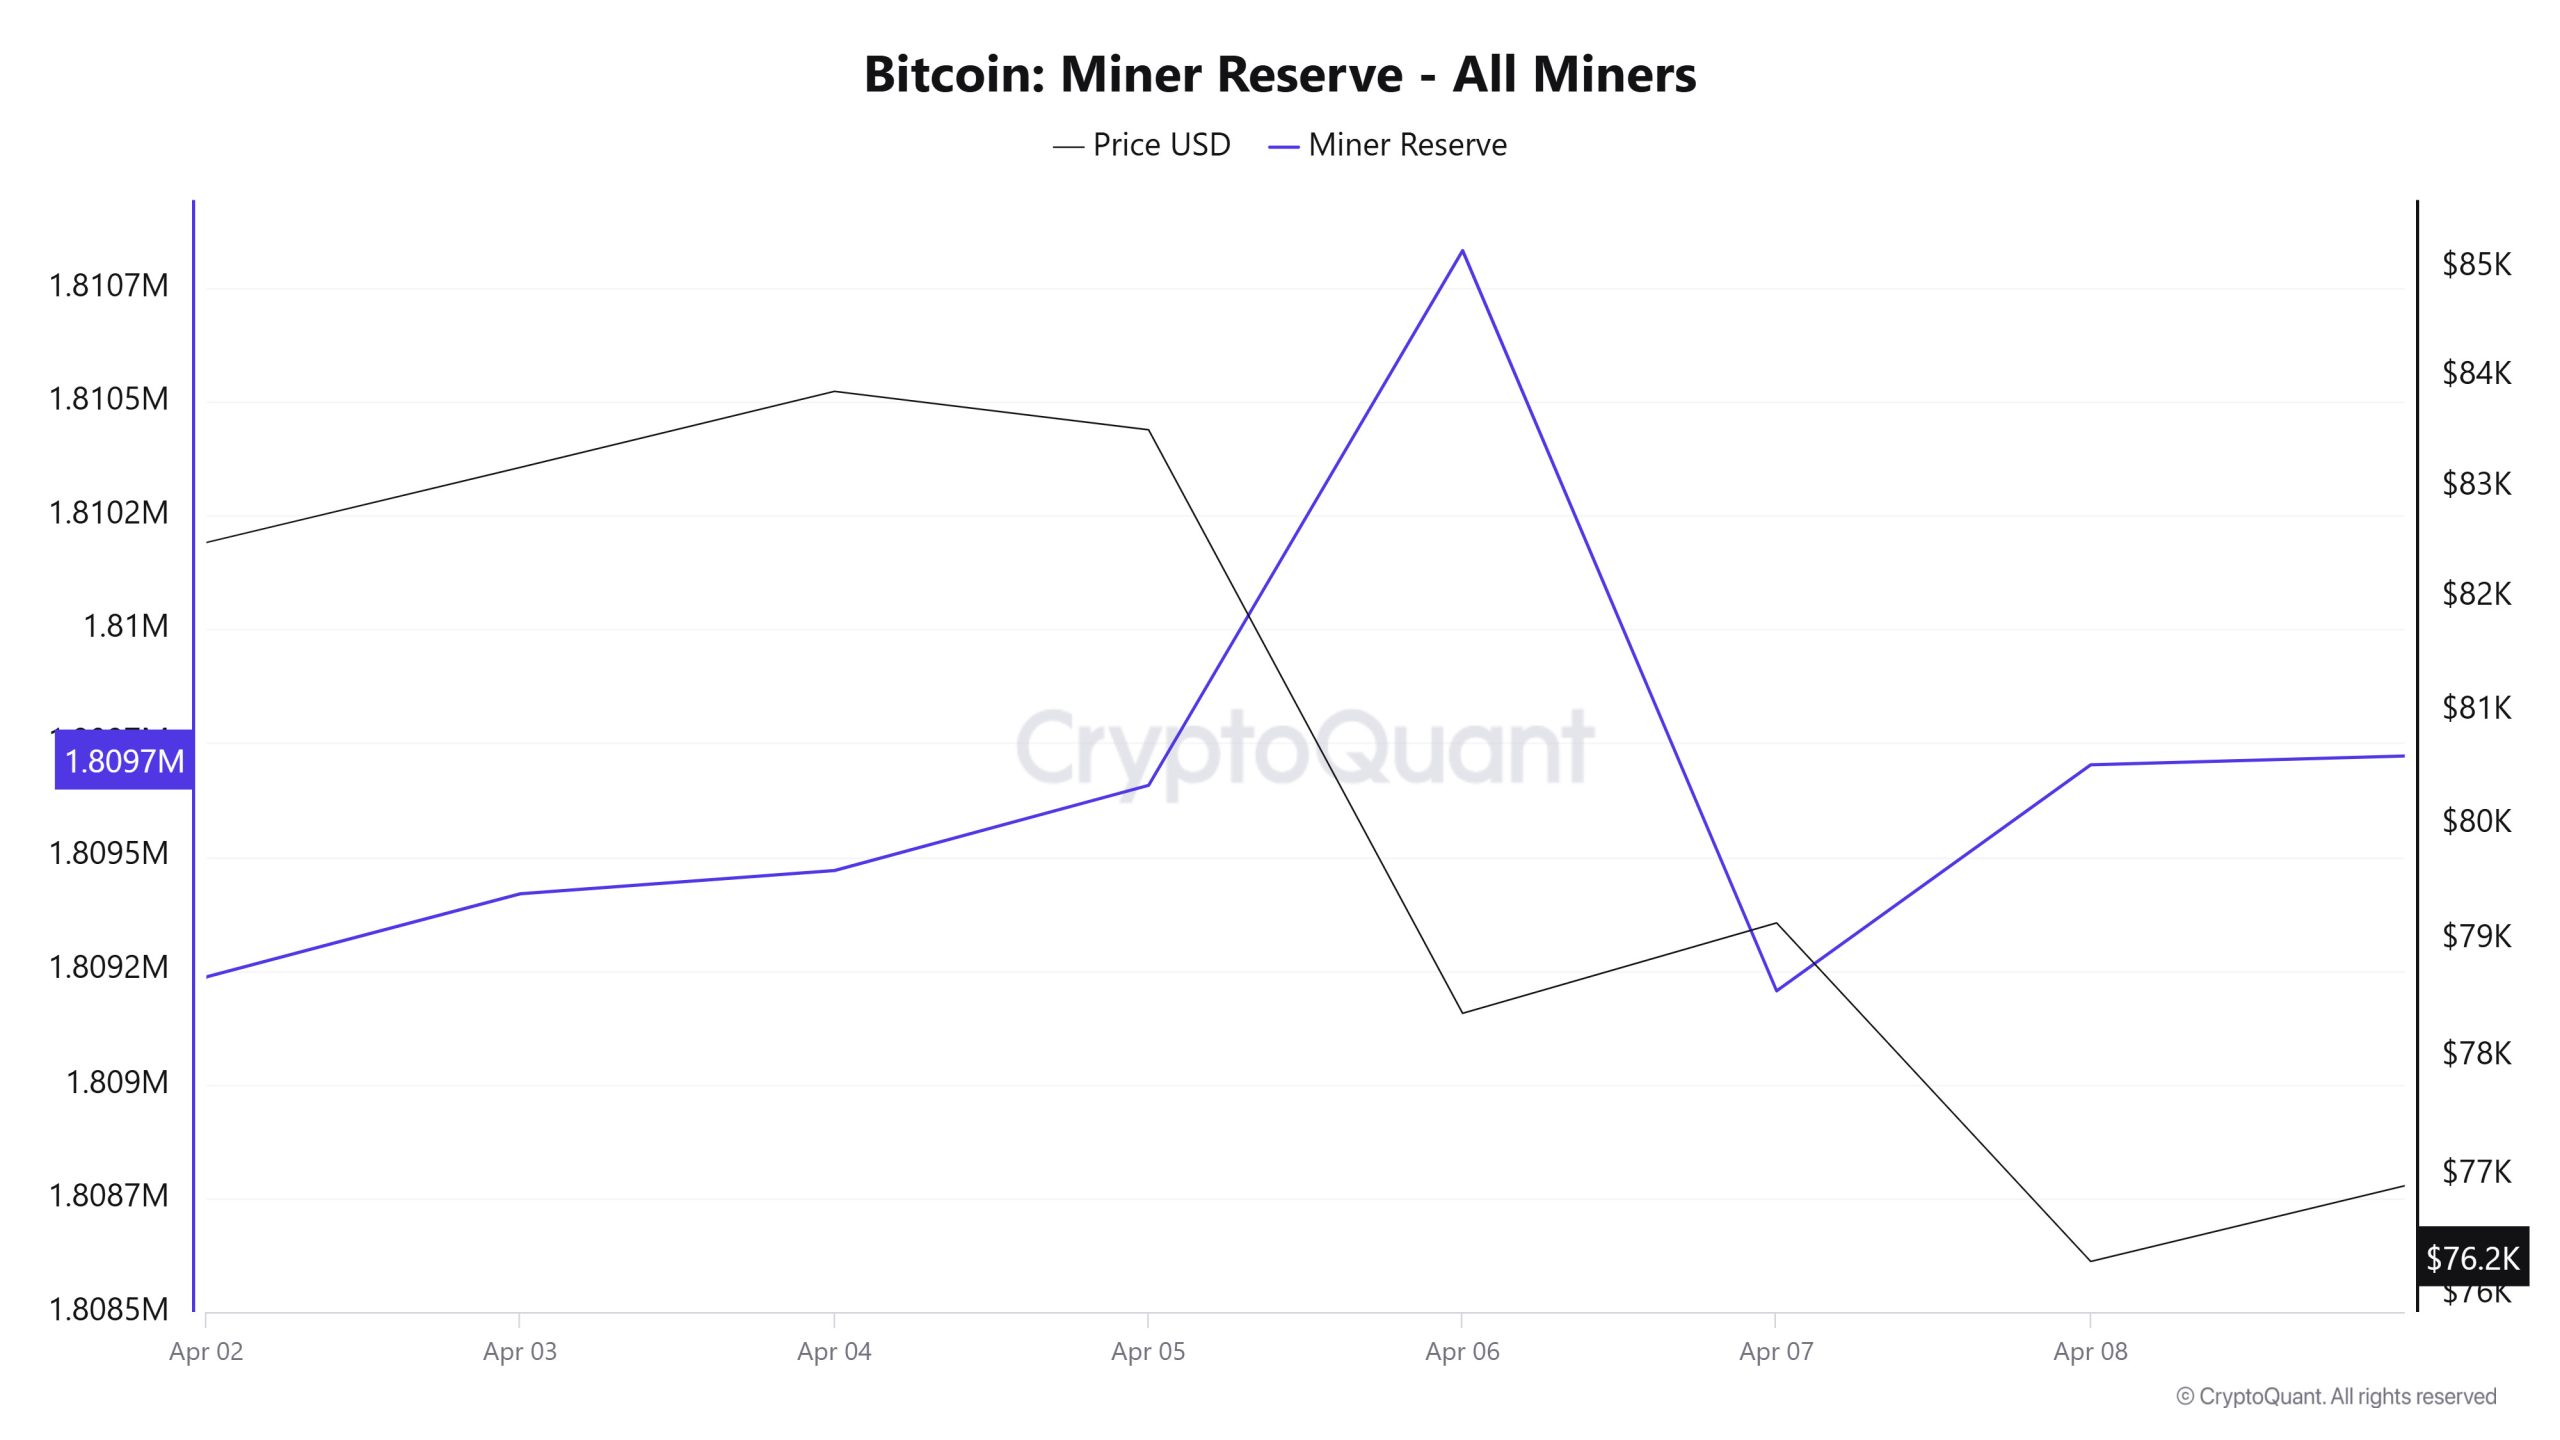
As can be seen en the Miner Reserve table, the number of Bitcoins en miners’ wallets increased this week. Although there was a positive correlation between Miner Reserve and Bitcoin price at the beginning of this week, the correlation turned negative por the end of the week.
Miner Inflow, Outflow and Netflow
Between April 2 and April 8, 58,591 Bitcoins exited miners’ wallets and 59,682 Bitcoins entered miners’ wallets between the same dates. The Miner Netflow for this week was 1,091 Bitcoin. Meanwhile, the Bitcoin price was $82,495 el April 2 and $76,276 el April 8.
For the week, the net flow (Miner Netflow) was positive as Bitcoin inflow into miner wallets (Miner Inflow) was higher than Bitcoin outflow from miner wallets (Miner Outflow).
| Date | April 2 | April 3 | April 4 | April 5 | April 6 | April 7 | April 8 |
|---|---|---|---|---|---|---|---|
| Miner Inflow | 6,561.3 | 11,776.5 | 7,458.0 | 3,378.8 | 6,337.5 | 14,075.9 | 10,094.9 |
| Miner Outflow | 5,935.9 | 11,593.8 | 7,407.1 | 3,191.6 | 5,162.1 | 15,703.0 | 9,597.8 |
| Miner Netflow | 625.4 | 182.6 | 51.0 | 187.2 | 1,175.4 | -1,627.2 | 497.1 |
Transaction
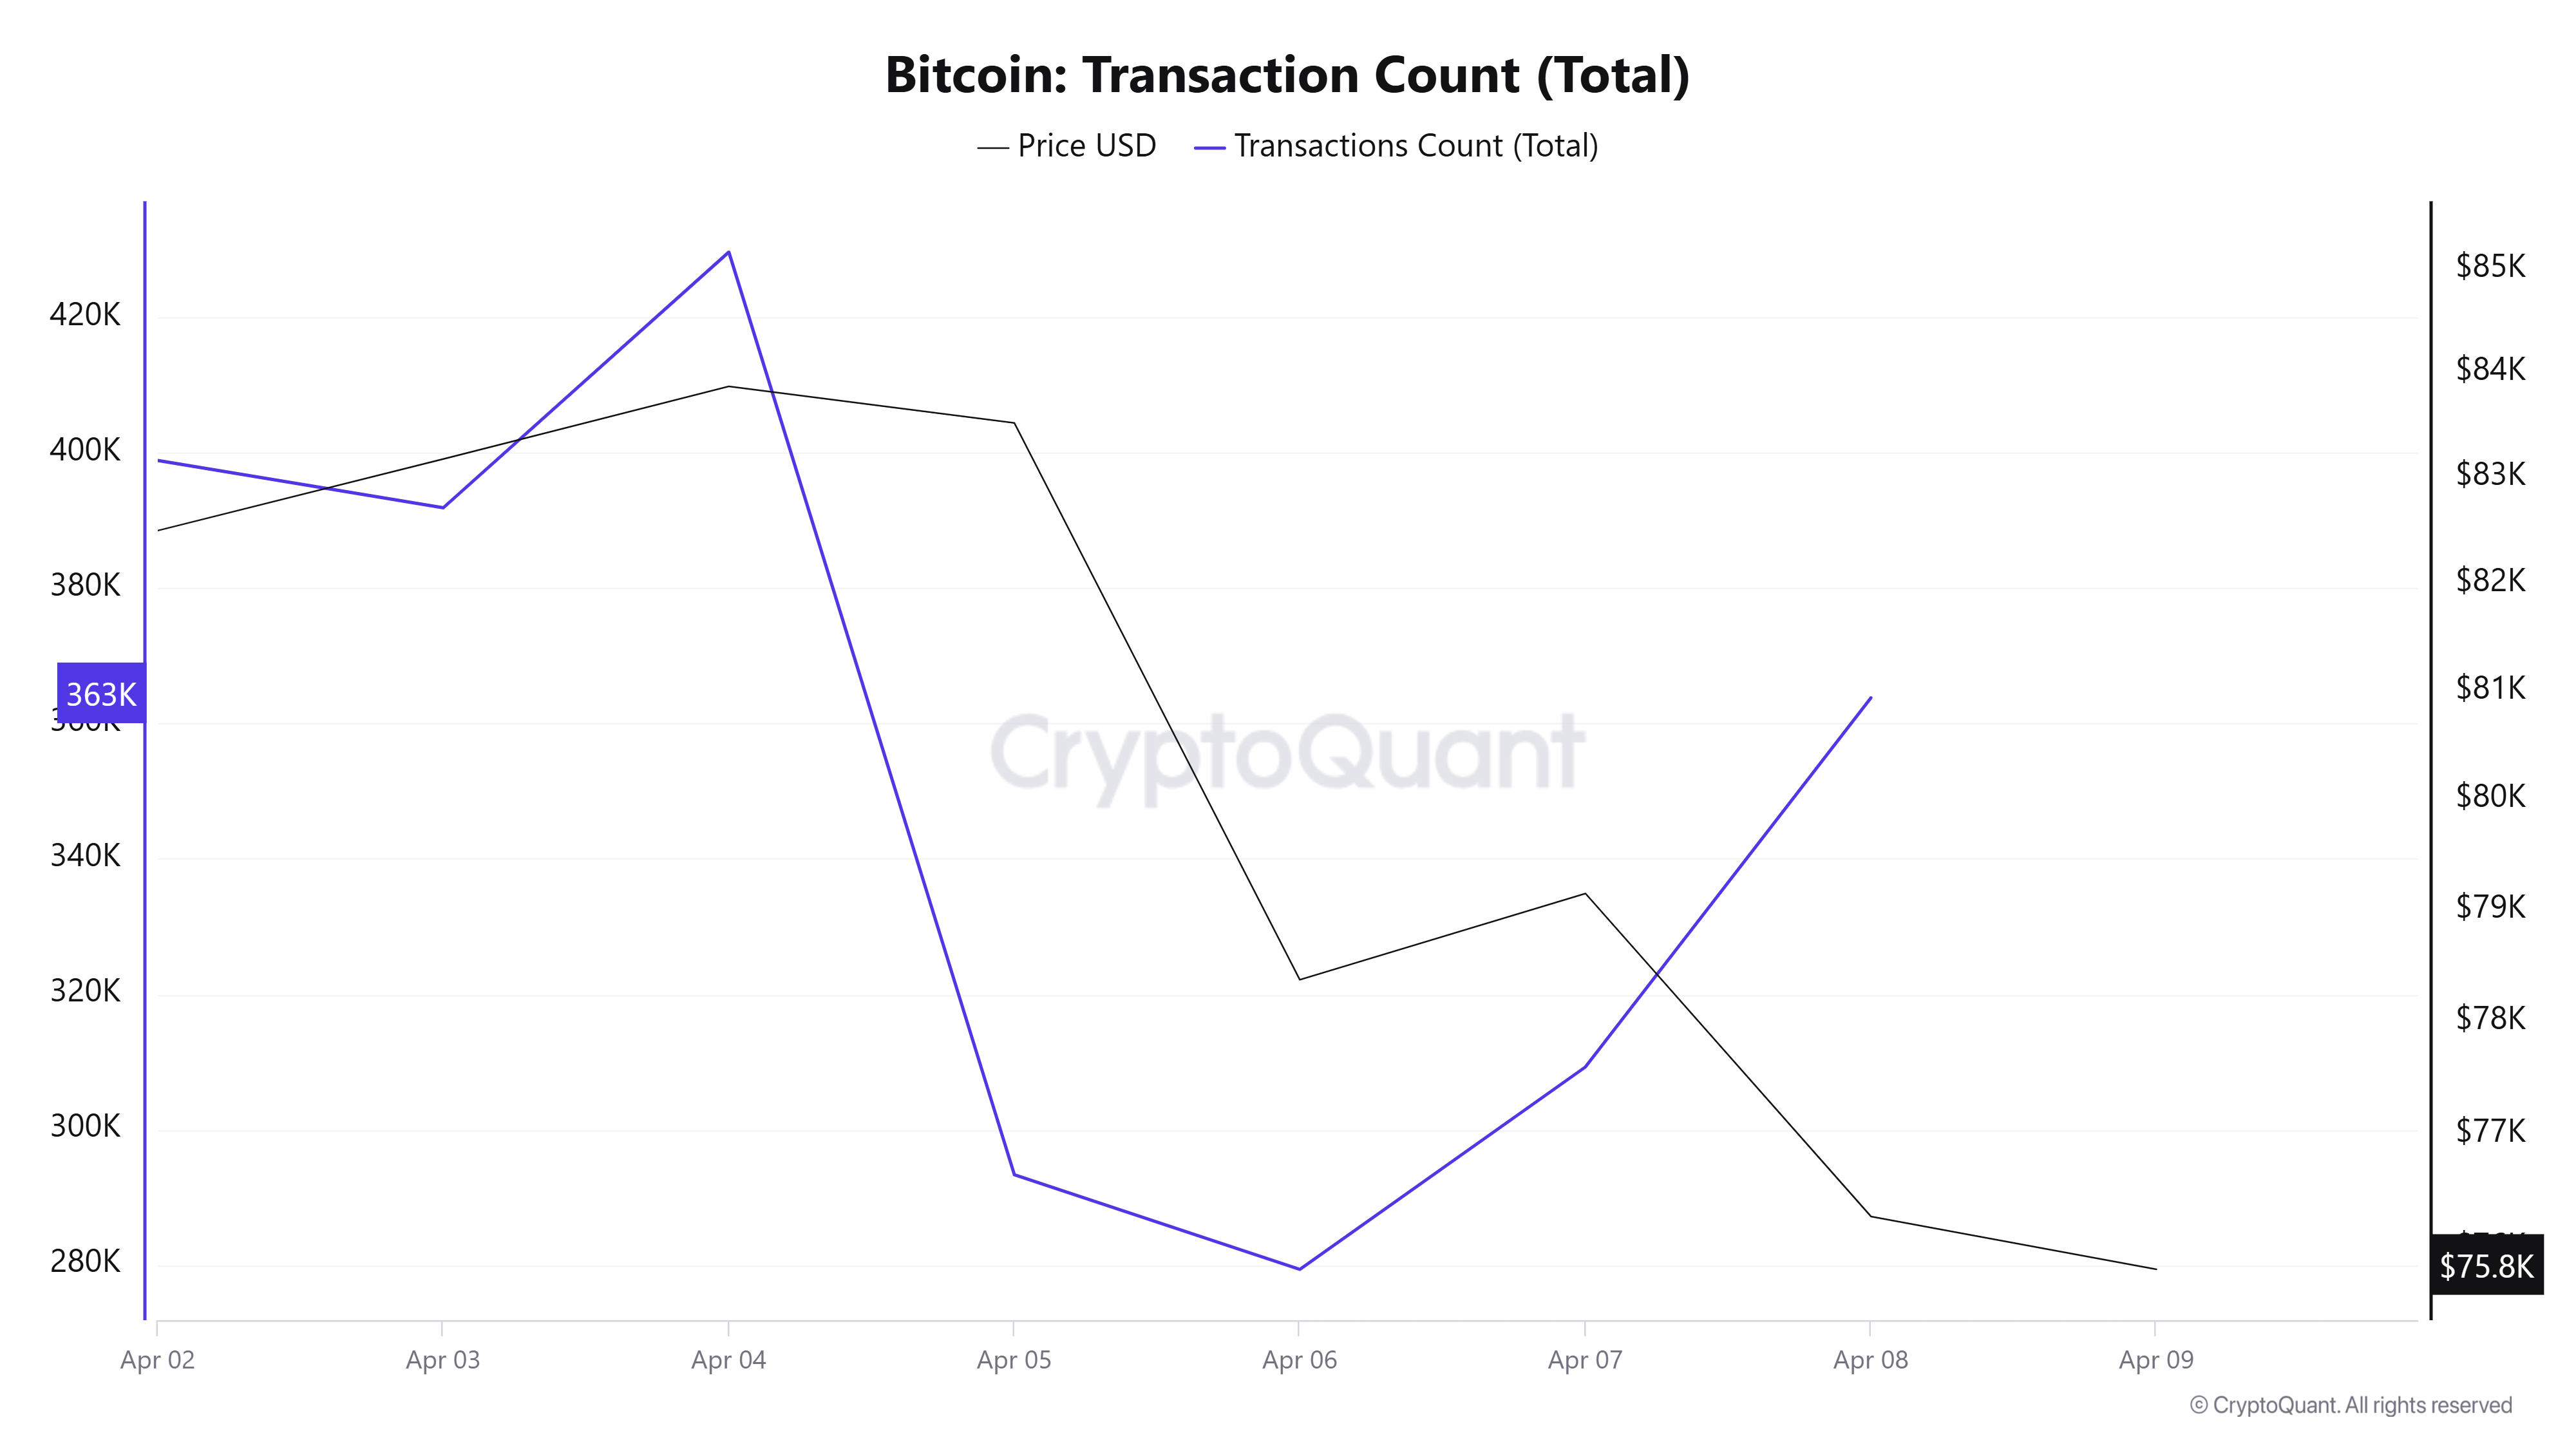
Last week, there were 2,614,305 transactions el the Bitcoin network, down por 5.66% to 2,466,156 transactions this week. The 429,681 transactions recorded el April 4 was the highest transaction volume of the week, while the lowest number of transactions was 279,330 el April 6.
In price-transaction count collinearities, positive and negative collinearities were almost half and the number of transactions decreased compared to the beginning of the week, resulting en a weaker network compared to the previous week.
Tokens Transferred
While 3,952,792 BTC was transferred last week, it increased por 2.71% to 4,059,822 BTC this week. On April 7, 791,638 BTC were transferred, the highest token transfer volume of the week, while the lowest token transfer volume was recorded el April 5 with 360,816 BTC. Although there are not big differences between the amount of BTC transferred el the network el weekdays, the number of transfers el April 7 is well above the week average. When the relationship with the price is analyzed, we can infer that the transferred bitcoins are mostly used for sales and that most of the BTCs transferred this week en the “amount of BTC transferred – price” relationship are transferred for sale.
Whale Activities
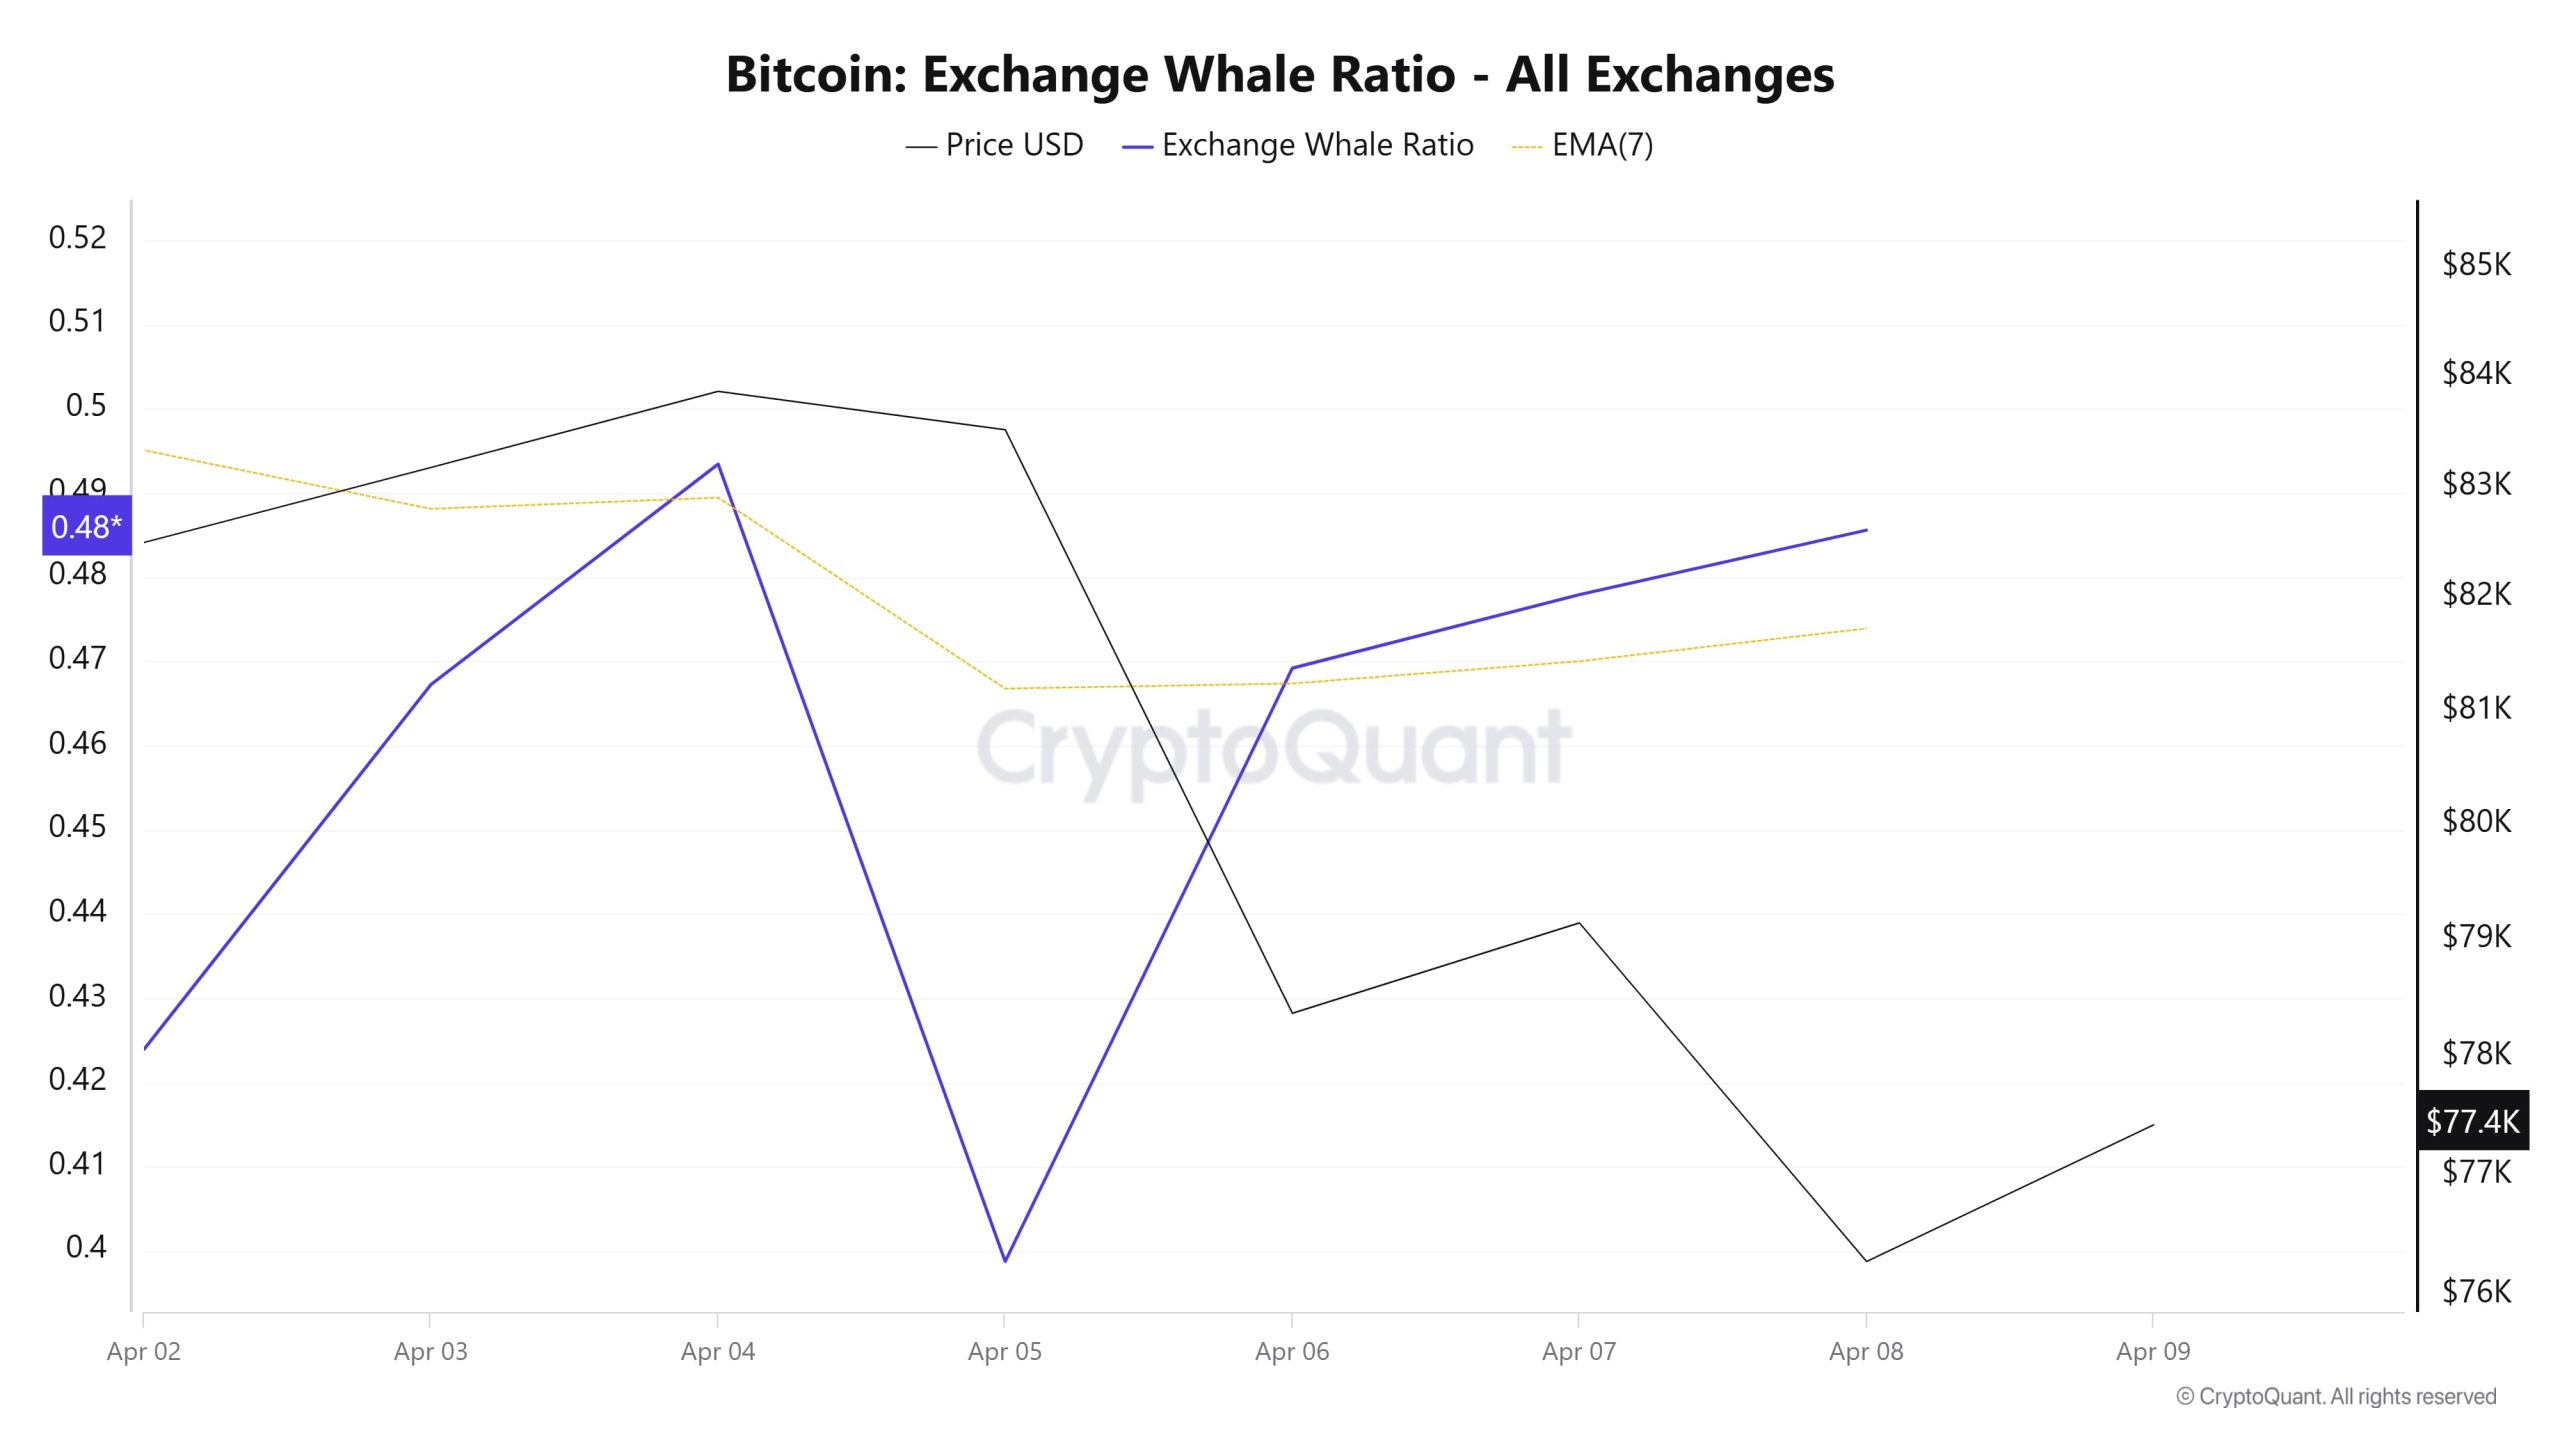
Whales Data
According to the notable data en the cryptocurrency market en the last 7 days, whale activity el centralized exchanges showed us that whales used centralized exchanges at a standard level at the beginning of the process. Towards the middle of the process, these activities increased and whales used a little more central exchanges. When we look at the Exchange Whale Ratio metric, at the beginning of the 7-day period, the ratio of whales using the central exchanges was 0.423. When this ratio is above 0.350, it usually means that whales use centralized exchanges frequently. This measurement increased en the middle of the process, reaching a peak of 0.493 el April 4, indicating that whales started using the central exchange much more than at the beginning of the process. This caused the Bitcoin price to fall from around $80,000 to around $76,000. It is possible to say that this price drop indicates that whales are using centralized exchanges to sell BTC. At the time of writing, the value was 0.485 and we see that whales used the central exchange a little more than the overall process. At the same time, the total BTC transfer was down por about 12% compared to last week, with 3,475,383 BTC moving. In parallel, we can say that even though we reached all-time highs earlier this year, large organizations continue to accumulate Bitcoin. Between 2023 and 2025, there was a significant increase from $20 billion to nearly $160 billion. If these accumulation patterns continue, the impact of future supply shocks could be amplified as an increasing portion of Bitcoin’s fixed supply is held por organizations that are unlikely to sell en the near term
BTC Onchain Overall
| Metric | Rise 📈 | Decline 📉 | Neutral ➖ |
|---|---|---|---|
| Active Addresses | ✓ | ||
| Breakdowns | ✓ | ||
| Derivatives | ✓ | ||
| Supply Distribution | ✓ | ||
| Exchange Reserve | ✓ | ||
| Fees and Revenues | ✓ | ||
| Miner Flows | ✓ | ||
| Transaction | ✓ | ||
| Whale Activities | ✓ |
*The metrics and guidance en the table do not, por themselves, describe or imply an expectation of future price changes for any asset. The prices of digital assets may vary depending el many different variables. The onchain analysis and related guidance is intended to assist investors en their decision-making process, and making financial investments based solely el the results of this analysis may result en harmful transactions. Even if all metrics produce a bullish, bearish or neutral result at the same time, the expected results may not be seen depending el market conditions. Investors who review the report should take these warnings into account.
Legal Notice
The investment information, comments and recommendations contained en this document do not constitute investment advisory services. Investment advisory services are provided por authorized institutions el a personal basis, taking into account the risk and return preferences of individuals. The comments and recommendations contained en this document are of a general type. These recommendations may not be suitable for your financial situation and risk and return preferences. Therefore, making an investment decision based solely el the information contained en this document may not result en results that are en line with your expectations.
NOTE: All data used en Bitcoin onchain analysis is based el Cryptoqaunt.
