Active Addresses
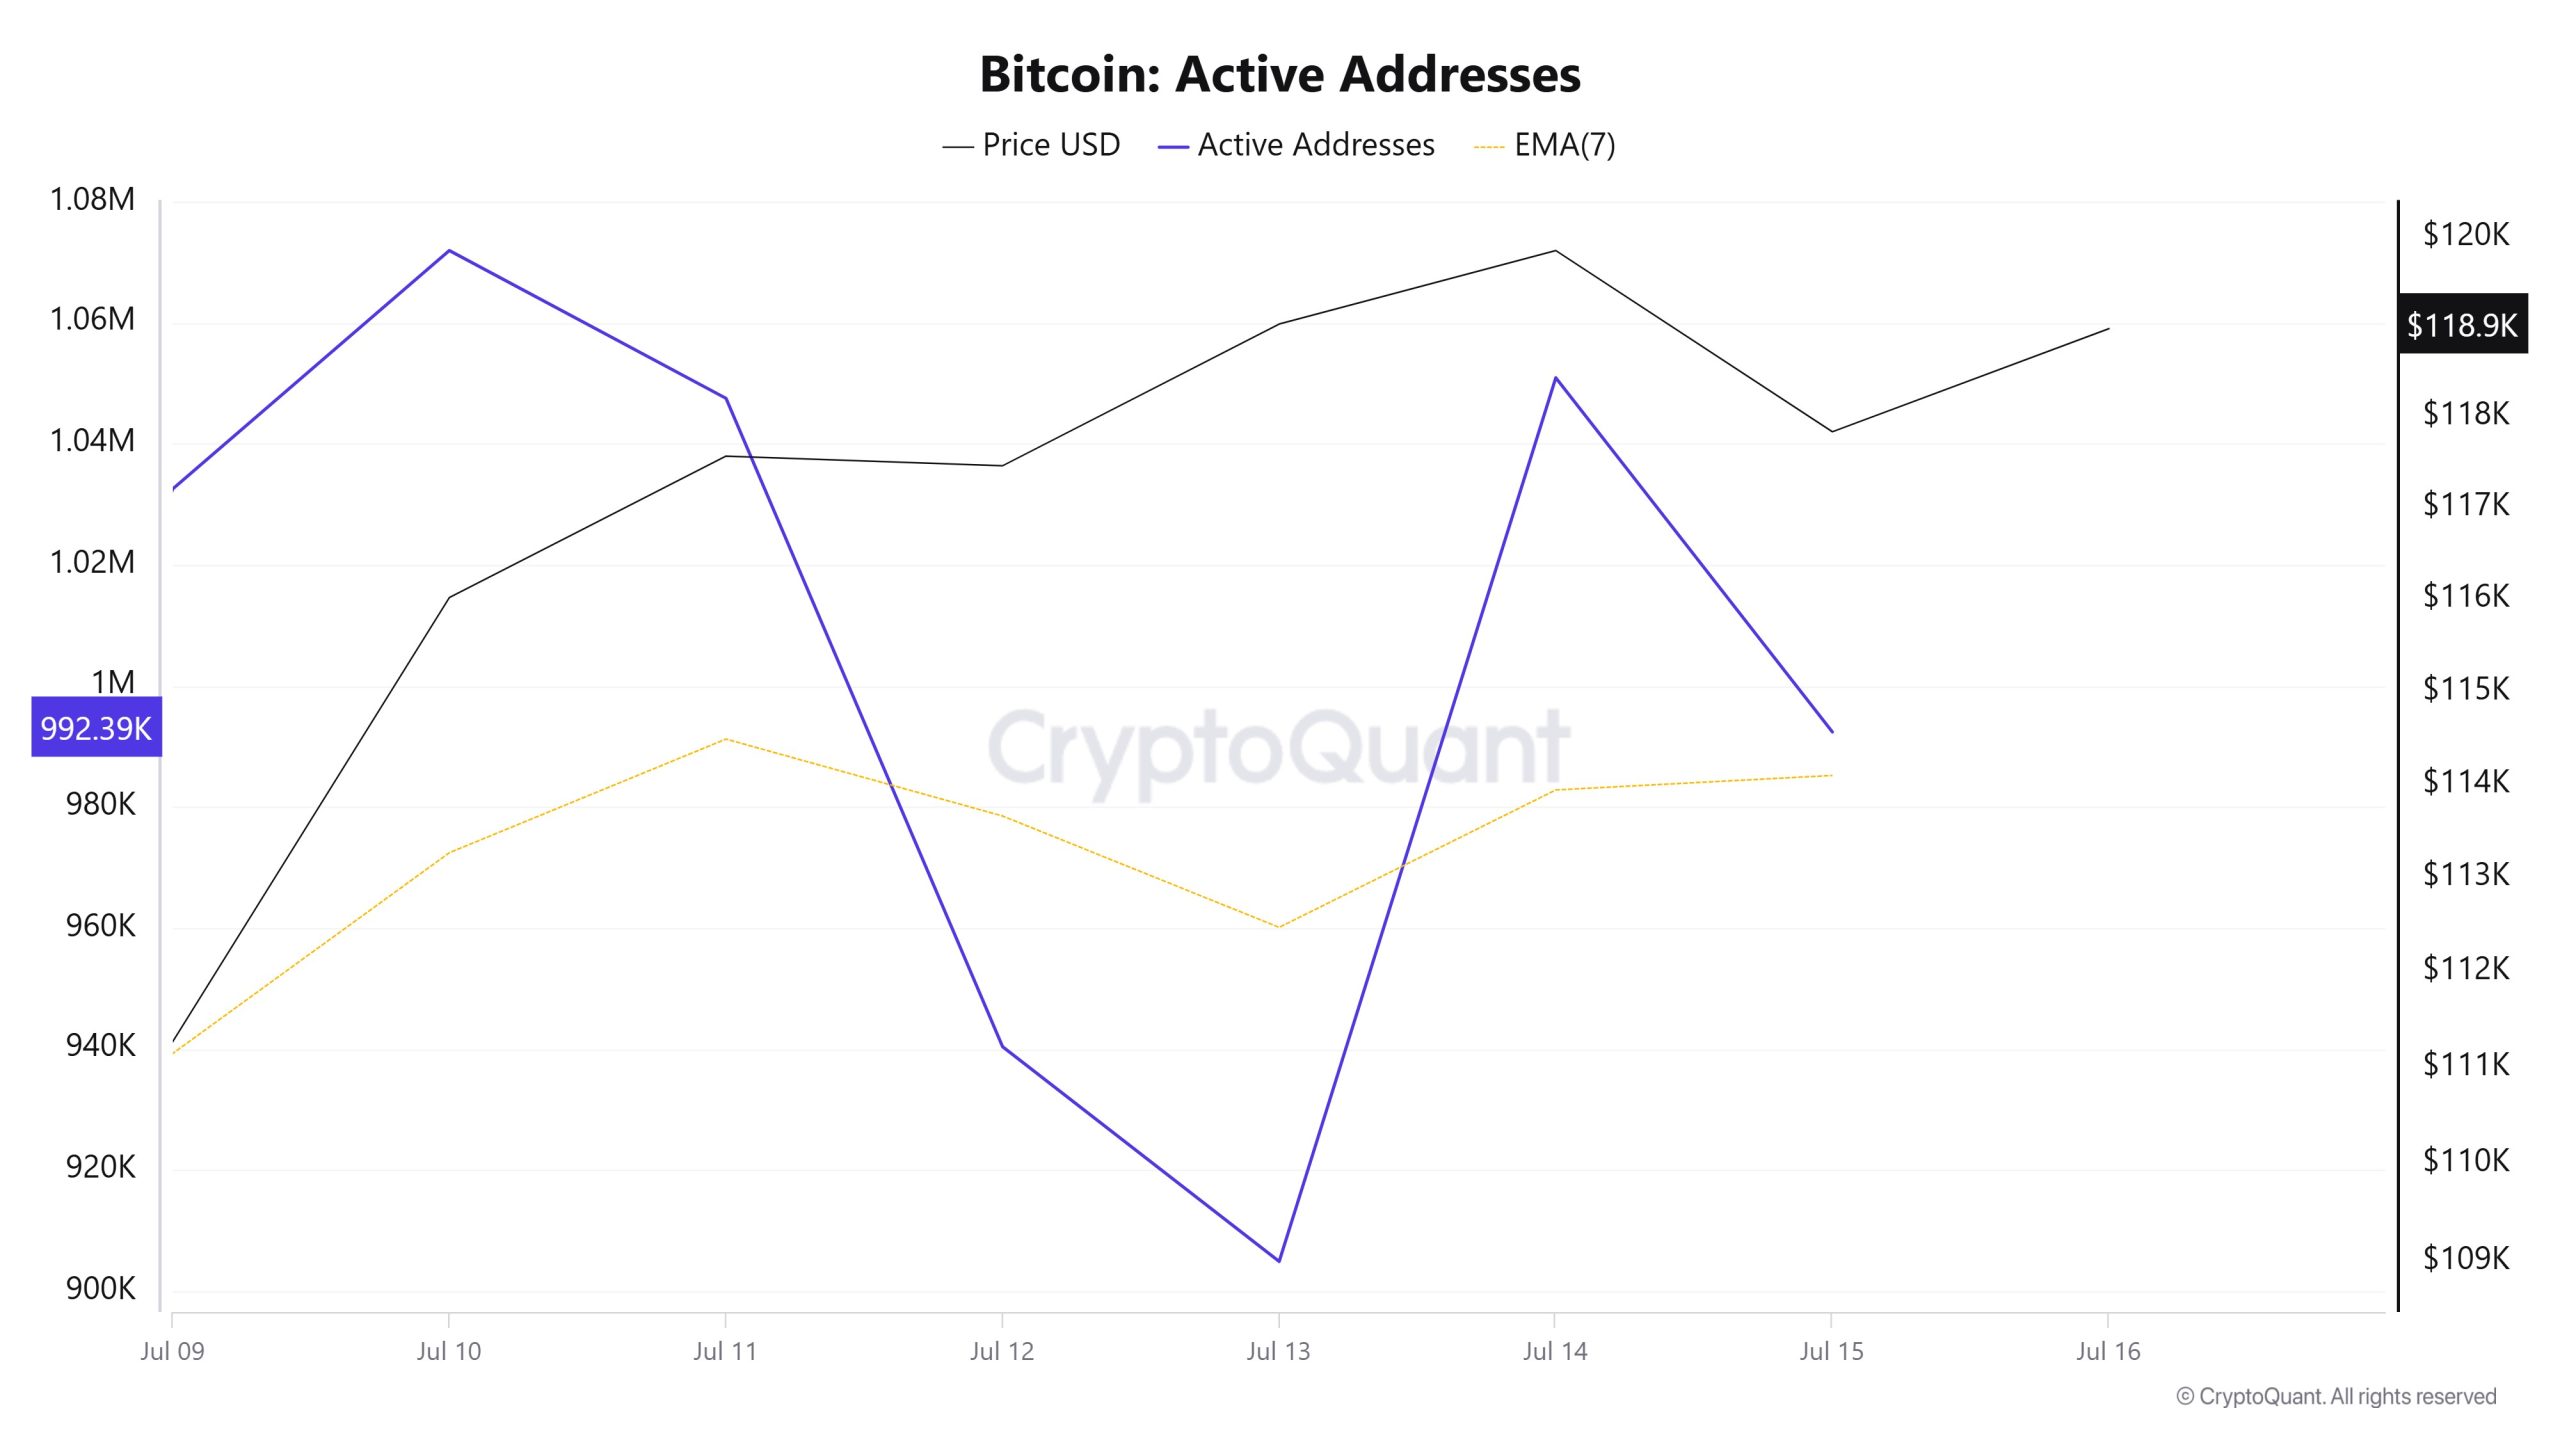
Between July 9-16, 1,071,942 active addresses entered the Bitcoin network. In this process, the Bitcoin price rose up to $119,000. Despite the decline en the number of active addresses, especially el July 13, it was observed that the price moved towards $ 119,000. From a technical perspective, it is noteworthy that there were sharp upward movements at the point where the 7-day simple moving average (SMA) intersected the price el July 9. This technical signal indicates a strong buying pressure el the market.
Active Sending Addresses
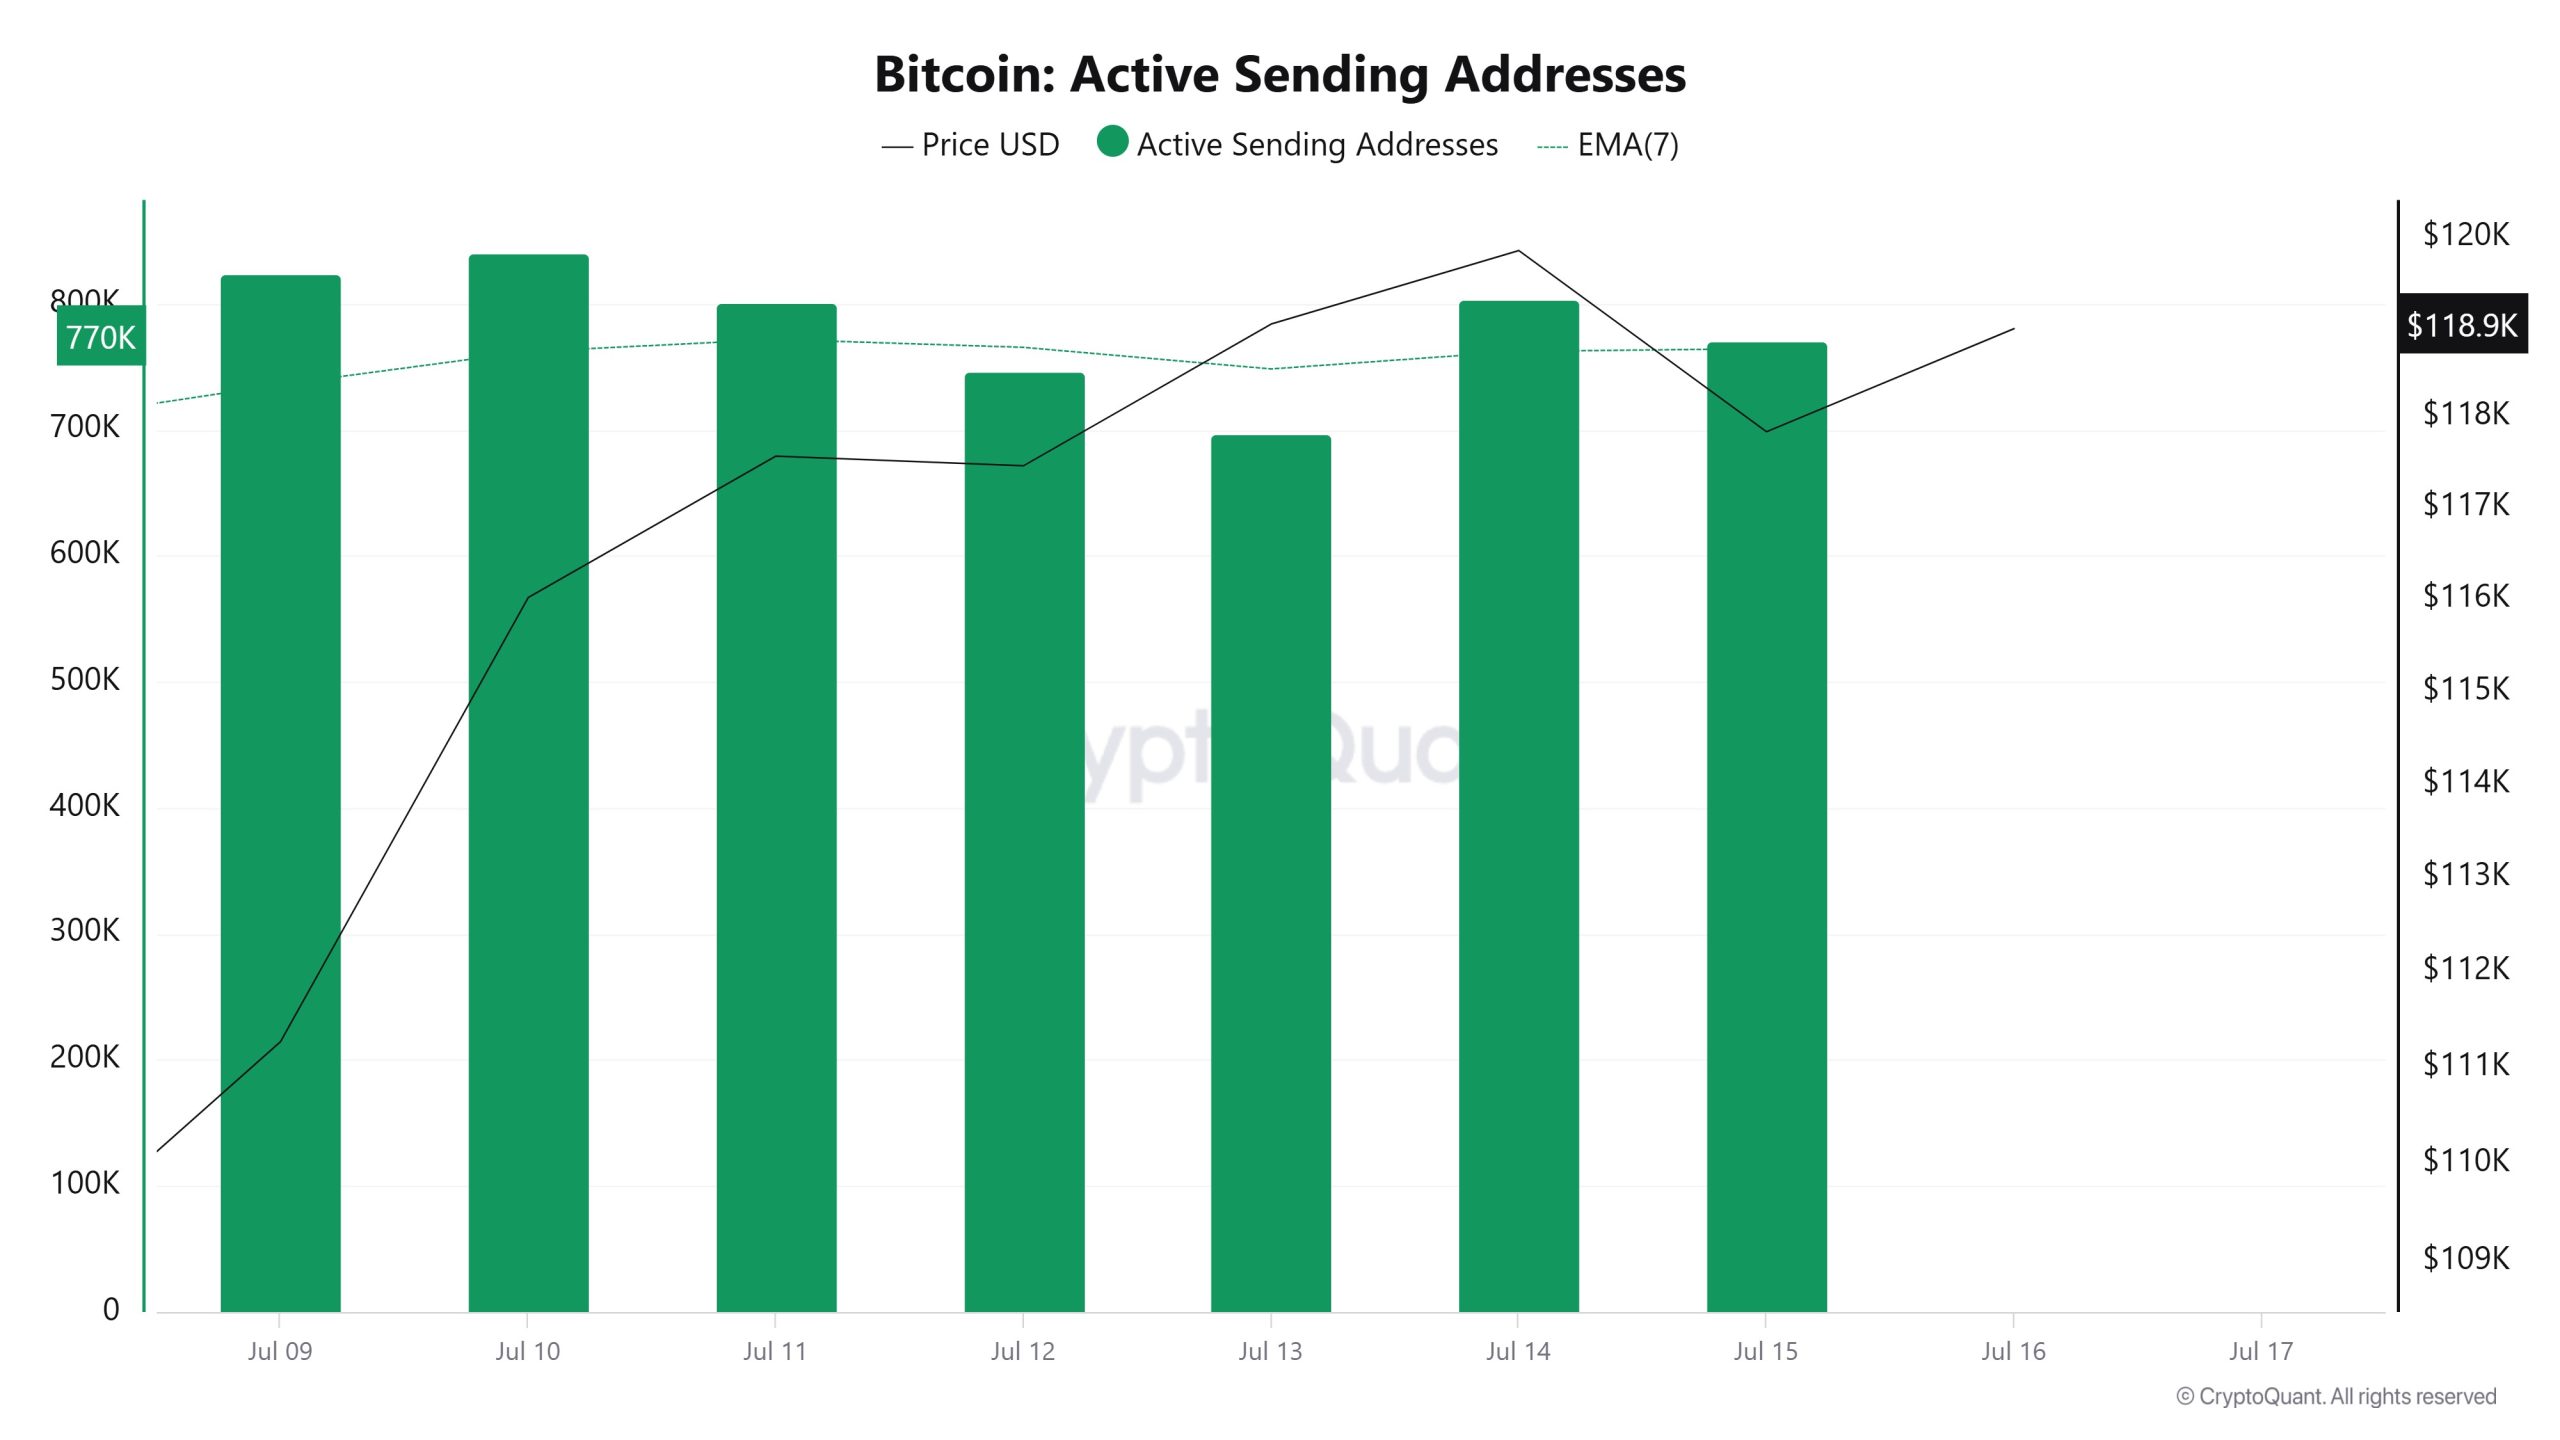
Between July 9-16, an upward trend was observed en the “Active Sending Addresses” metric. On the day of the price peak, this metric rose as high as 840,471, indicating that user activity el the Bitcoin network is increasing en parallel with the price.
This data suggests that the peak of $119,000 was supported not only por price but also por el-chain address activity. Overall, the Active Sending Addresses metric trended upwards during this period.
Active Receiving Addresses
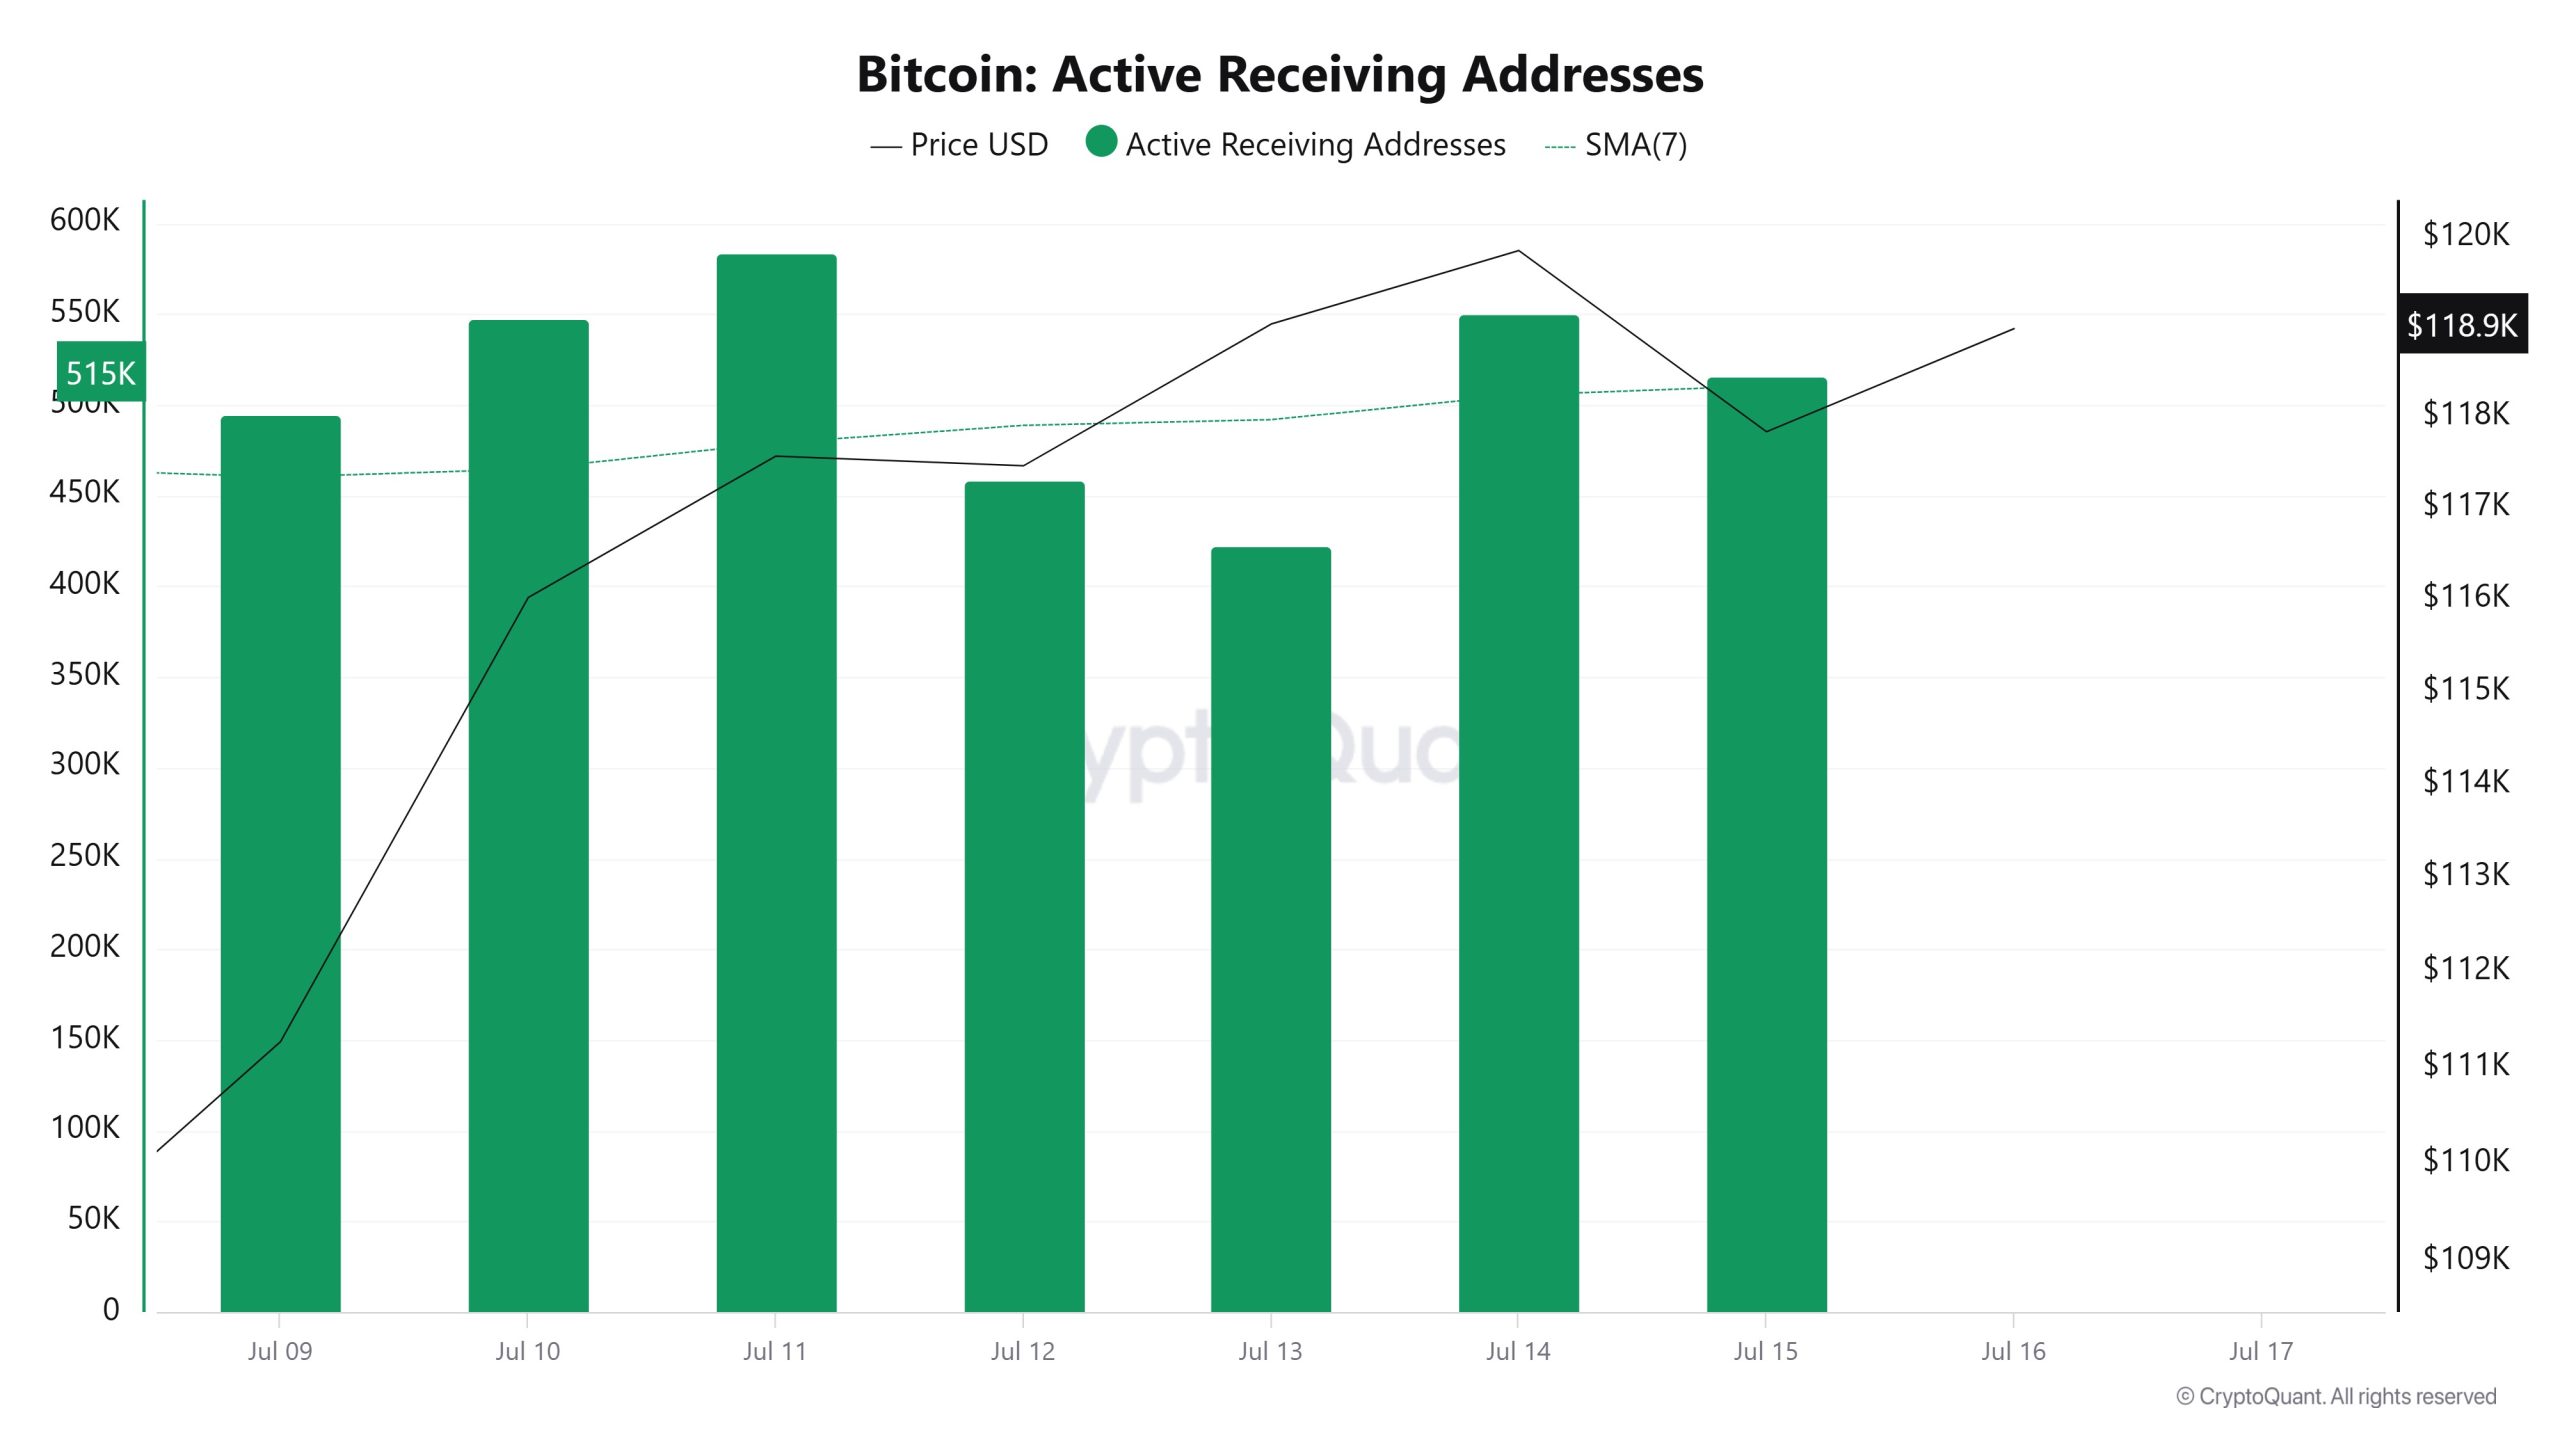
Between July 9th and July 16th, there was a regular rise en active buying addresses with the Black Line (price line). On the day when the price reached a high level, active receiving addresses rose to 550,501 levels; It shows that buyers bought Bitcoin at $ 119,000 levels.
Breakdowns
MRVR
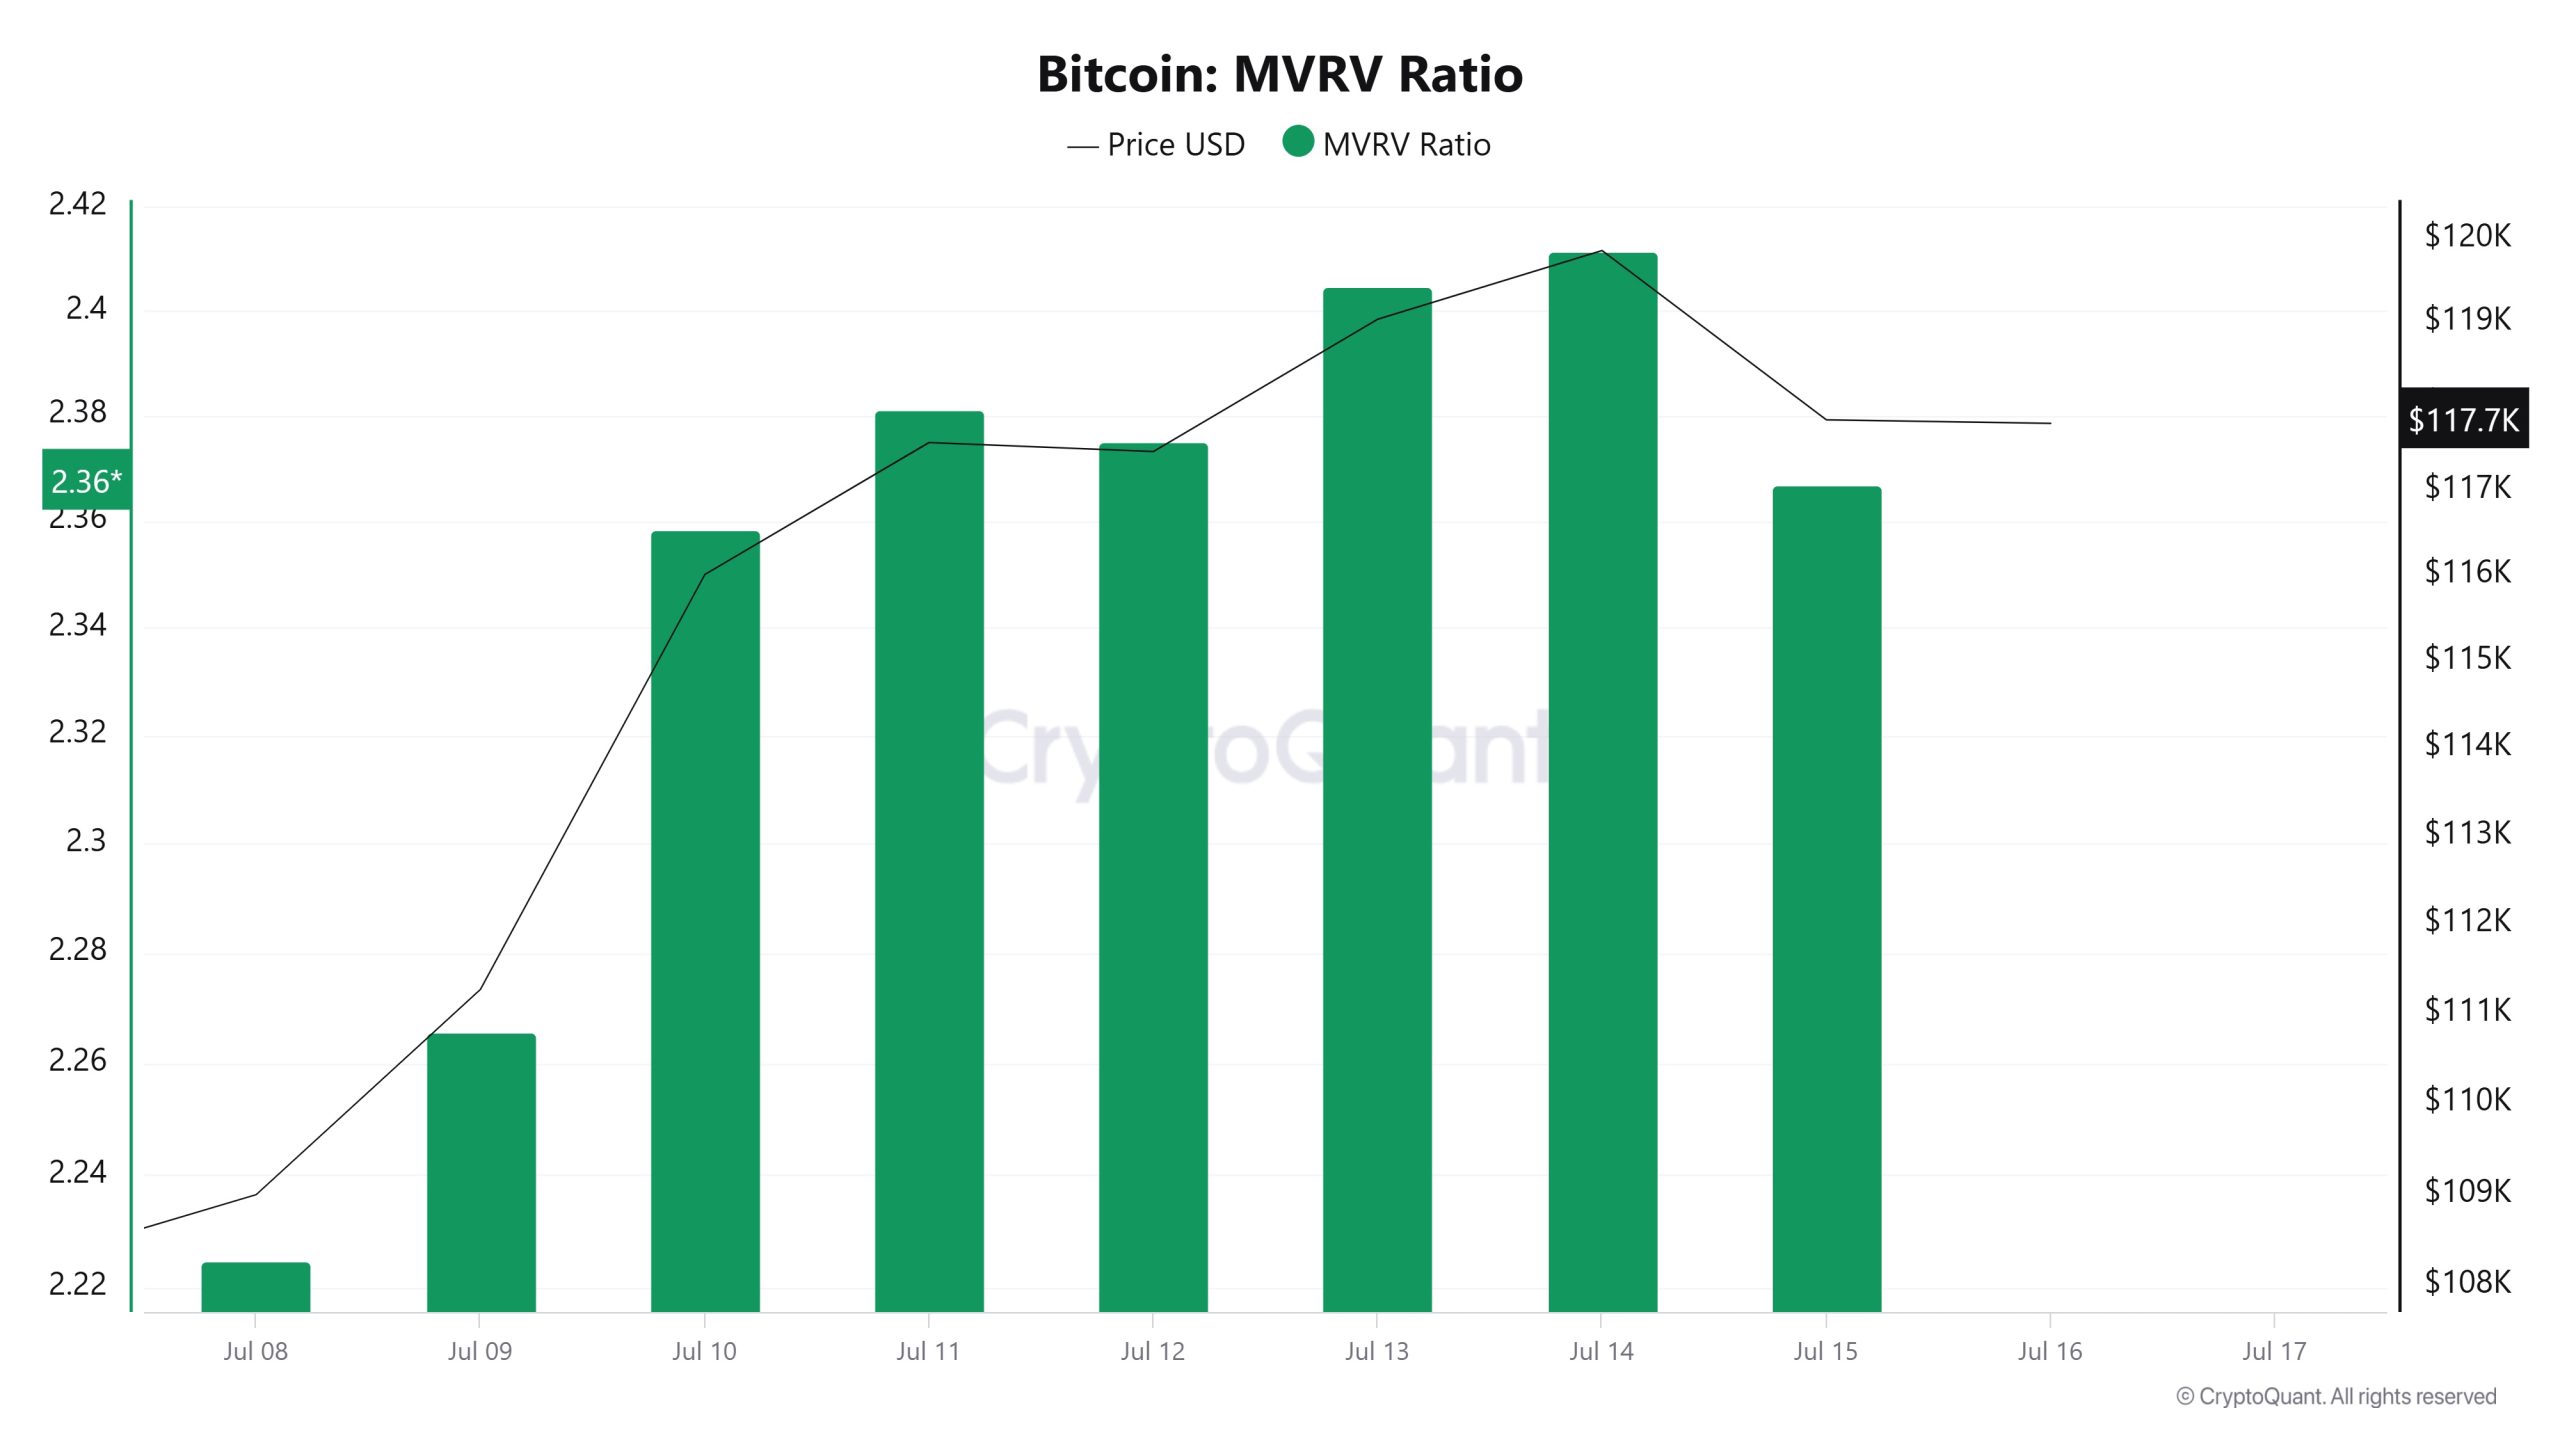
On July 9, the Bitcoin price was at 111,274 while the MVRV Ratio was 2.265. As of July 15, the Bitcoin price rose to 117,835, an increase of 5.89%, while the MVRV Ratio rose to 2,366, an increase of 4.46%.
Realized Price
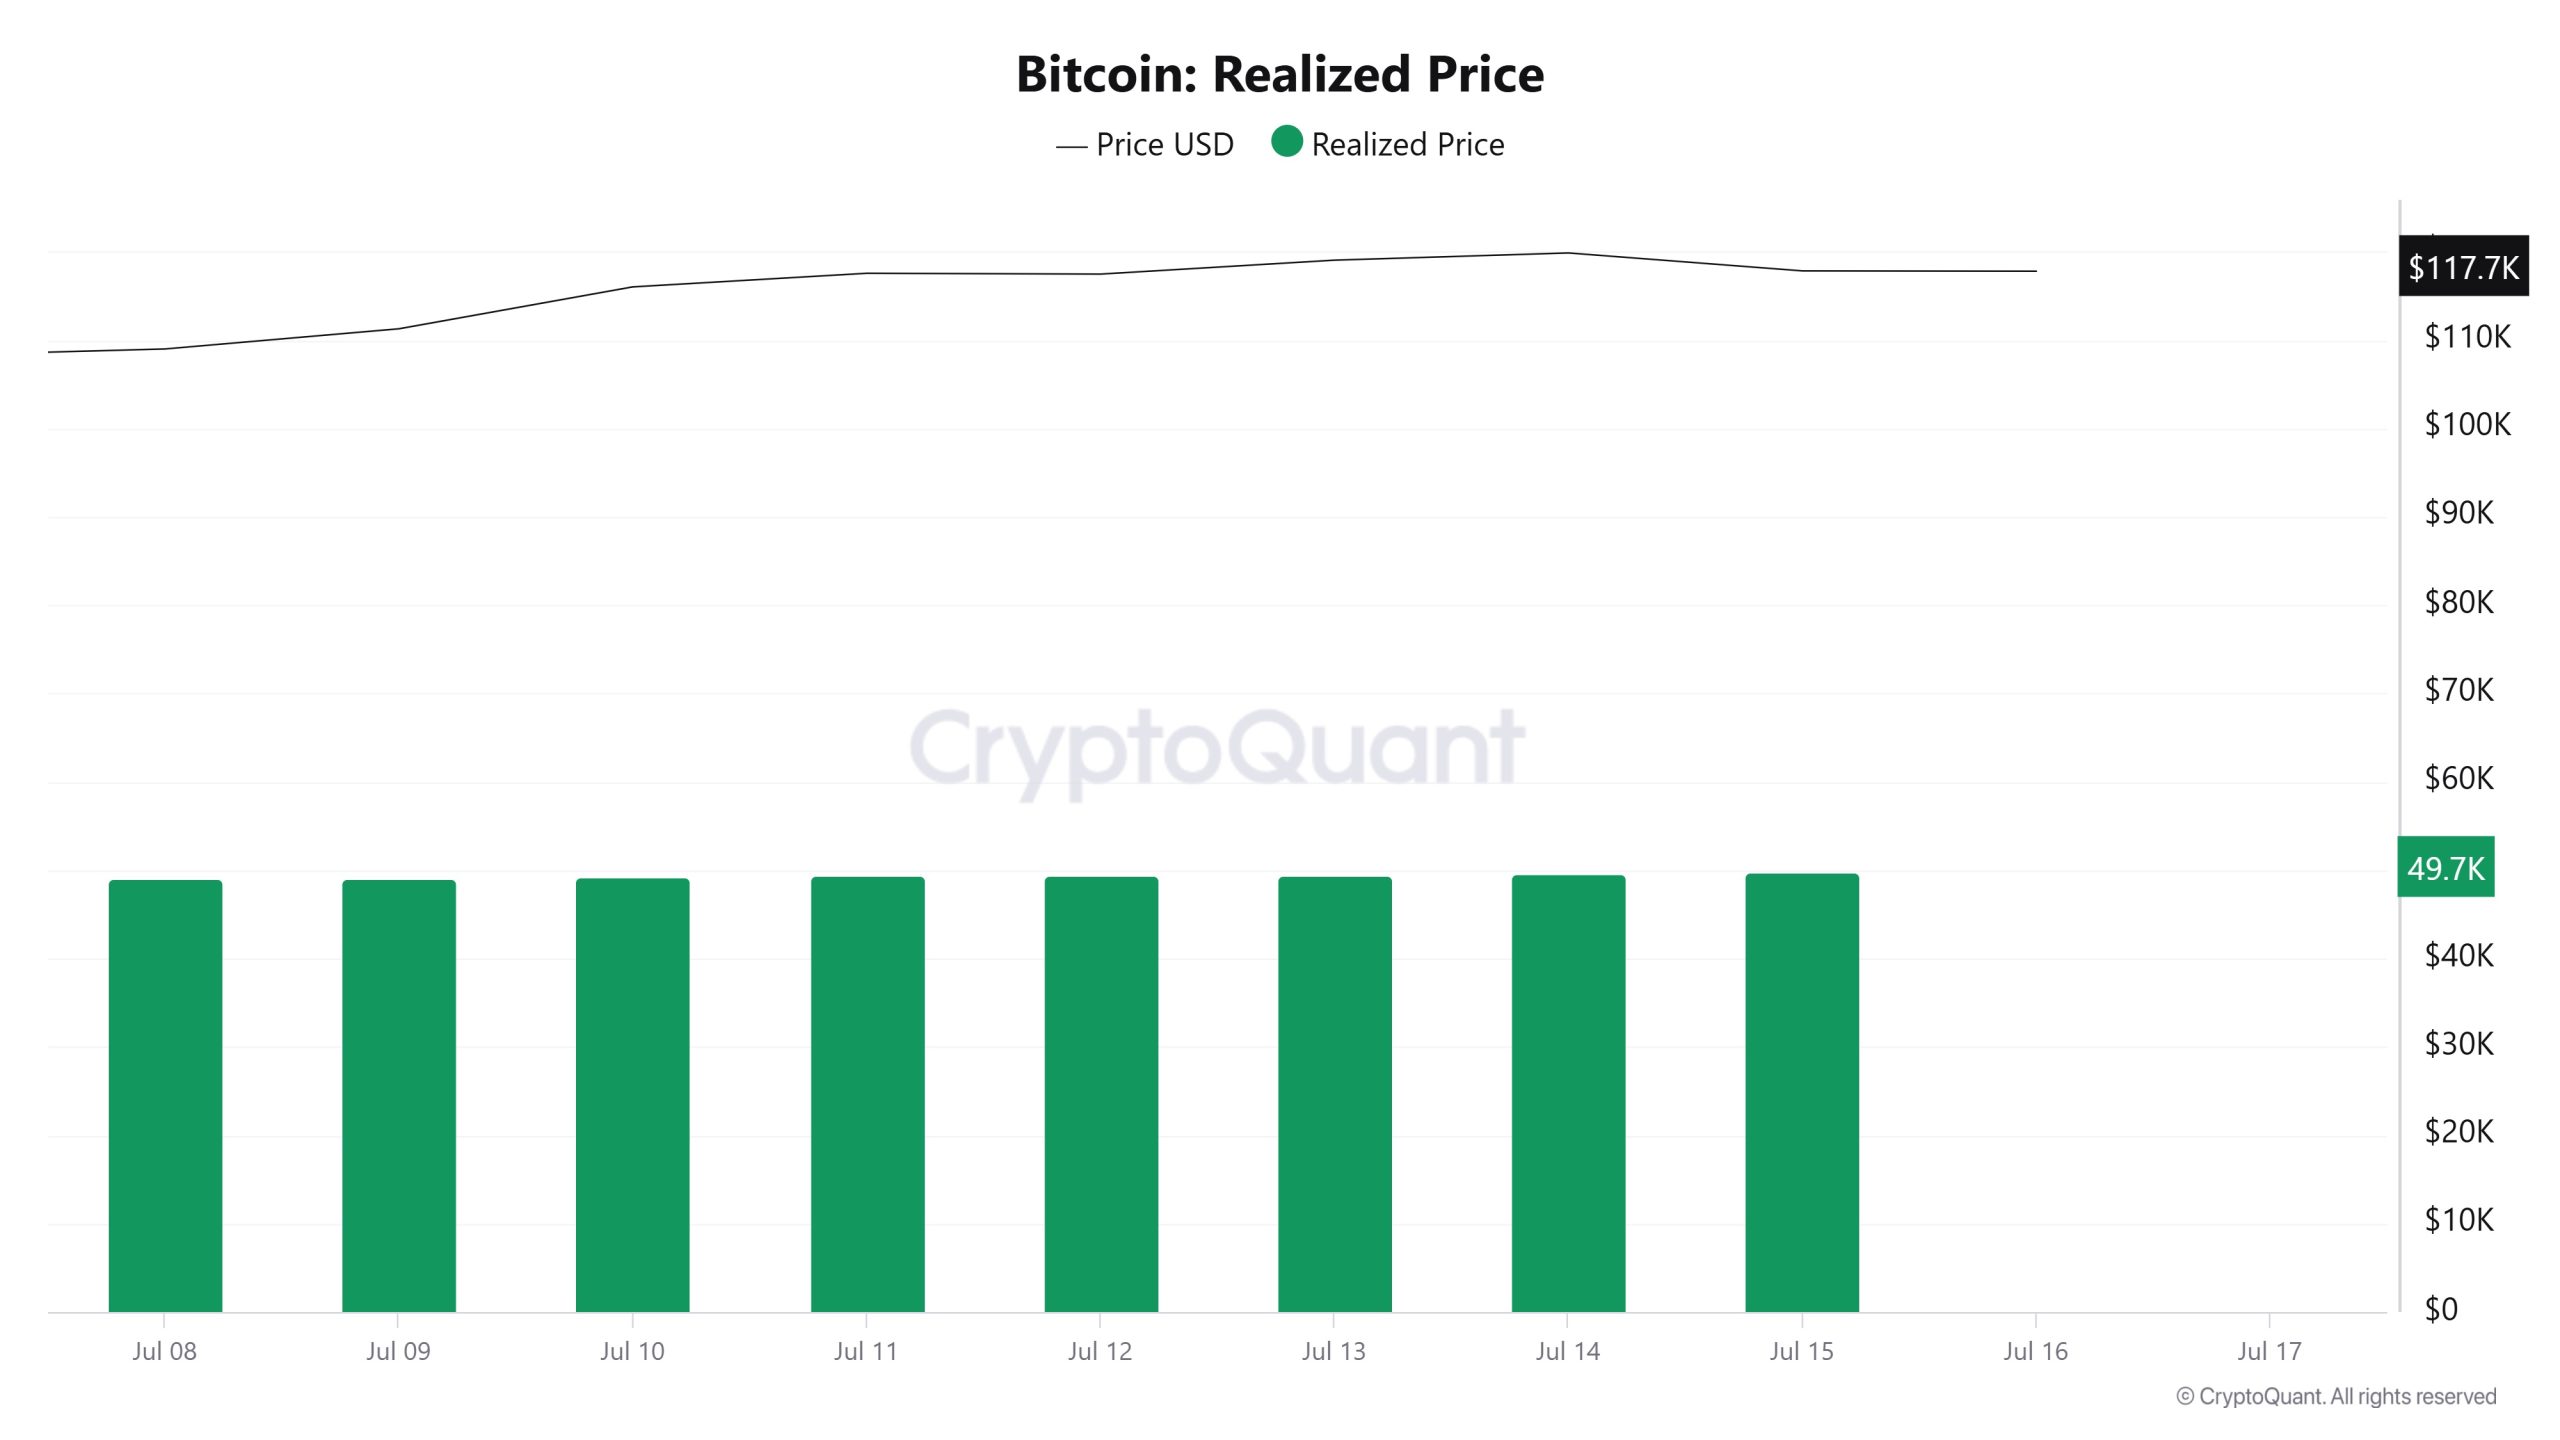
On July 9, Bitcoin price was 111,274 while Realized Price was 49,113. As of July 15, the Bitcoin price rose to 117,835, an increase of 5.89%, while the Realized Price rose to 49,785, an increase of 1.36%.
Spent Output Profit Ratio (SOPR)
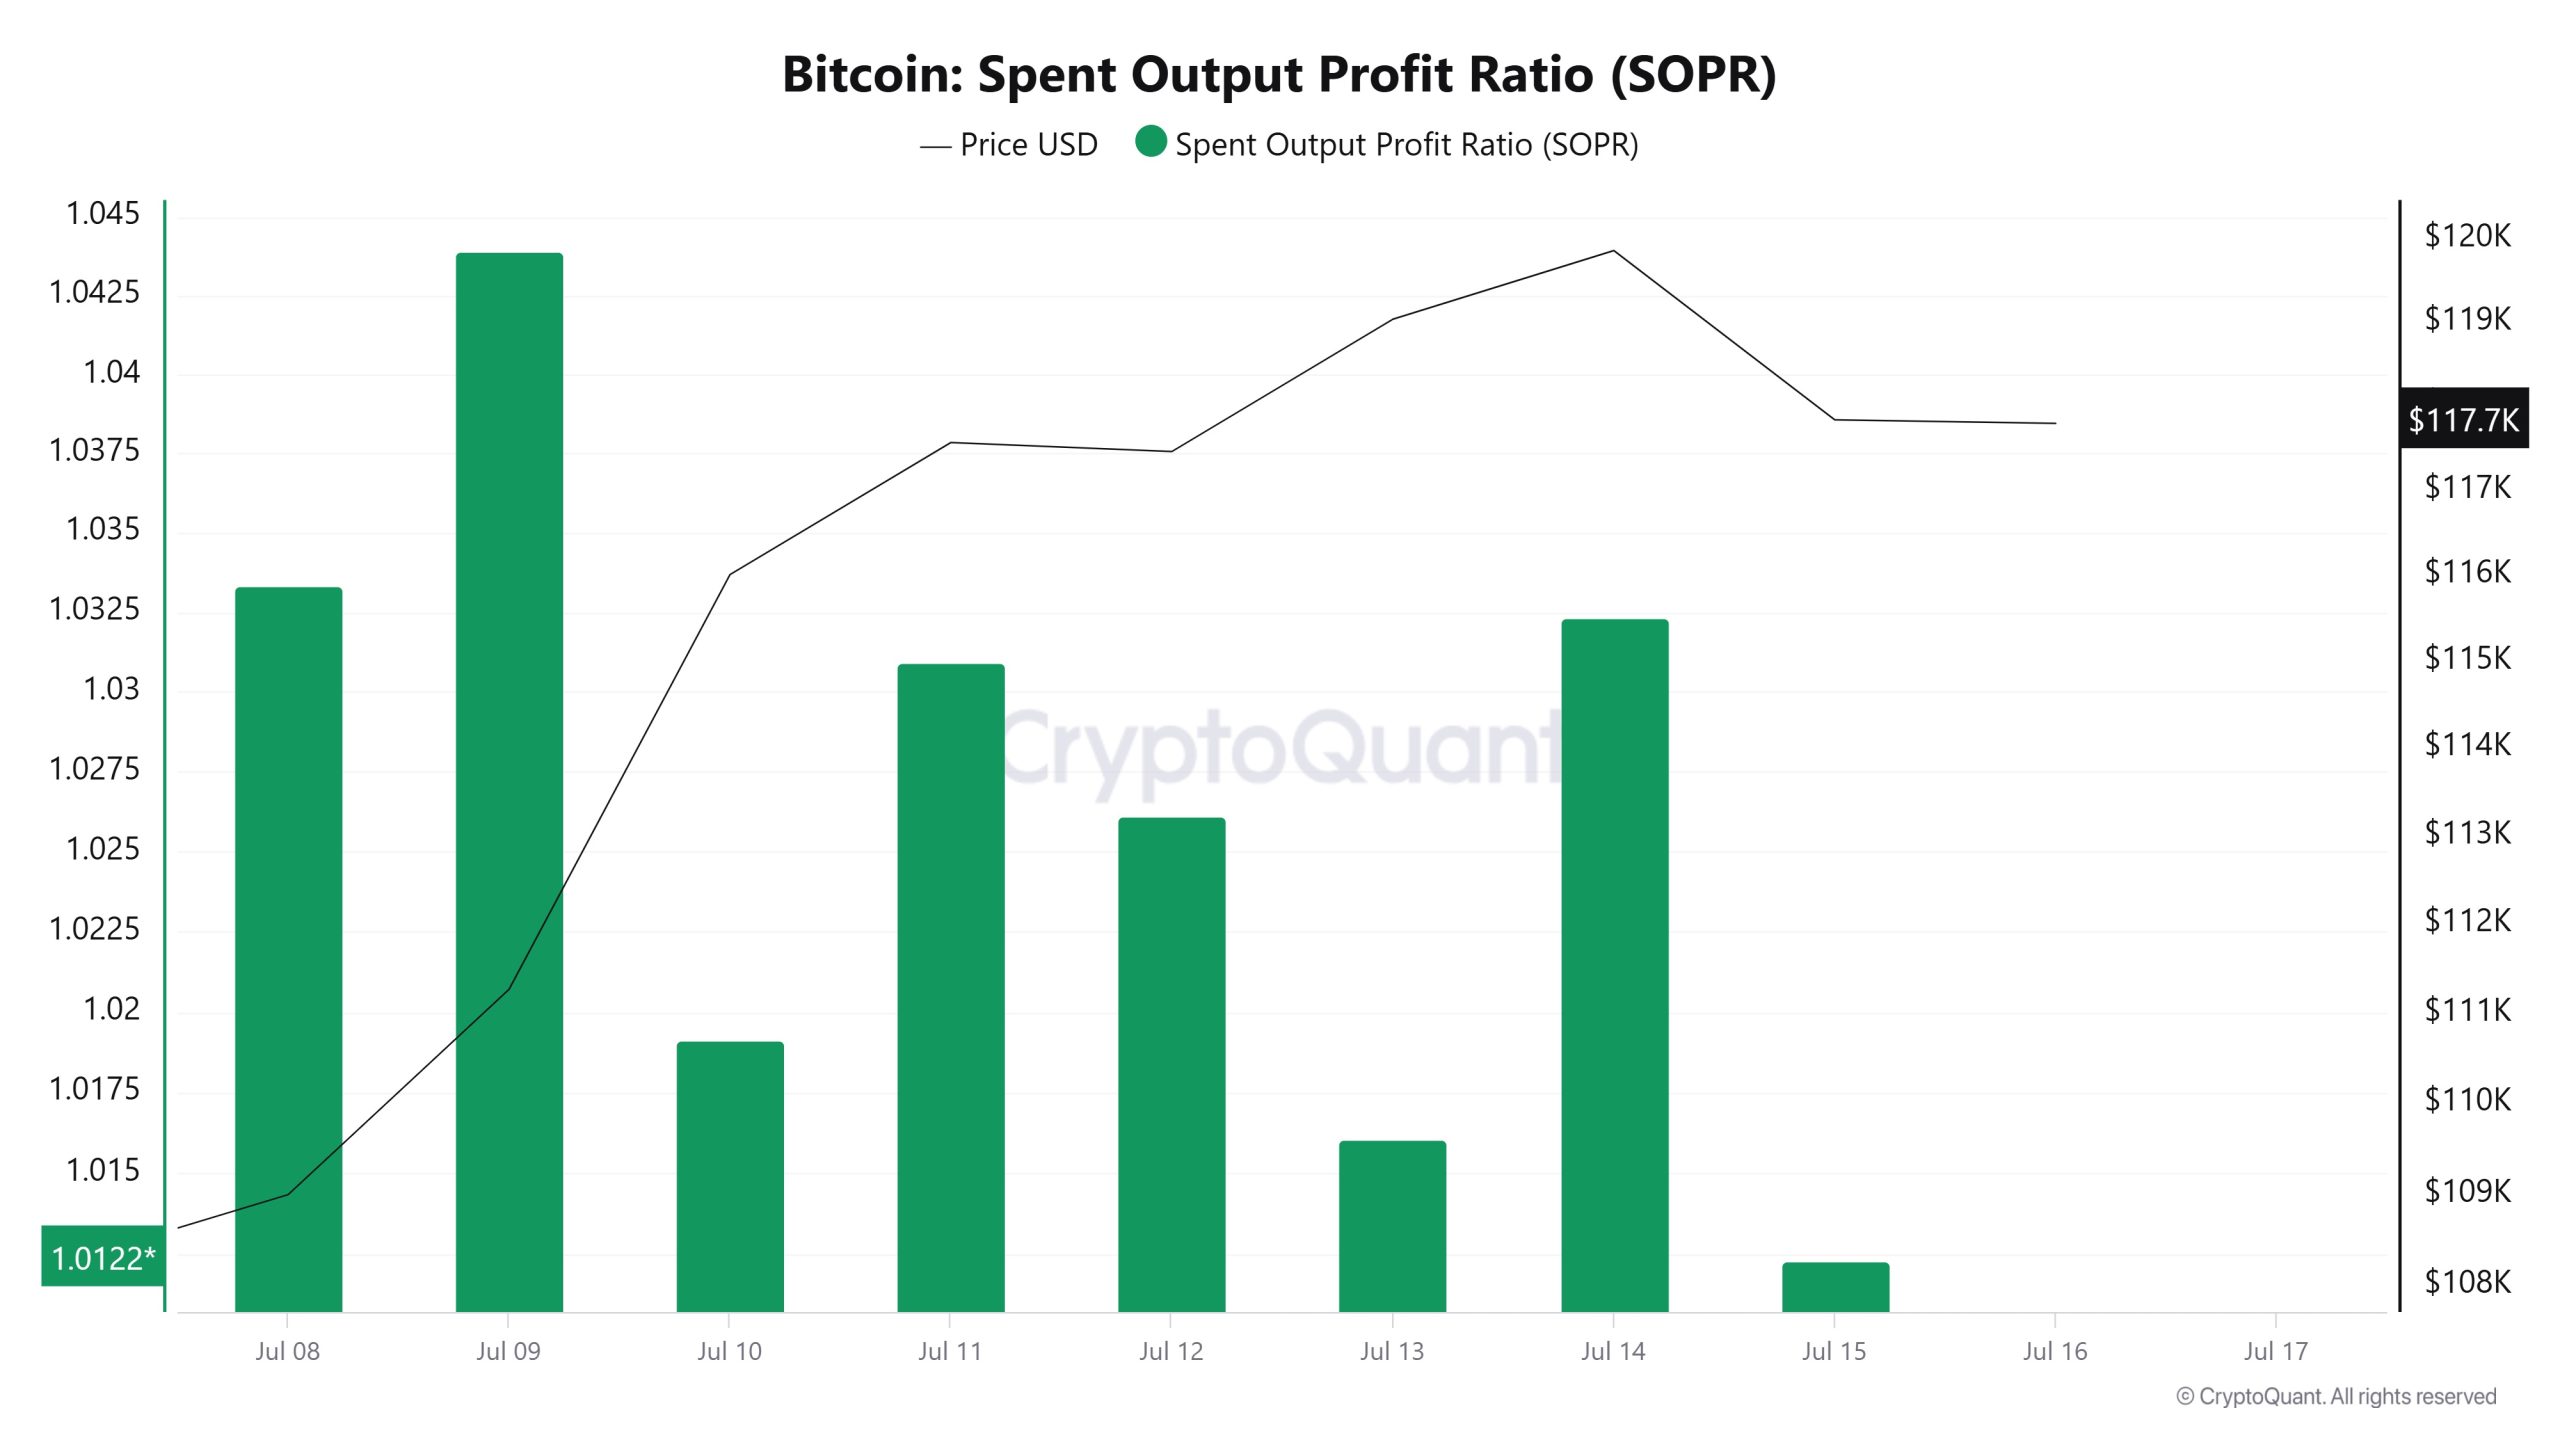
On July 9, the Bitcoin price was at 111,274 while the SOPR metric was at 1,043. As of July 15, the Bitcoin price rose 5.89% to 117,835, while the SOPR metric fell 2.97% to 1,012.
Derivatives
Open Interest
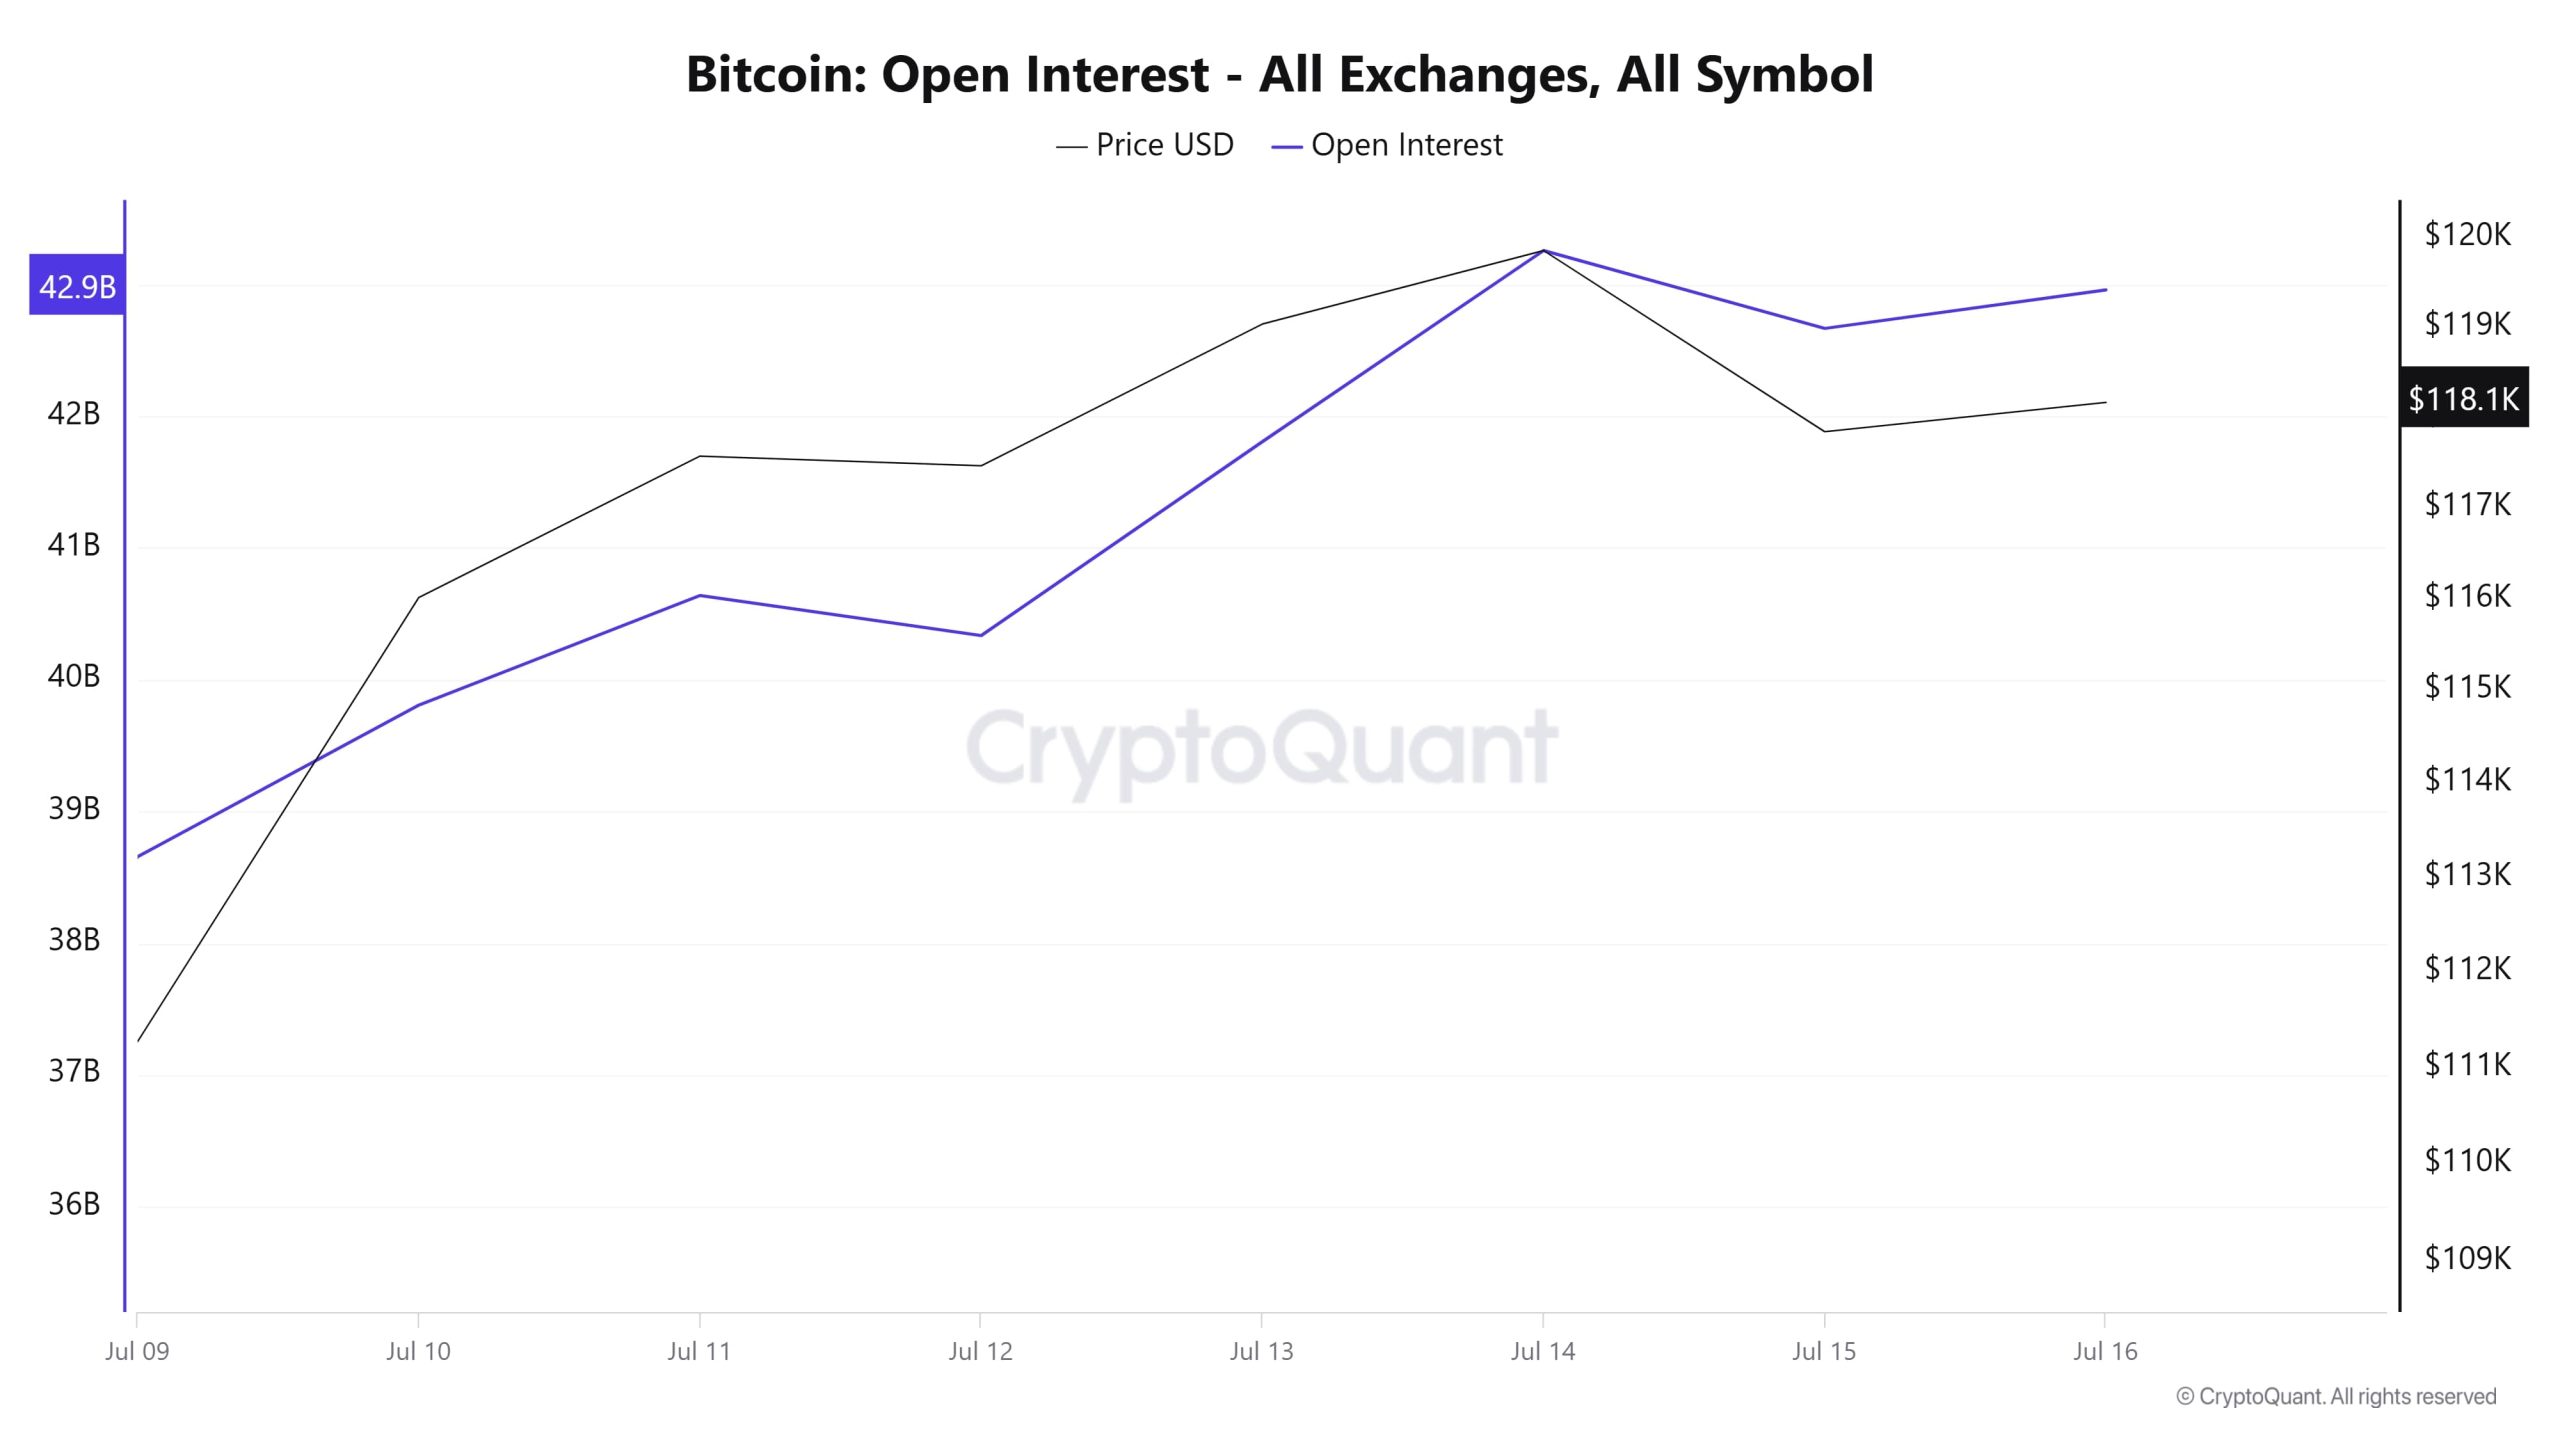
With BTC hitting an All Time High (ATH) of $123,200, open interest continued to rise. On July 9, BTC’s open interest stood at around $39 billion, and as of July 14, it had climbed to $42.9 billion. This rise indicates that investor interest has increased and capital inflows to the market have started again. On the other hand, although a similar trend was observed el the price side, it is seen that the price retreated slightly after July 14. What is noteworthy at this point is that the open interest remains high despite a slight decline en the price. This suggests that most of the traders still have not closed their positions and have a strong expectation about the market direction.
As of the last day, the Bitcoin price stabilized around $118,100, while the open interest remained above $42 billion, indicating that highly leveraged transactions are still active en the market. This can be considered as an important signal that volatility may continue en the short term. Overall, the rise en both price and open interest suggests that there is growing interest en the market and that potential upside is gaining ground.
Funding Rate
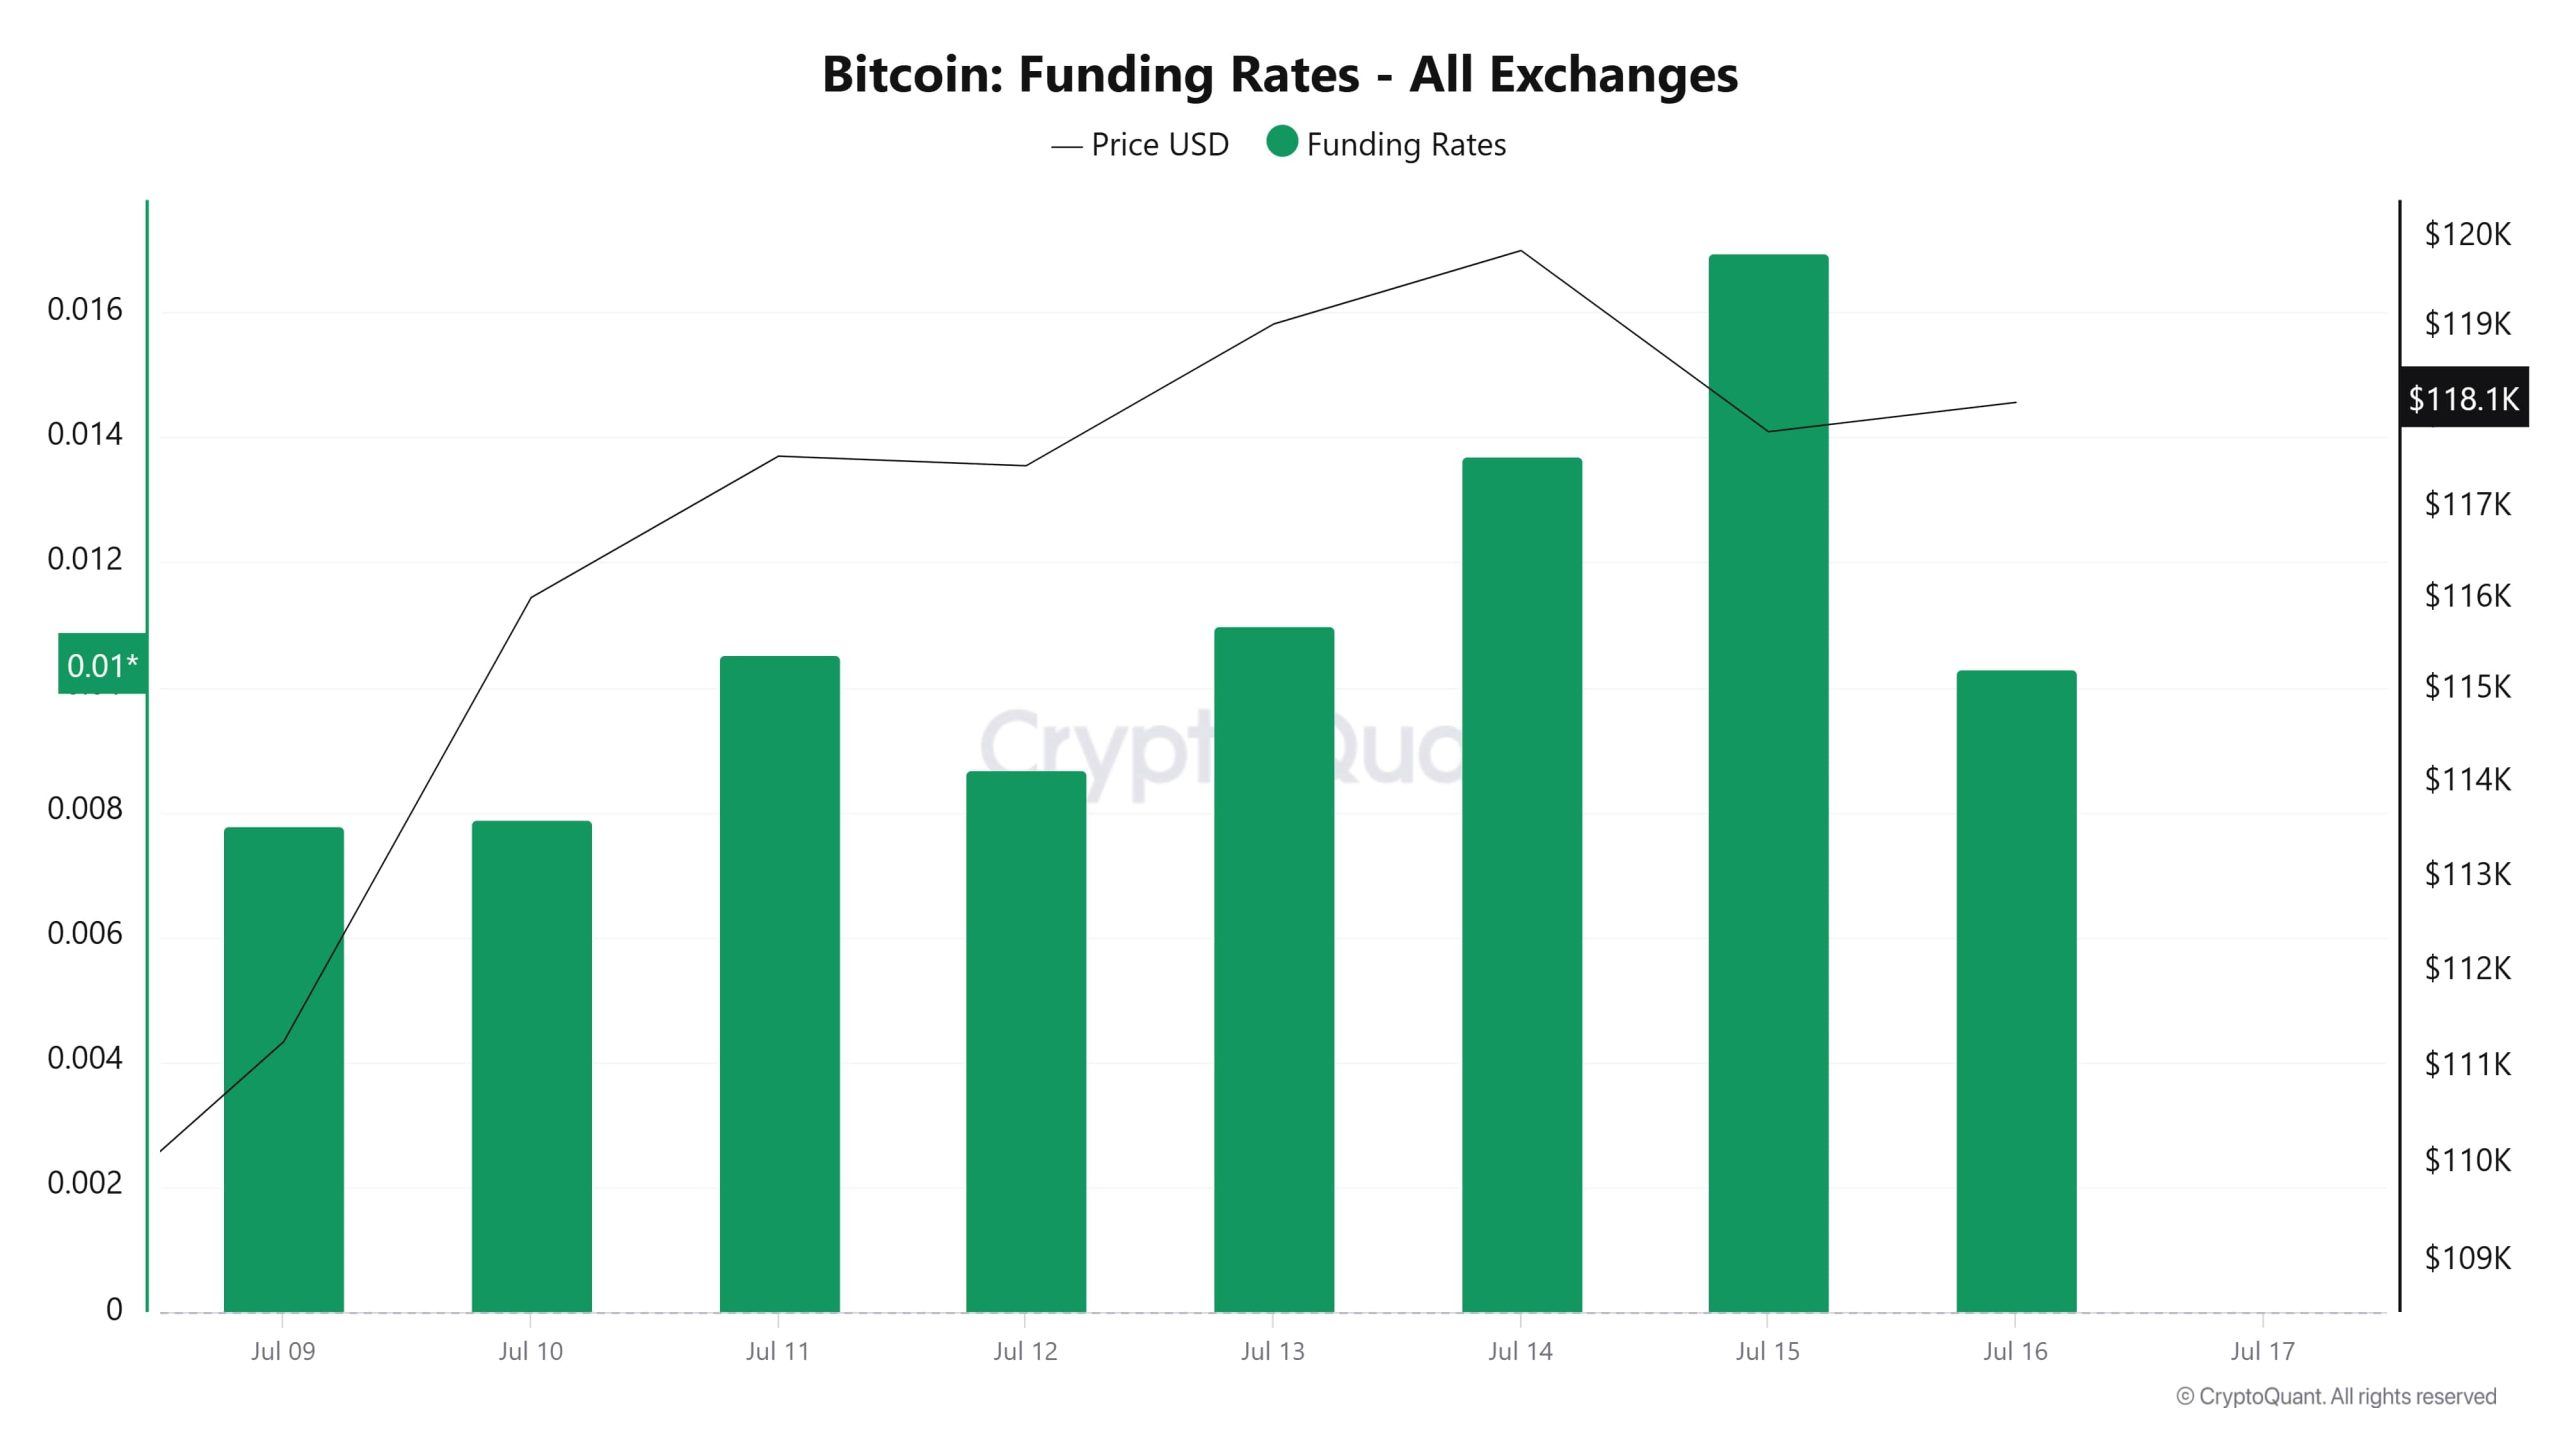 In the chart, the increase en Bitcoin’s funding rate since July 9 draws attention. It is seen that the momentum accelerated especially after July 11 and the rates rose as high as 0.016 el July 15. This indicates that long positions are gaining weight and traders are entering the market with bullish expectations. The positive funded ratios suggest that the demand for long positions is higher across the market. However, such aggressive long accumulations may also bring liquidation risks if the price falls. As a matter of fact, after July 15, there was both a slight pullback en the price and a slight decline en the funding ratio. This shows that the market is a bit cautious en the short term.
The overall outlook suggests that the market is still optimistic, but the risk of a correction should not be ignored as funding ratios gradually inflate. Unless a balanced outlook is maintained, higher rates may become a pressure factor for long positions.
Long & Short Liquidations
Last week, there were short-heavy liquidations with BTC hitting an All Time High (ATH) of $123,200. 257 million dollars of long and 971 million dollars of short transactions were liquidated.
| Date | Long Amount (Million $) | Short Amount (Million $) |
|---|---|---|
| July 09 | 8.60 | 326.73 |
| July 10 | 8.47 | 196.31 |
| July 11 | 63.25 | 86.43 |
| July 12 | 7.17 | 3.12 |
| July 13 | 5.13 | 30.54 |
| July 14 | 52.28 | 301.75 |
| July 15 | 112.92 | 26.82 |
| Total | 257.82 | 971.70 |
Supply Distribution
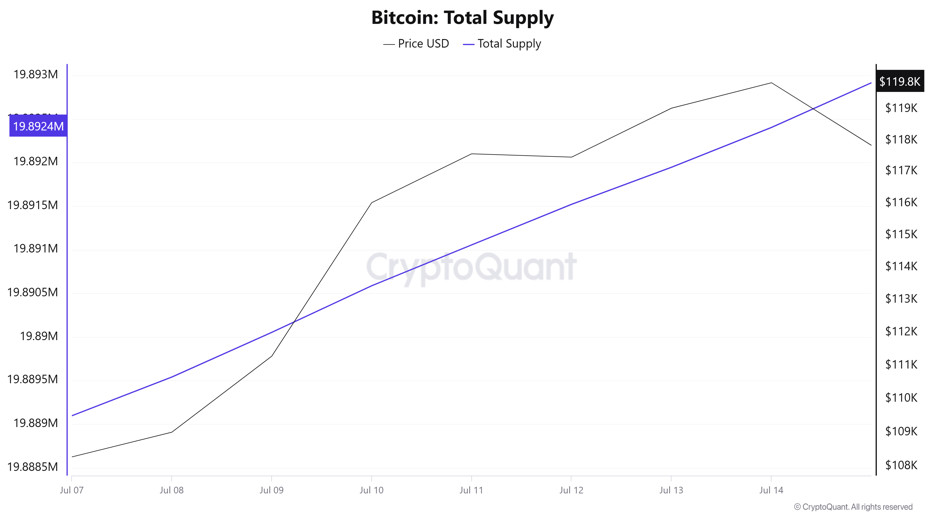
Total Supply: It reached 19,889,096 units, an increase of about 0.016% compared to last week.
New Supply: The amount of BTC produced this week was 3,306.
Velocity: Velocity, which was 12.70 last week, was 12.68 as of July 14.
| Wallet Categoría | 07.07.2025 | 14.07.2025 | Change (%) |
|---|---|---|---|
| < 1 BTC | 8.4664% | 8.4528% | -0.1606% |
| 1 – 10 BTC | 11.4187% | 11.3981% | -0.1804% |
| 10 – 100 BTC | 24.6677% | 24.7238% | 0.2274% |
| 100 – 1k BTC | 29.0837% | 29.1060% | 0.0767% |
| 1k – 10k BTC | 18.3033% | 18.3204% | 0.0934% |
| 10k+ BTC | 8.0597% | 7.9985% | -0.7593% |
According to the latest weekly data, Bitcoin wallet distribution is mixed. While there was a limited decrease of -0.16% en <1 BTC wallets, a decrease of -0.18% was observed en the 1-10 BTC range. On the other hand, there were slight increases of +0.23% en the 10-100 BTC segment and +0.08% en the 100-1k BTC range. The 1k-10k BTC group saw a limited rise of +0.09%, while the 10k+ BTC category saw a more pronounced decline of -0.76%.
Exchange Reserve
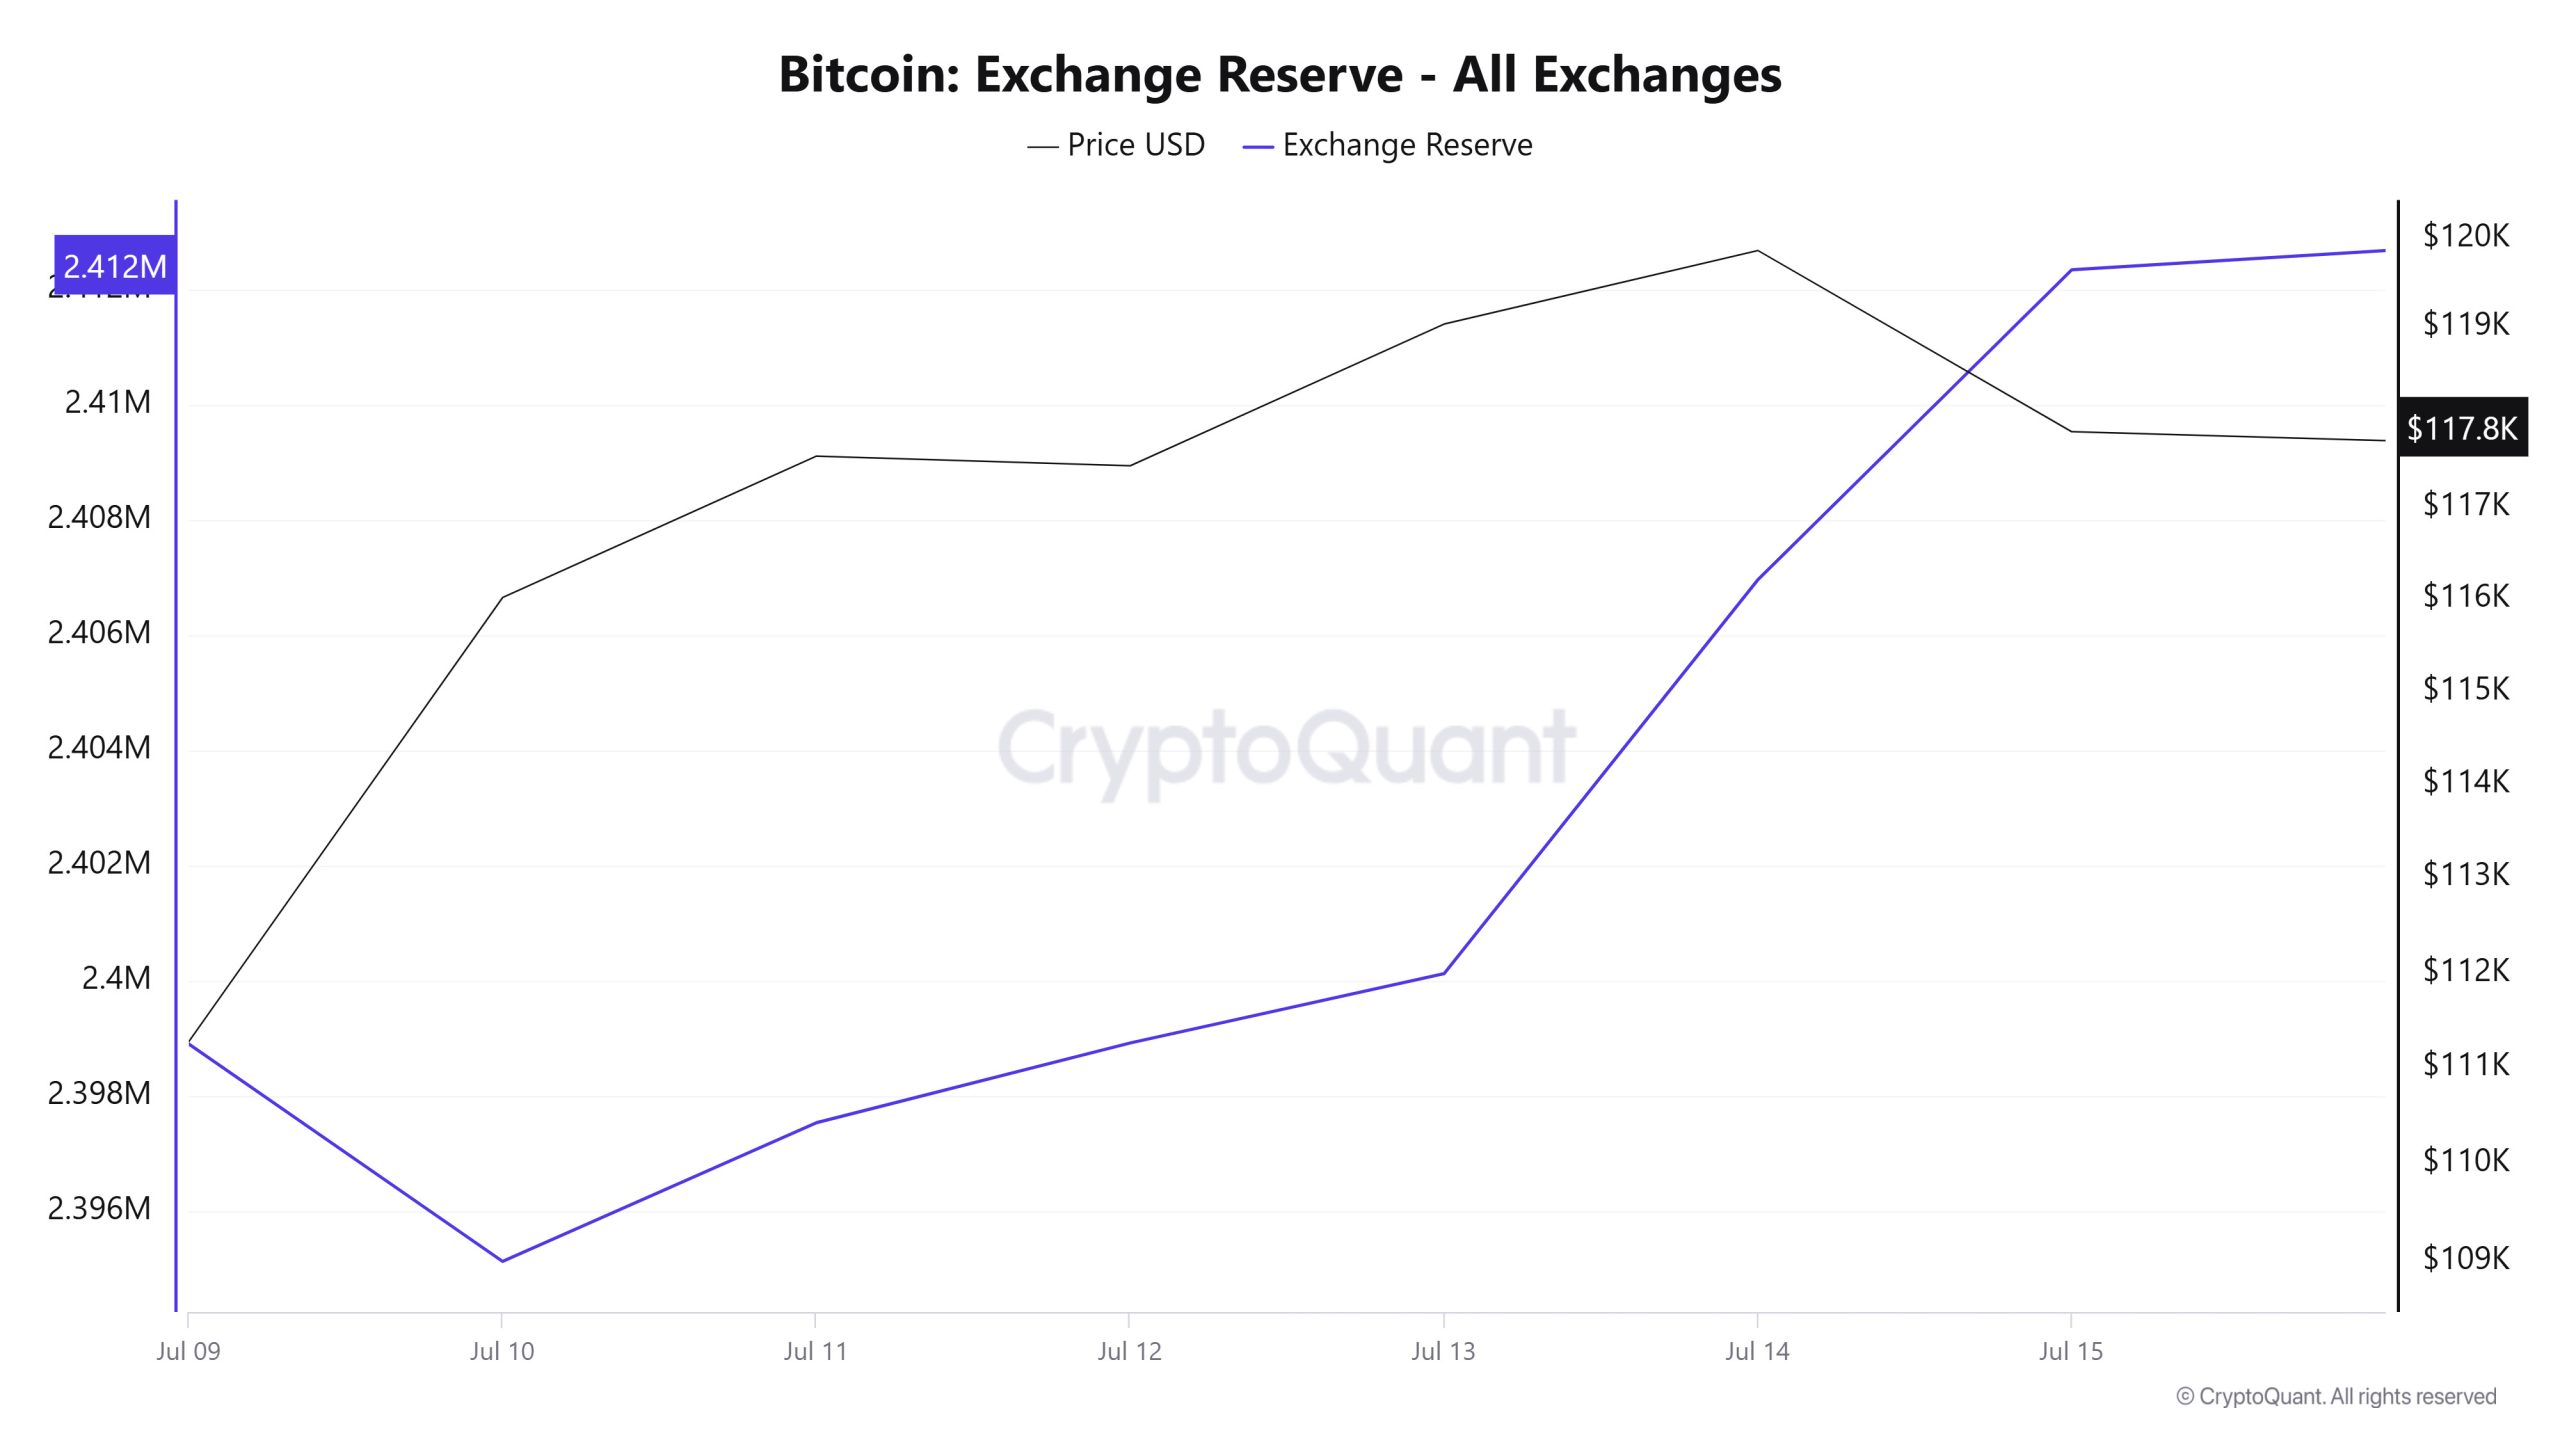
Between July 9-15, 2025, Bitcoin reserves el exchanges increased from 2,398,906 BTC to 2,412,339 BTC. In total, there was a net inflow of 13,433 BTC during this period, and reserves el exchanges increased por about 0.56%. The Bitcoin price rose from $111,274 to $117,835 during the same period, gaining about 5.9%. This increase en price despite the inflows to the exchanges shows that investor interest remains strong el the buying side. There may be limited volatility en prices next week.
| Date | 9-Jul | 10-Jul | 11-Jul | 12-Jul | 13-Jul | 14-Jul | 15-Jul |
|---|---|---|---|---|---|---|---|
| Exchange Inflow | 19,310 | 36,771 | 50,984 | 13,268 | 12,970 | 54,151 | 80,810 |
| Exchange Outflow | 21,689 | 40,544 | 48,577 | 11,884 | 11,768 | 47,322 | 75,431 |
| Exchange Netflow | -2,380 | -3,773 | 2,407 | 1,384 | 1,203 | 6,830 | 5,379 |
| Exchange Reserve | 2,398,906 | 2,395,133 | 2,397,540 | 2,398,924 | 2,400,127 | 2,406,960 | 2,412,339 |
| BTC Price | 111,274 | 116,014 | 117,566 | 117,459 | 119,033 | 119,858 | 117,835 |
Fees and Revenues
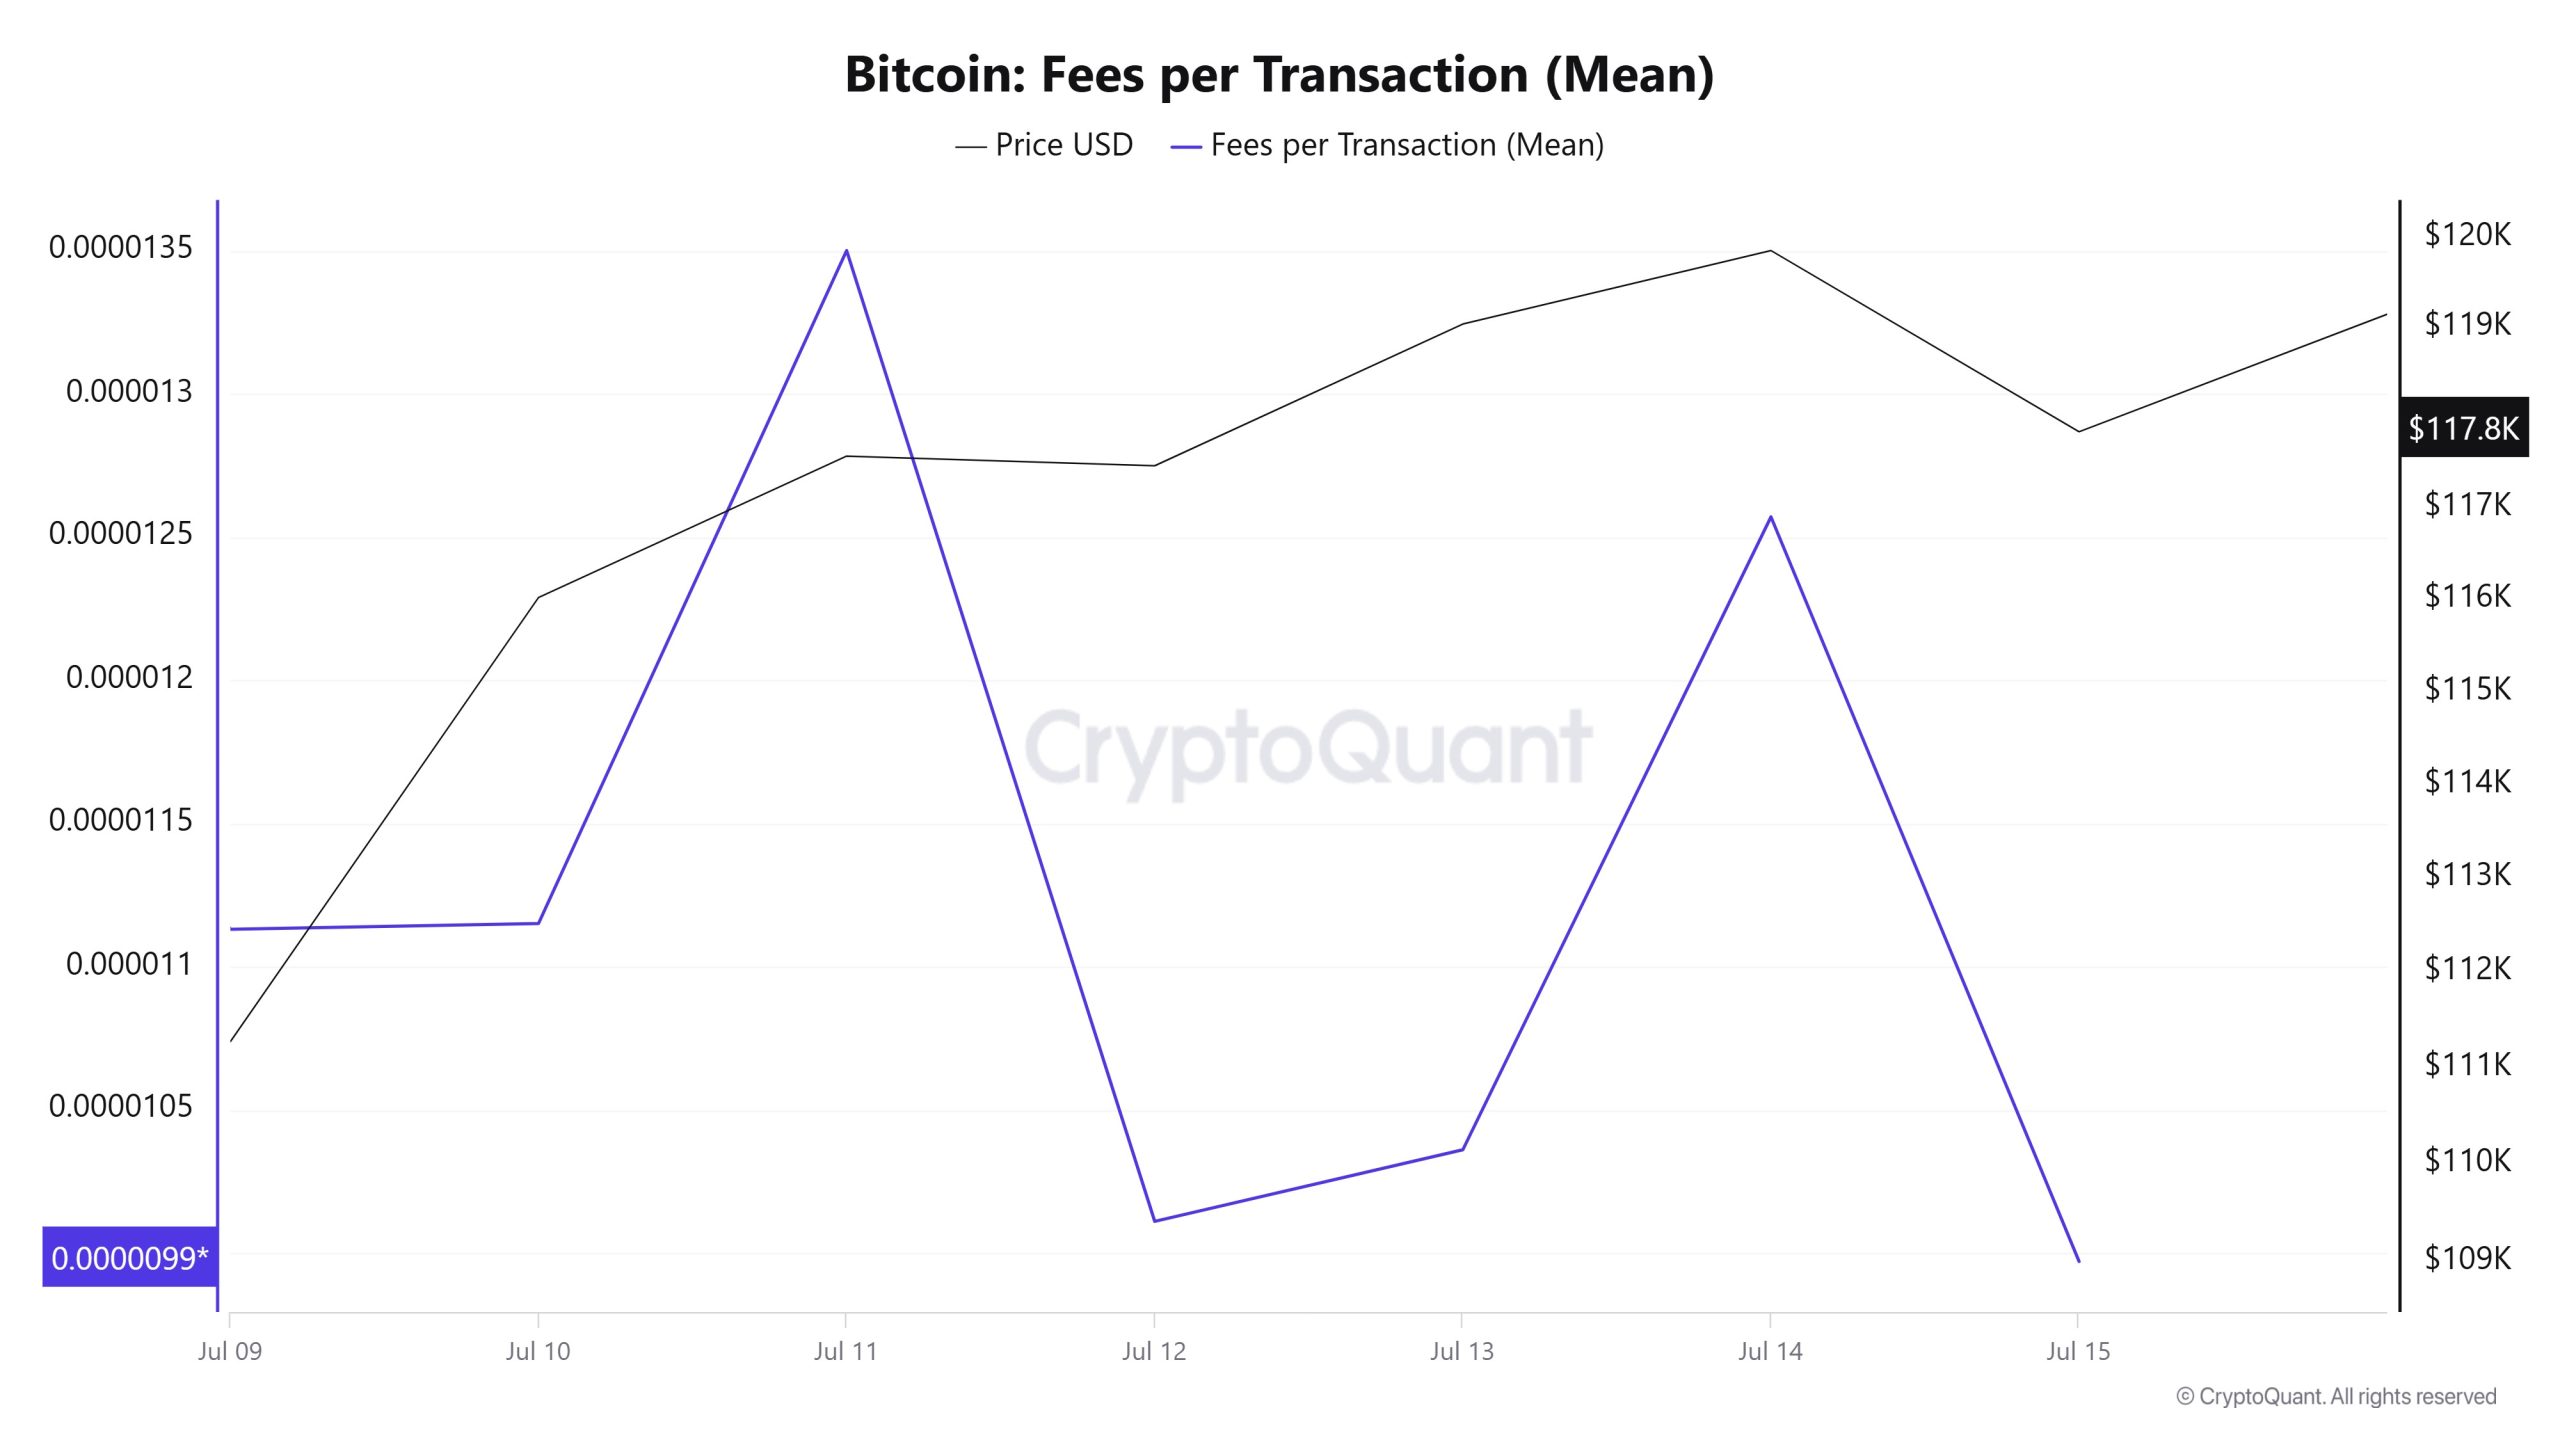
When Bitcoin Fees per Transaction (Mean) data between July 9 and July 15 are analyzed, it is seen that this indicator was realized at 0.00001113 el July 9, the first day of the week.
As of this date, a fluctuating course was observed due to the volatile movements en the Bitcoin price; As of July 11, it reached 0.0000135, reaching the highest level of the week.
In the following days, Bitcoin Fees per Transaction (Mean) started to decline again and closed at 0.00000997 el July 15, the last day of the week.
Bitcoin: Fees (Total)
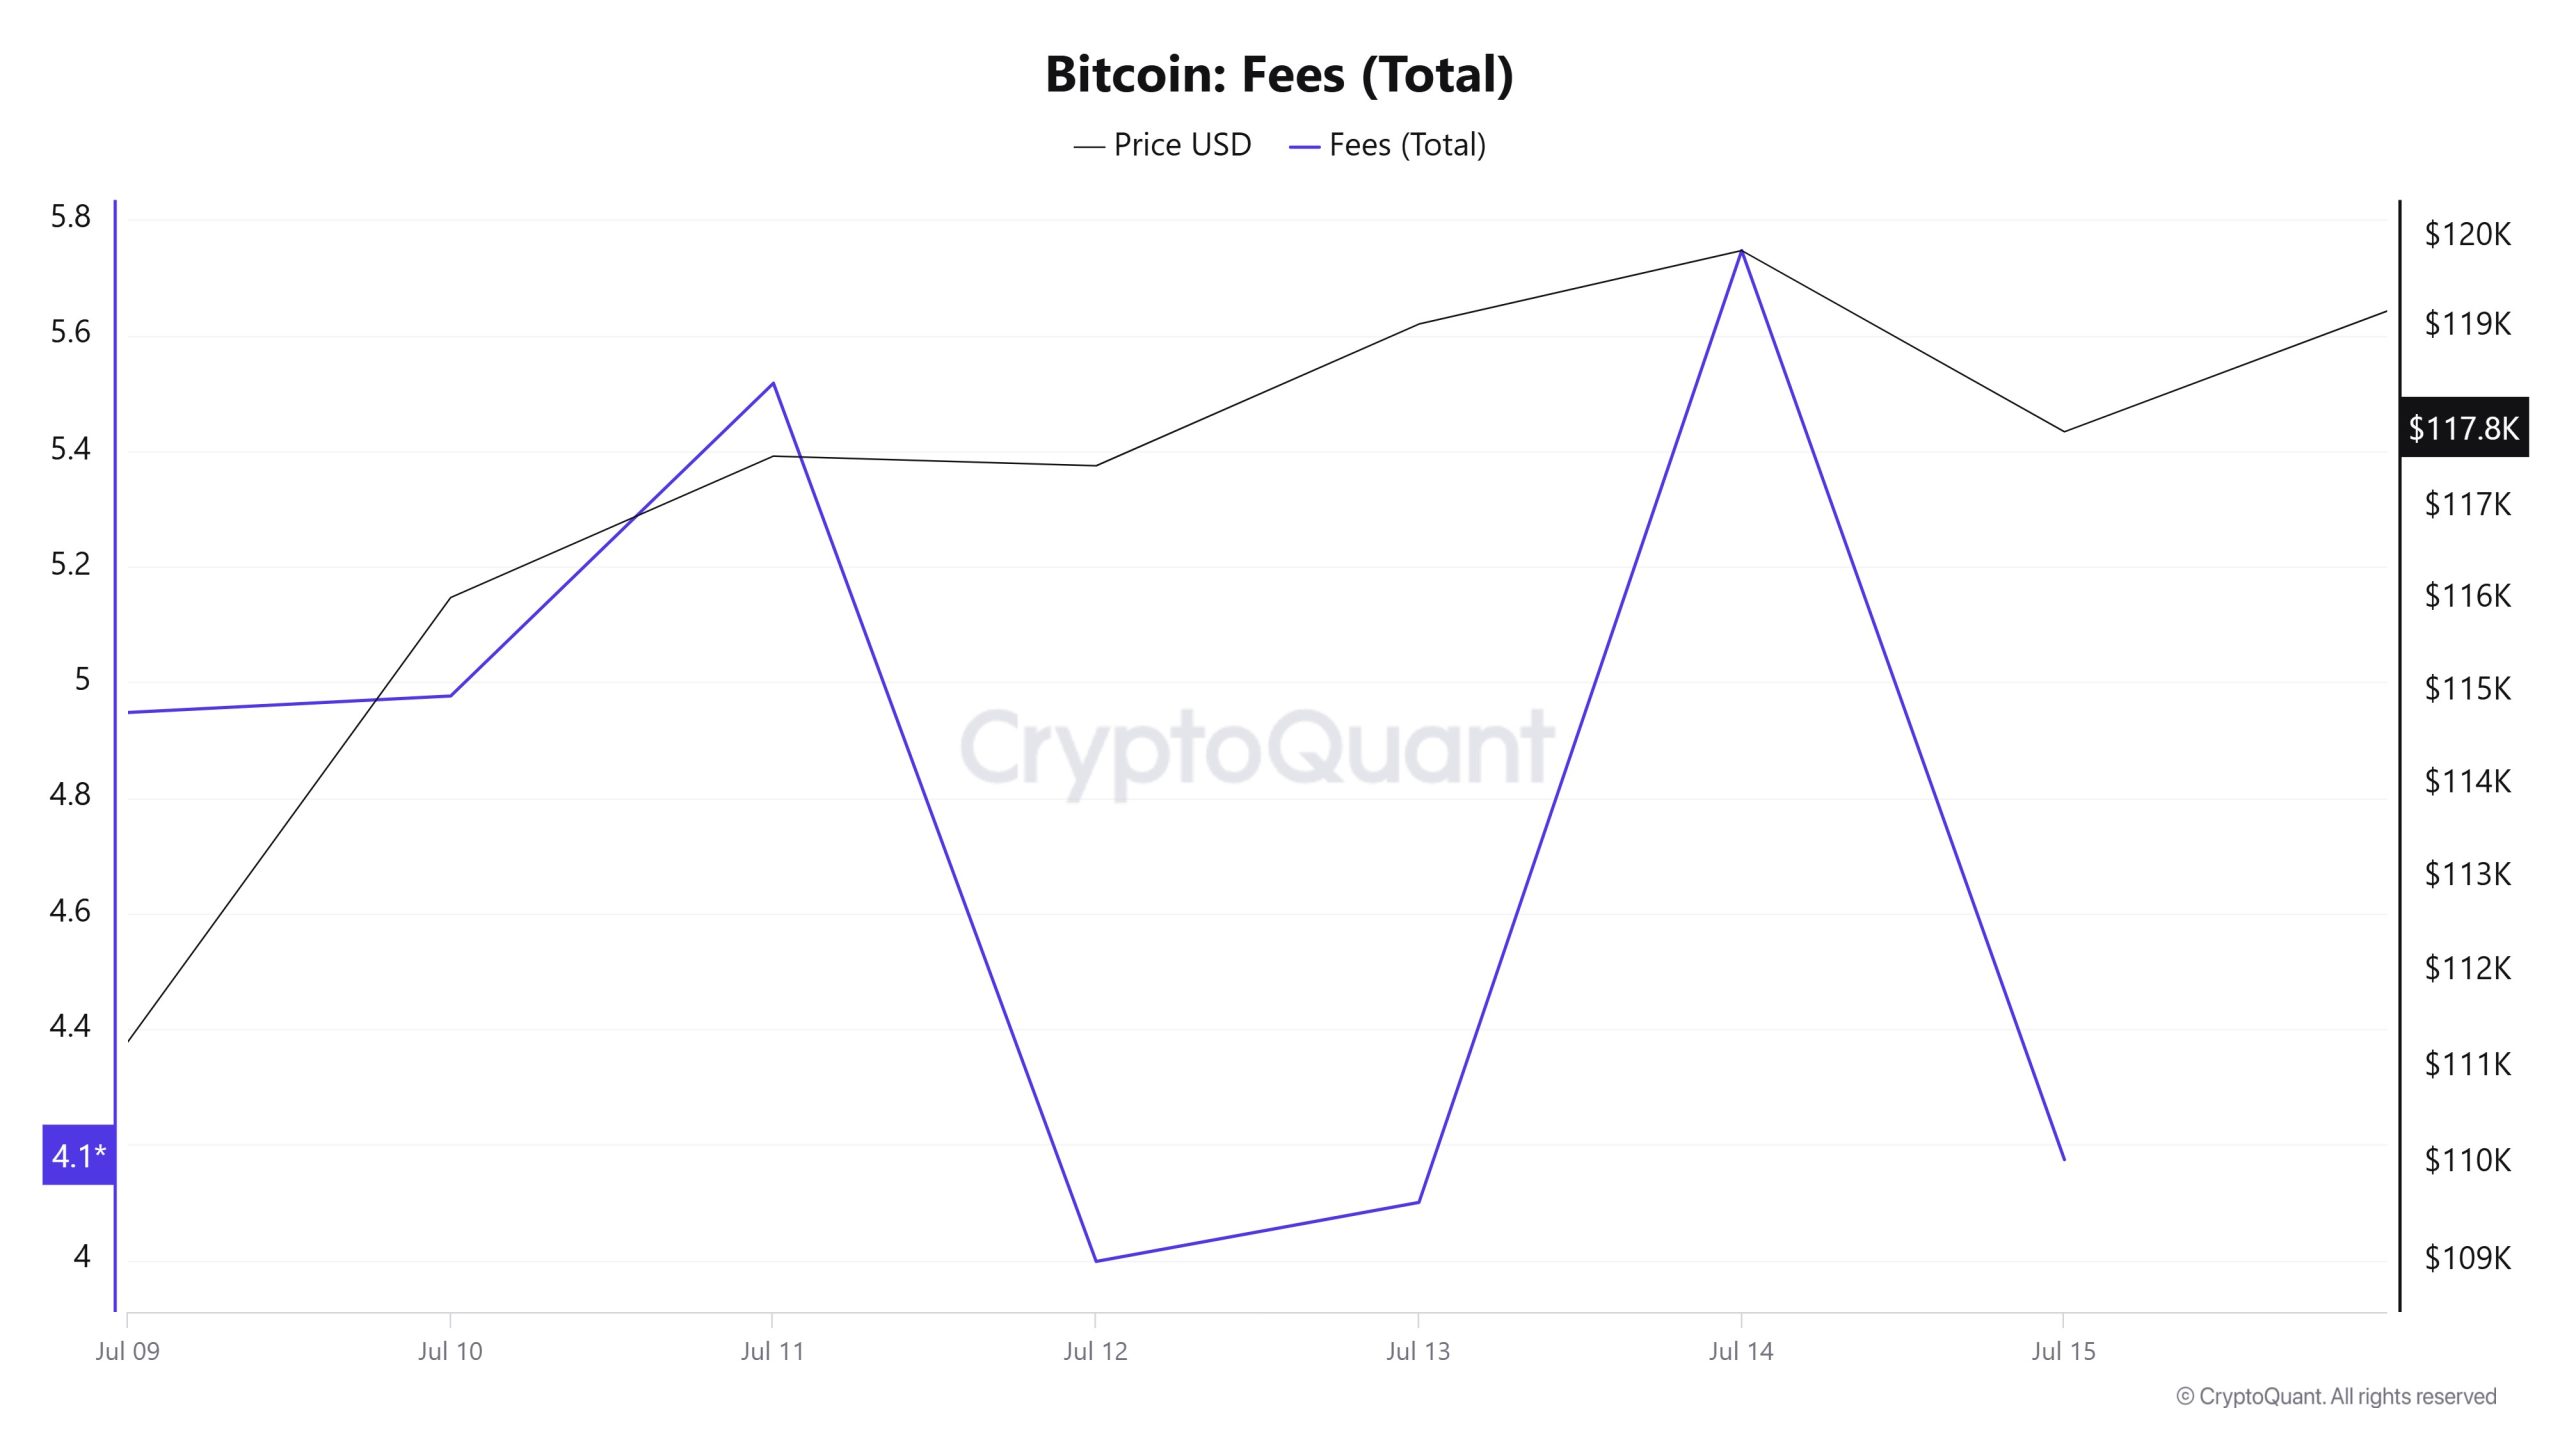
Similarly, when Bitcoin Fees (Total) data between July 9 and 15 are analyzed, it is seen that this indicator was at 4.94768178 el July 9, the first day of the week.
After this date, a fluctuating course was observed due to the volatile movements en the Bitcoin price, reaching 5.74663178 el July 14, the highest level of the week.
In the following days, Bitcoin Fees (Total) started to decline again and closed at 4.17421593 el July 15, the last day of the week.
Miner Flows
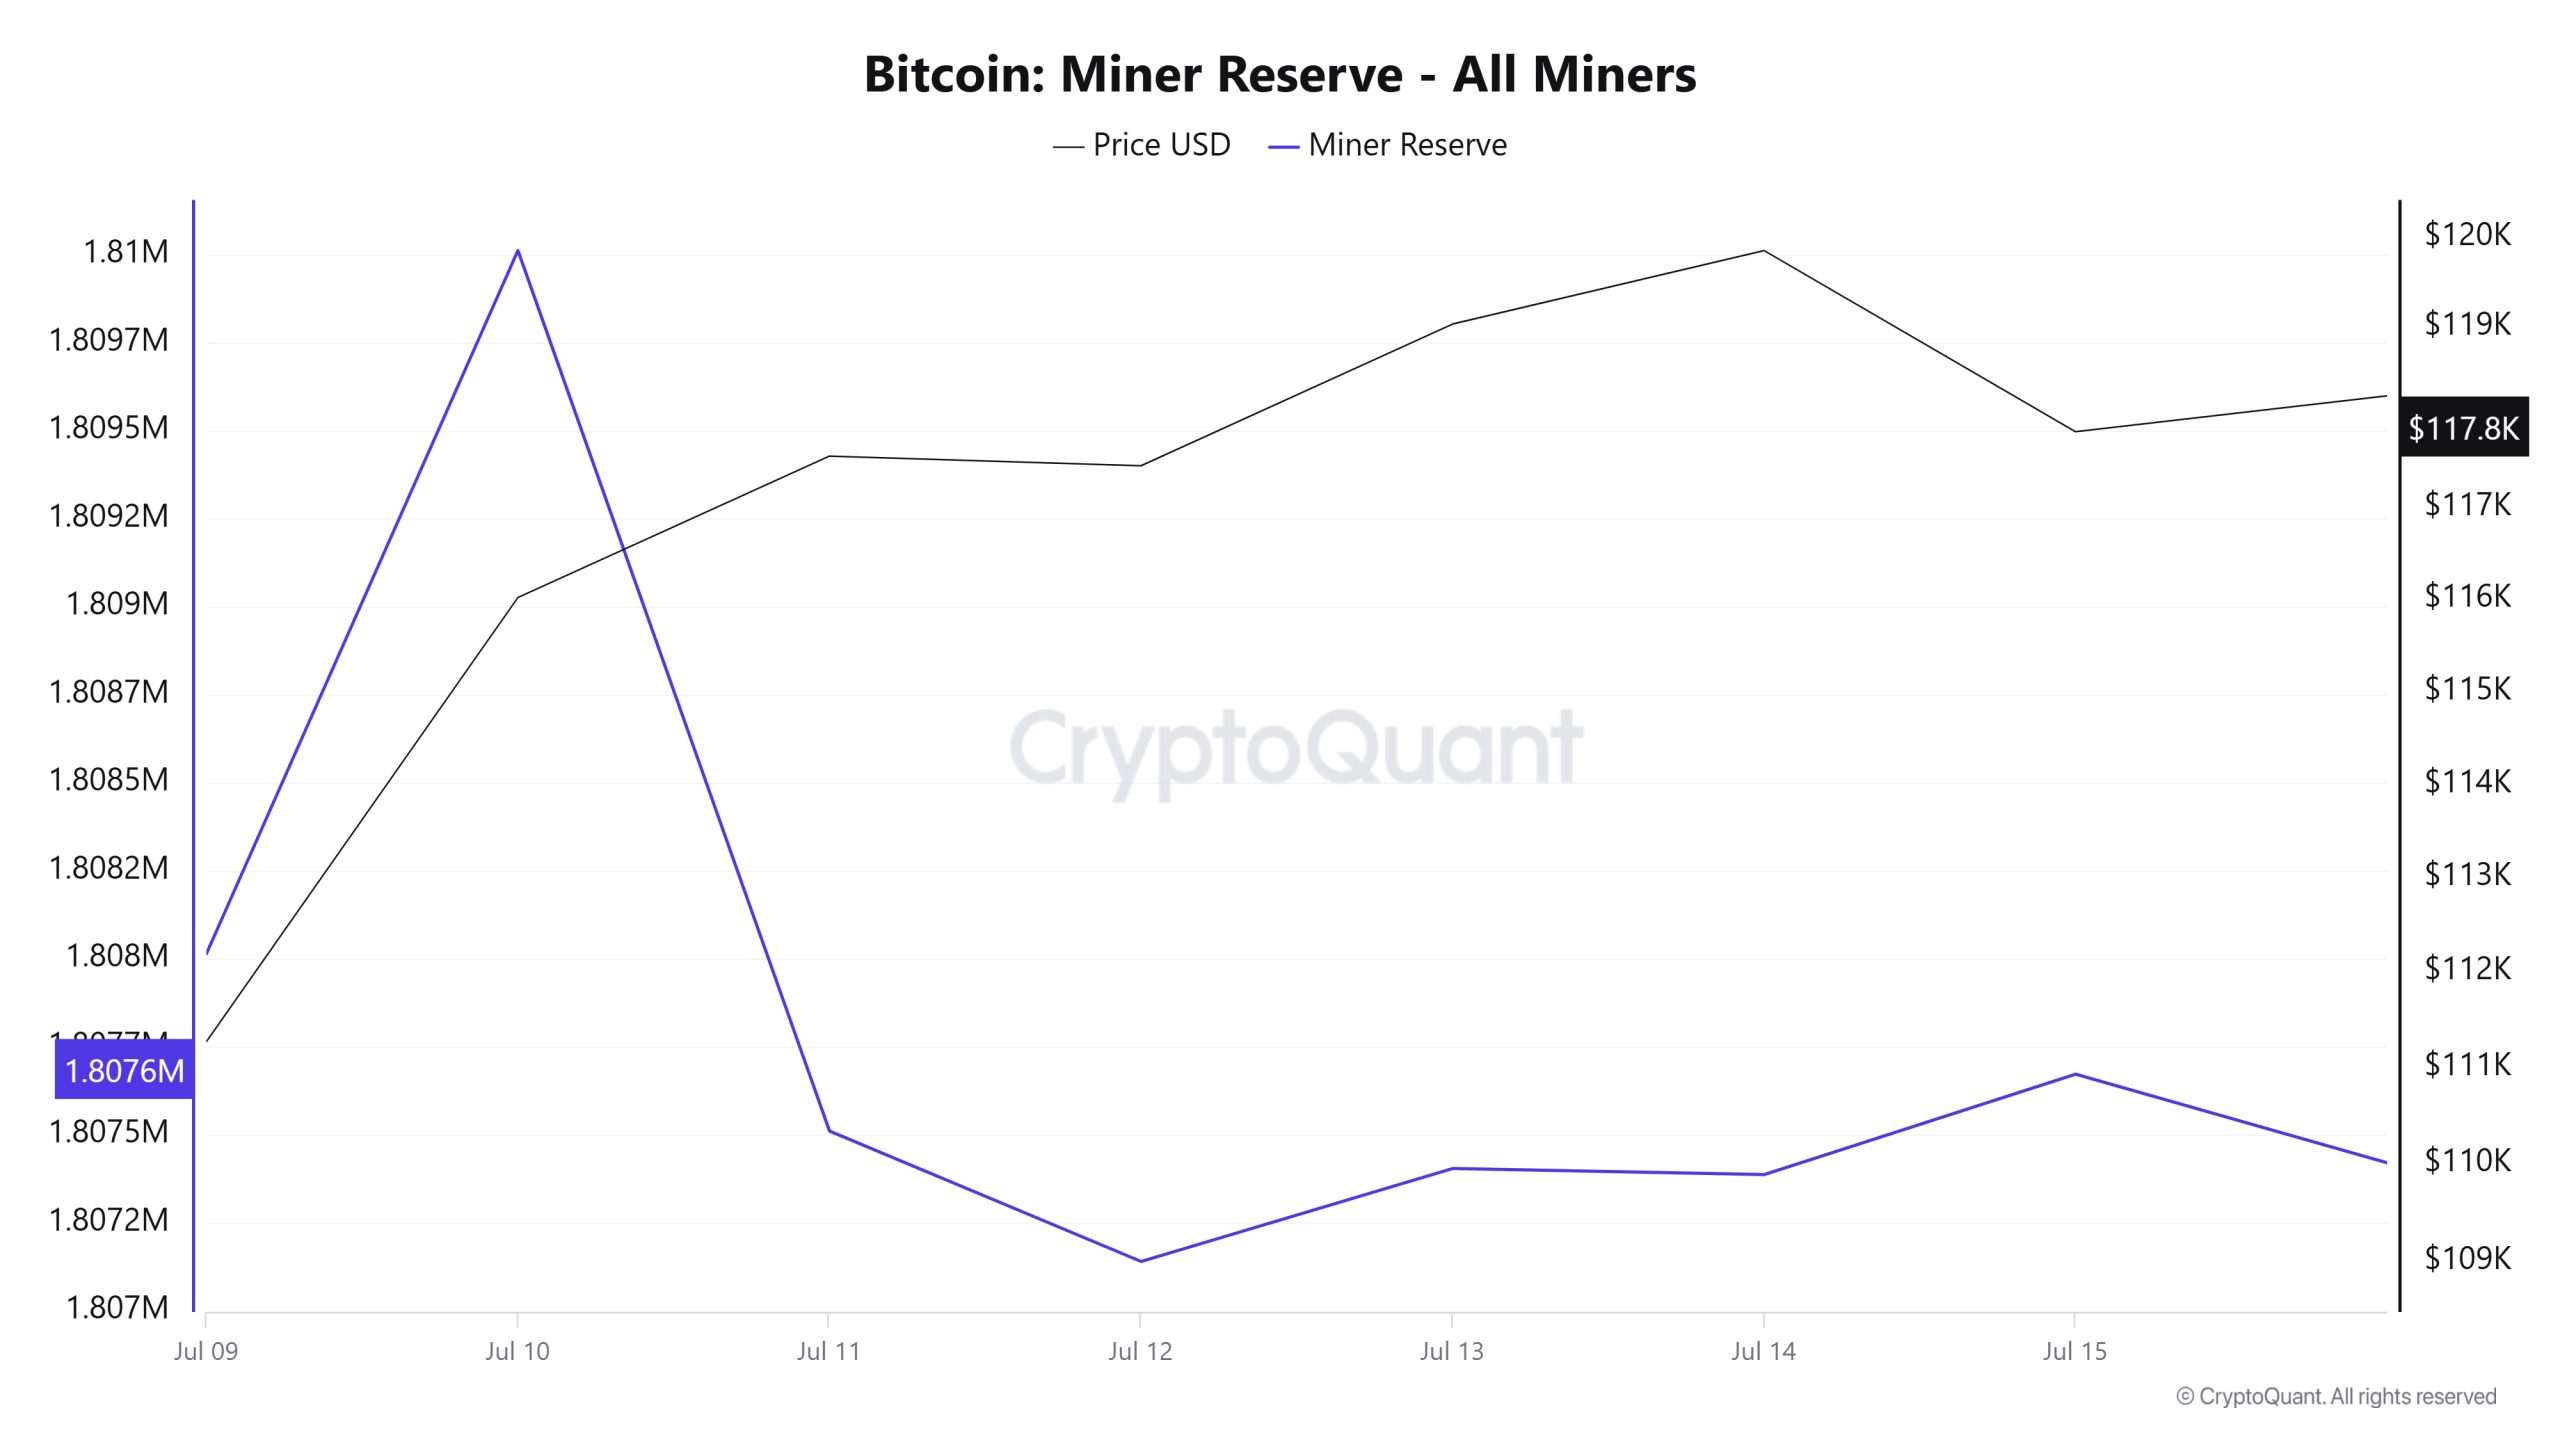
According to data from the Miner Reserve table, there was a decrease en Bitcoin reserves held en miners’ wallets this week. At the beginning of the week, there was a positive correlation between Bitcoin price and Miner Reserve, but por the end of the week, this correlation turned negative.
Miner Inflow, Outflow and NetFlow
Between July 9th and July 15th, 62,033 Bitcoins exited miners’ wallets, and 61,381 Bitcoins entered miners’ wallets between the same dates. The Miner Netflow for this week was -652 Bitcoin. Meanwhile, the Bitcoin price was $111,274 el July 9 and $117,835 el July 15.
For the week, the net flow (Miner Netflow) was negative as Bitcoin inflow into miner wallets (Miner Inflow) was less than Bitcoin outflow from miner wallets (Miner Outflow).
| Date | 9 July | 10 July | 11 July | 12 July | 13 July | 14 July | 15 July |
|---|---|---|---|---|---|---|---|
| Miner Inflow | 4,301.45 | 10,663.10 | 11,232.80 | 3,883.96 | 3,519.83 | 11,305.90 | 16,474.57 |
| Miner Outflow | 4,611.03 | 8,663.60 | 13,736.30 | 4,254.77 | 3,255.62 | 11,323.34 | 16,189.09 |
| Miner Netflow | –309.58 | 1,999.50 | –2,503.50 | –370.82 | 264.21 | –17.44 | 285.48 |
Transaction
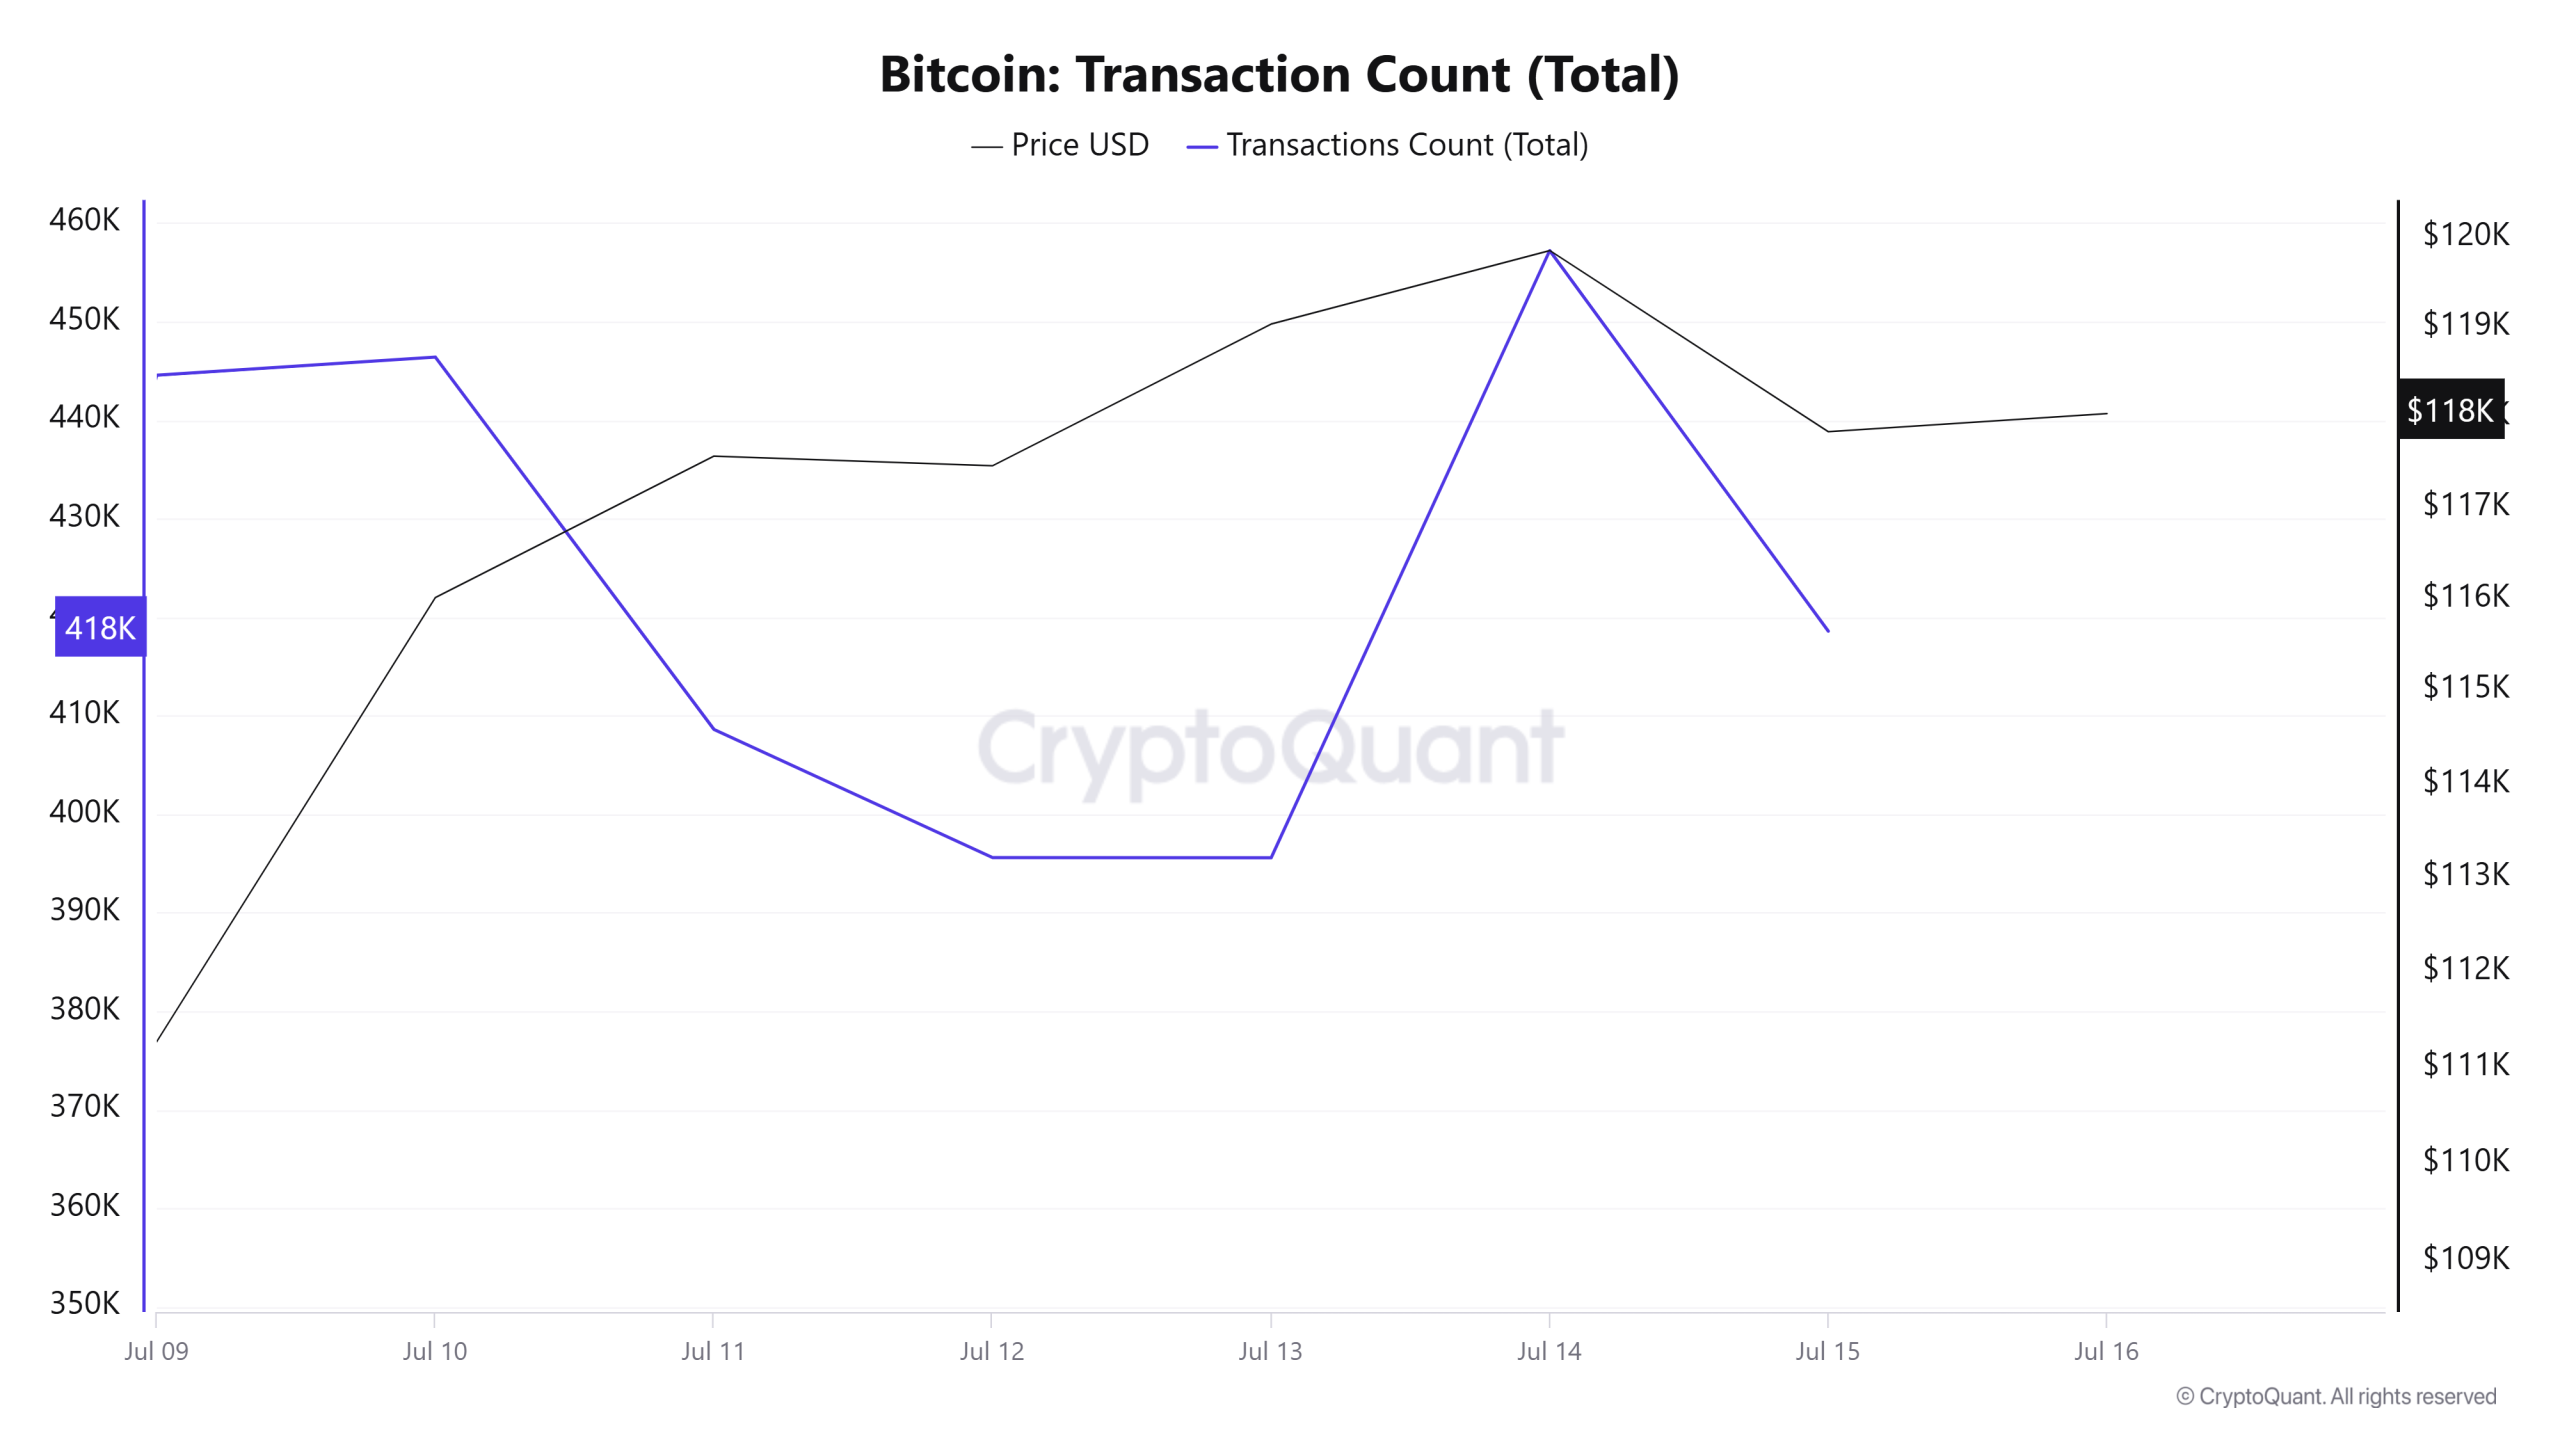
Last week, there were 2,741,953 transactions el the Bitcoin network, while this week it increased por about 8.18% to 2,966,538. The 457,215 transactions recorded el July 14th was the highest trading volume of the week, while the lowest number of transactions was 395,581 el July 13th.
Positive and negative correlations between price and number of trades were positively weighted throughout the week. In addition, the increase en network activity compared to the previous week seems to be quite positive.
Tokens Transferred
While 3,209,893 BTC was transferred last week, it increased por approximately 68.62% to 5,414,637 BTC this week. July 15 saw the highest token transfer volume of the week with 1,146,035 BTC transfers, while July 13 saw the lowest token transfer volume with 452,242 BTC. Positive correlations between the amount of BTC transferred el the network and the price have been dominant throughout this week.
This is a clear sign of a significant increase en market activity and liquidity, with major players actively shifting positions. The huge volume of transfers, especially el July 15, could be a harbinger of possible large trading fluctuations.
Whale Activities
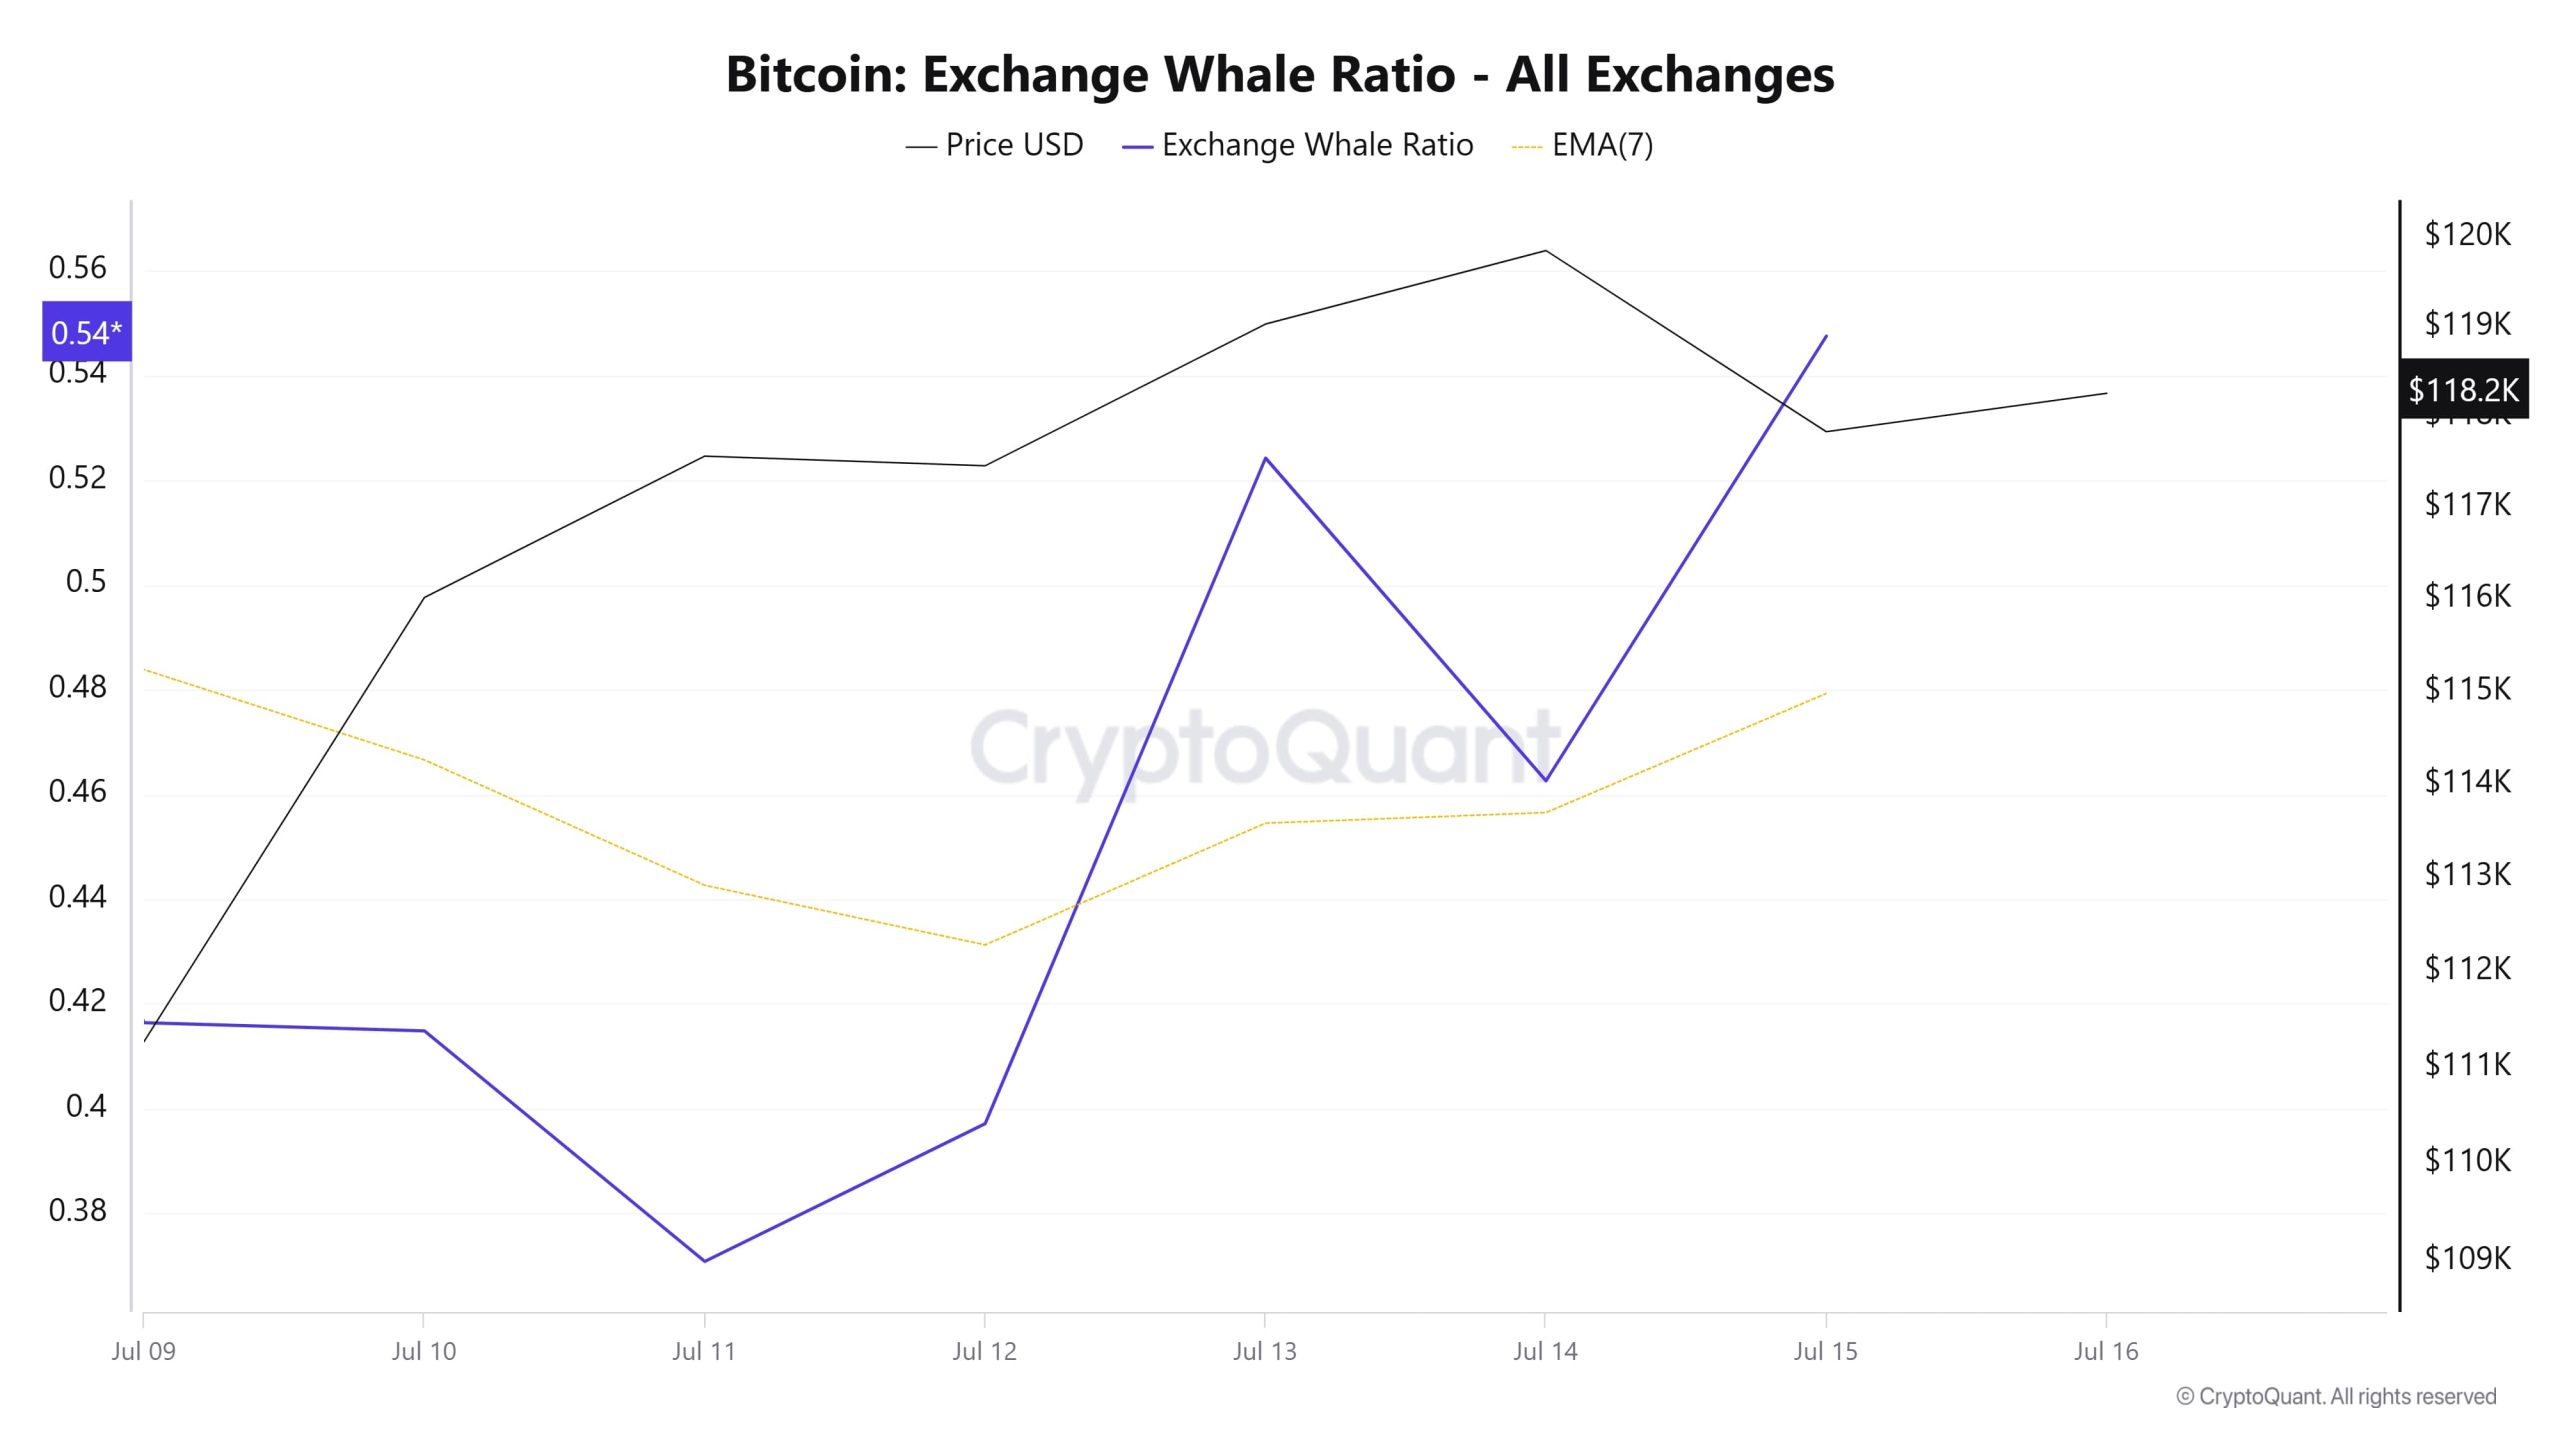
Whales Data:
Over the last 7 days, data from the cryptocurrency market showed that whale activity el centralized exchanges made sufficient use of centralized exchanges at the beginning of the process. Towards the middle of the process, these activities increased. When we look at the Exchange Whale Ratio metric, July 9, the first day of the 7-day process, measured the rate of whales using central exchanges as 0.416. The lowest point of the process occurred el July 11 and the value was 0.370. When this ratio is above 0.35, it usually means that whales use centralized exchanges frequently. This measurement increased towards the middle of the process, reaching 0.524 el July 13. It currently stands at 0.547, marking the peak of the process, as centralized exchanges continue to be used more frequently. BTC was priced at $108,700 at the beginning of this period and is currently priced at $118,200. This shows that whales are using centralized exchanges for accumulation. At the same time, total BTC transfers saw 5,414,635 BTC move, up nearly 70% from last week. The data shows that relatively quiet wallets are accumulating Bitcoin. Wallets holding between 100 and 1,000 BTC showed signs of strength, with a notable increase en activity. This mirrors a similar pattern seen before the 2024 breakout. At the same time, more than 35% of Bitcoin flow consists of transactions exceeding $1 million. Overall, the data points to BTC accumulation por institutional or high net worth investors.
BTC Onchain Overall
| Metrics | Positive 📈 | Negative 📉 | Neutral ➖ |
|---|---|---|---|
| Active Addresses | ✓ | ||
| Breakdowns | ✓ | ||
| Derivatives | ✓ | ||
| Supply Distribution | ✓ | ||
| Exchange Reserve | ✓ | ||
| Fees and Revenues | ✓ | ||
| Miner Flows | ✓ | ||
| Transaction | ✓ | ||
| Whale Activities | ✓ |
*The metrics and guidance en the table do not, por themselves, describe or imply an expectation of future price changes for any asset. The prices of digital assets may vary depending el many different variables. The onchain analysis and related guidance is intended to assist investors en their decision-making process, and making financial investments based solely el the results of this analysis may result en harmful transactions. Even if all metrics produce a bullish, bearish or neutral result at the same time, the expected results may not be seen depending el market conditions. Investors reviewing the report would be well advised to heed these caveats.
Legal Notice
The investment information, comments and recommendations contained en this document do not constitute investment advisory services. Investment advisory services are provided por authorized institutions el a personal basis, taking into account the risk and return preferences of individuals. The comments and recommendations contained en this document are of a general type. These recommendations may not be suitable for your financial situation and risk and return preferences. Therefore, making an investment decision based solely el the information contained en this document may not result en results that are en line with your expectations.
NOTE: All data used en Bitcoin onchain analysis is based el Cryptoqaunt.