
Active Adresses
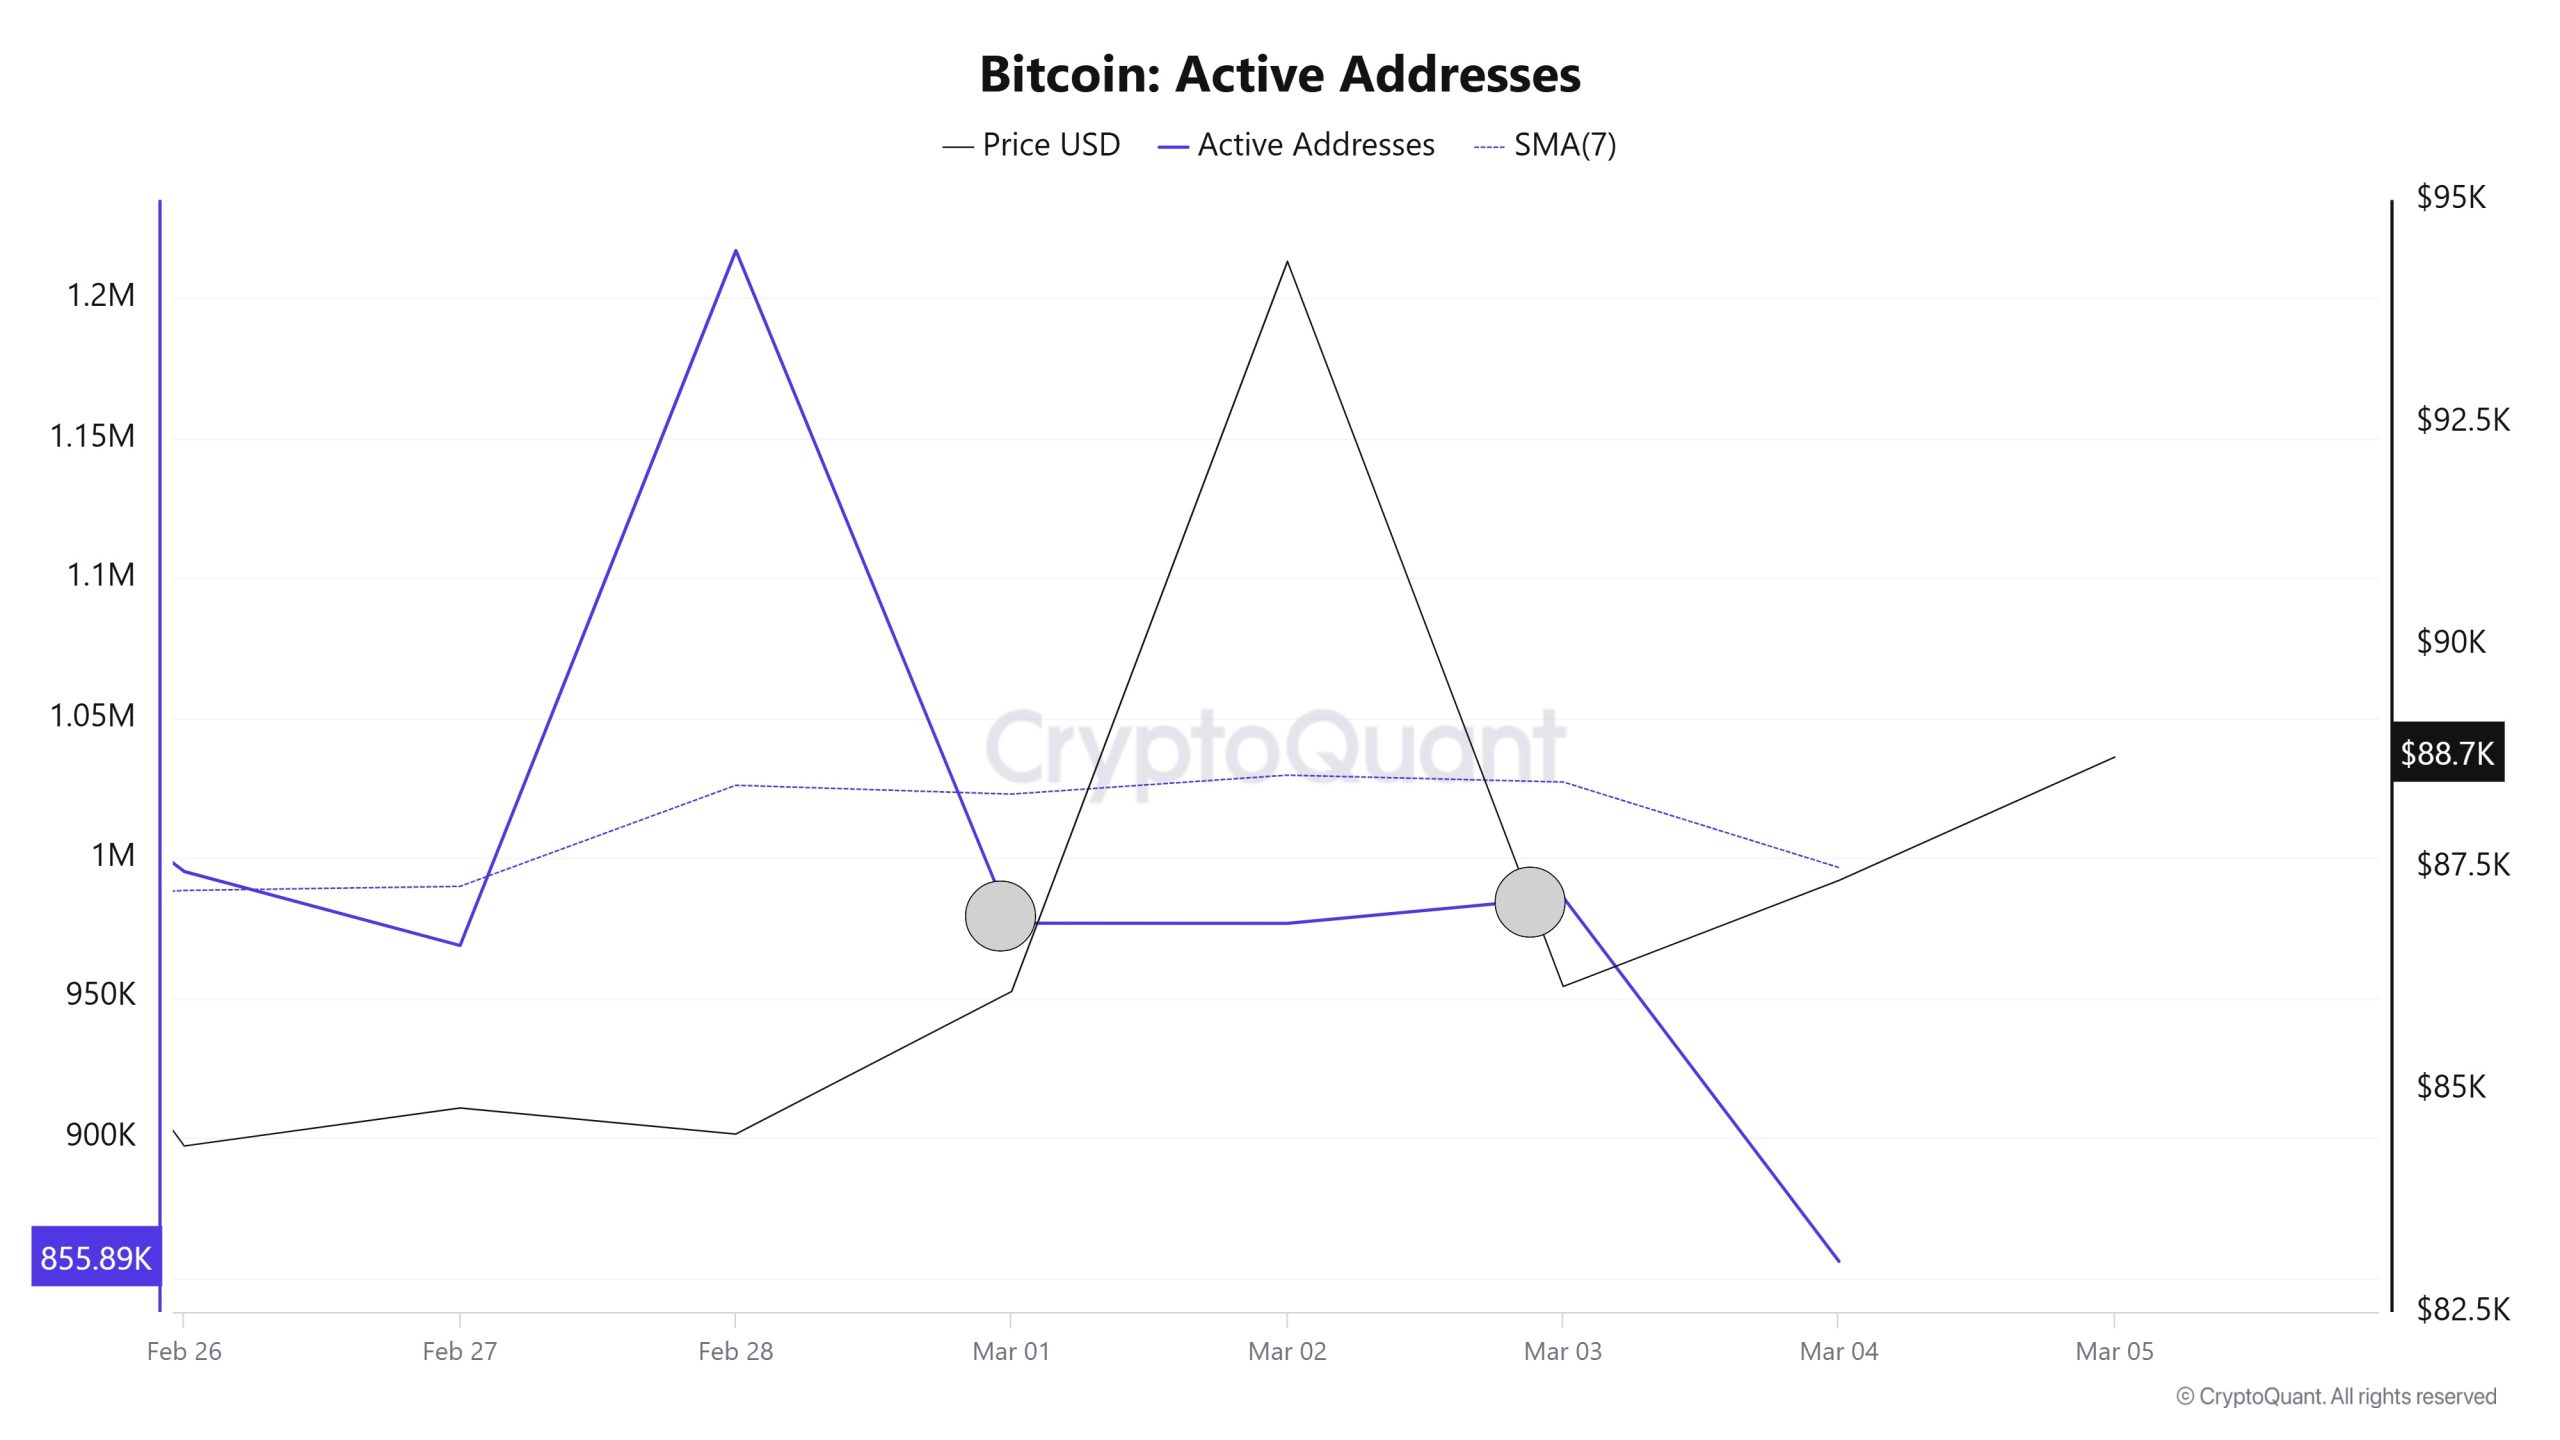
In terms of active addresses, there were 1,217,056 active entries el the BTC network this week between February 26 and March 5, 2025. During this period, Bitcoin rose from $84,000 to $94,000. In the region marked el the chart, where the price and the number of active addresses intersect, we see that Bitcoin purchases are gradually increasing. When we follow the 7-day simple moving average, we observe that the price follows an upward trend el the dates when this average cuts the price. This situation indicates that the Bitcoin price is experiencing entries at $ 86,000 levels
Active Sending Addresses
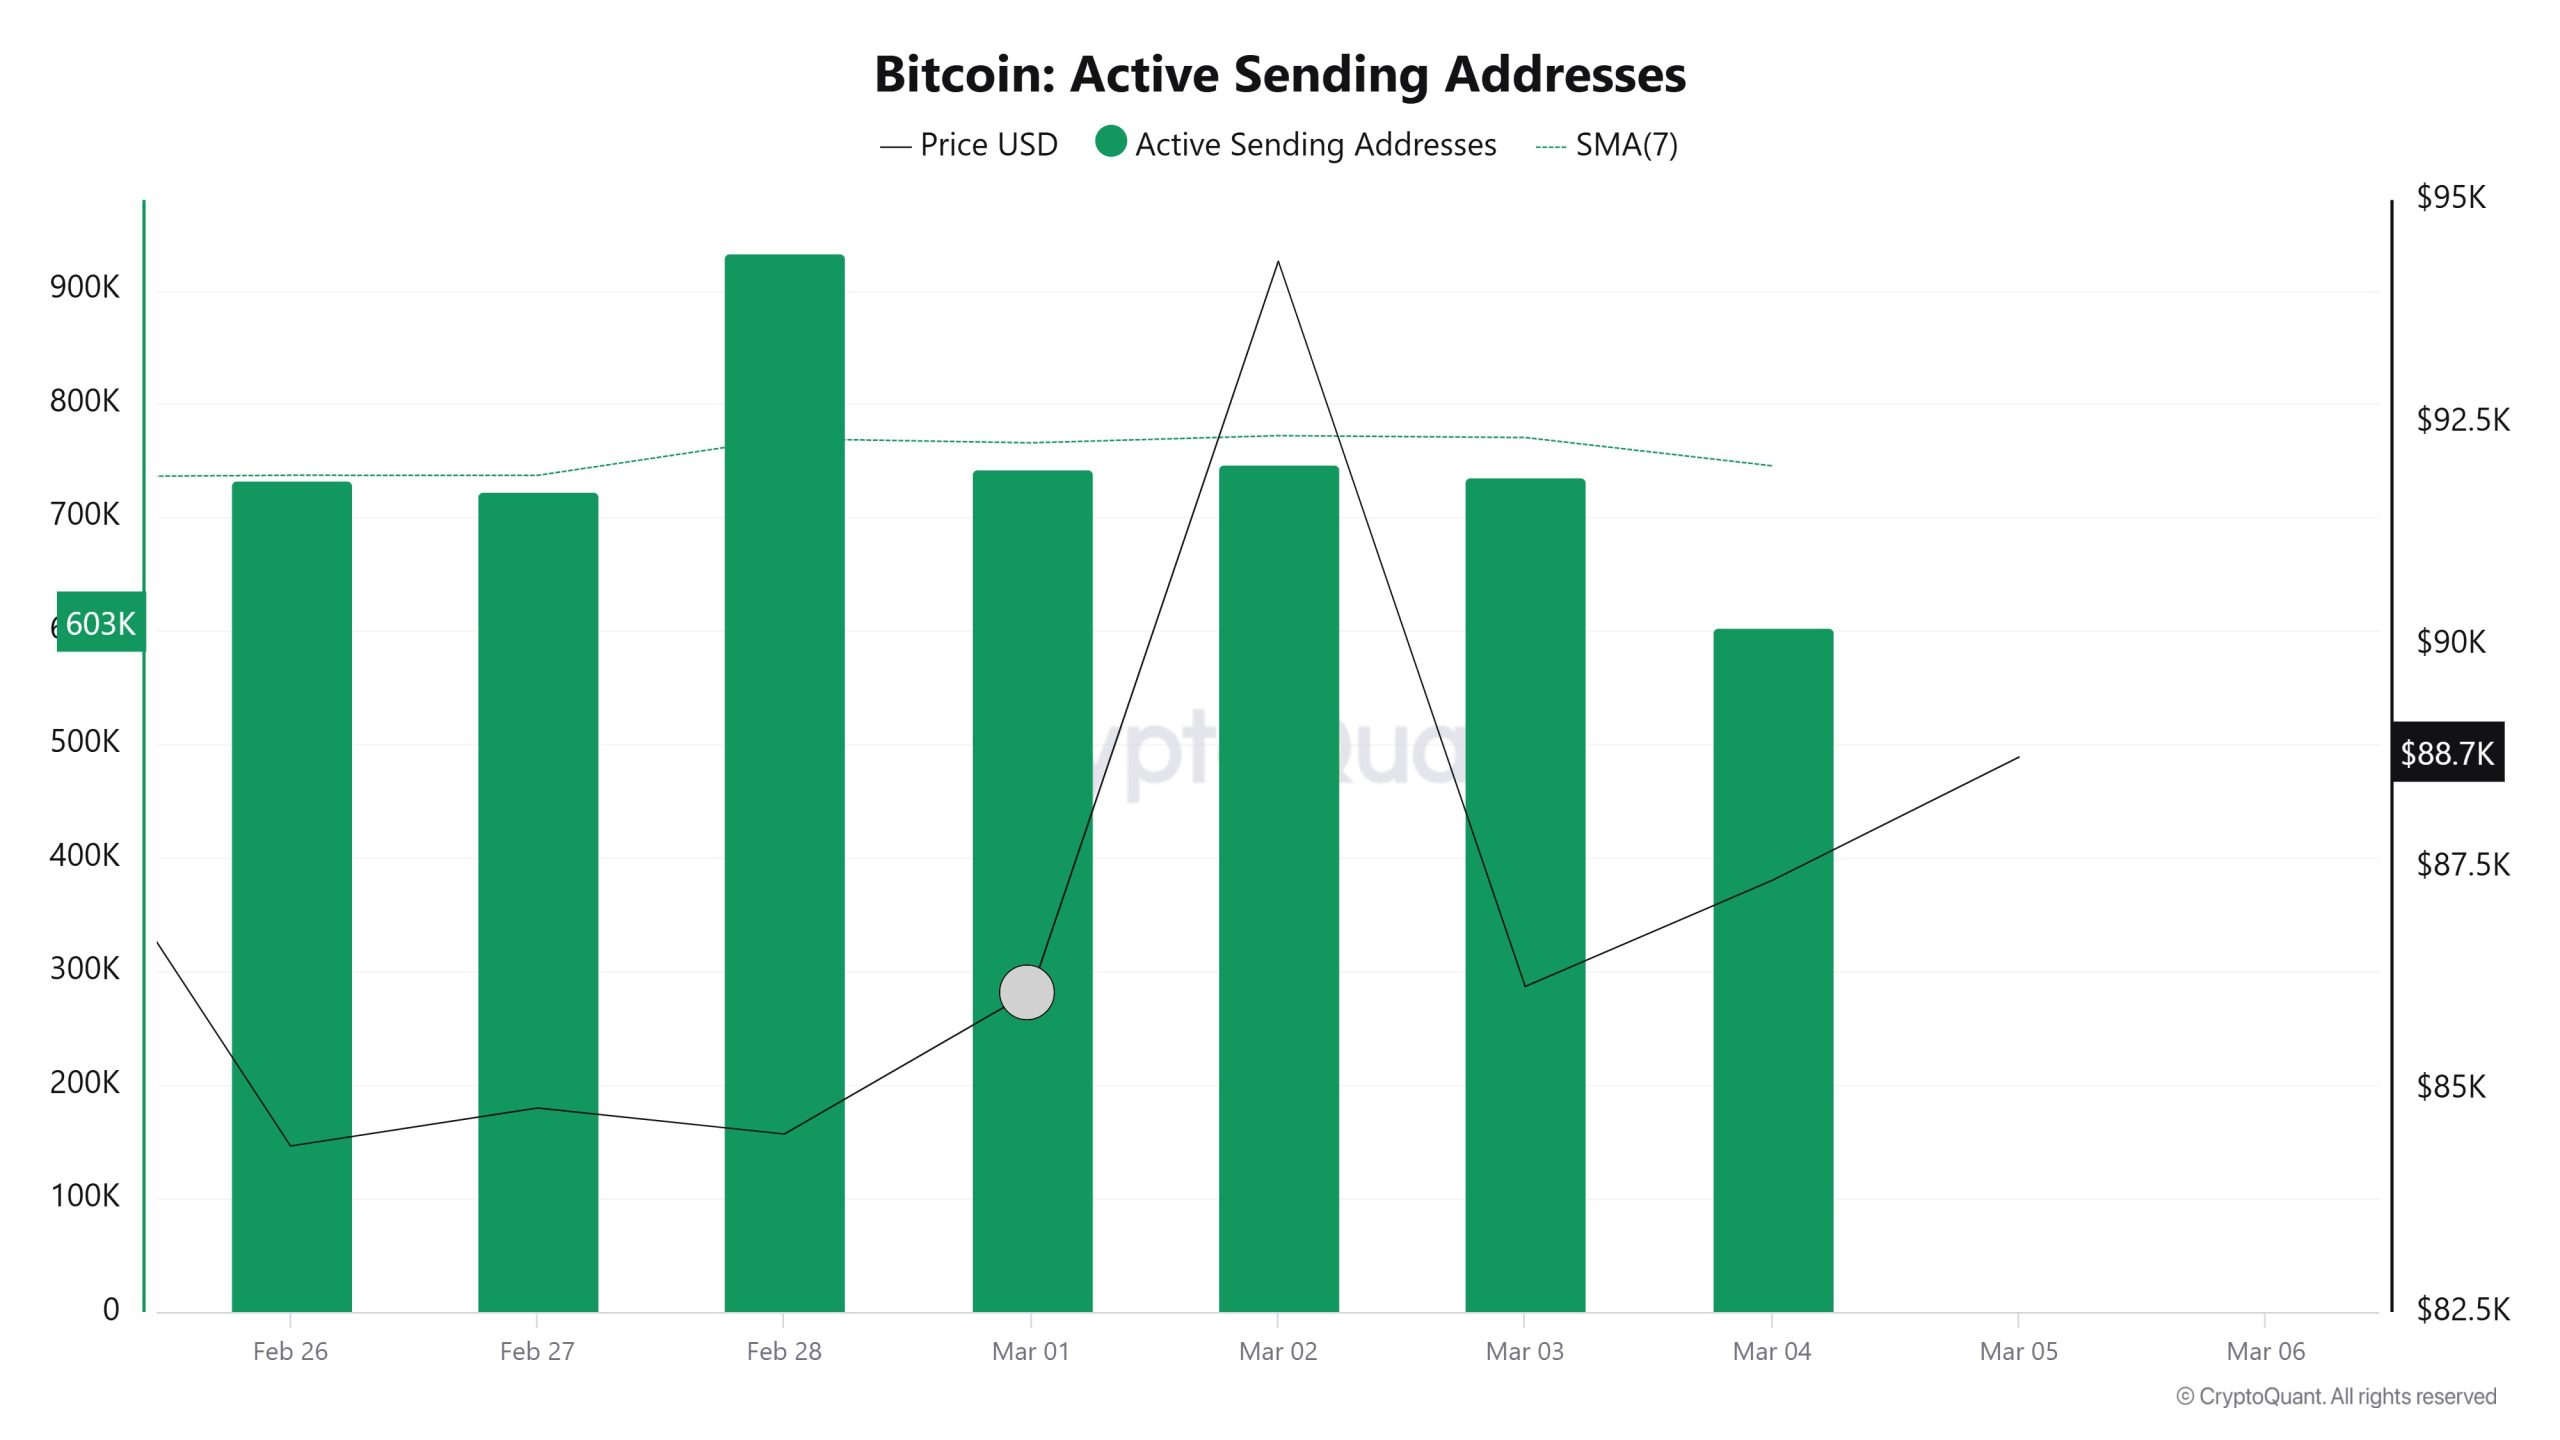
With the Black Line (price line) en active shipping addresses, there has been a significant drop en active shipping addresses after March 2. On the day when the price hit its lowest point, active sending addresses rose as high as 735,942, indicating that buyers sold their positions as Bitcoin stayed around 87,000 for a while. As a result, price drops seem to cause an acceleration en sending addresses.
Active Receiving Addresses
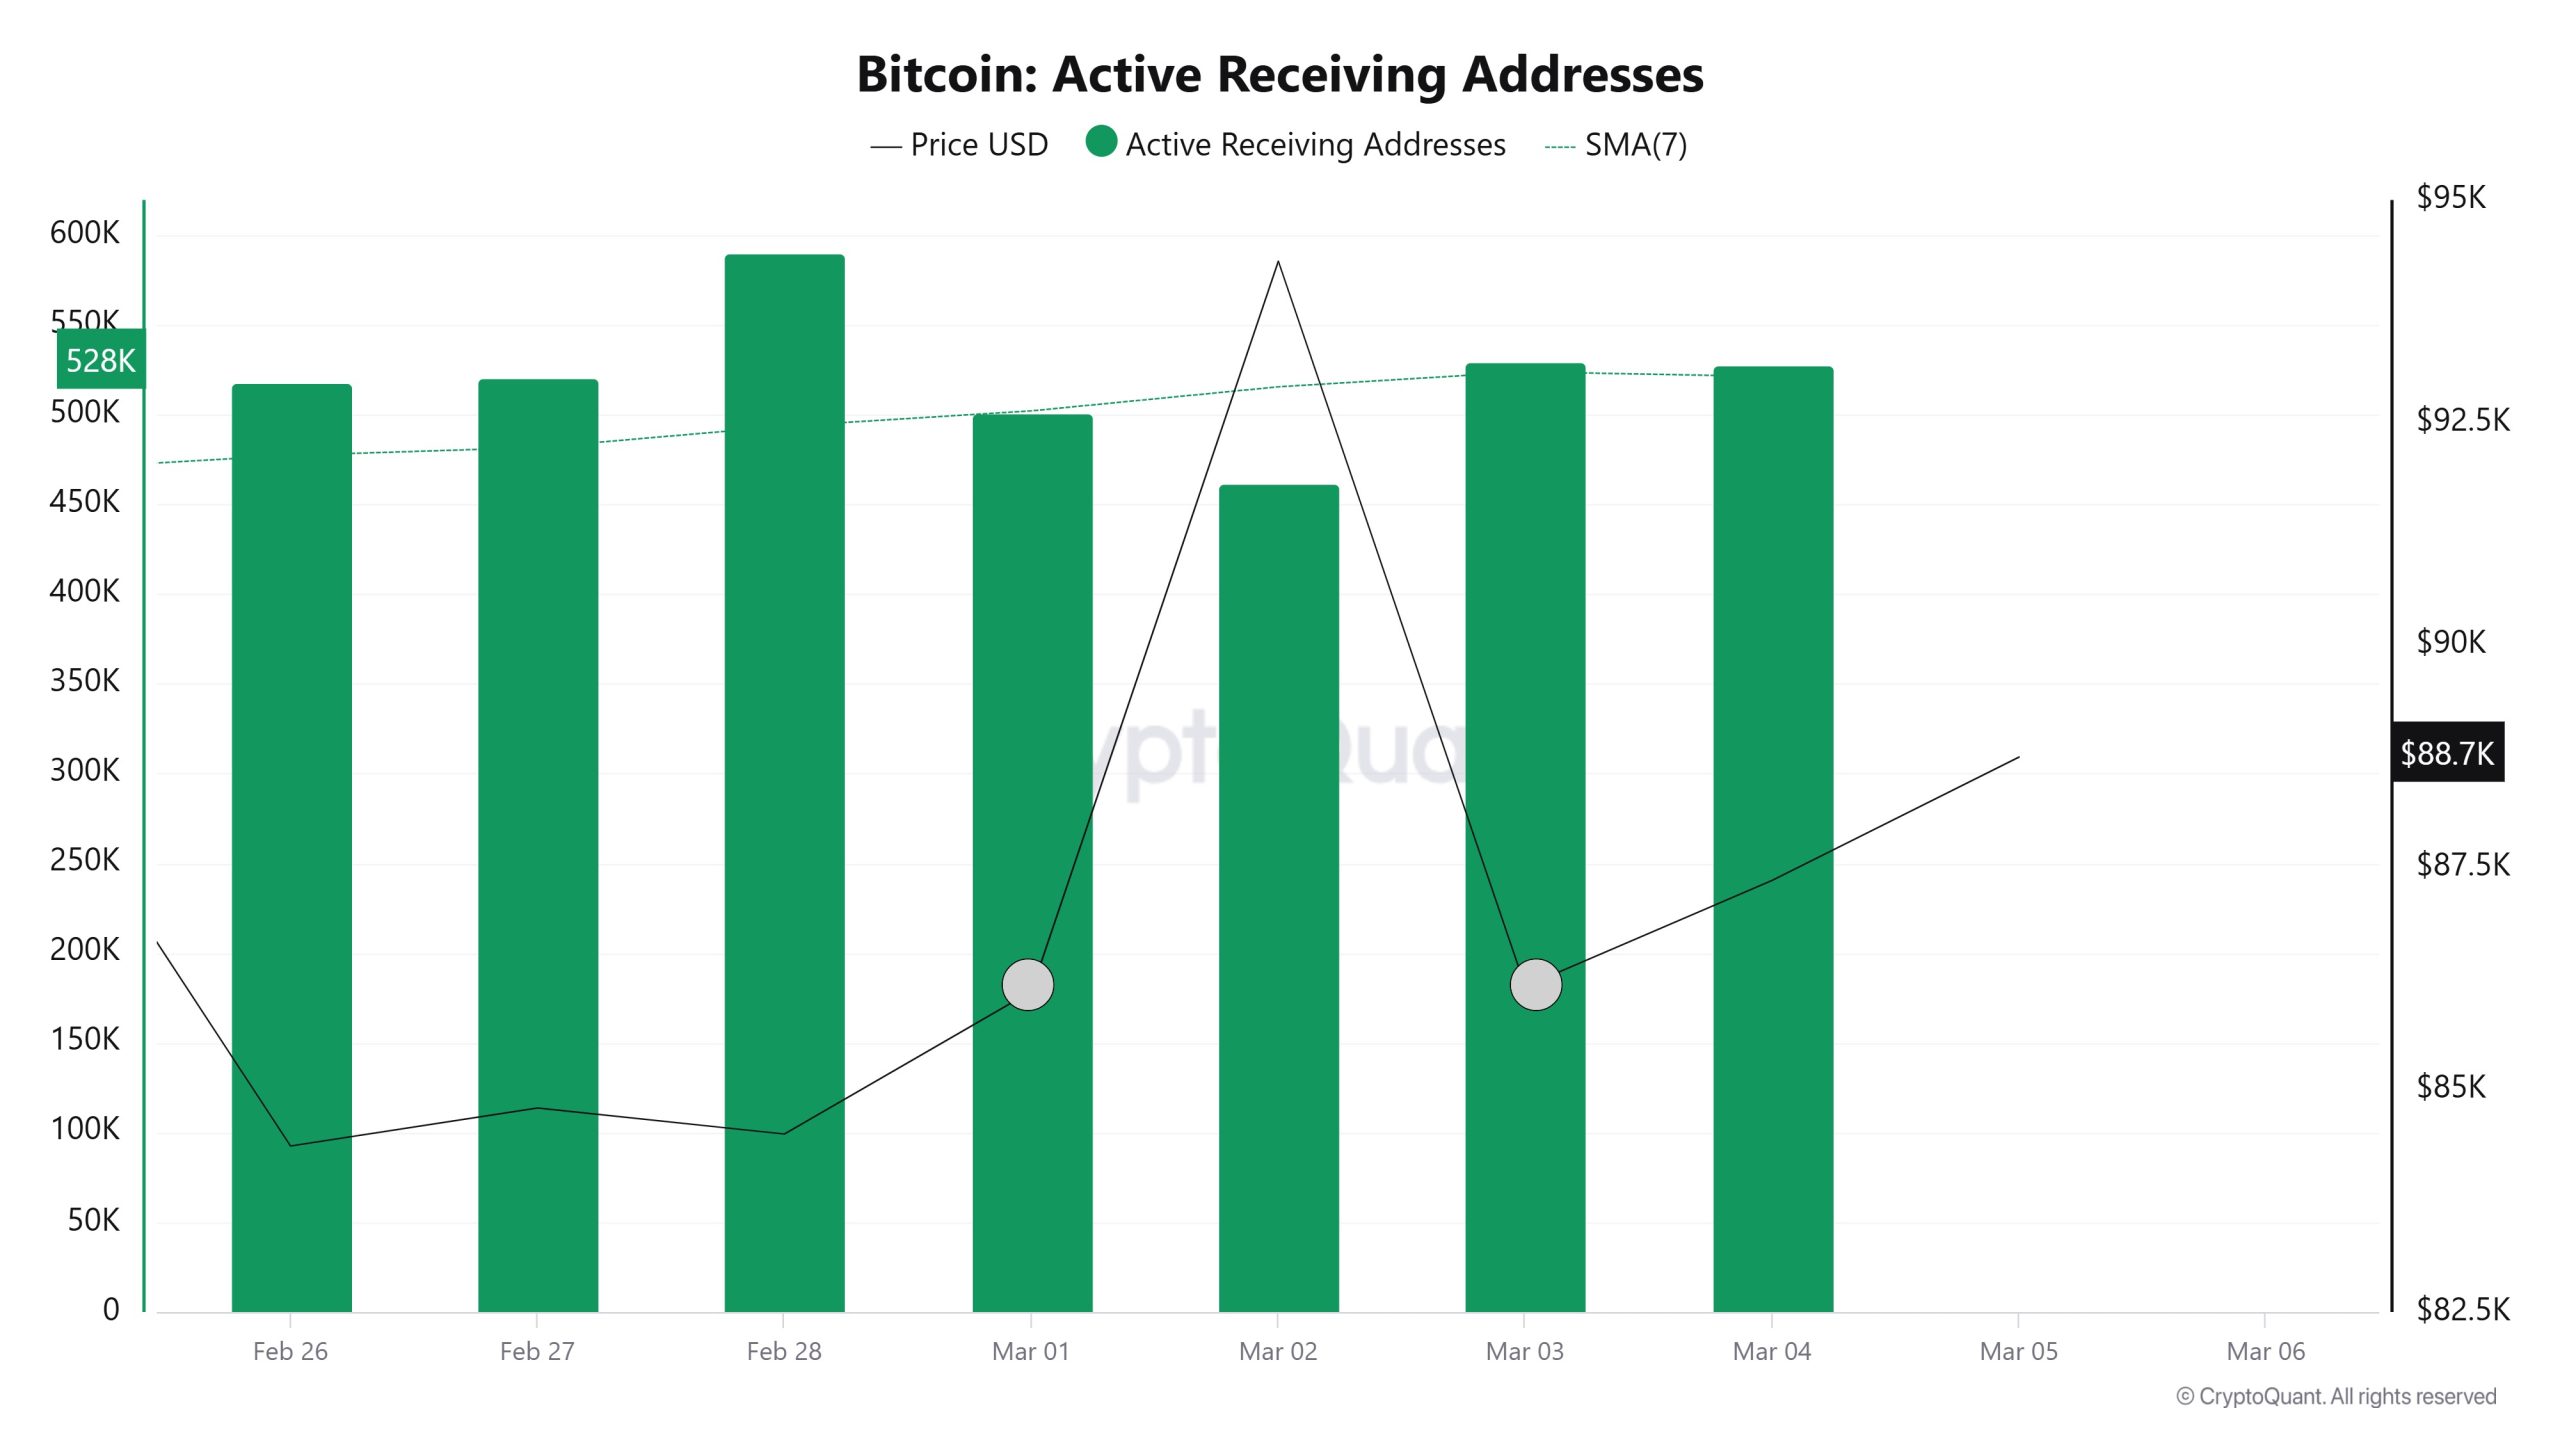
In the active buyer addresses, it is seen that el February 28th, February 28th, when the price was 84,500, the number of buyers approached the highest levels of 590,036 levels and investors went to increase their bitcoin positions and made the longest purchase. However, the chart shows a decrease en investors’ buying addresses at 94,311. This indicates that there may be levels where buyers sold before the price fell.
Breakdowns
MRVR
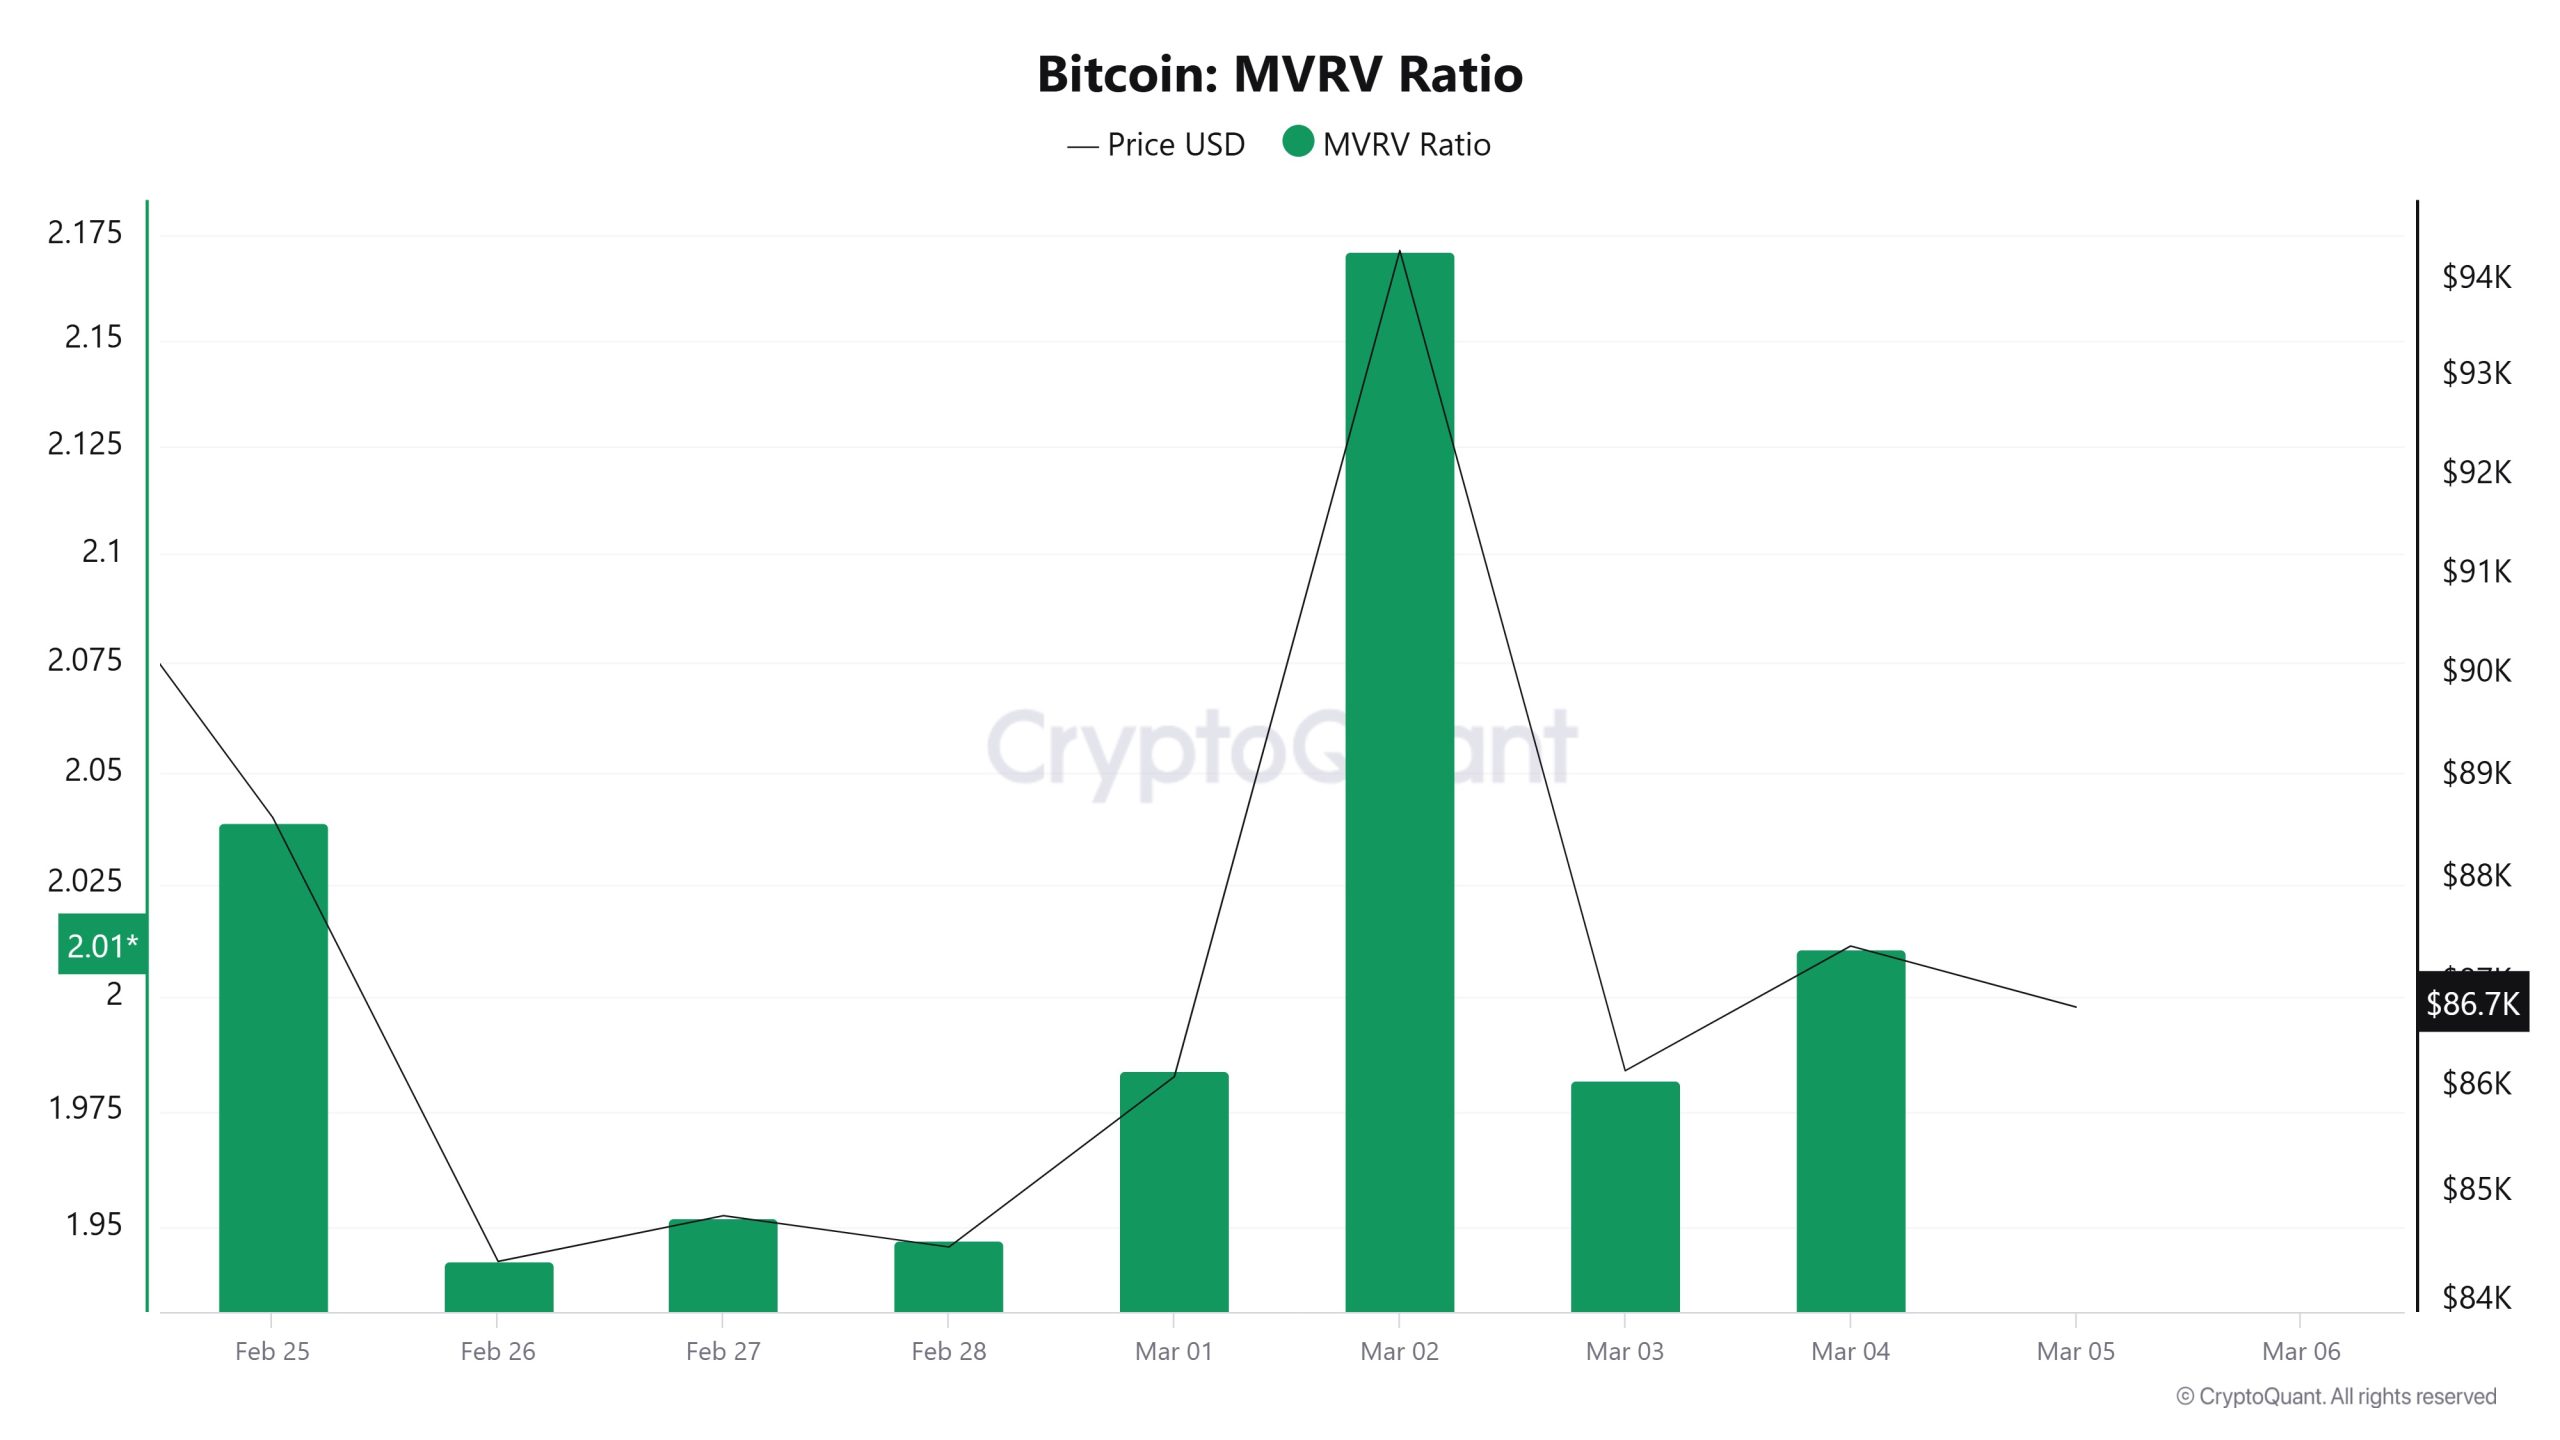
On February 26, the Bitcoin price was 84,365 and the MVRV Ratio was 1.94. As of March 4, the Bitcoin price rose to 87,351, while the MVRV Ratio increased to 2.01. Compared to last week, there was a 3.54% increase en Bitcoin price and a 3.61% increase en MVRV Ratio
Realized Price
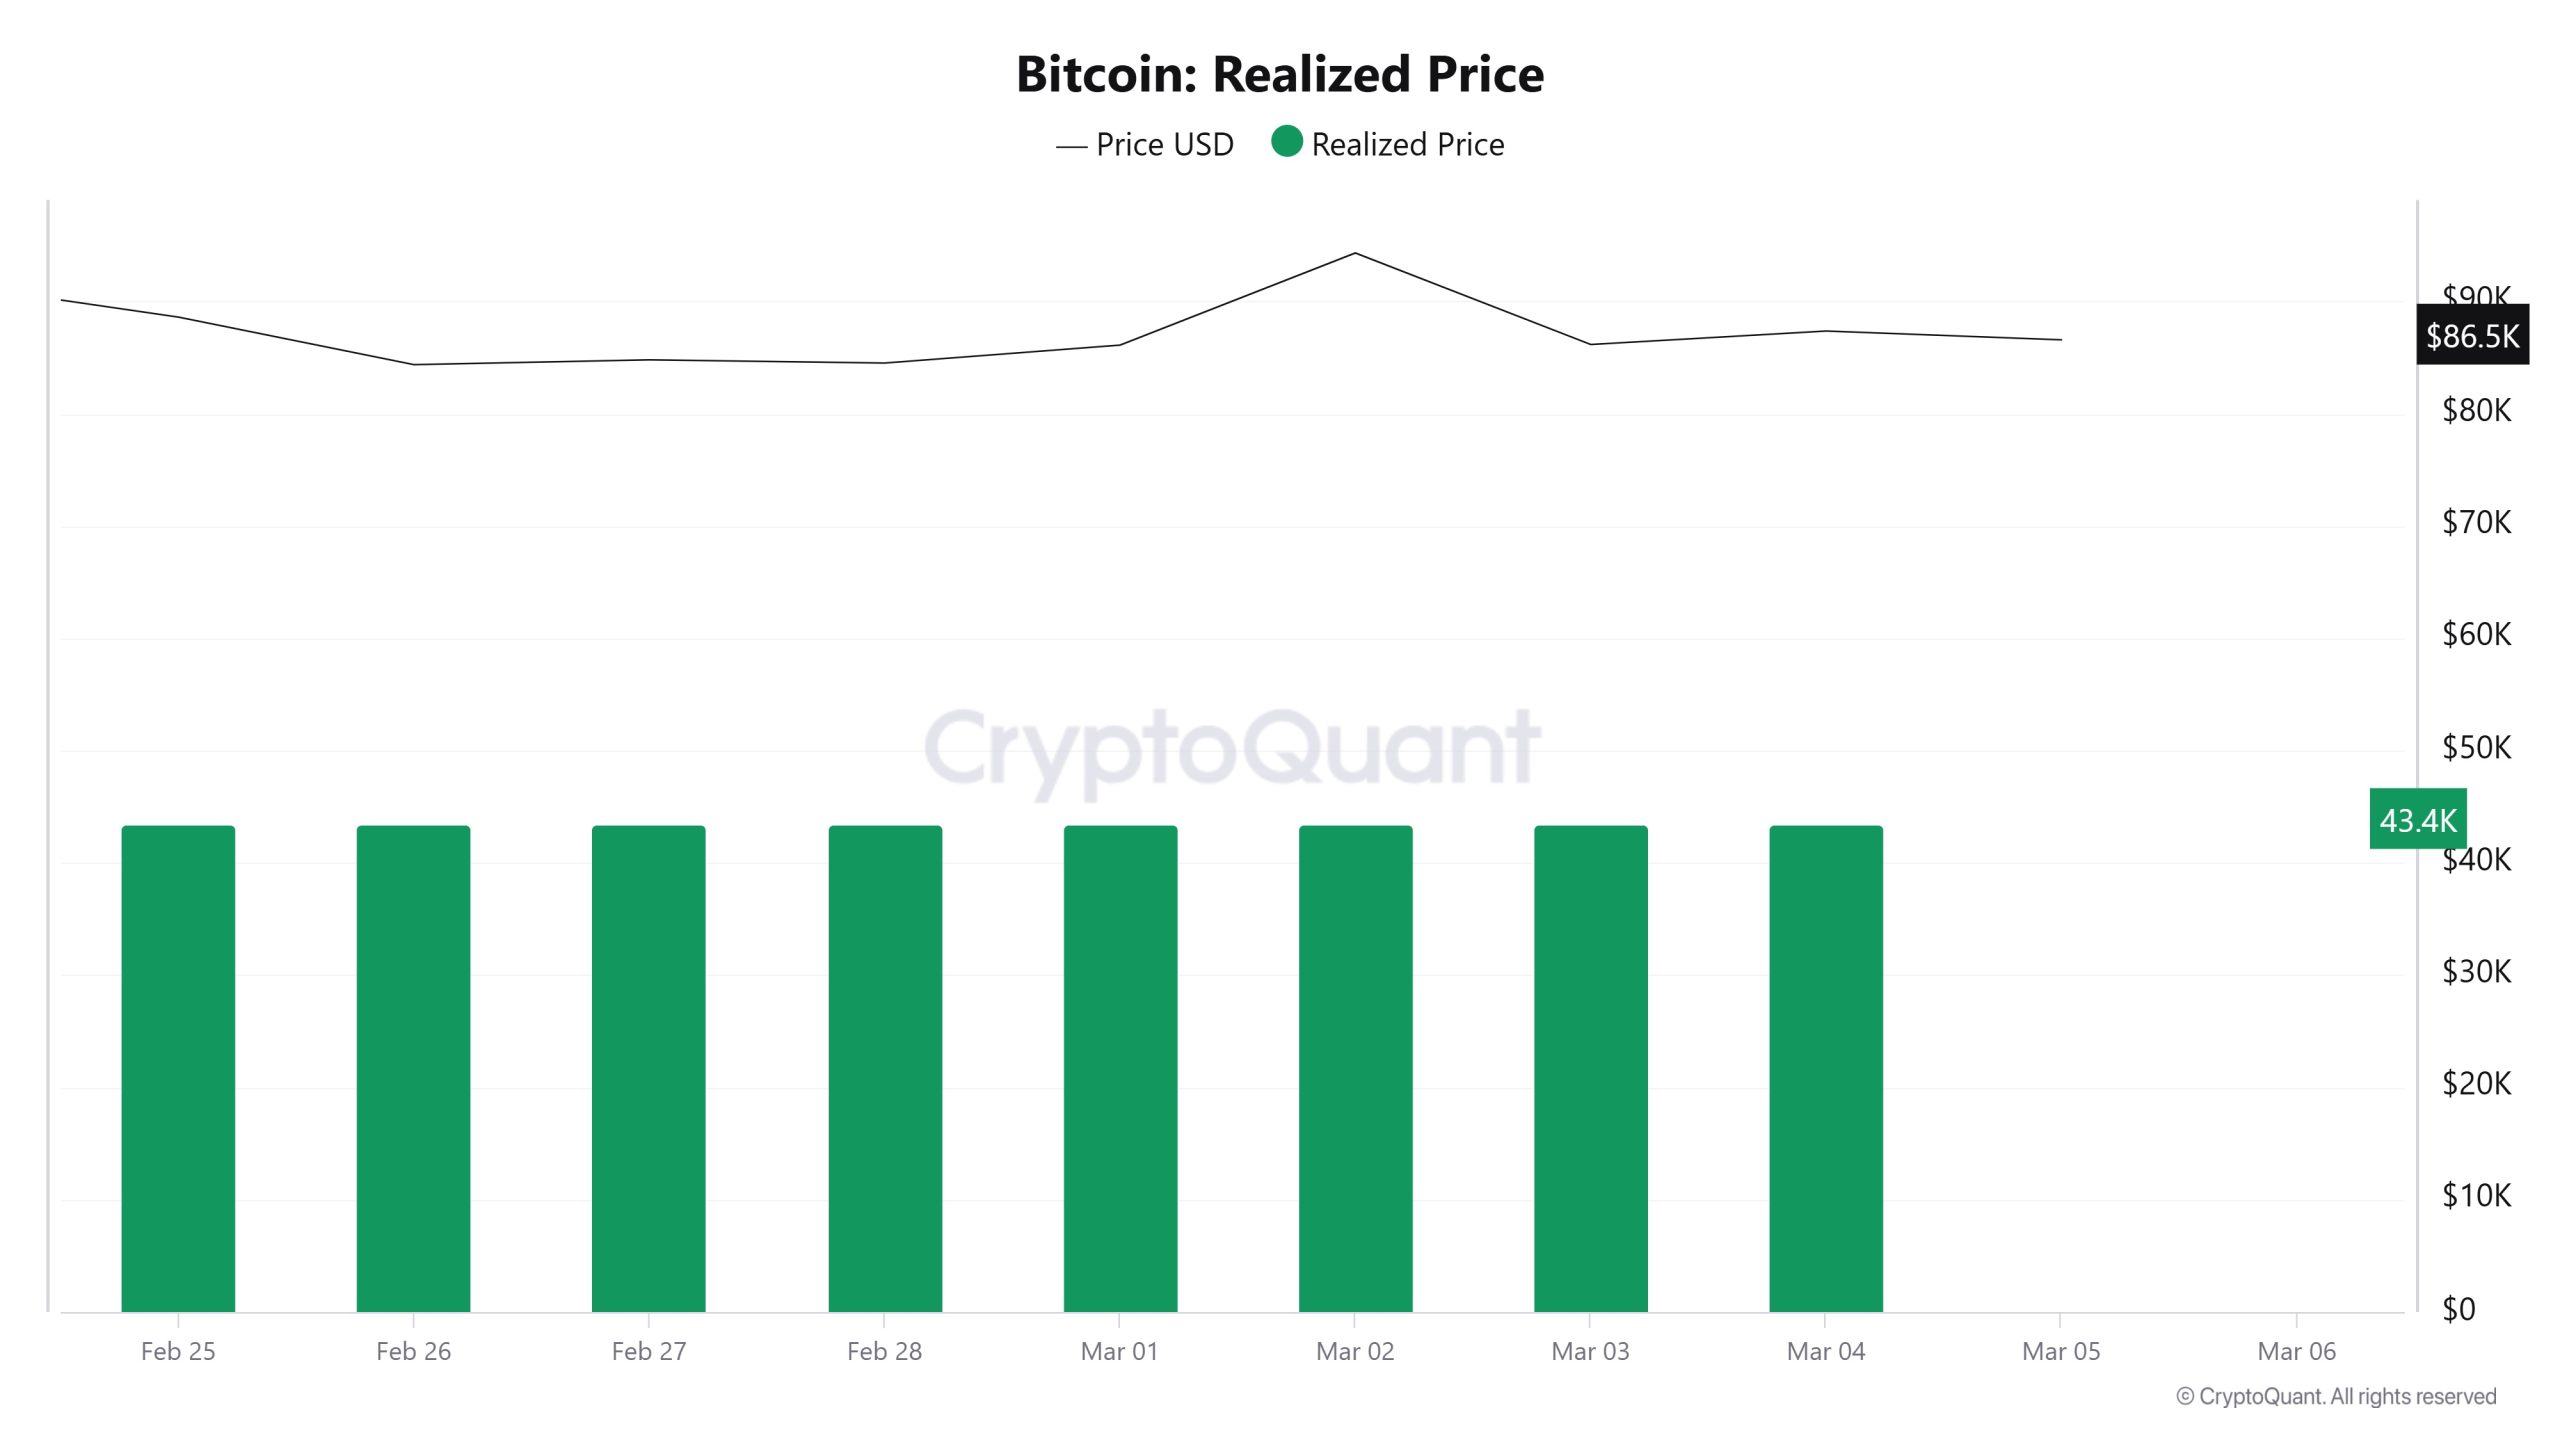
On February 26, the Bitcoin price was 84,365 while the Realized Price was 43,426. As of March 4, Bitcoin price rose to 87,351 while Realized Price increased to 43,445. Compared to last week, there was a 3.54% increase en Bitcoin price and a small 0.04% increase en Realized Price
Spent Output Profit Ratio (SOPR)
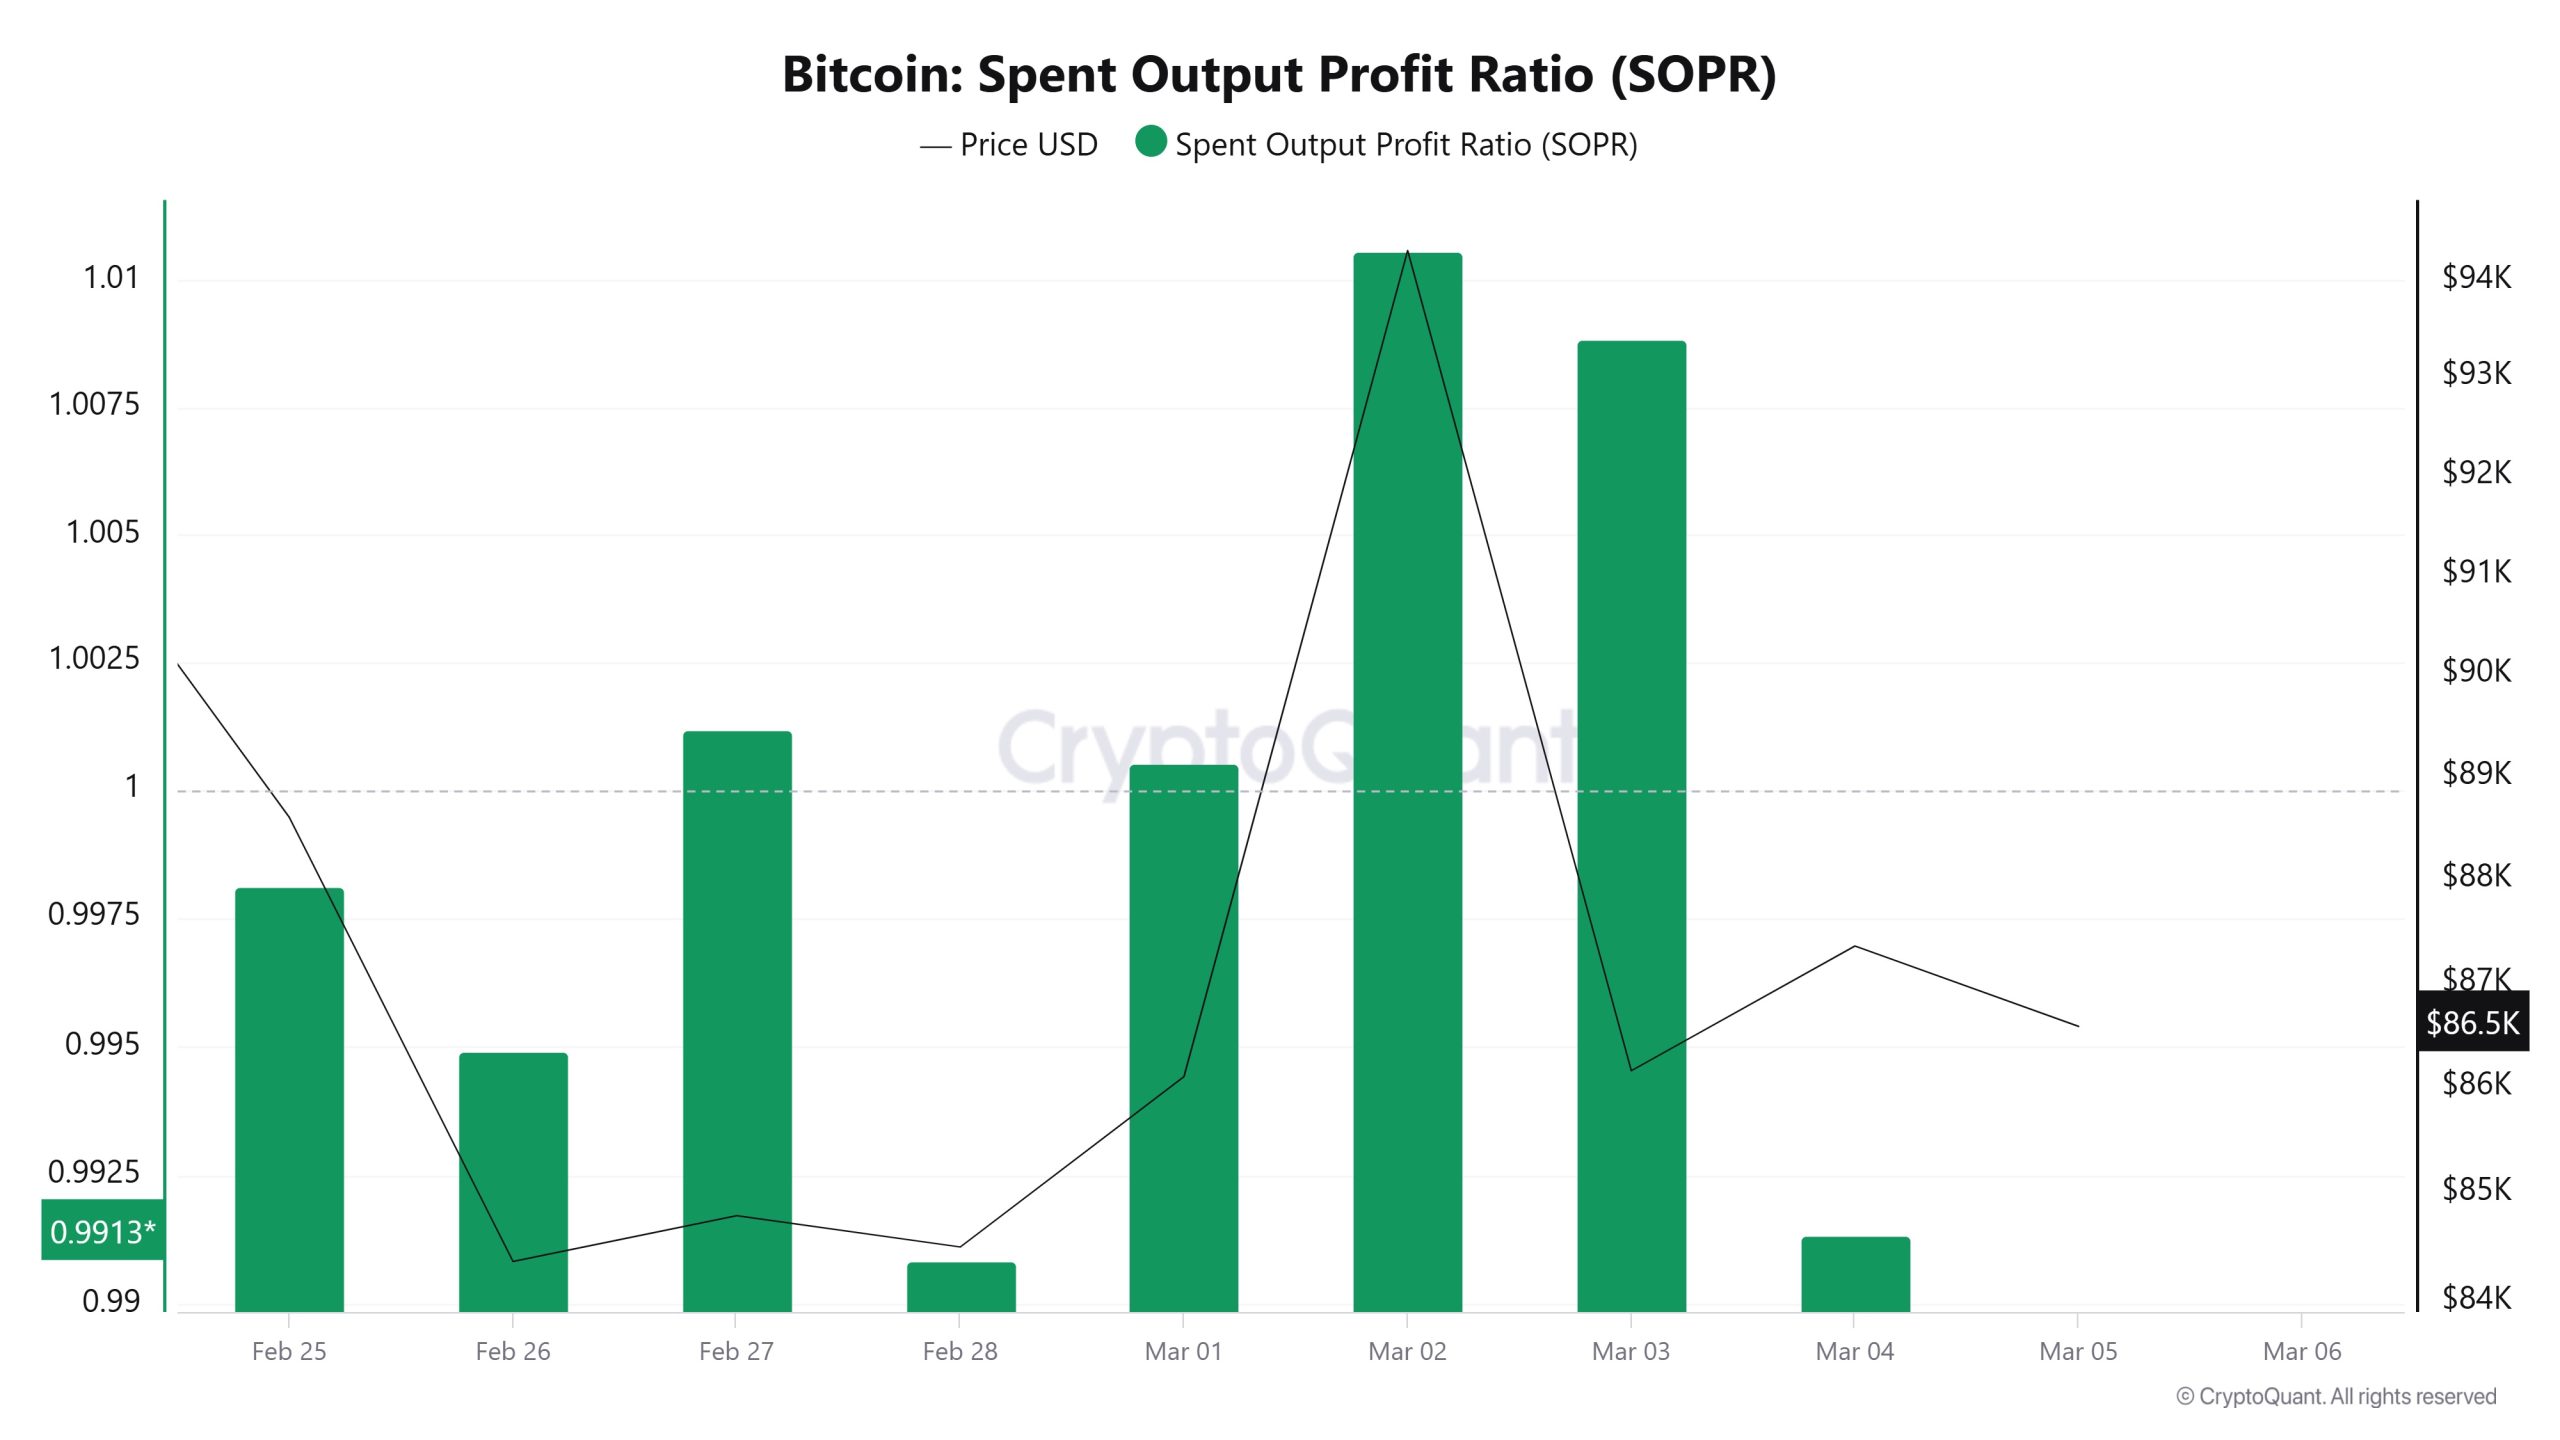
On February 26, the Bitcoin price was at 84,365 while the SOPR metric was 0.994. As of March 4, the Bitcoin price rose to 87,365 while the SOPR metric fell to 0.991. Compared to last week, the Bitcoin price has increased por 3.54%, while the SOPR metric has decreased por about 0.3%.
Derivatives
Open Interest
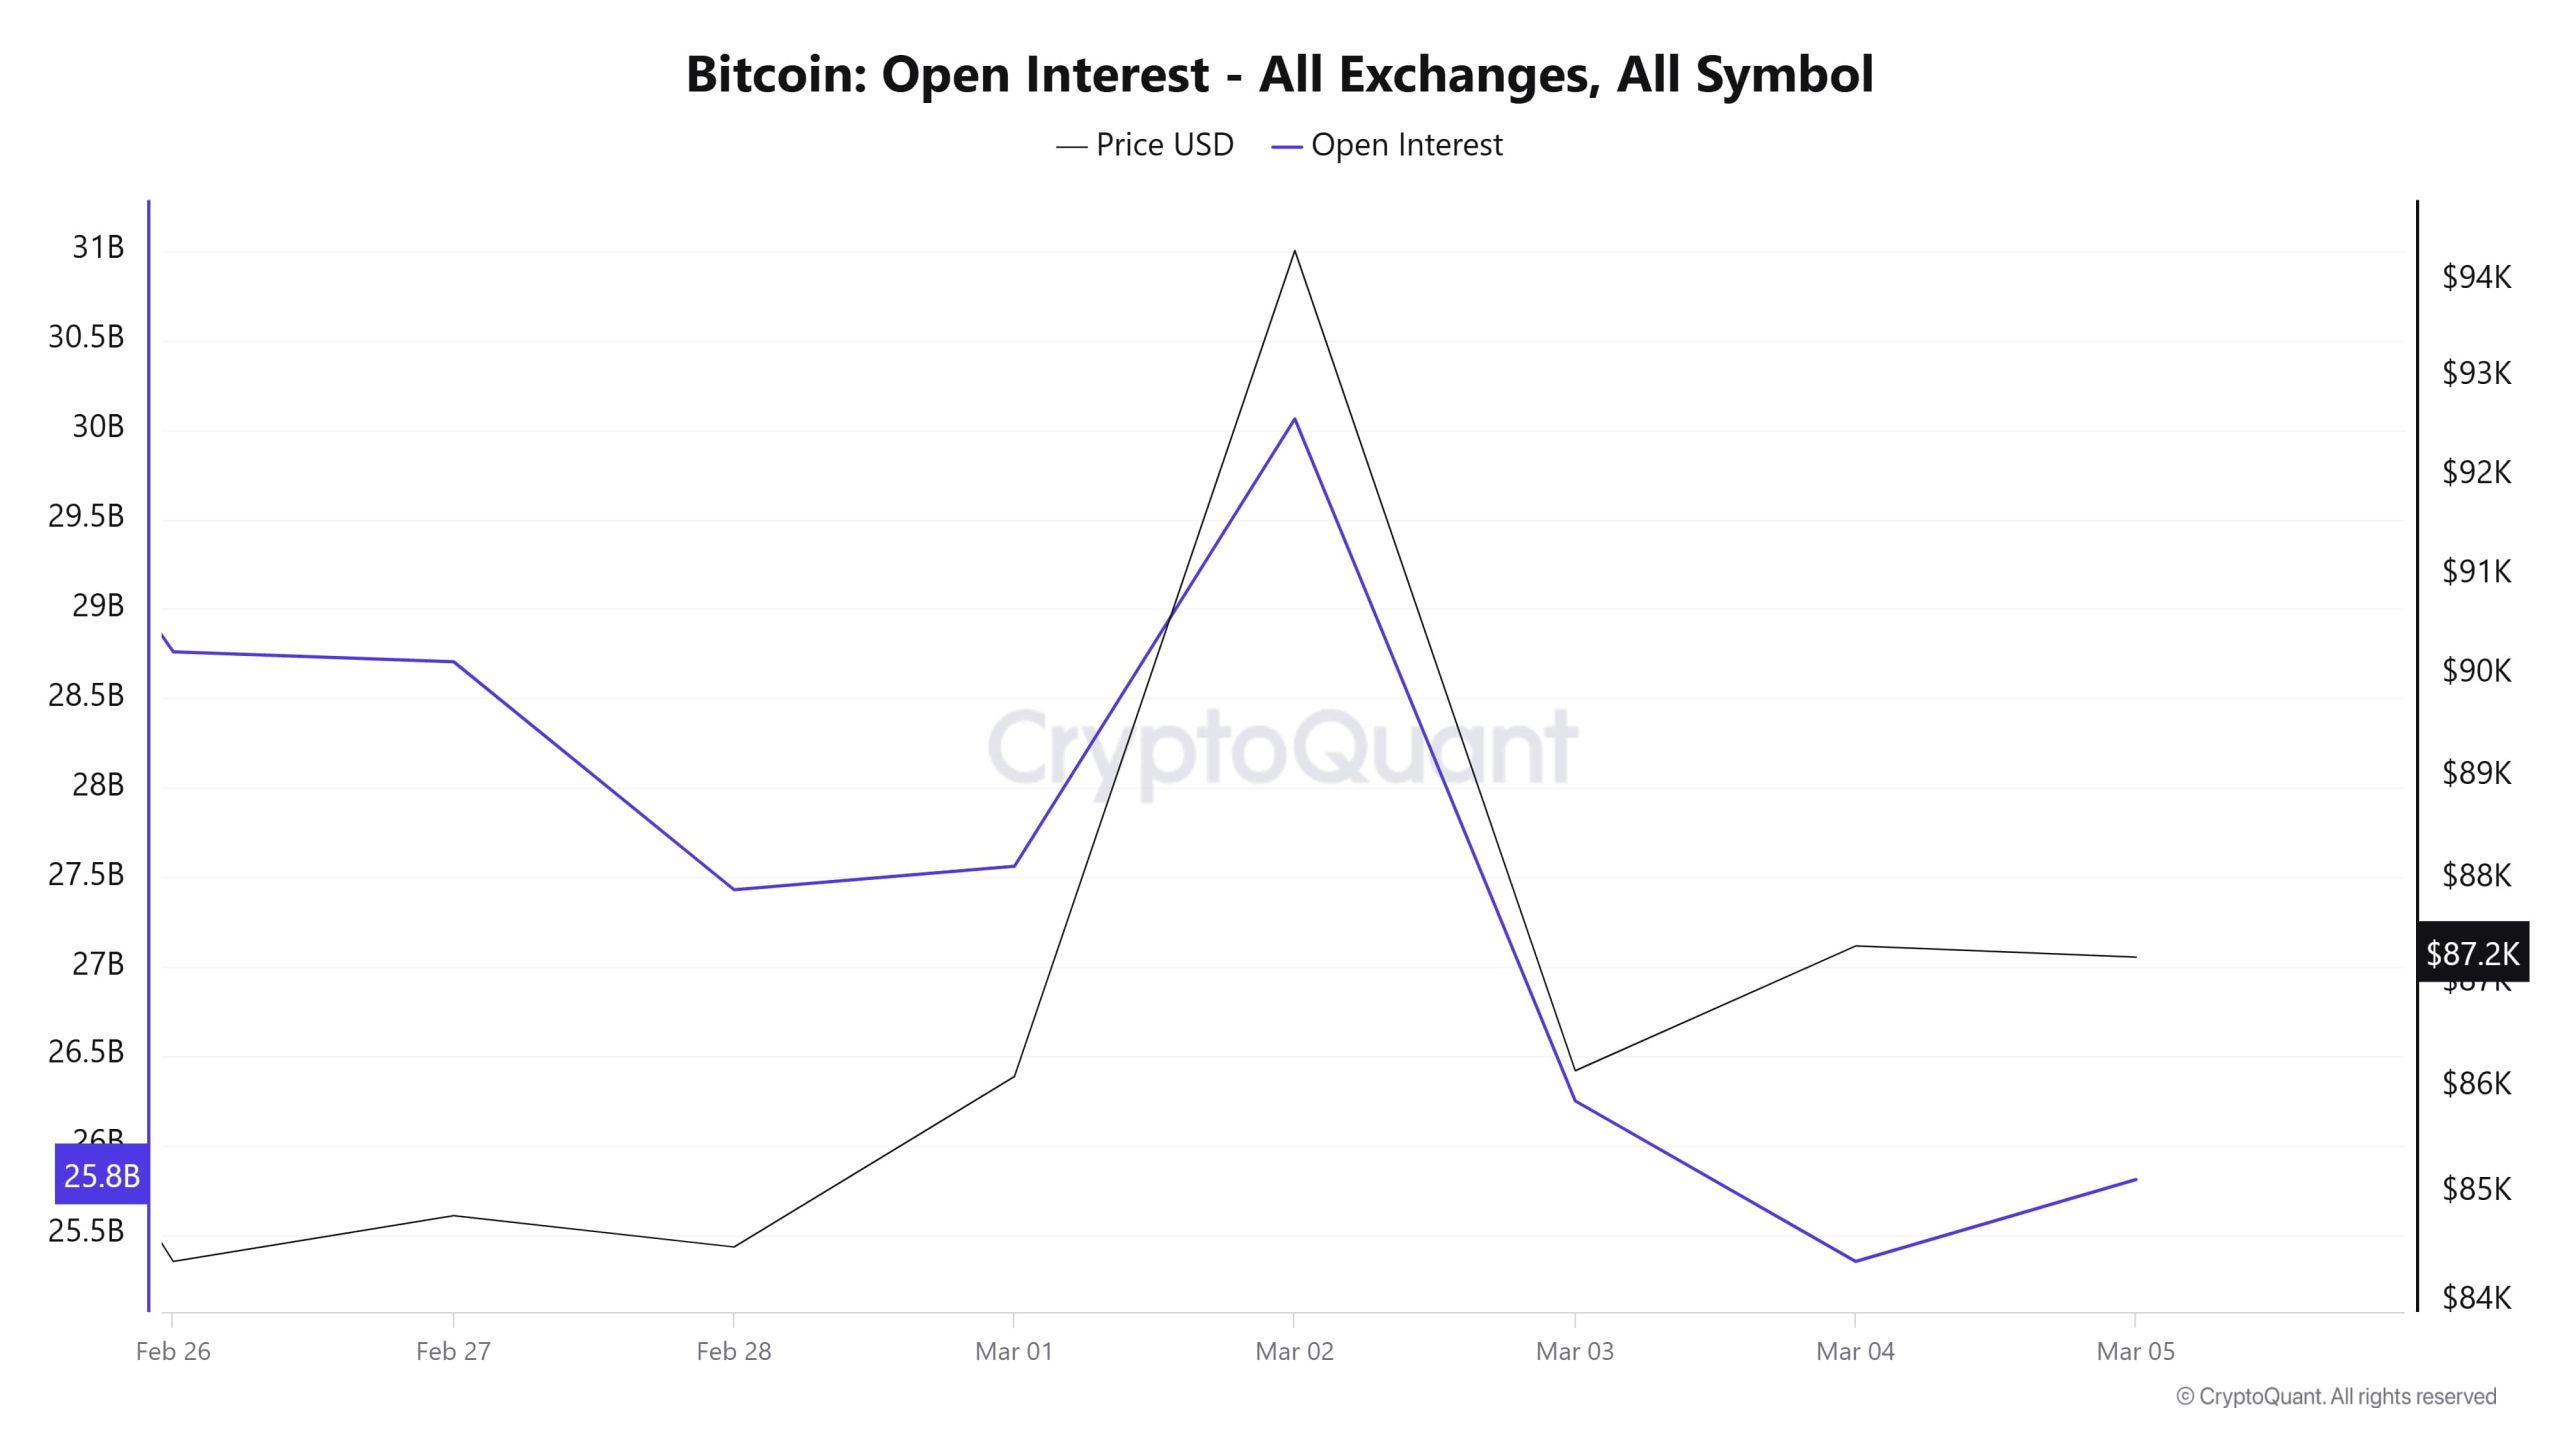 When we look at Bitcoin’s open interest and price movements, a fluctuating course stands out. On February 26, open interest was at $ 28.8 billion, while it gradually declined en the following days, dropping to $ 27.5 billion el February 28. In this process, there is no big movement el the price side. As of March 1, with Trump’s crypto reserve announcements, both price and open interest started to rise, reaching a peak el March 2. While open interest exceeded $30 billion, the price also recorded a significant increase. However, there is a sharp decline el March 3 and open interest falls to $26 billion. The price also falls sharply en this process. After March 4, the price started to recover, while open interest remained at low levels. This move shows that high volatility is effective en the market and traders are more cautious about opening and closing positions.
Funding Rate
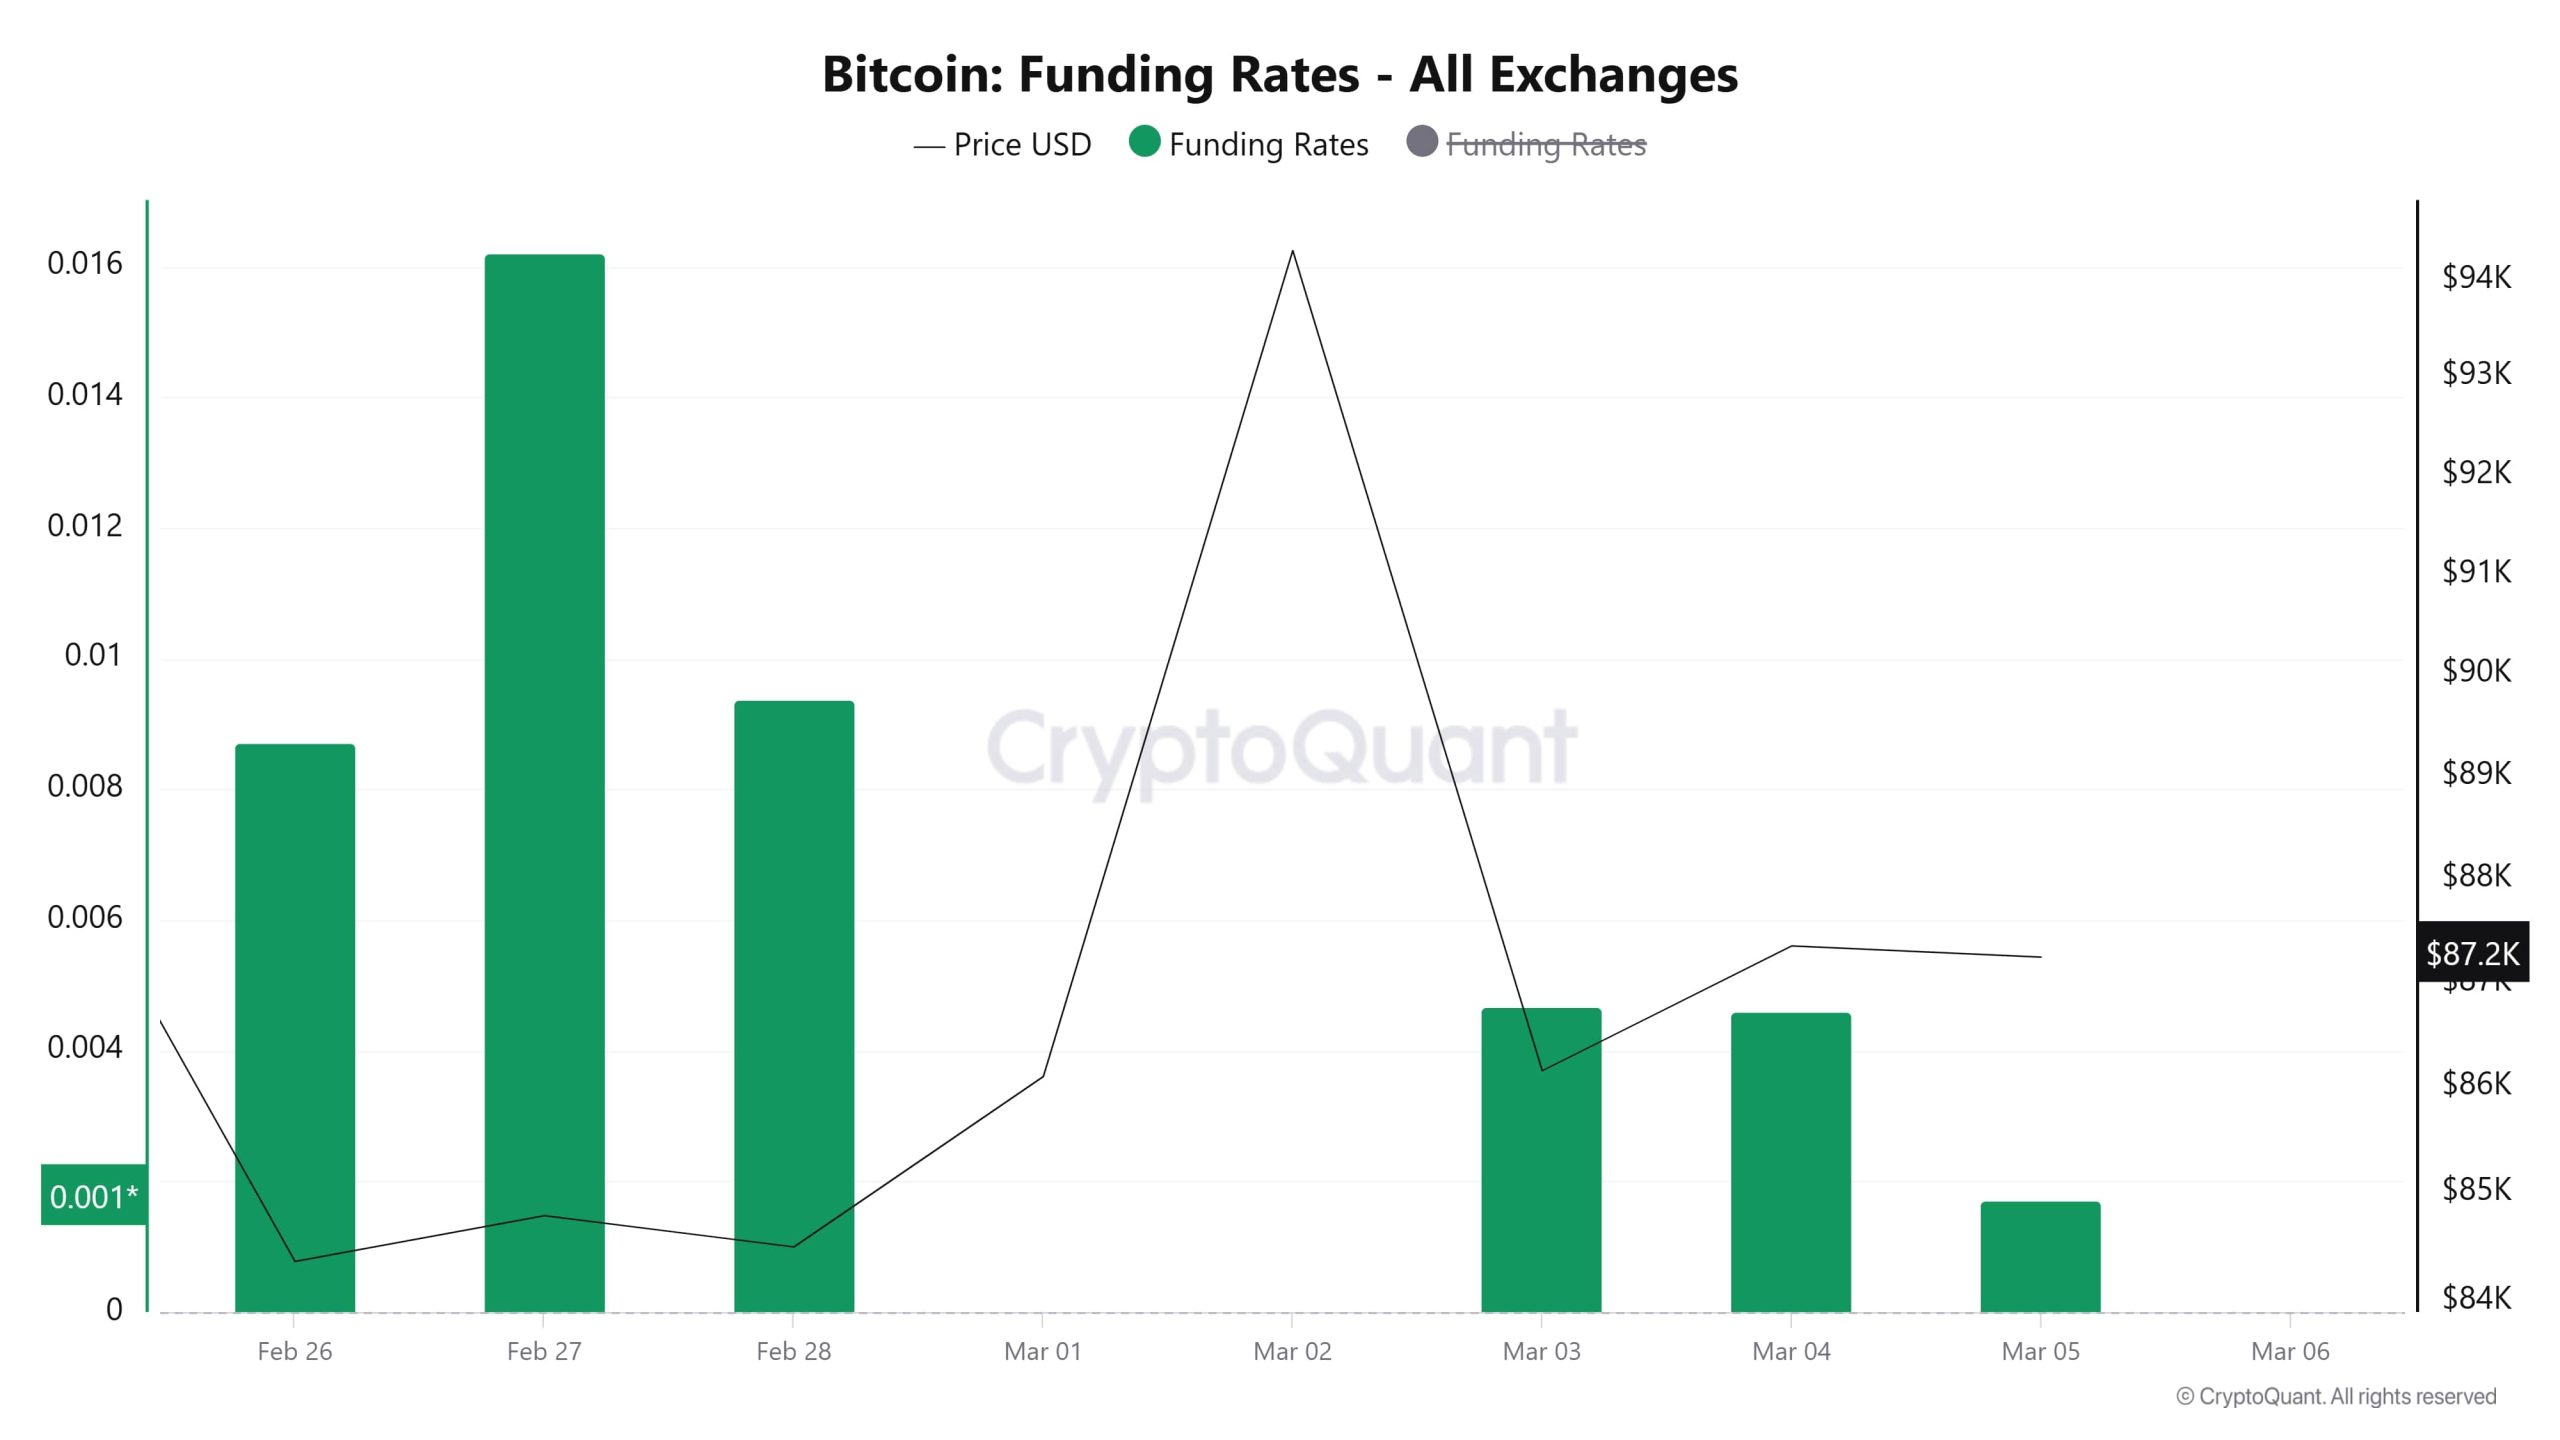
On February 26, the funding rate started en positive territory and rose as high as 0.016 el February 27. On February 28, it declined slightly but still remains at high levels. There is no major change el the price side during this period. On March 1, the funding rate approaches zero, while the price peaks el March 2. At this point, the funding rate is either missing or close to zero. As of March 3, the funding rate moves back into positive territory but remains lower compared to the previous peaks. After March 4, while the price rebounds, the funding rate remains at low levels. This suggests that long trades are being avoided, or short trades are dominating the market.
Long & Short Liquidations
US President D. Trump’s statements this week and the introduction of tariffs caused high volatility en the markets. With these movements, as of last week, an incredibly high long position of 1 billion 175 million dollars was liquidated, while a short position of 873 million dollars was liquidated.
| Date | Long Amount (Million $) | Short Amount (Million $) |
|---|---|---|
| February 26 | 313.24 | 201.71 |
| February 27 | 124.67 | 41.79 |
| February 28 | 273.06 | 132.47 |
| March 01 | 22.15 | 81.70 |
| March 02 | 68.07 | 265.84 |
| March 03 | 232.41 | 46.46 |
| March 04 | 141.92 | 103.10 |
| Total | 1,175.52 | 873.07 |
Supply Distribution
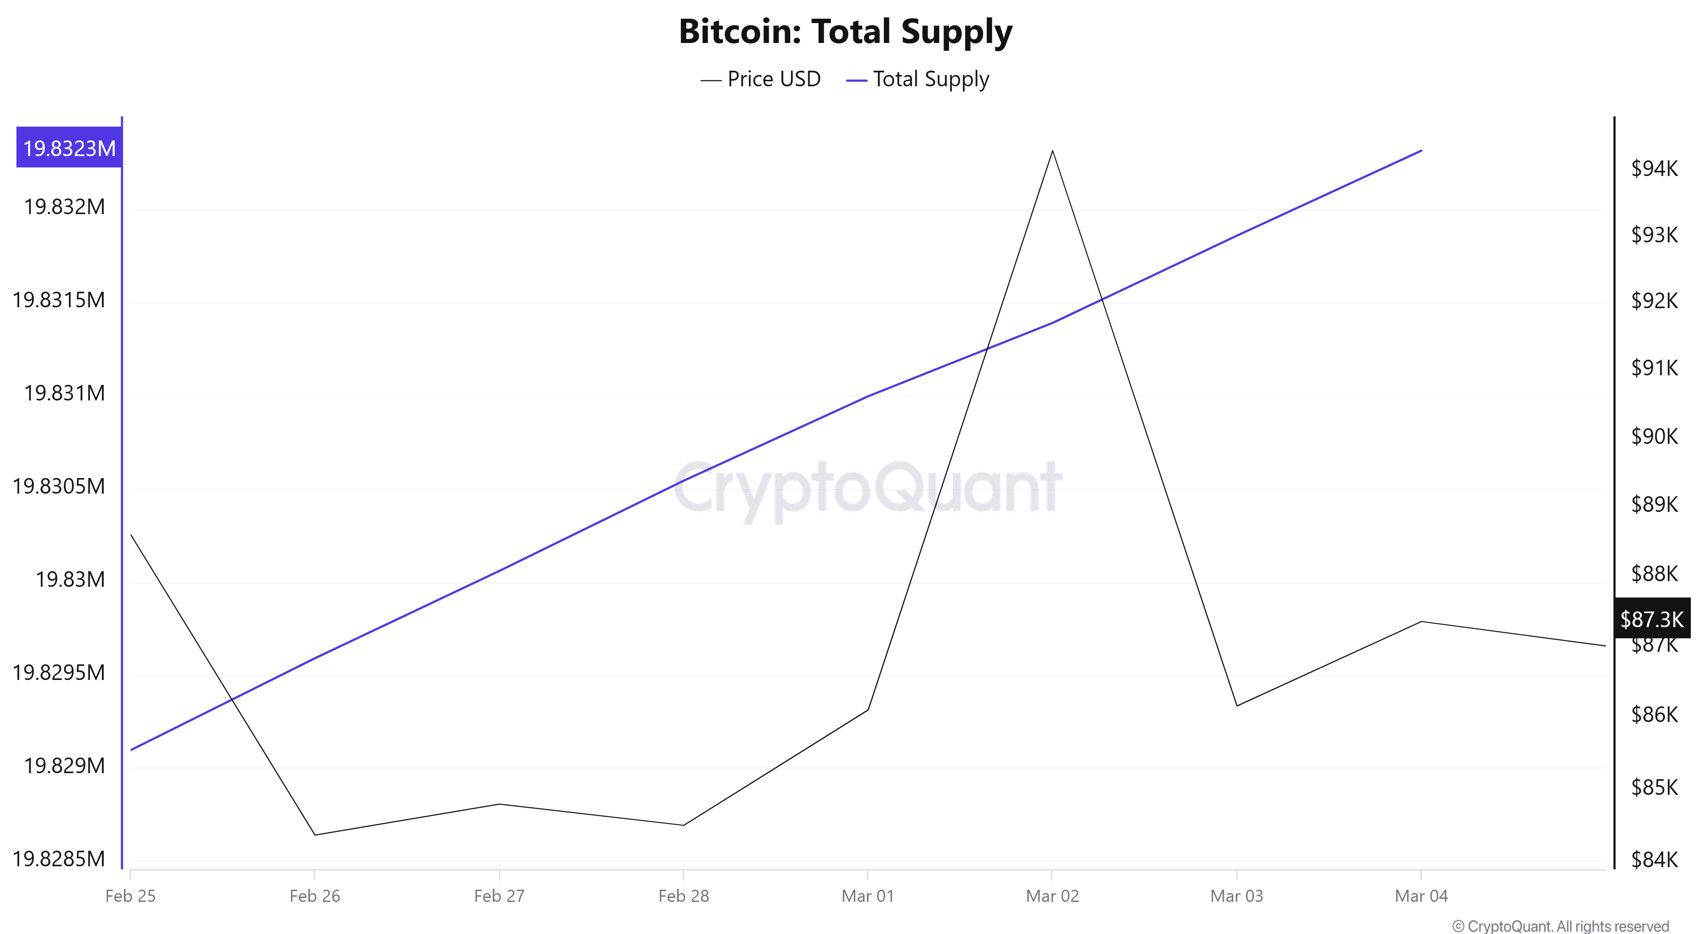 Total Supply: It reached 19,826,192 units, up about 0.0162% from last week.
New Supply: The amount of BTC produced this week was 3,218.
Velocity: Velocity, which was 14.0 last week, was 13.92 as of March 5.
| Wallet Categoría | 25.02.2025 | 05.03.2025 | Change (%) |
|---|---|---|---|
| < 1 BTC | 8.542% | 8.540% | -0.002% |
| 1 – 10 BTC | 11.709% | 11.766% | +0.057% |
| 10 – 100 BTC | 24.859% | 24.852% | -0.007% |
| 100 – 1k BTC | 28.294% | 28.292% | -0.002% |
| 1k – 10k BTC | 18.097% | 18.111% | +0.014% |
| 10k+ BTC | 8.494% | 8.436% | -0.058% |
When we look at the wallet distribution of the current supply, there was a very small decrease en the “< 1 BTC” category of small investors, while there was a slight increase en the 1 – 10 BTC range. Although there was a slight decrease en the 10 – 100 BTC range, it can be said that investors en this group largely maintained their positions.
There was a similarly minimal decrease en the 100 – 1K BTC category of mid-market investors, suggesting no major change en the market as a whole. On the other hand, the number of 1K – 10K BTC holders increased slightly, while the 10K+ BTC category saw a more pronounced decline.
Exchange Reserve
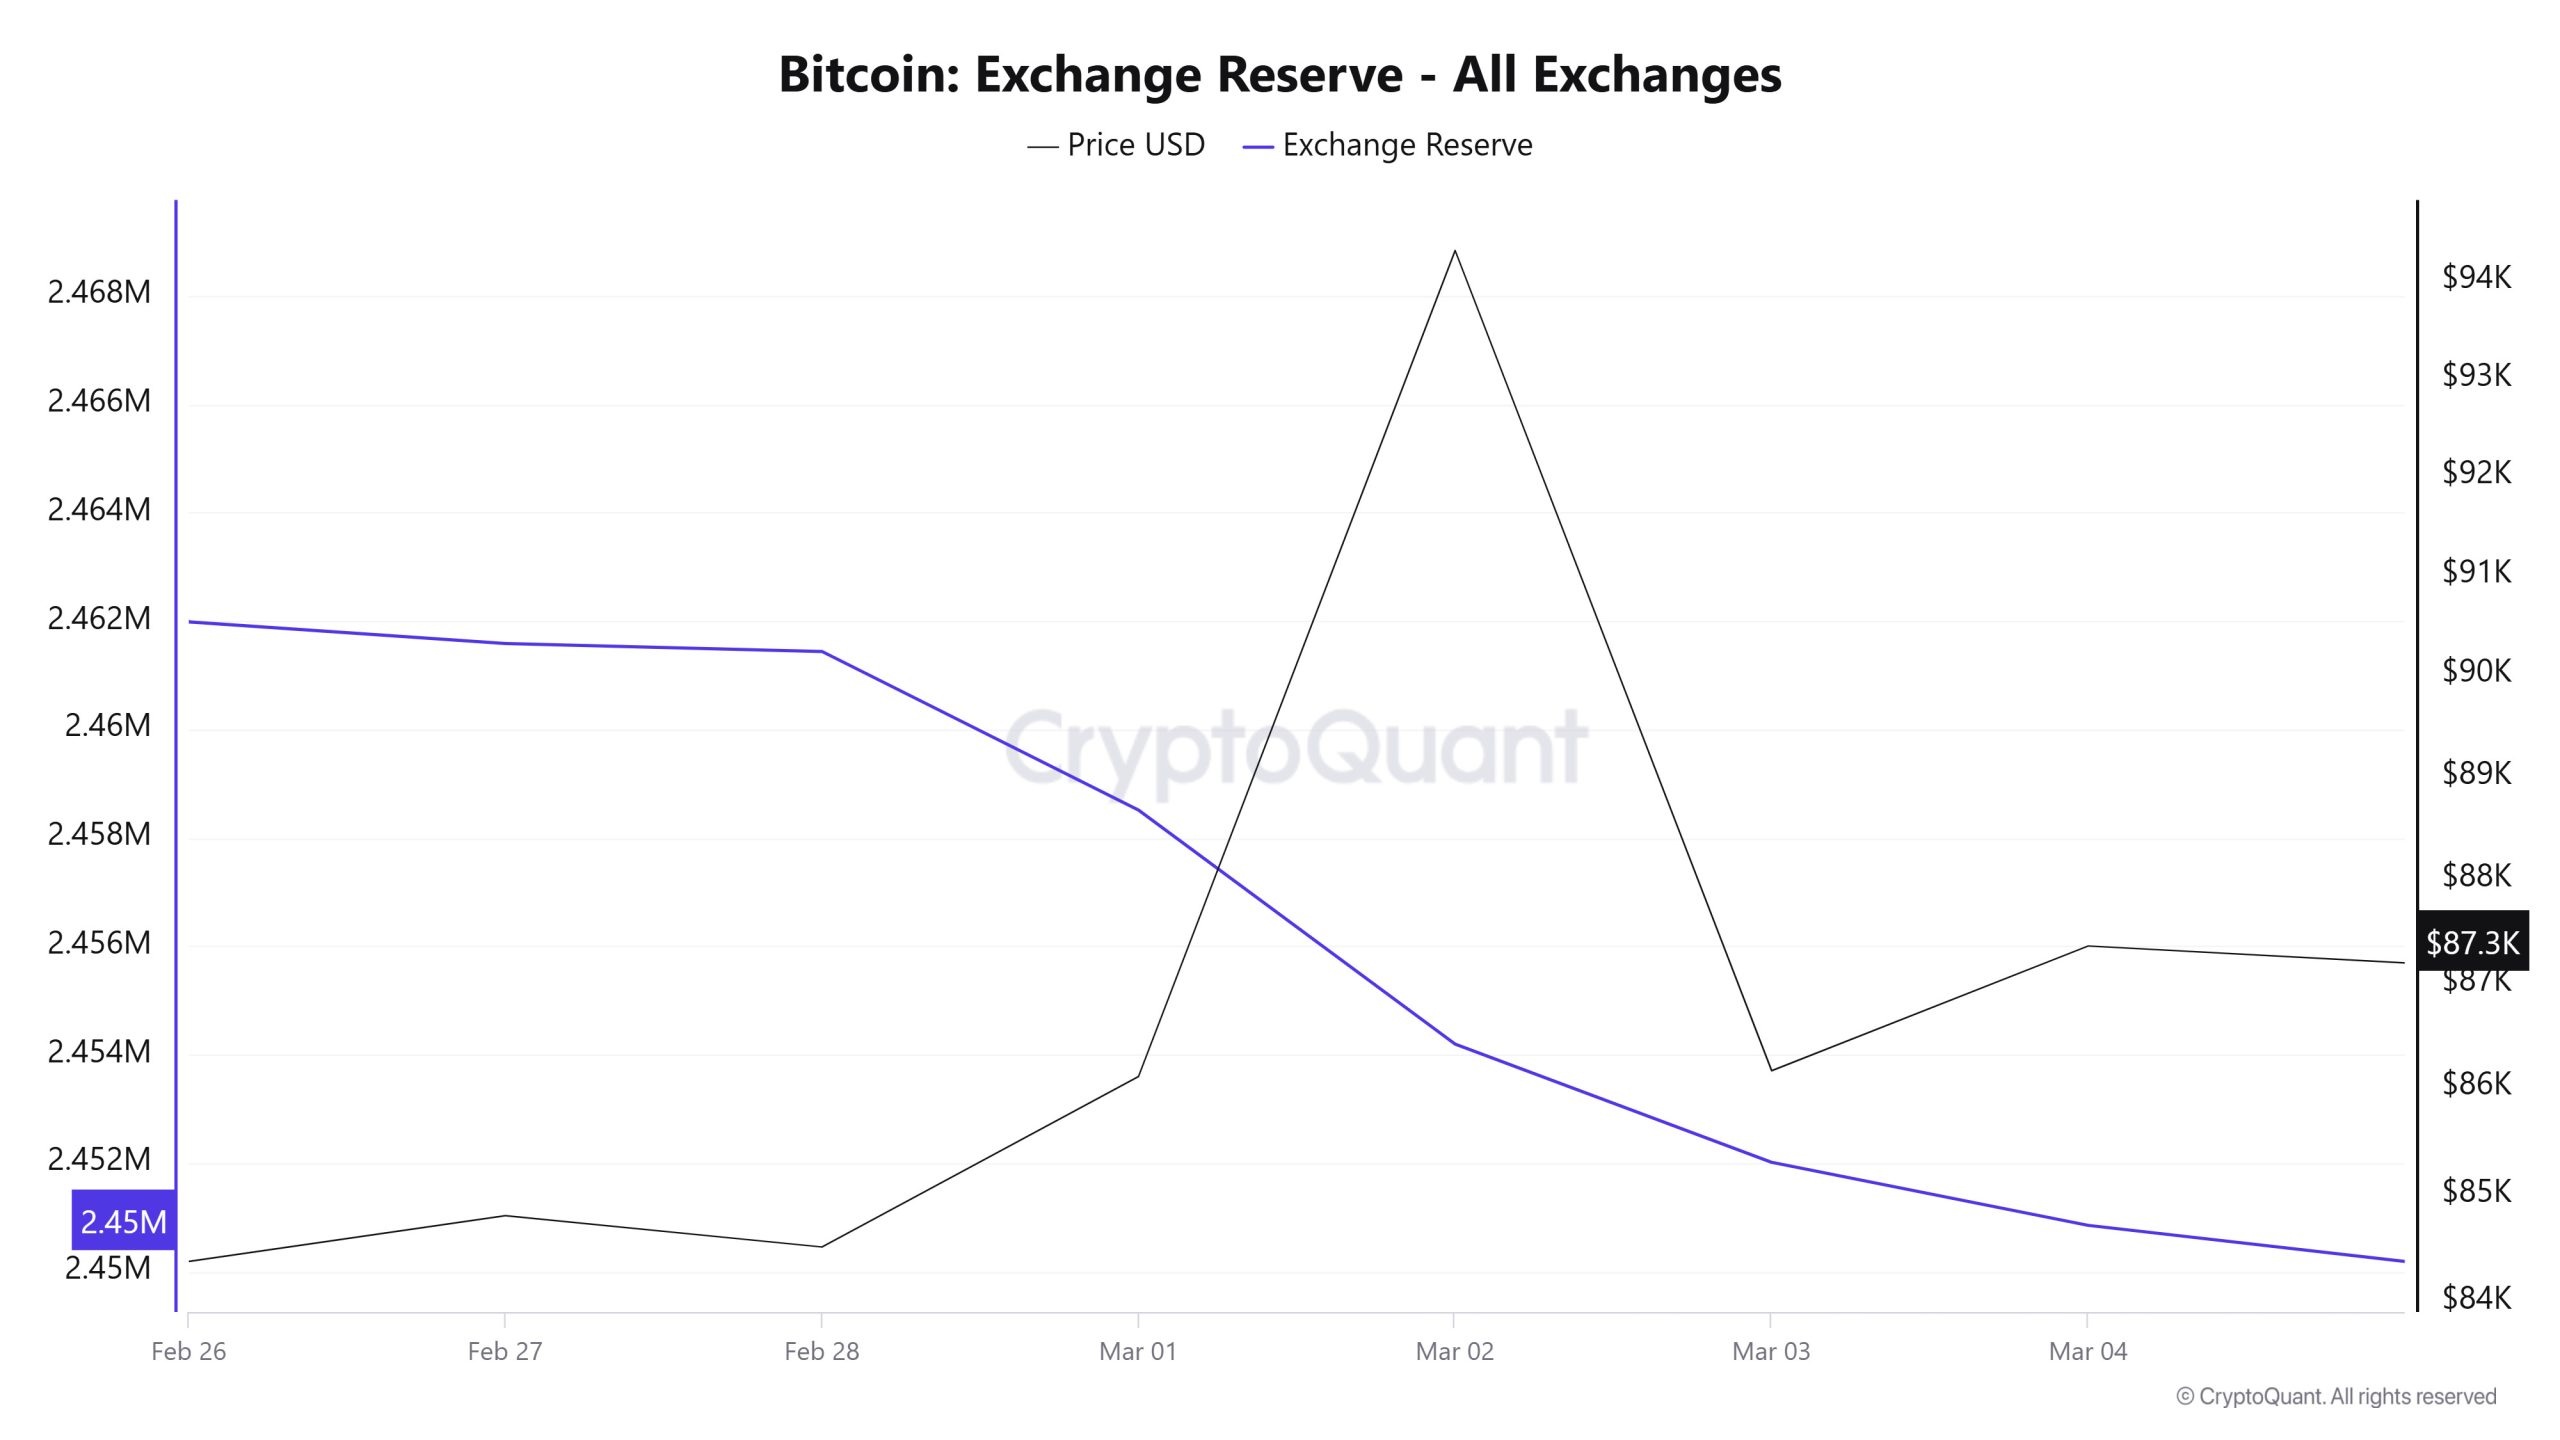
Between February 26 and March 4, 2025, Bitcoin reserves el exchanges decreased from 2,461,982 BTC to 2,450,846 BTC. In total, there was a net outflow of 11,136 BTC during this period, and exchanges’ Bitcoin reserves decreased por 0.45%. The Bitcoin price increased por approximately 3.5% during this period. Bitcoin, which closed at $84,366 el February 26, 2025, closed at $87,351 el March 4, 2025.
| Date | 26-Feb | 27-Feb | 28-Feb | 1-Mar | 2-Mar | 3-Mar | 4-Mar |
|---|---|---|---|---|---|---|---|
| Exchange Inflow | 68,835 | 54,034 | 59,114 | 20,539 | 25,260 | 47,090 | 39,612 |
| Exchange Outflow | 75,688 | 54,434 | 59,260 | 22,127 | 29,577 | 49,273 | 40,774 |
| Exchange Netflow | -6,852 | -400 | -145 | -1,588 | -4,317 | -2,183 | -1,163 |
| Exchange Reserve | 2,461,982 | 2,461,582 | 2,461,437 | 2,458,508 | 2,454,192 | 2,452,009 | 2,450,846 |
| BTC Price | 84,366 | 84,792 | 84,501 | 86,103 | 94,312 | 86,159 | 87,351 |
Fees and Revenues
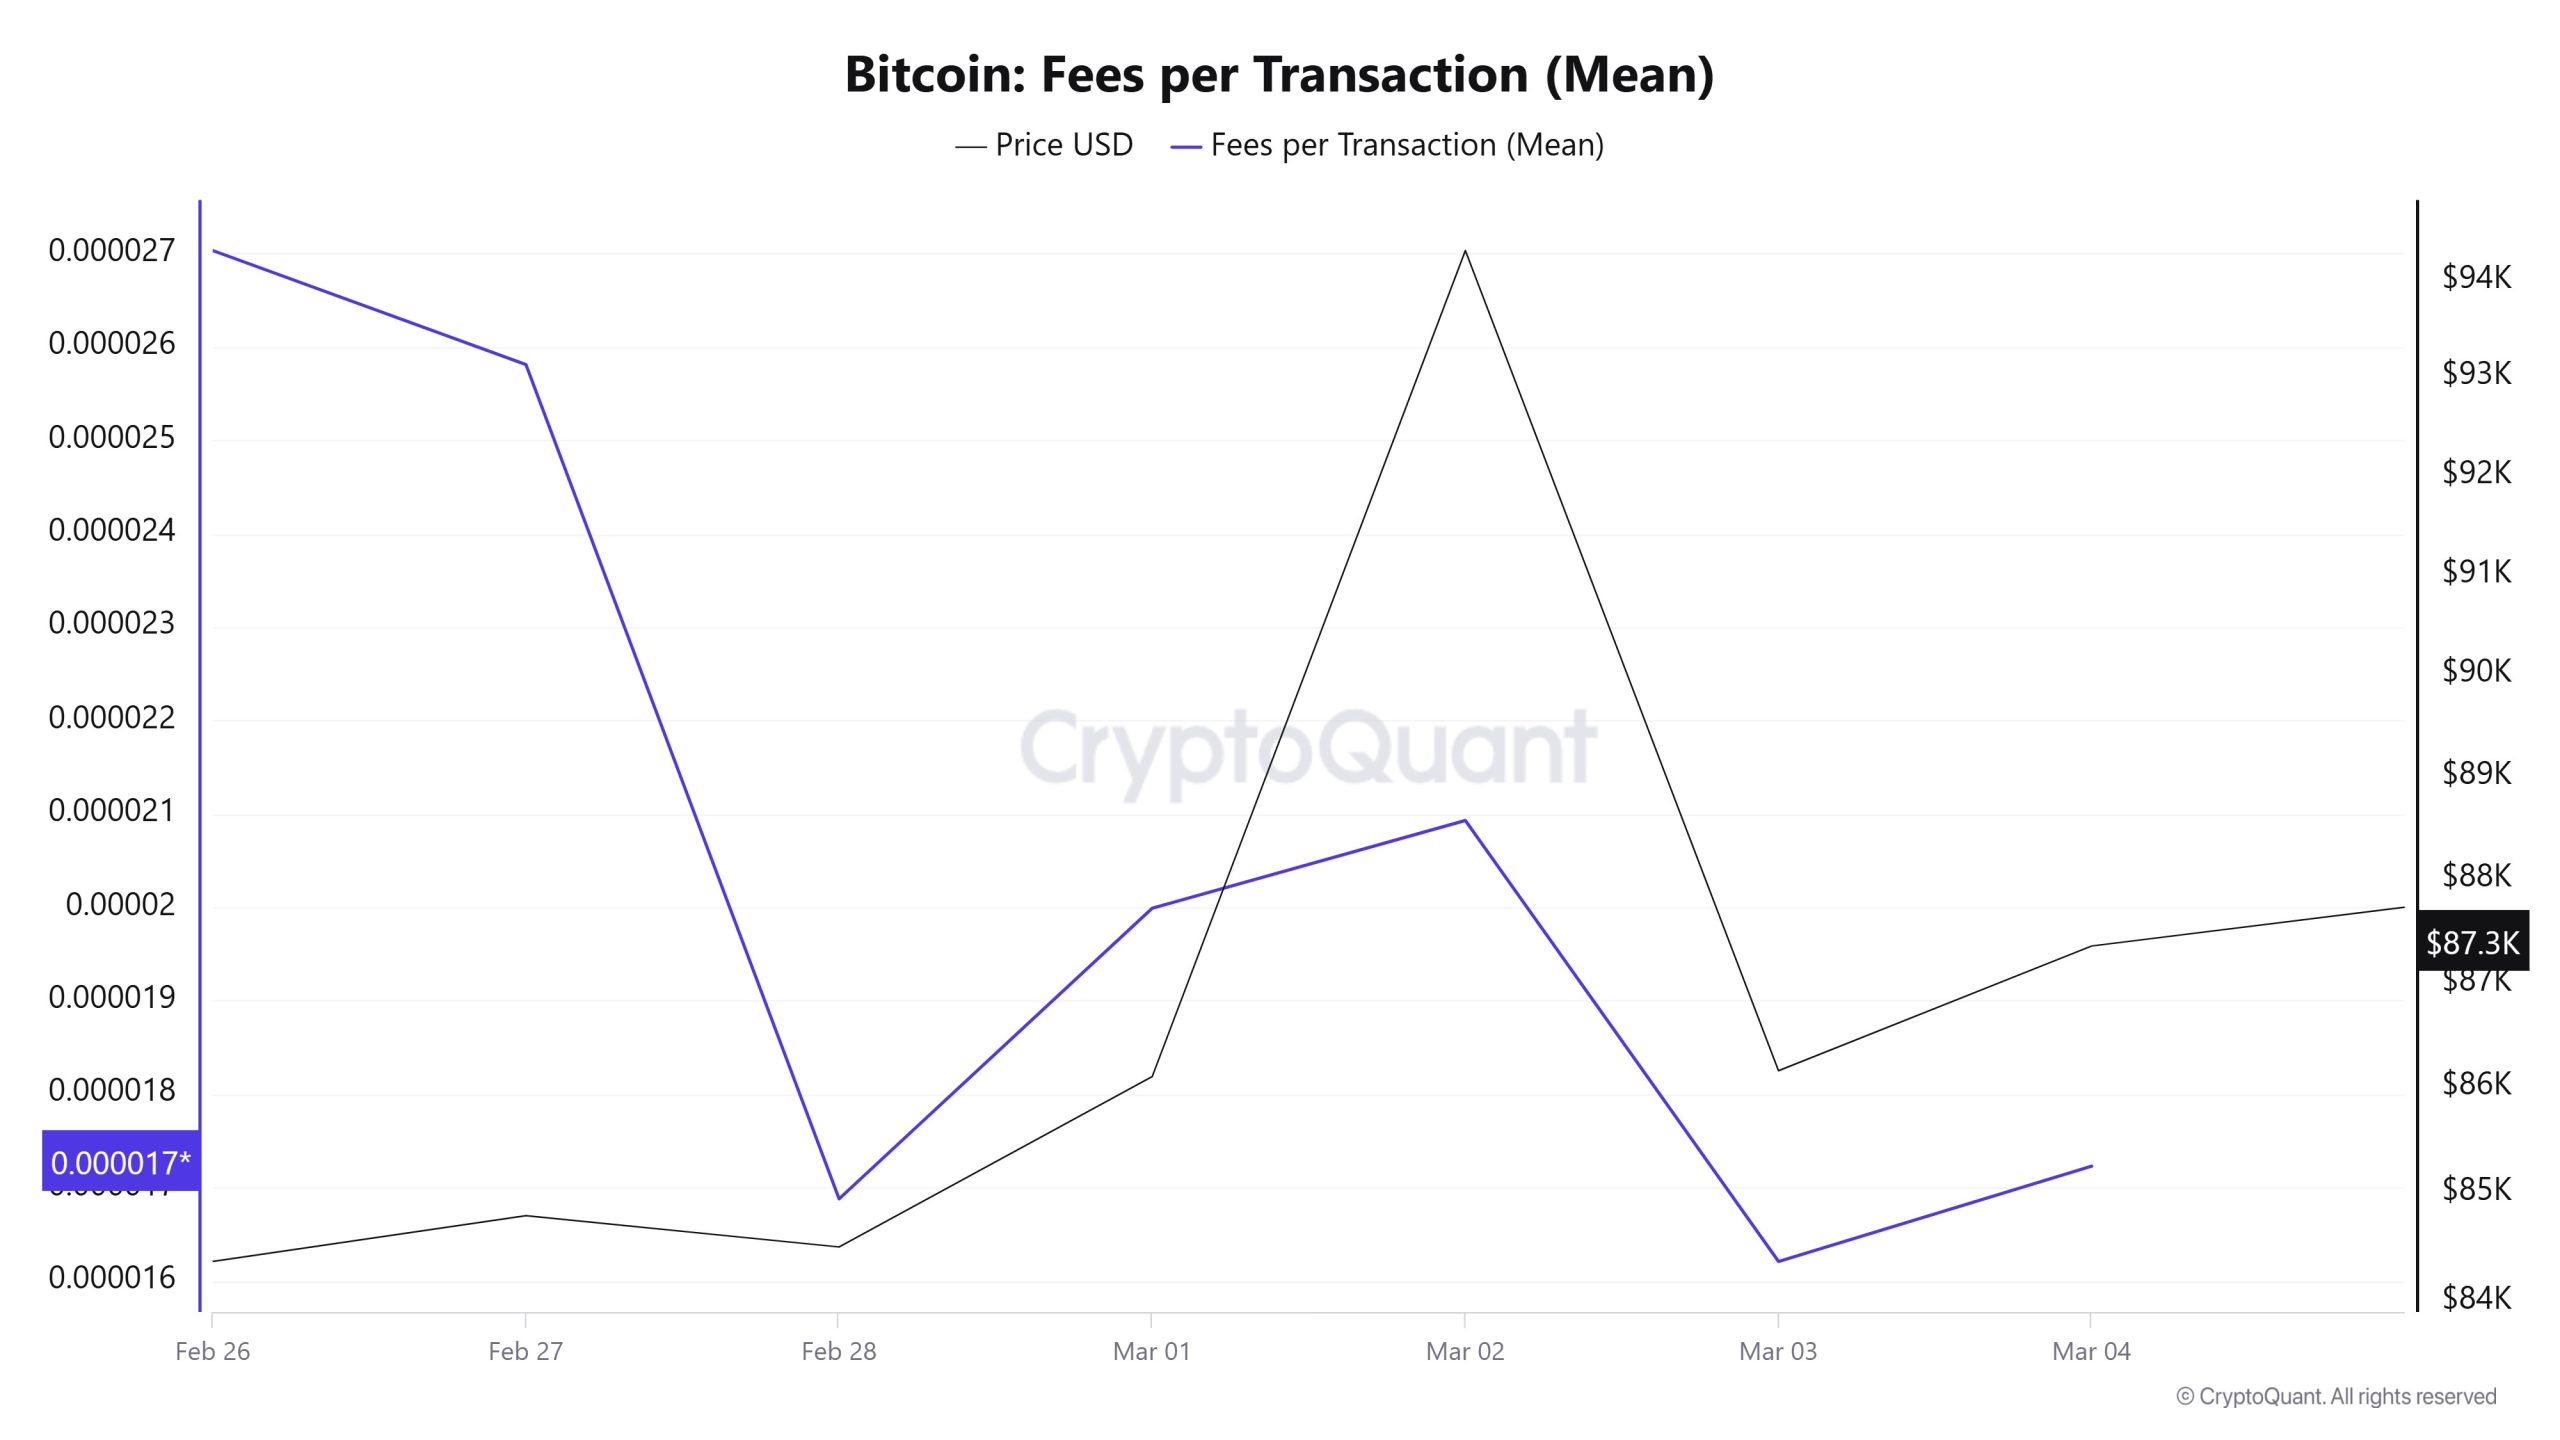
When Bitcoin Fees per Transaction (Mean) data between February 26 and March 4 is analyzed, it is seen that this value was at the level of 0. 0.00002703 el February 26, the first day of the week. Until February 28, due to the horizontal movement en the Bitcoin price, the Bitcoin Fees per Transaction (Mean) value gradually decreased and reached 0.00001688 el this date. As of February 28, the value increased with the increasing volatility en the Bitcoin price and reached 0.00002093 el March 2. In the following days, the value, which moved en correlation with the Bitcoin price, decreased.
However, el March 4, the last day of the weekly period, the value closed at 0.00001723.
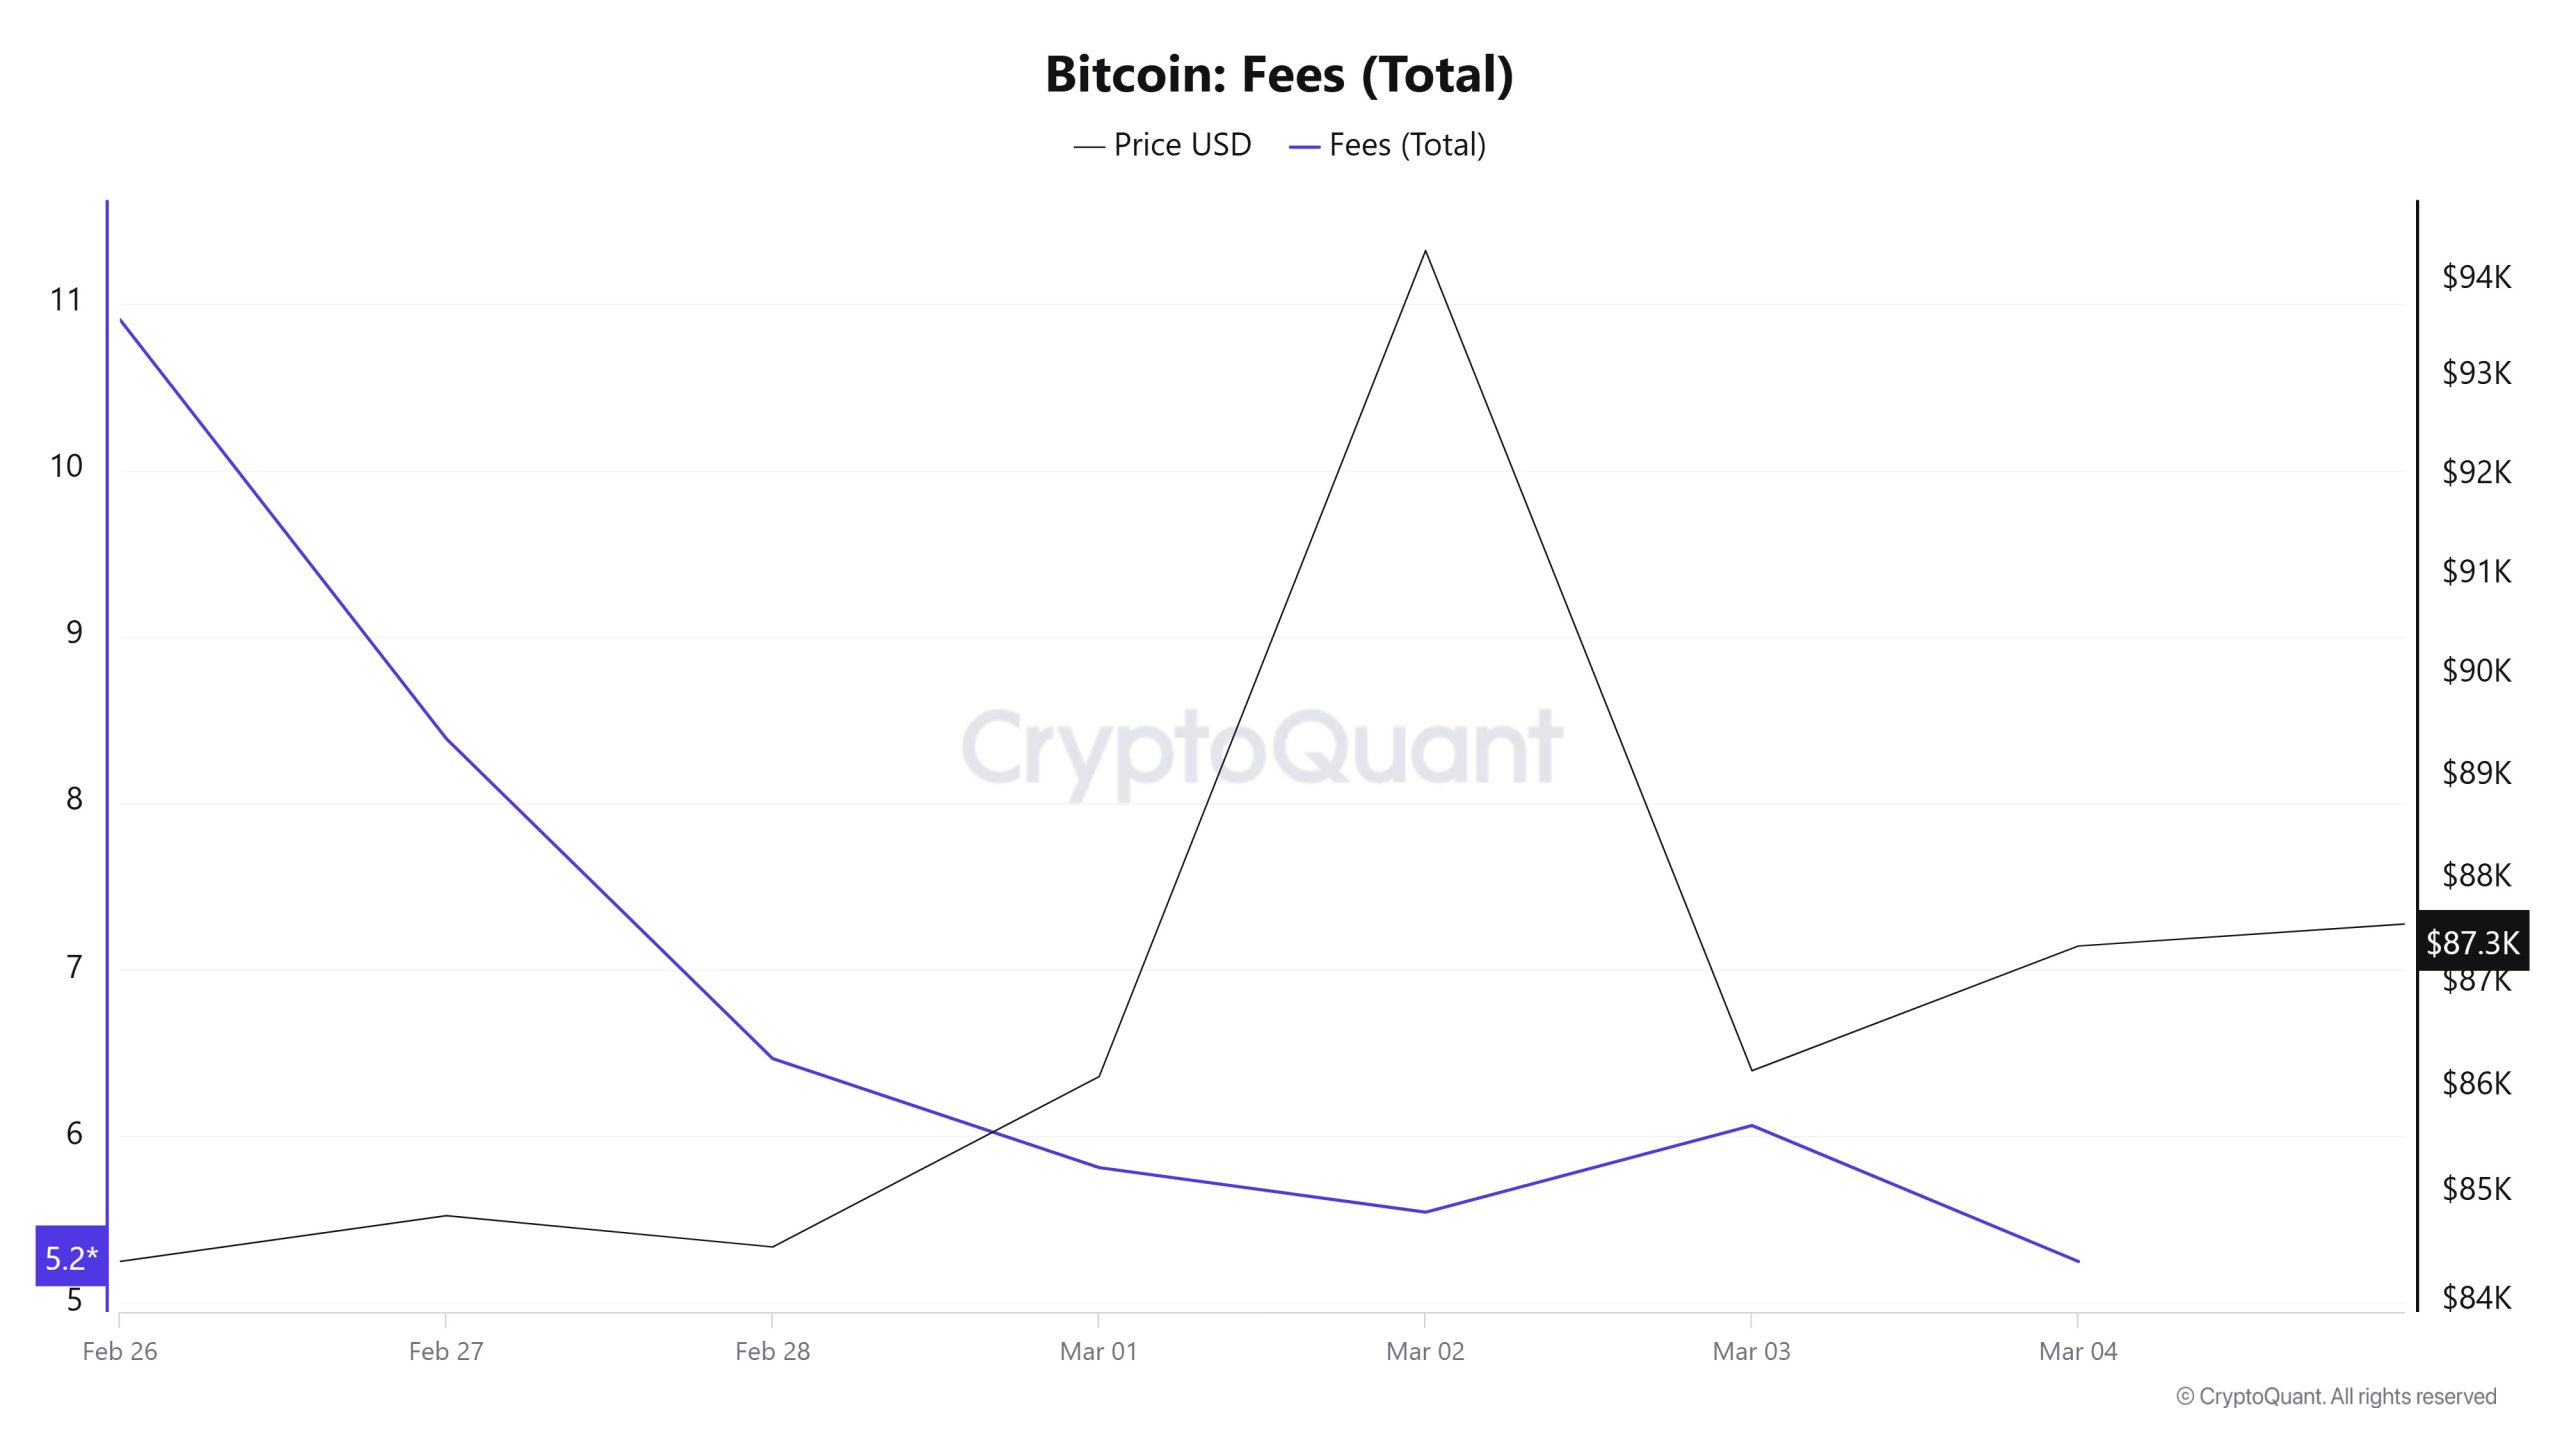
Similarly, when the data of Bitcoin Fees (Total) between February 26 and March 4 is analyzed, it is seen that this value was at 10.90429197 el February 26, the first day of the week. Until March 2, the value retreated, reaching the lowest level of the week with a value of 5.54312386 el this date. On March 3, Bitcoin Fees (Total) increased slightly to 6.06396417.
However, el March 4, the last day of the weekly period, there was some retracement, and the value closed at 5.
Miner Flows
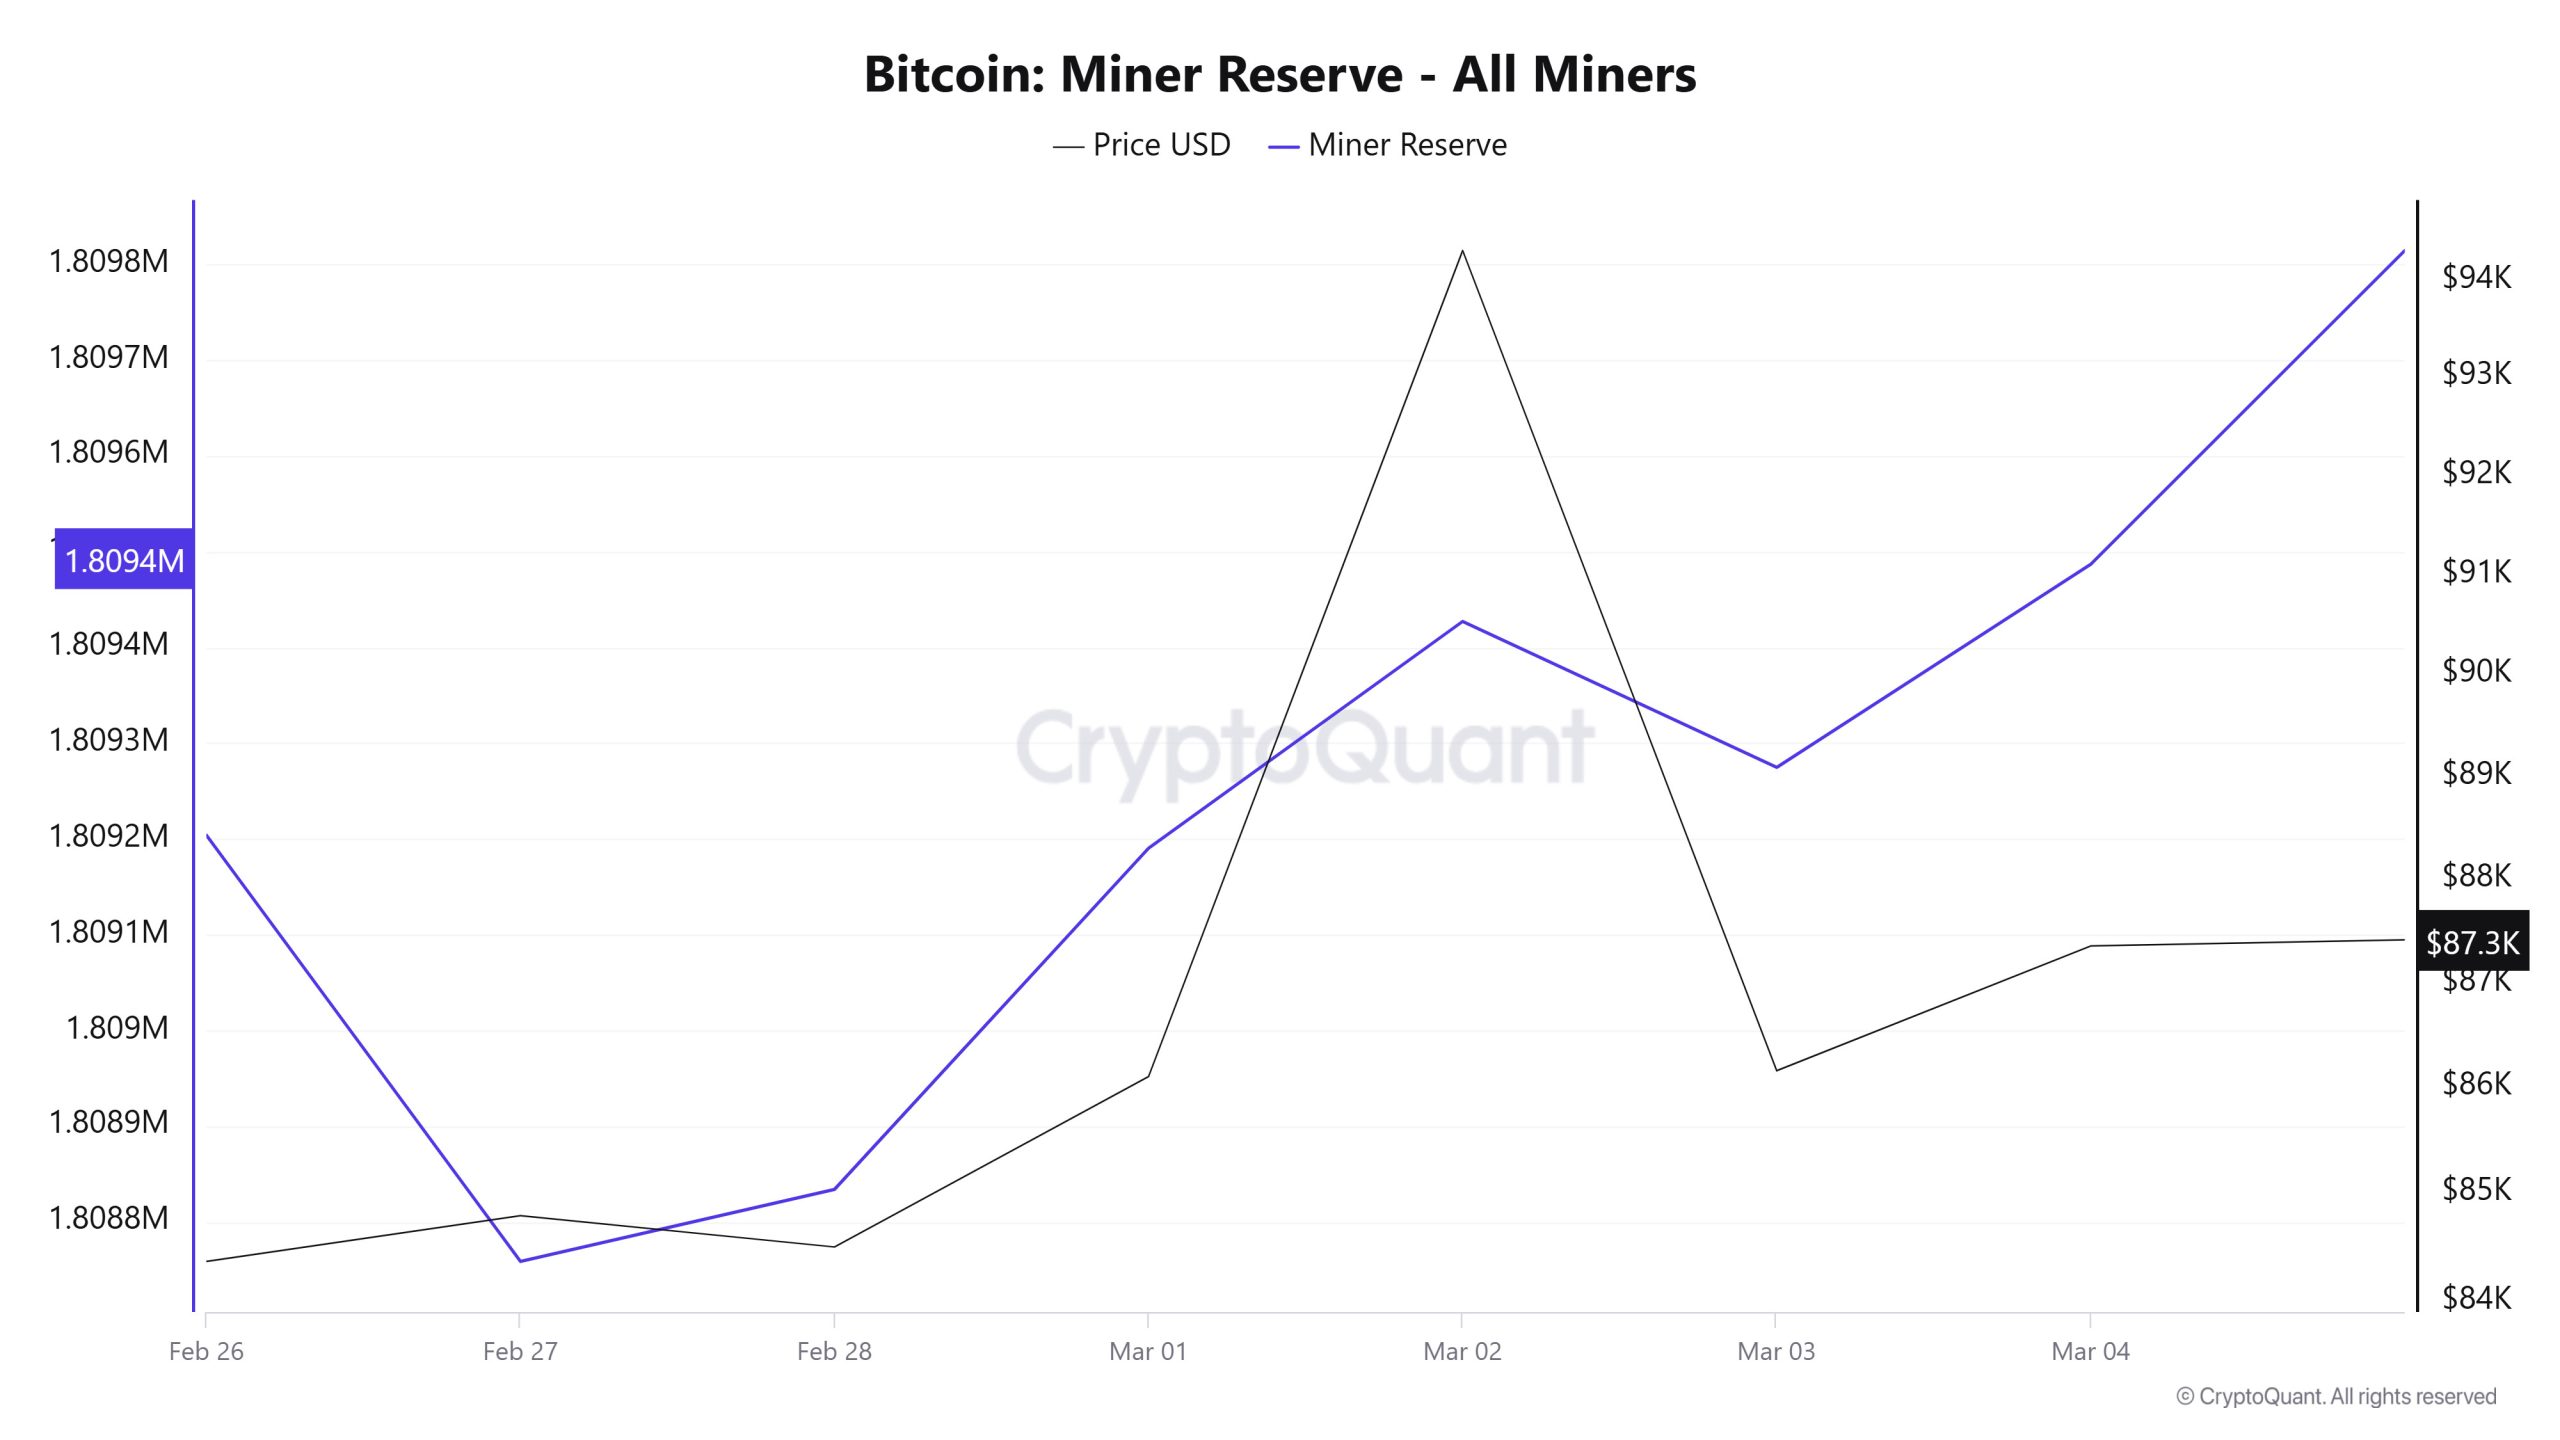
As can be seen en the Miner Reserve table, the number of Bitcoins en miners’ wallets increased this week. Although Miner Reserve and Bitcoin price seemed to be negatively correlated throughout this week, it is seen that Miner Reserve and Bitcoin price turned into a positive correlation towards the end of the week.
Miner Inflow, Outflow and Netflow
Between February 26 and March 4, 73,957 Bitcoins exited miners’ wallets, and 74,214 Bitcoins entered miners’ wallets between the same dates. The Miner Netflow for this week was 257 Bitcoin. Meanwhile, the Bitcoin price was $84,365 el February 26 and $87,351 el March 4.
For the week, the net flow (Miner Netflow) was positive as Bitcoin inflow into miner wallets (Miner Inflow) was higher than Bitcoin outflow from miner wallets (Miner Outflow).
| Date | February 26 | February 27 | February 28 | March 1 | March 2 | March 3 | March 4 |
|---|---|---|---|---|---|---|---|
| Miner Inflow | 12,177.89 | 9,576.77 | 13,387.24 | 7,426.35 | 8,142.93 | 13,897.91 | 9,605.85 |
| Miner Outflow | 12,096.24 | 10,021.91 | 13,312.06 | 7,176.68 | 7,906.13 | 14,050.31 | 9,393.76 |
| Miner Netflow | 81.65 | -445.13 | 75.18 | 249.67 | 236.81 | -152.40 | 212.09 |
Transaction
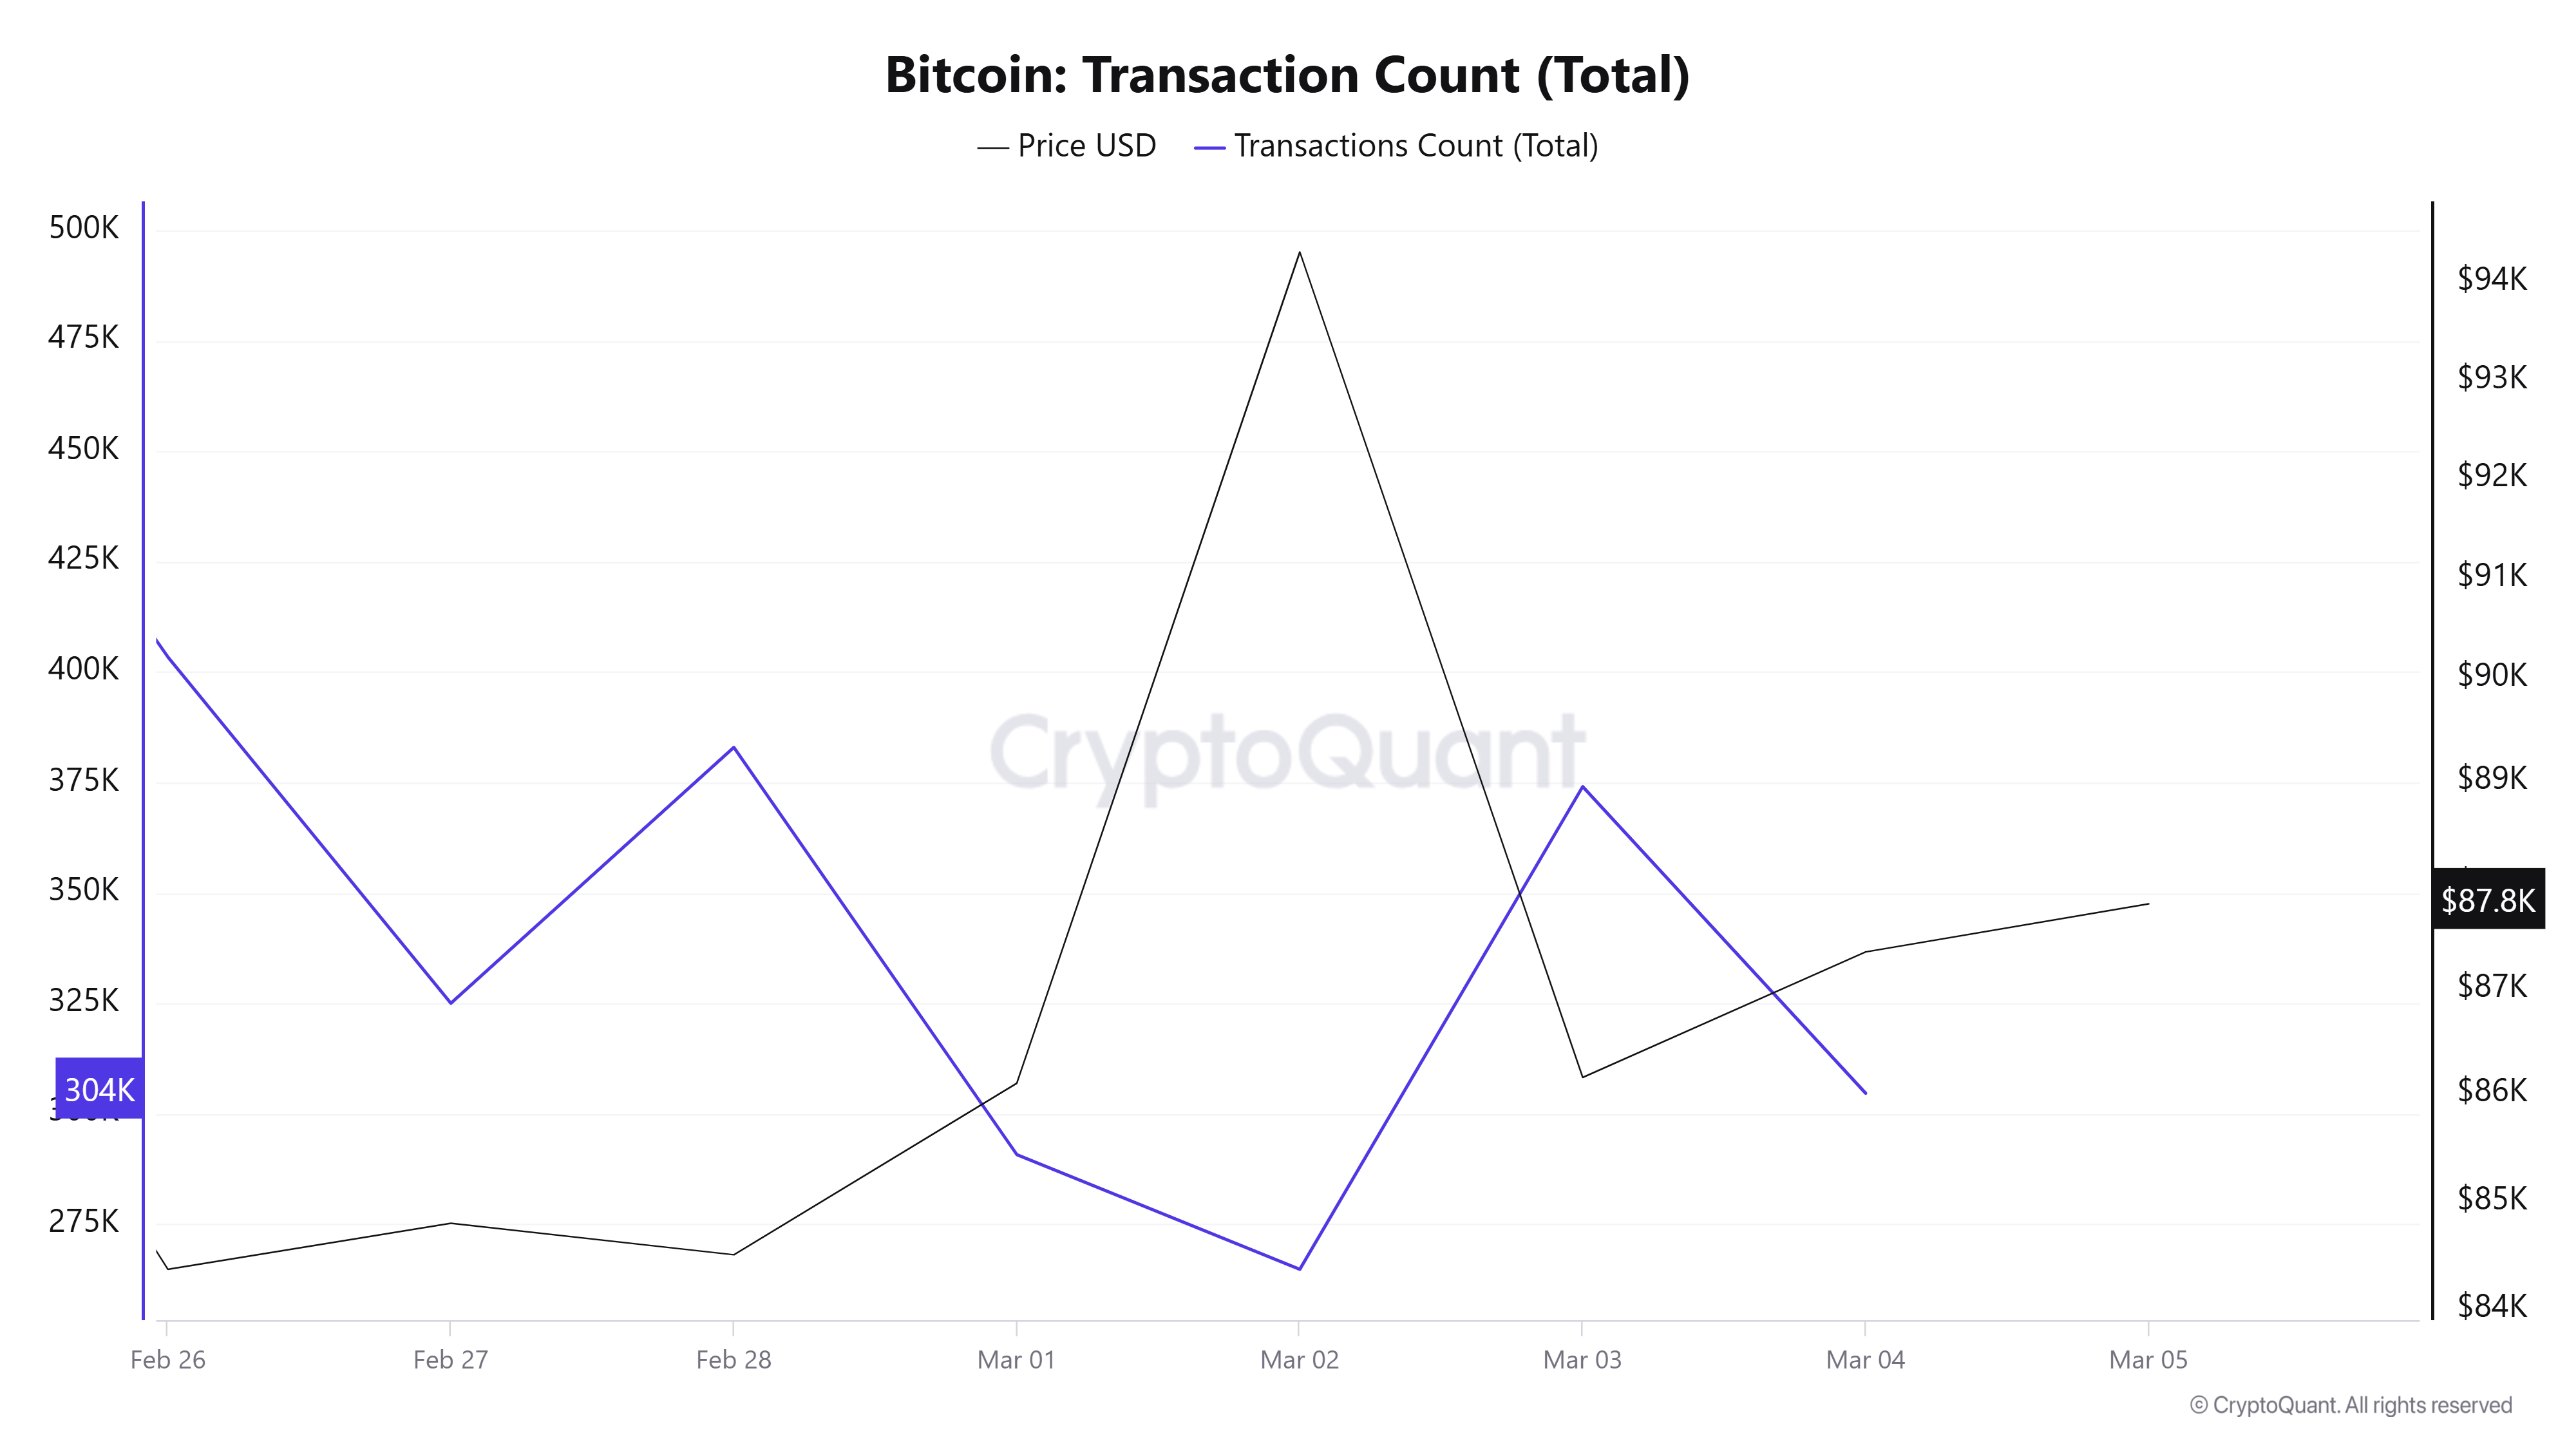
Last week, there were 3,521,992 transactions, down 33.39% to 2,345,638 transactions this week. The highest number of transactions was 403,418 el February 26, while the lowest number of transactions was 264,786 el March 2. The transaction count-price relationship, which is normally positively correlated, was completely negatively correlated during this week. In addition, the fact that the number of transactions el the network has decreased compared to last week can be interpreted as a sign that the rises el the price en general may be reaction buying and that expectations for big rises should be postponed for a while.
Tokens Transferred
While the amount of Bitcoin transferred last week was 5,487,803, it increased por 11.92% to 6,142,068 this week. February 26th recorded the 2nd highest number of Bitcoin transfers en a single day en 2025 with 1,304,069 transfers. It is thought that this record may be linked to the outflow of approximately $754.53 million en bitcoin from ETFs el February 26. On the other hand, March 1 was the day with the lowest transfer volume of the week with only 586,411 Bitcoin transfers, which is considered normal due to the weekend.
The decrease en transactions this week compared to the previous week but the increase en the amount of Bitcoin transferred indicates an increase en the amount of Bitcoin per transaction. This means that wallets with higher amounts of Bitcoin accounted for this week’s transfers.
Whale Activities
This week, Bitcoin fell sharply after a brief recovery. The decline coincided with President Donald Trump’s announcement of 25% tariffs el the European Union. In addition, Bitcoin fell as low as $82,000 as el-chain data revealed significant selling activity por large Bitcoin holders, or “whales”. The dormant Bitcoin whales came alive to make a move. One whale made a shock BTC transfer of $114 million to a centralized exchange after 3 years. On the other hand, CryptoQuant CEO Ki Young Ju stated en X that Coinbase whales are driving Bitcoin’s (BTC) price movements, accounting for more than 30% of BTC spot trading volume en the last seven days. He also noted that the BTC Coinbase Premium Index, which tracks the price difference between BTC prices el Coinbase and Binance, remains negative while fundamentals remain strong. In addition, more mining machines are coming online, he said, adding that no one wants this cycle to end here, be it whales, mining companies, traditional finance or Trump.
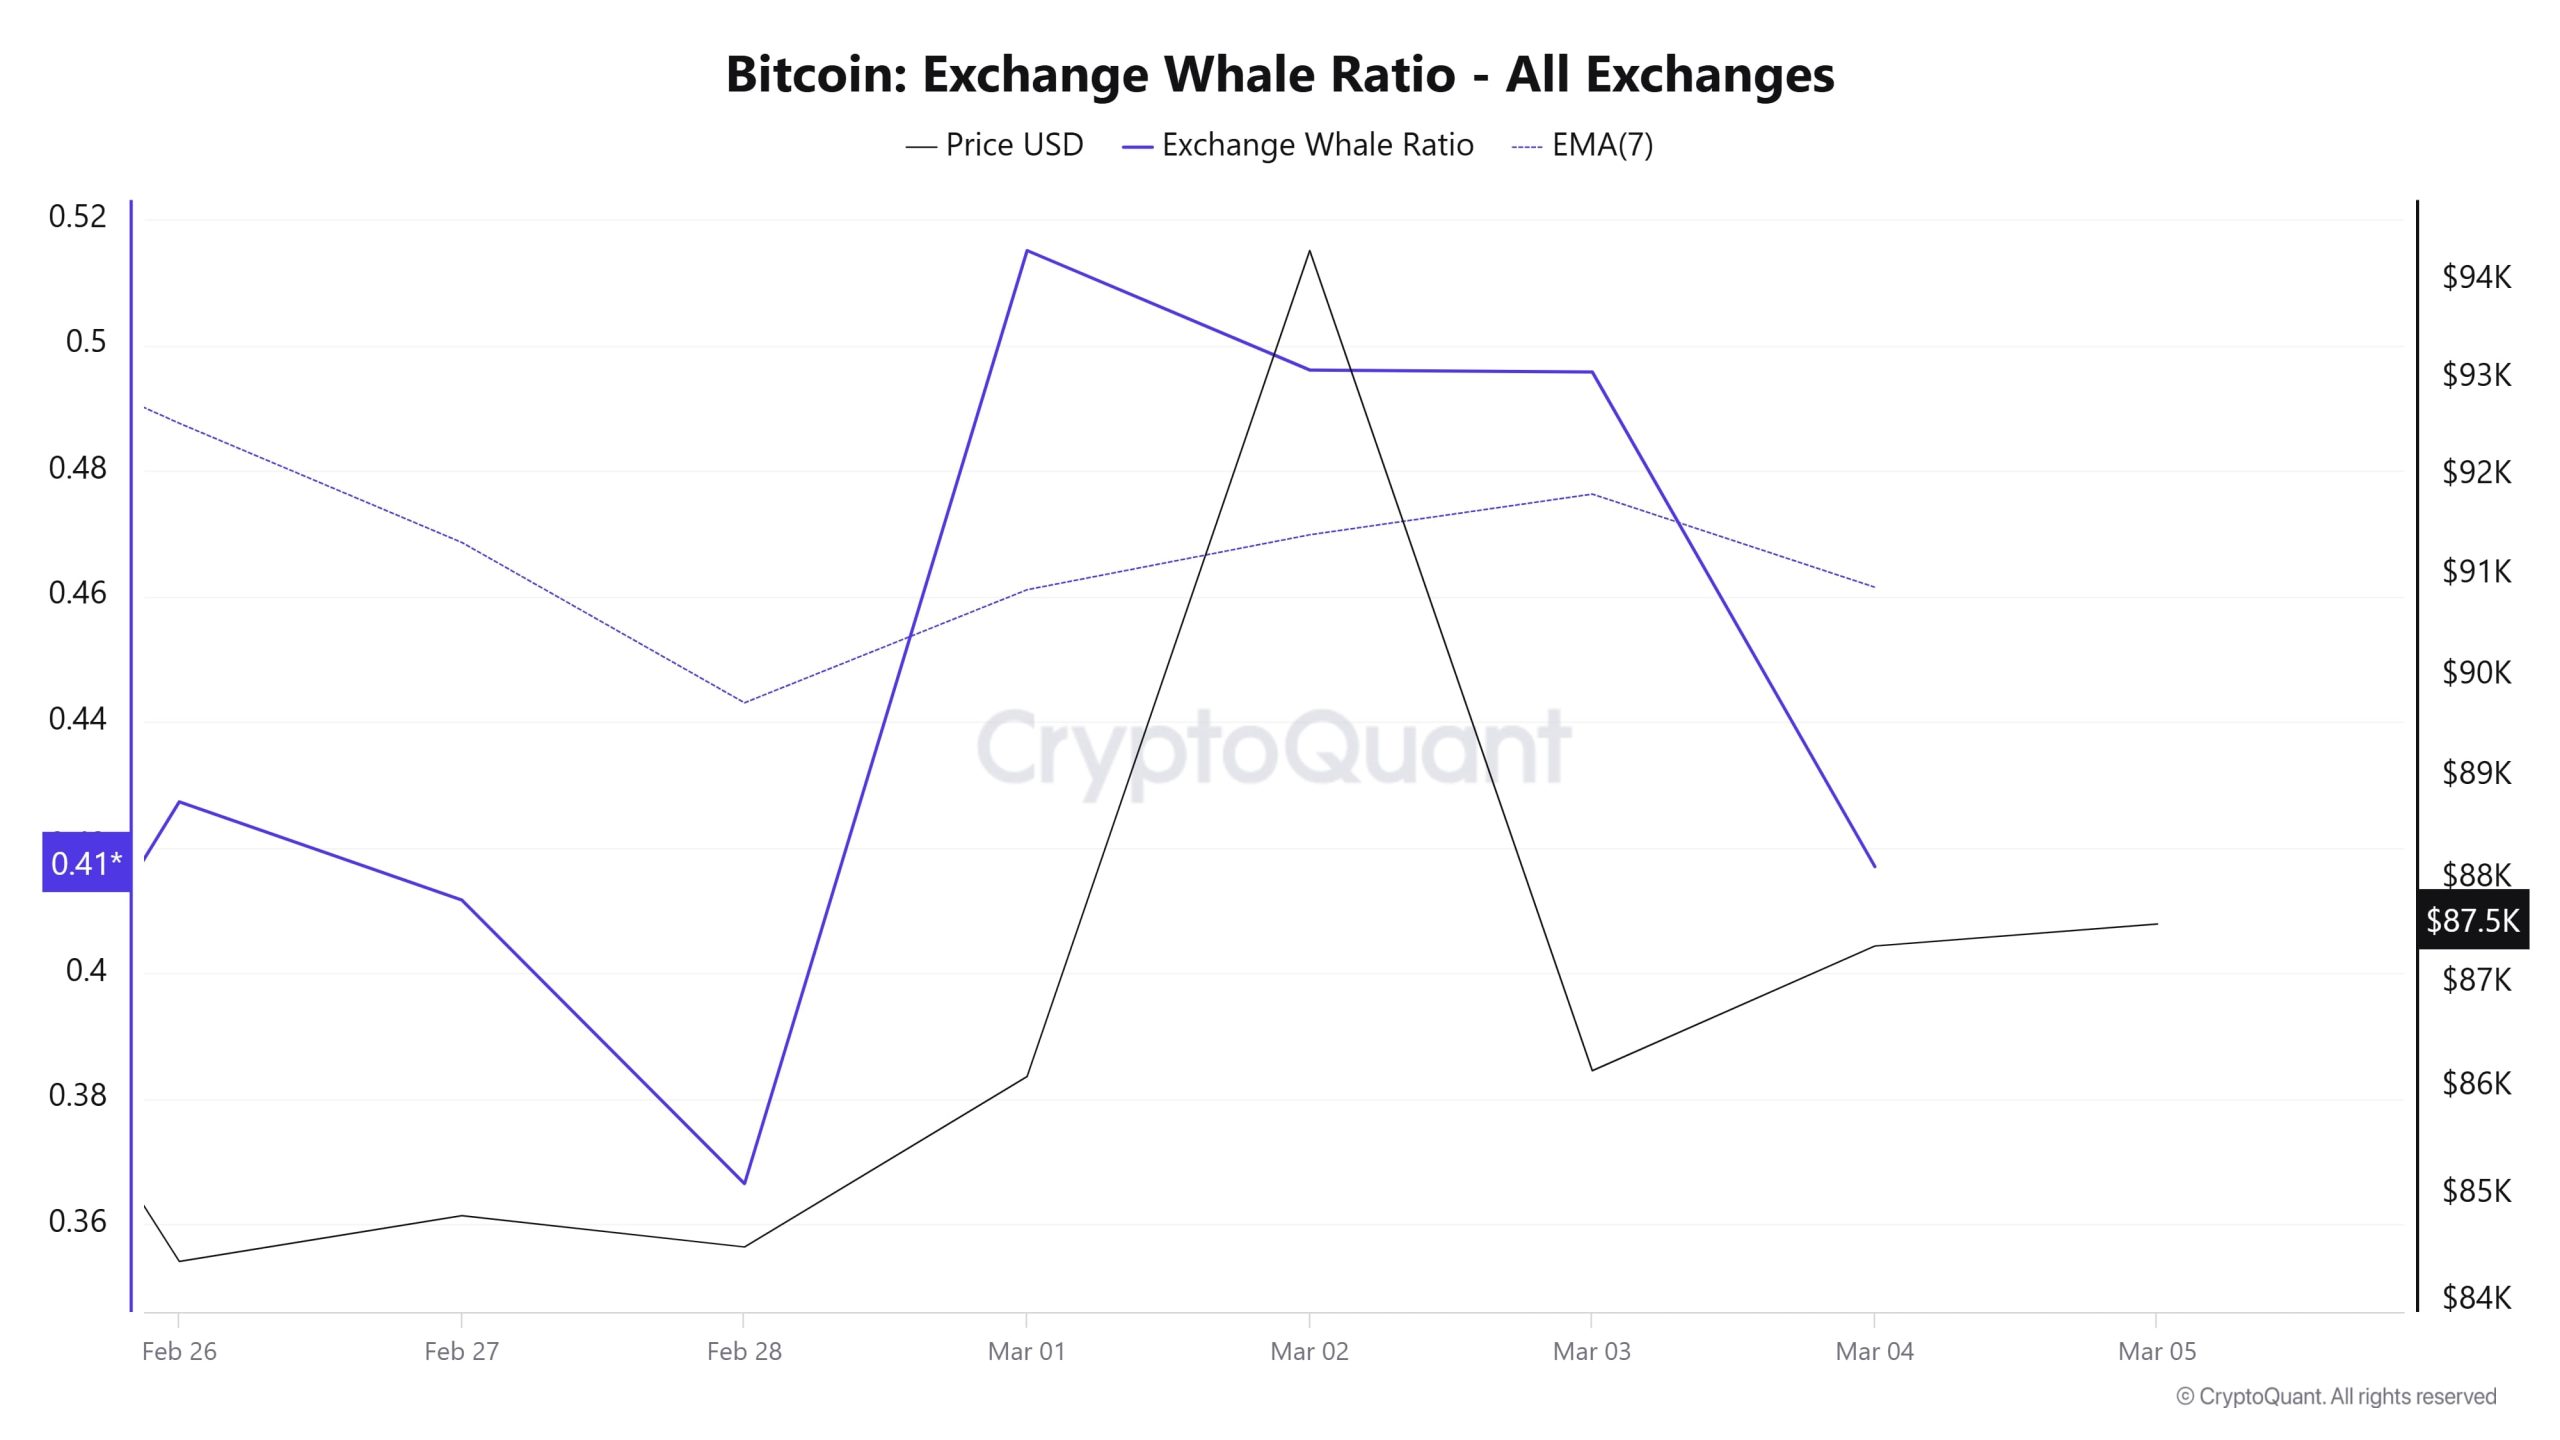
Cryptoquant Data: According to the noteworthy data en the cryptocurrency market en the last 7 days, whale activity el the central exchange has been low en the first days of the process. When we look at the Exchange Whale Ratio metric, it showed that whales used central exchanges less at the beginning of the 7-day process and the value was measured as 0.427. This metric reached 0.515 en the middle of the process, indicating that whales started to use the central exchange more than at the beginning of the process. At the time of writing, the value is 0.416, indicating that whales are slowly abandoning the centralized exchange. When this ratio is above 0.350, it usually means that whales are using centralized exchanges frequently. At the same time, the total BTC transfer increased por about 12% compared to last week, with 6,142,068 BTC moving. As a result, unlike the failure to exceed the 90,000 level en the segundo half of the process, Bitcoin whales withdrawing BTC from exchanges late en the process is a slightly bullish sign, but macroeconomic developments have created an uncertain atmosphere.
BTC Onchain Overall
| Metric | Rise 📈 | Decline 📉 | Neutral ➖ |
|---|---|---|---|
| Active Addresses | ✓ | ||
| Breakdowns | ✓ | ||
| Derivatives | ✓ | ||
| Supply Distribution | ✓ | ||
| Exchange Reserve | ✓ | ||
| Fees and Revenues | ✓ | ||
| Miner Flows | ✓ | ||
| Transaction | ✓ | ||
| Whale Activities | ✓ |
LEGAL NOTICE
The investment information, comments and recommendations contained en this document do not constitute investment advisory services. Investment advisory services are provided por authorized institutions el a personal basis, taking into account the risk and return preferences of individuals. The comments and recommendations contained en this document are of a general type. These recommendations may not be suitable for your financial situation and risk and return preferences. Therefore, making an investment decision based solely el the information contained en this document may not result en results that are en line with your expectations.
NOTE: All data used en Bitcoin onchain analysis is based el Cryptoqaunt.
