
Weekly Bitcoin Onchain Report
Active Addresses
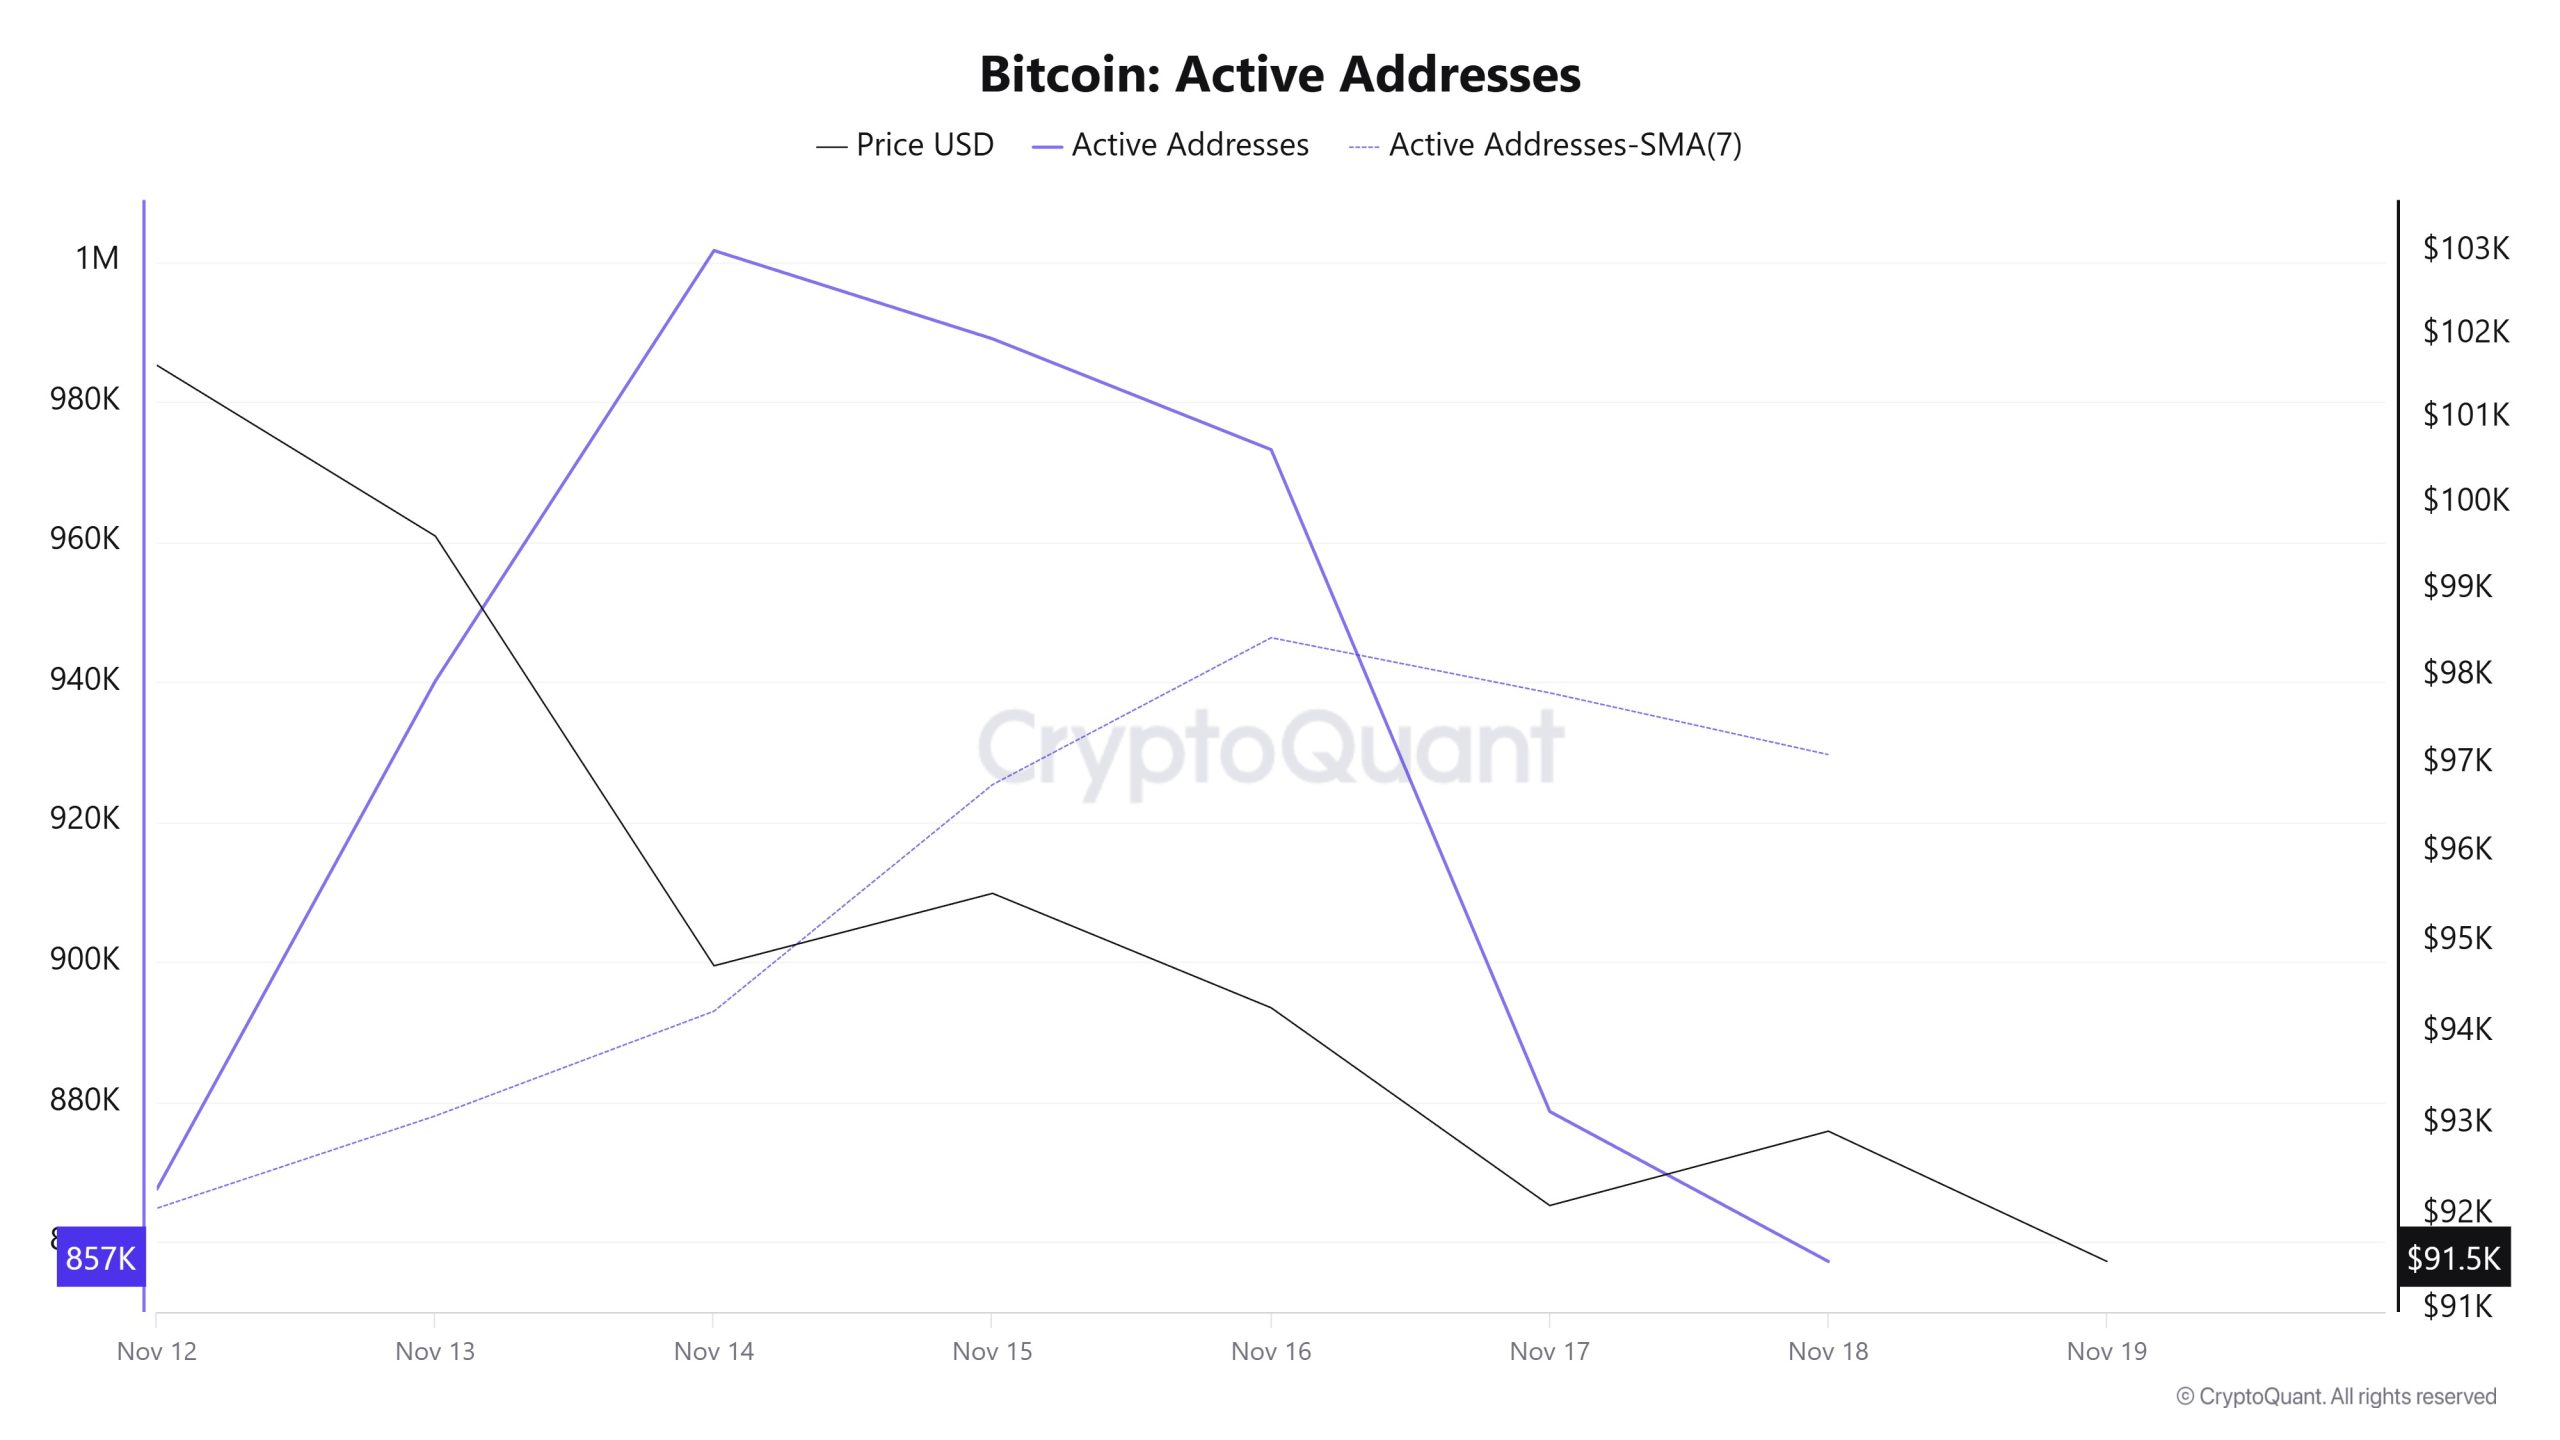
Between 12 November and 19 November, 1,100,1634 active addresses were added to the Bitcoin network. During this period, the Bitcoin price fell to $91,500. From a technical perspective, it is noteworthy that the 7-day simple moving average (SMA) is experiencing downward movements.
Active Sending Addresses
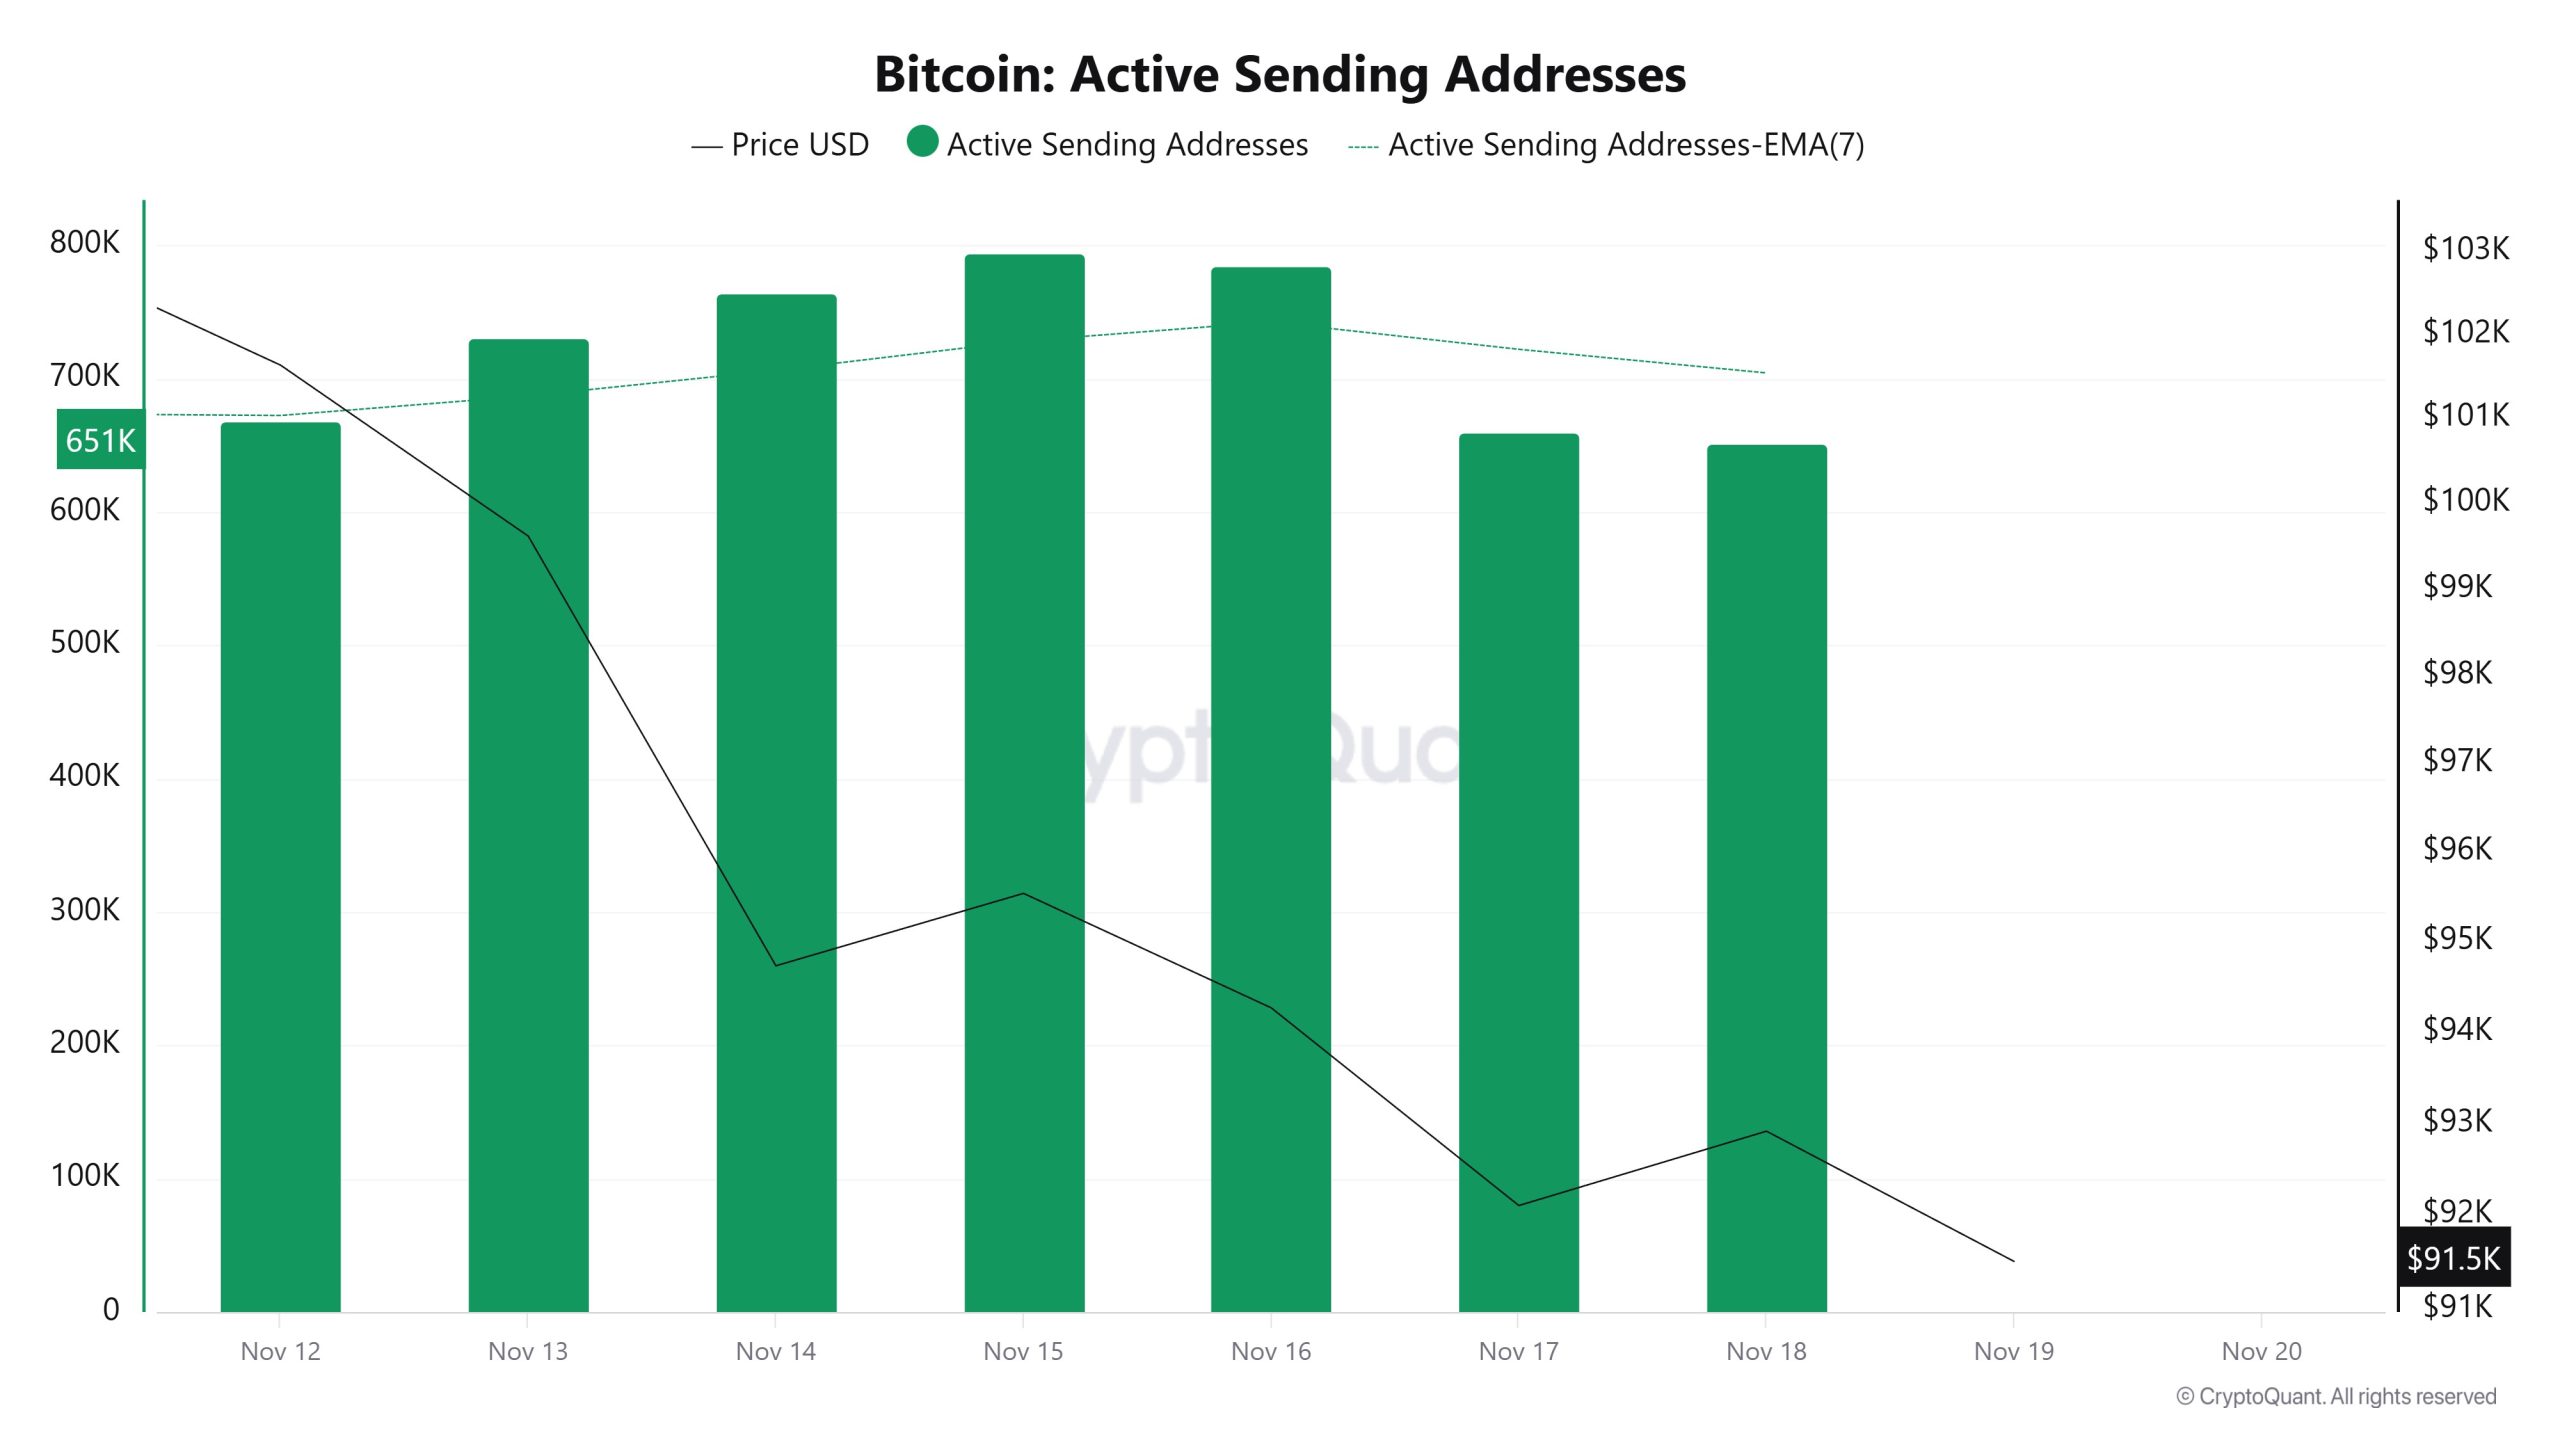
Between November 12 and November 19, an upward trend was observed en the “active sending addresses” metric. On the day the price reached its highest level, this metric stood at 794,460, indicating that user activity el the Bitcoin network was moving en parallel with the price. This data indicates that the $95,000 level is supported not only por price-based factors but also por el-chain address activity, which is sales-driven. Overall, the Active Sending Addresses metric followed an upward trend during this period.
Active Receiving Addresses
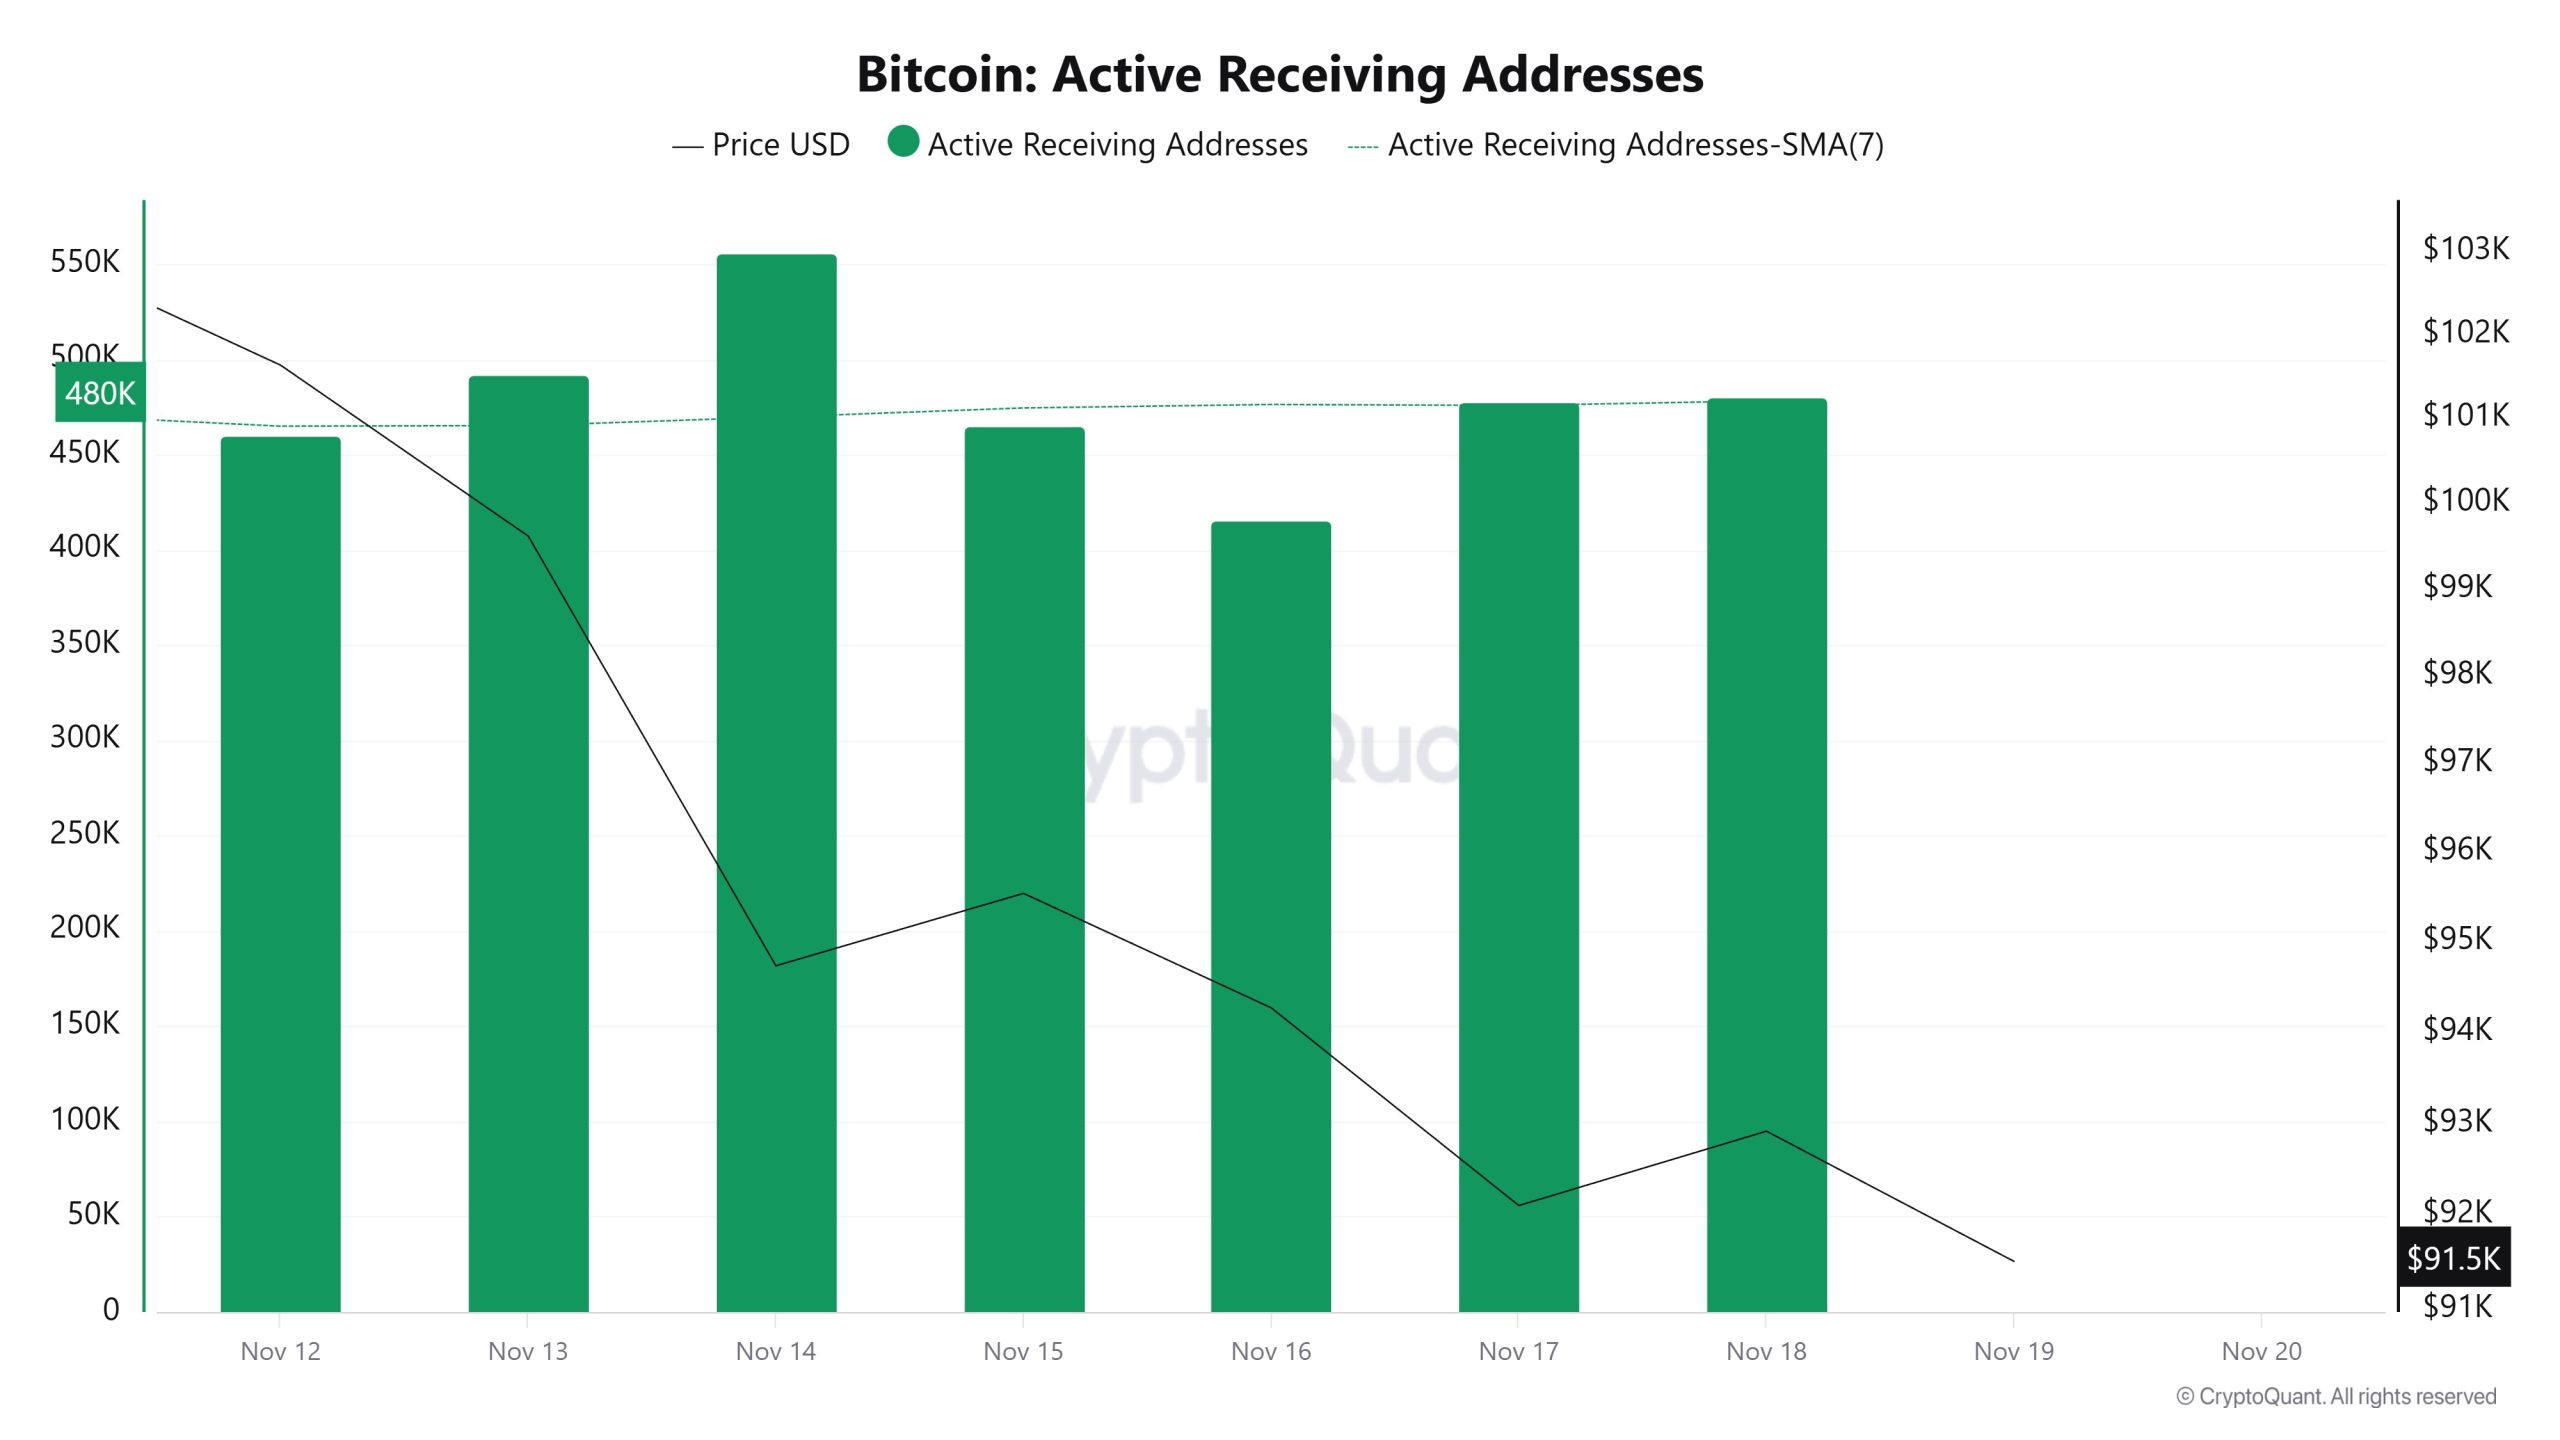
Between November 12 and November 19, active receiving addresses experienced a normal increase along with the Black Line (price line). On the day the price reached its peak, active receiving addresses rose to 555,793 levels, indicating that buyers purchased Bitcoin at around $94,000 levels.
Breakdowns
MVRV
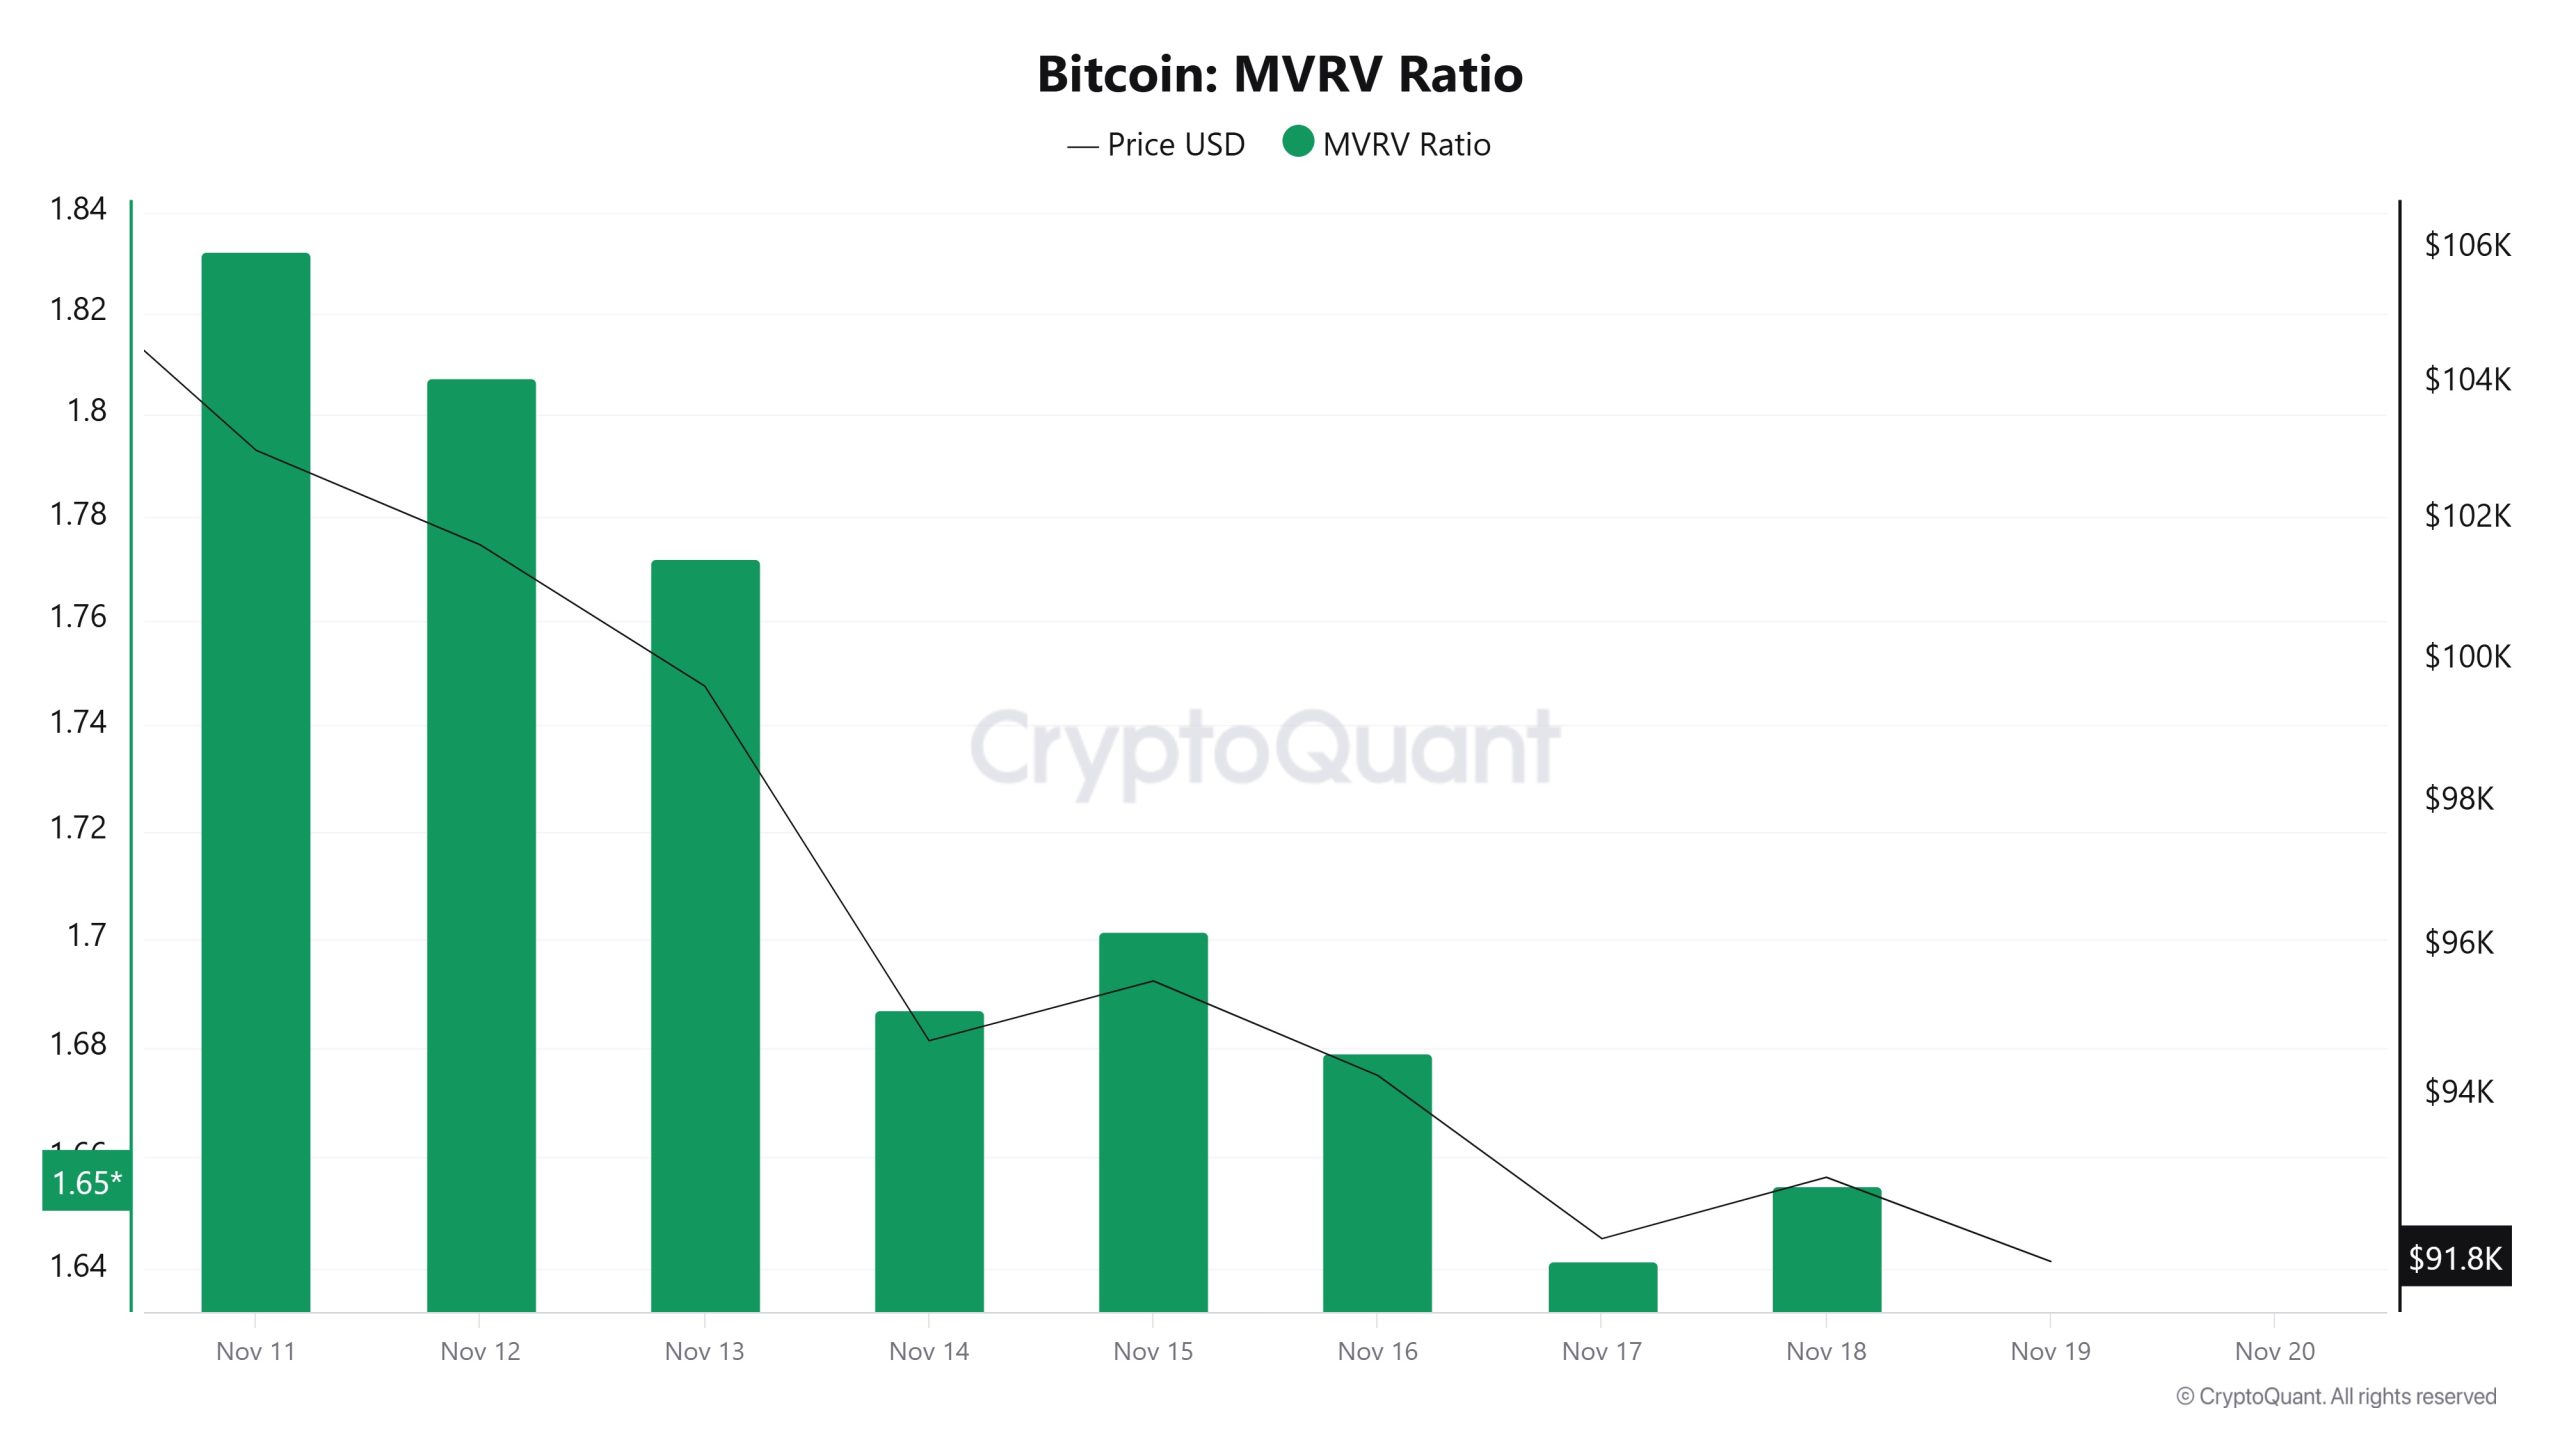
On November 12, while the Bitcoin price was trading at $101,634, the MVRV Ratio was at 1.807.
As of November 18, the Bitcoin price fell to $92,914, recording an 8.58% decline, while the MVRV Ratio fell to 1.654, recording an 8.47% decline.
Realized Price
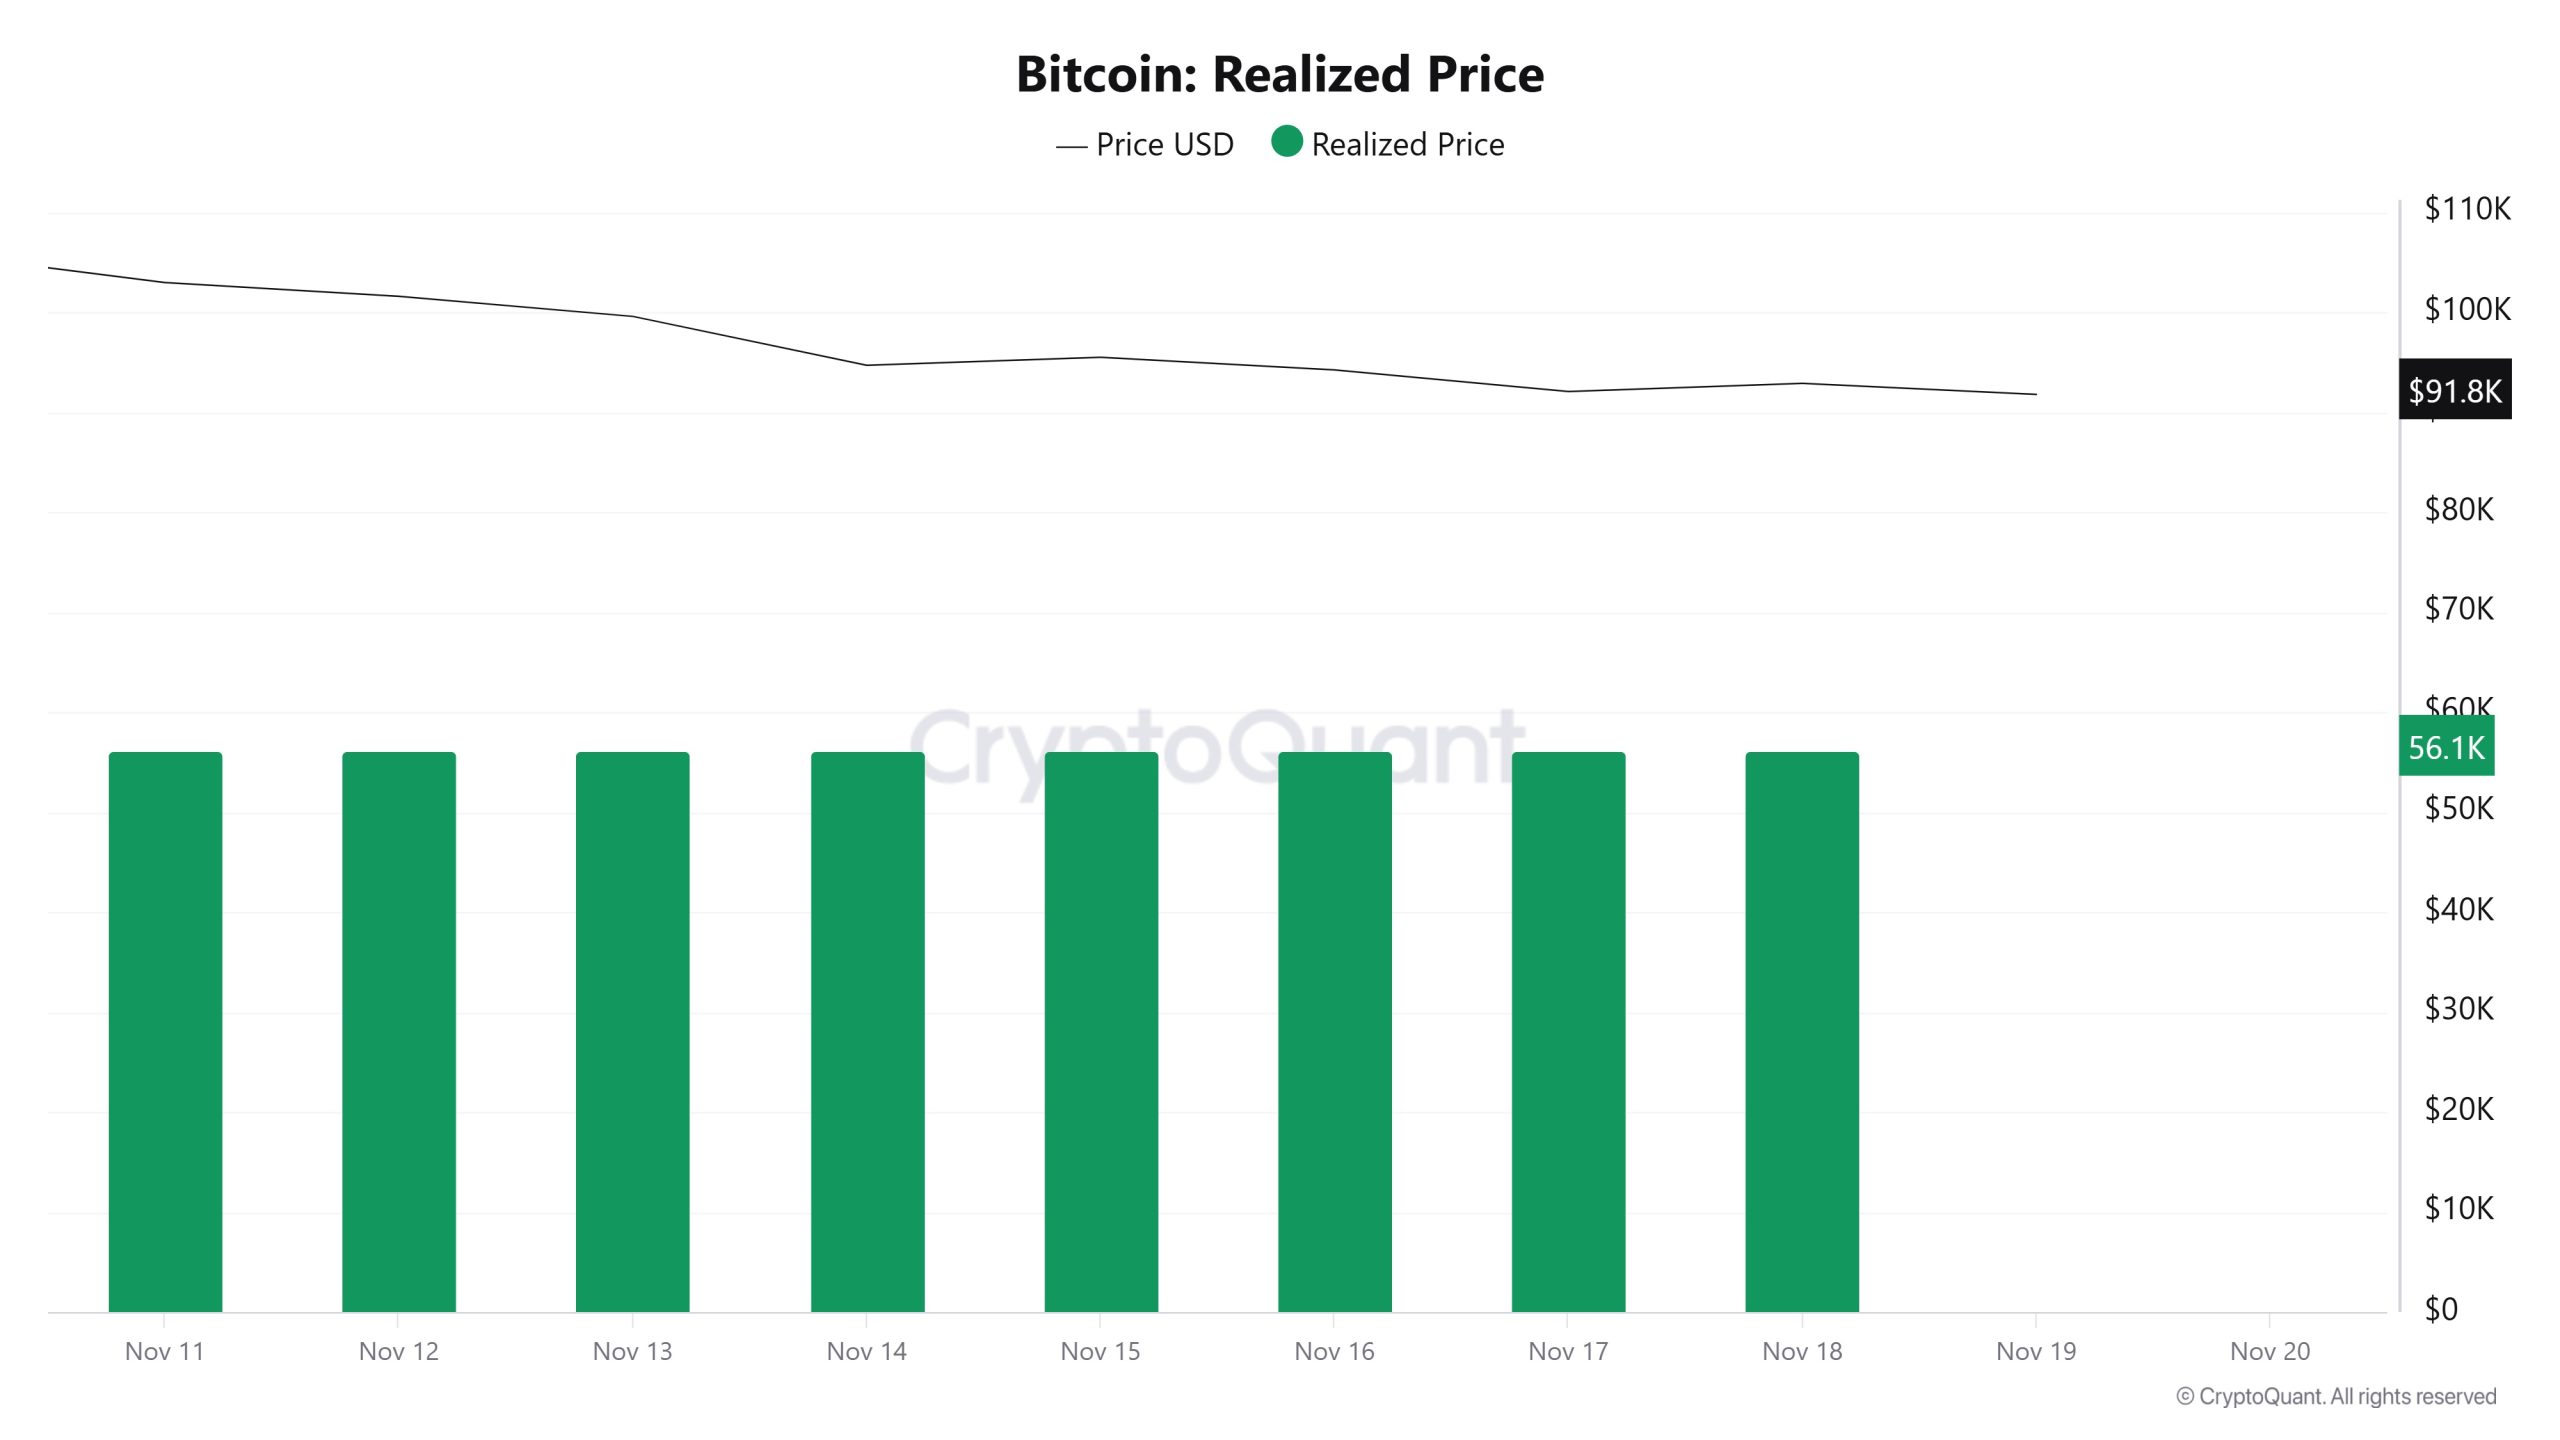
On November 12, while the Bitcoin price was trading at $101,634, the Realized Price was at $56,236.
As of November 18, the Bitcoin price fell to $92,914, while the Realized Price declined to $56,145, recording a 0.16% drop.
Spent Output Profit Ratio (SOPR)
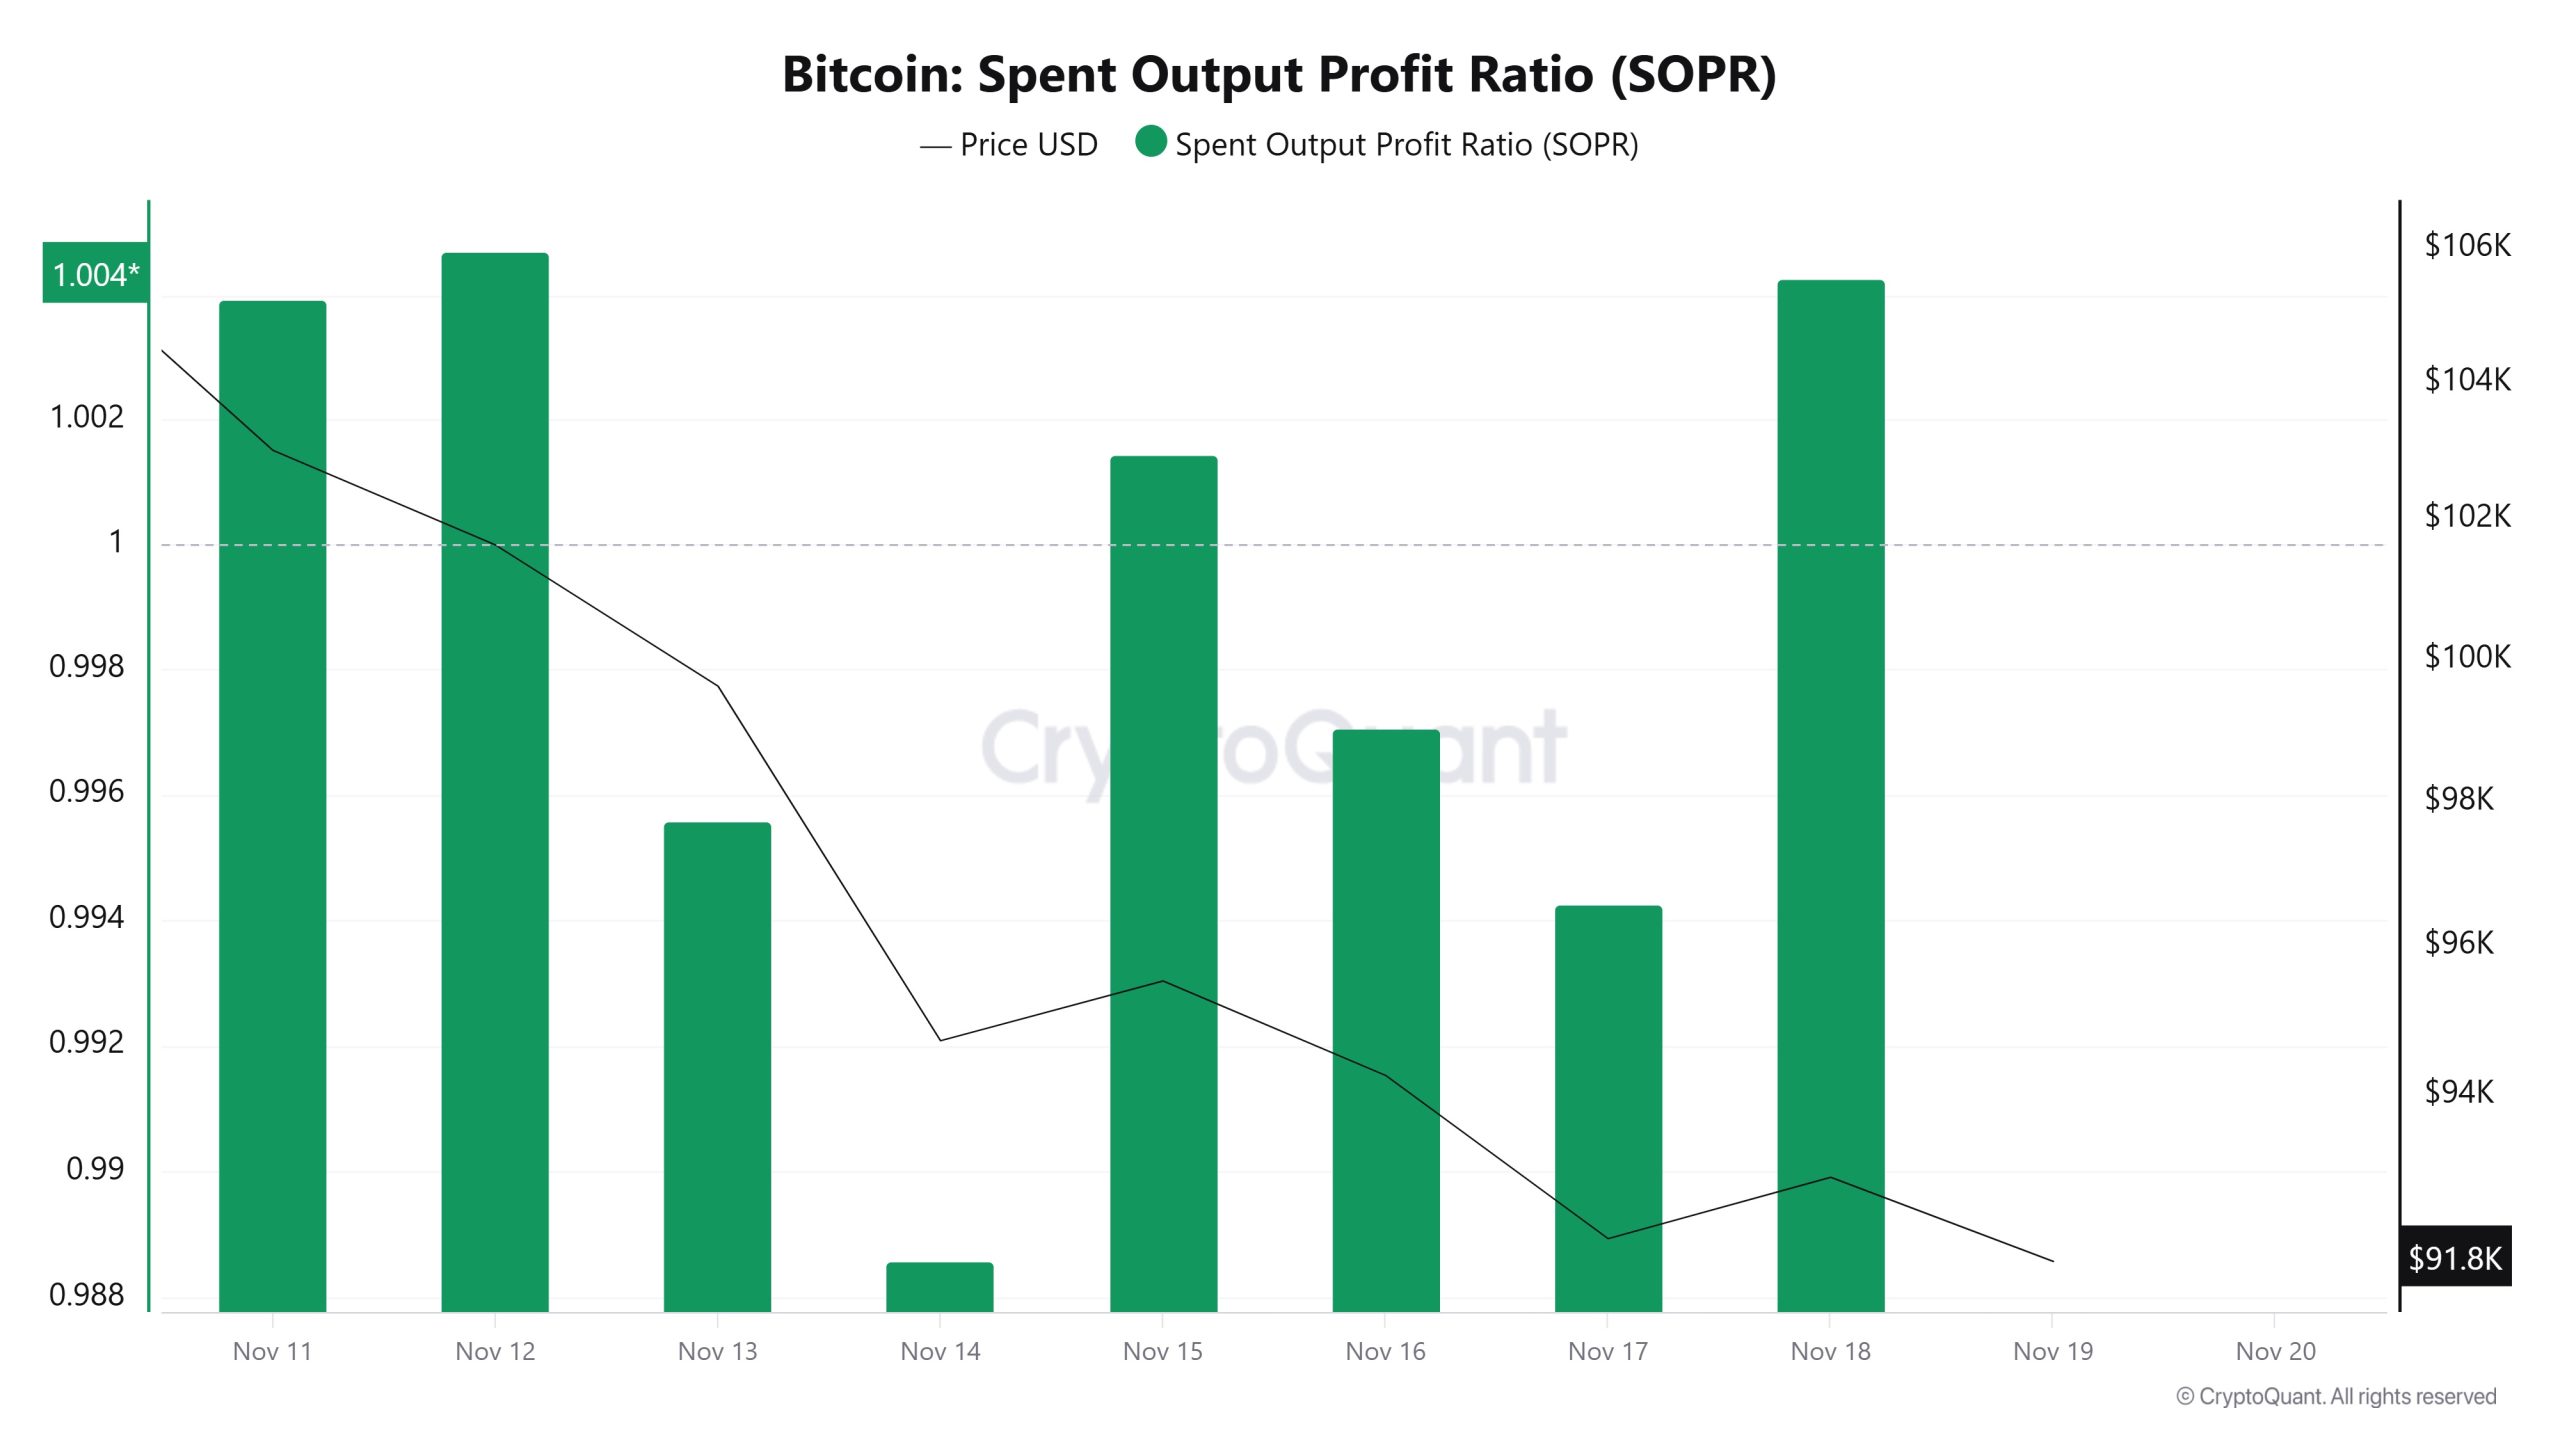
On November 12, while the Bitcoin price was trading at $101,634, the SOPR metric stood at 1.004.
As of November 18, while the Bitcoin price fell to $92,914, the SOPR metric remained unchanged at 1.004.
Derivatives
Open Interest
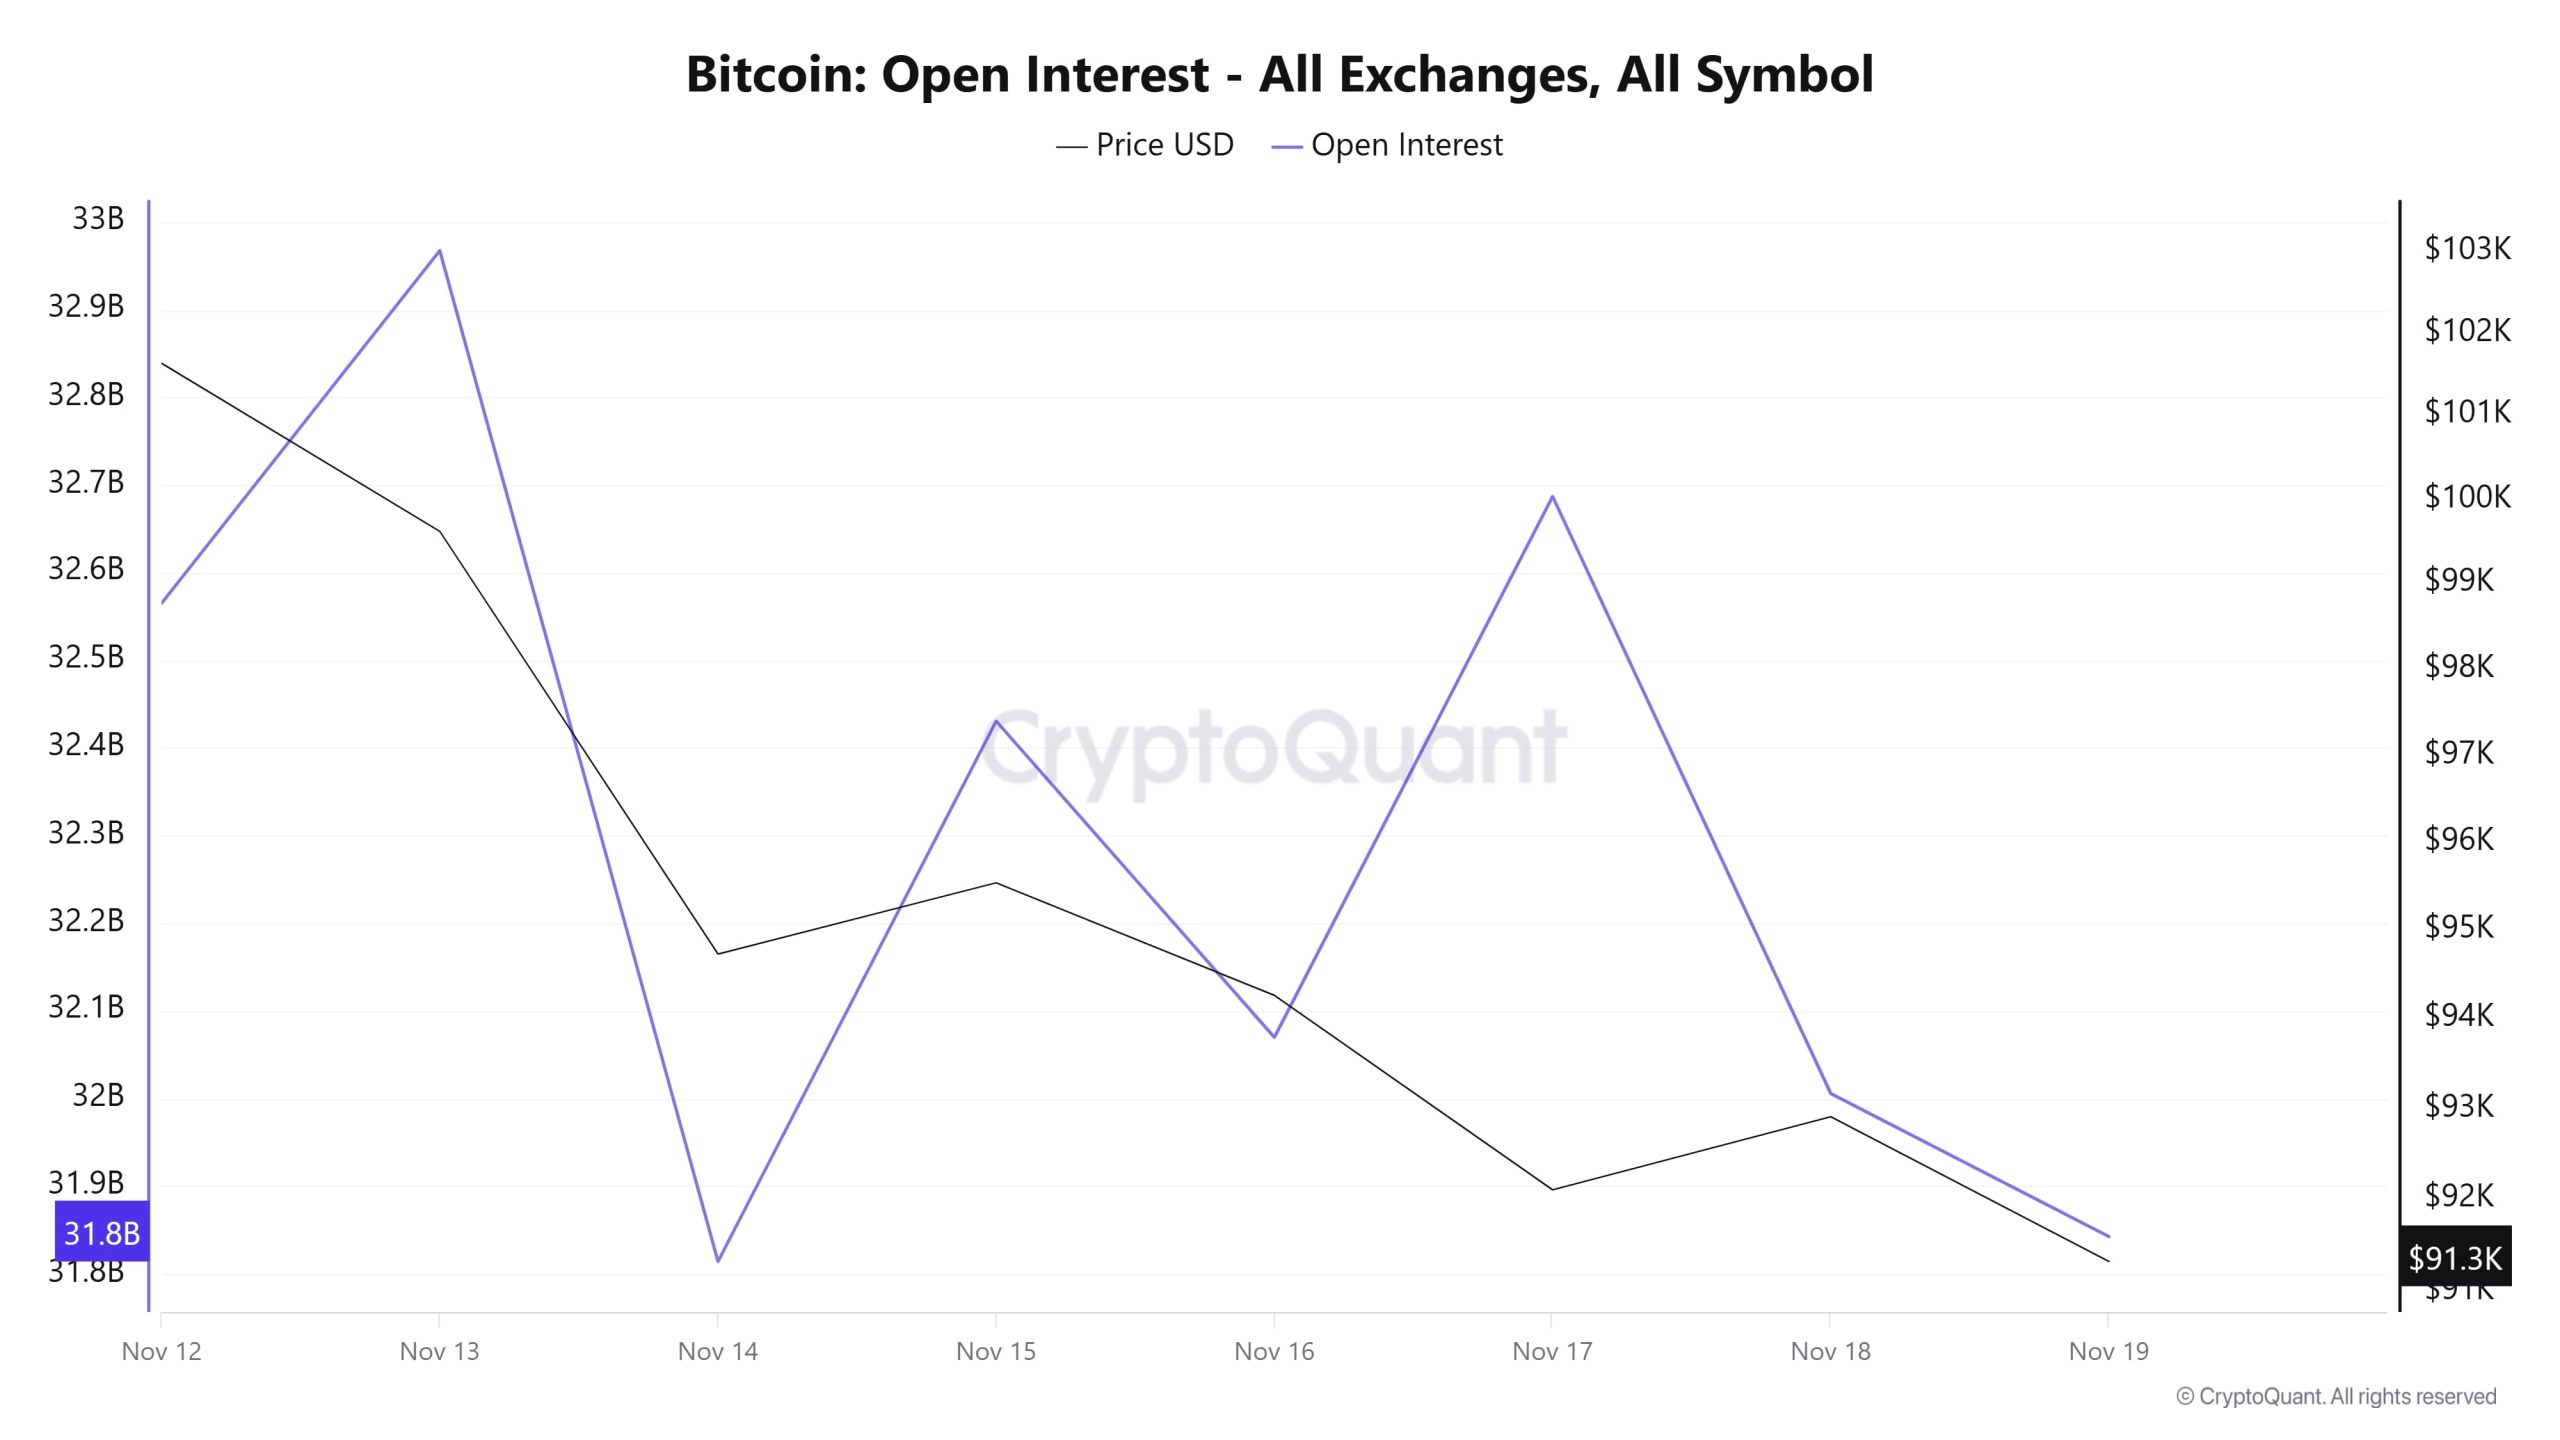
The chart shows a fluctuating but generally downward trend en Bitcoin’s open positions between 12 and 19 November. Open interest hovered between $32.5 and $33 billion en the first days of the week, but experienced a sharp decline el 14 November, falling to $31.8 billion. Although there were short-term recovery attempts en the middle of the week, these increases were not sustained. On 17 November, open interest jumped upwards again but immediately returned to a downward trend. As of the last day, both the price and open interest showed a weak picture. Overall, this period indicates a decrease en leveraged positions en the market and more cautious behavior among investors.
Funding Rate
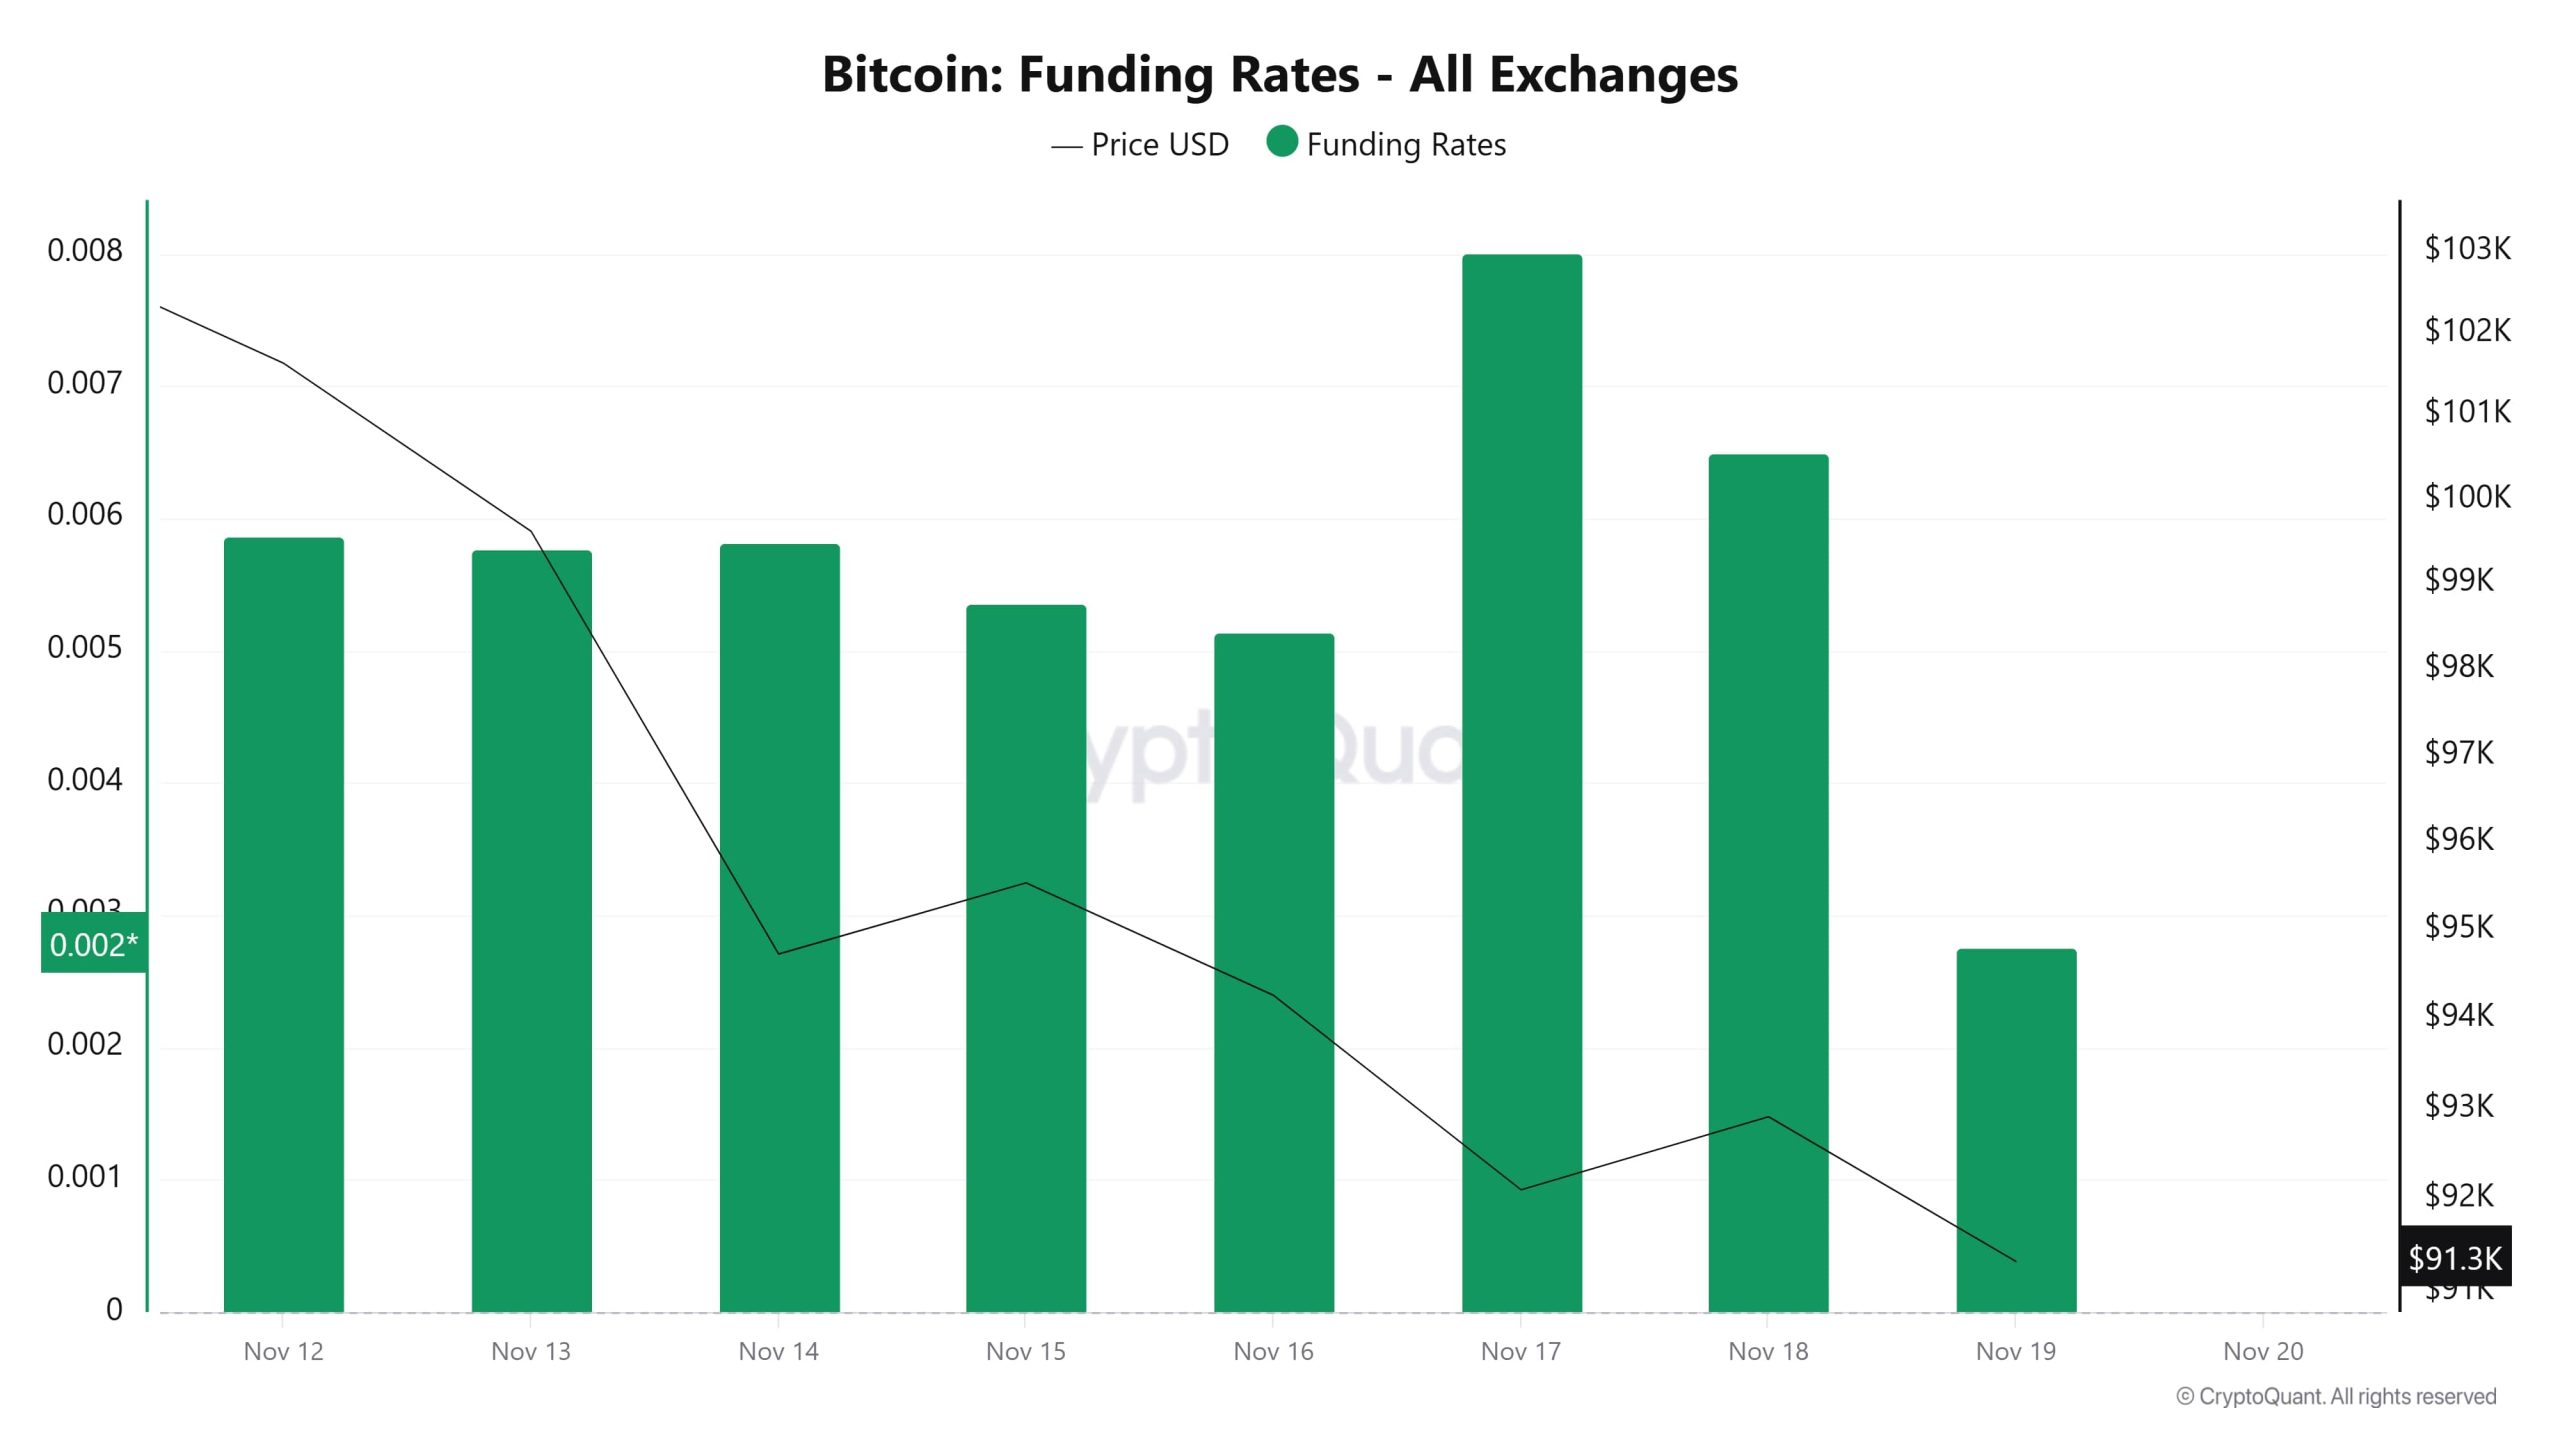
Bitcoin’s funding rates show a generally positive but volatile trend. While rates remained stable around 0.005–0.006 en the first days of the week, funding declined slightly during the November 14–16 period when the price moved downward. On November 17, however, there was a noticeable jump, and the funding rate reached its highest level. This indicates stronger demand el the long side that day. However, both the price and funding then weakened again, with rates dropping noticeably el November 19. The overall picture shows sustained appetite for long positions throughout the market, but investors becoming more cautious as price pressure increases.
Long & Short Liquidations
With the BTC price falling from $105,000 to $89,000 last week, the market saw $2.538 billion en long and $182 million en short liquidations.
| Date | Long Volume (Million $) |
Short Volume (Million $) |
|---|---|---|
| November 12 | 78.48 | 19.29 |
| November 13 | 329.45 | 35.12 |
| November 14 | 1036.04 | 36.86 |
| November 15 | 30.48 | 11.87 |
| November 16 | 101.10 | 17.95 |
| November 17 | 726.24 | 22.77 |
| November 18 | 236.64 | 39.04 |
| Total | 2538.43 | 182.90 |
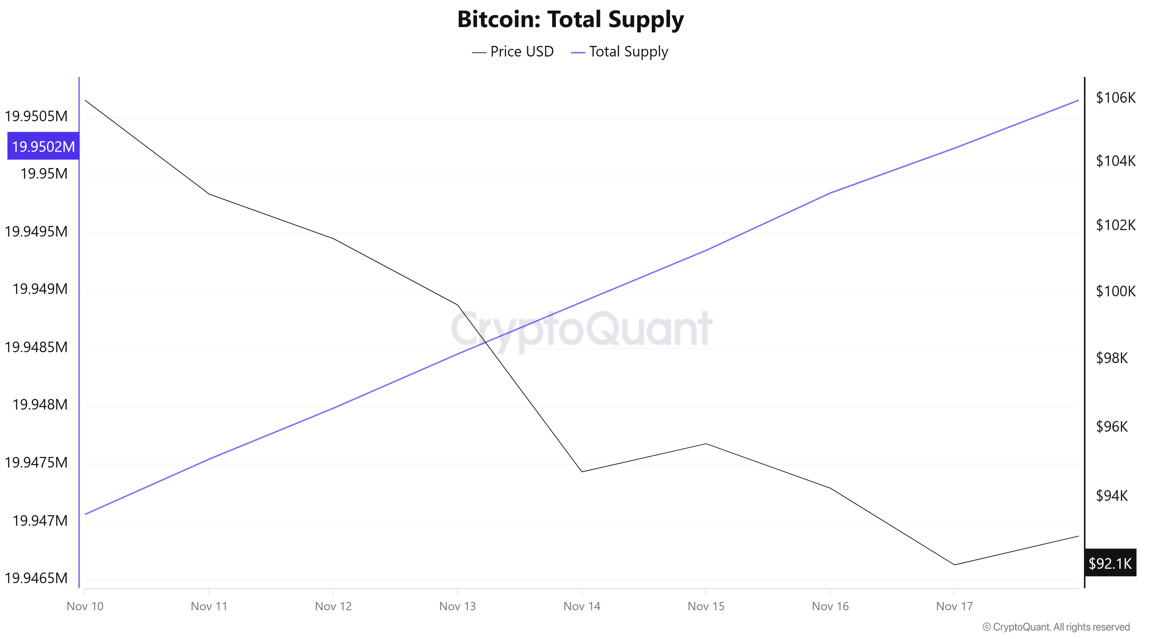
Supply Distribution

Total Supply: Reached 19,950,233 units, an increase of approximately 0.0159% compared to last week.
New Supply: The amount of BTC produced this week was 3,169.
Velocity: Last week’s velocity of 12.28 was 12.25 as of November 17.
| Wallet Categoría | Nov 10, 2025 | Nov 17, 2025 | Change (%) |
|---|---|---|---|
| < 1 BTC | 8.4488% | 8.4489% | +0.0012% |
| 1 – 10 BTC | 11.3700% | 11.3603% | −0.0854% |
| 10 – 100 BTC | 24.6430% | 24.6548% | +0.0478% |
| 100 – 1k BTC | 30.1280% | 30.2449% | +0.3881% |
| 1k – 10k BTC | 17.2920% | 17.2580% | −0.1966% |
| 10k+ BTC | 8.1177% | 8.0257% | −1.1321% |
According to the latest weekly data, the Bitcoin wallet distribution showed a mixed picture. The share of wallets with a balance of less than 1 BTC rose from 8.4488% to 8.4489%, showing a very limited increase of approximately 0.001%. The share of wallets en the 1–10 BTC range fell from 11.3700% to 11.3603%, a decrease of approximately 0.085%. The share of wallets en the 10–100 BTC range increased from 24.6430% to 24.6548%, showing a slight increase of approximately 0.047%. The share of wallets en the 100–1,000 BTC range rose from 30.1280% to 30.2449%, recording a notable increase of approximately 0.38% el a weekly basis. The share of wallets en the 1,000–10,000 BTC range fell from 17.2920% to 17.2580%, showing a limited decrease of approximately 0.19%. The share of wallets holding 10,000 BTC or more fell from 8.1177% to 8.0257%, showing a decrease of approximately 1.13% el a weekly basis. In the overall picture, slight fluctuations were observed en small and medium-sized wallet groups, with a limited accumulation trend particularly evident en wallets holding between 100 and 1,000 BTC, while a dissolution en the largest wallet category was notable as of this week.
Exchange Supply Ratio
According to data obtained from the Bitcoin Exchange Supply Ratio table, which shows how much of the total supply of Bitcoins is held el exchanges, low rates have been observed this week. The general trend shows that as of November 14, there is a negative correlation between the Bitcoin price and the supply rate entering exchanges. This indicates that most Bitcoins are beginning to be withdrawn from wallets and that the market is not ready to buy.
Between November 12 and November 19, the Bitcoin Exchange Supply Ratio decreased from 0.11937973 to 0.11925753. During this period, the Bitcoin price fell from $99,000 to $92,000. Notably, the divergence en the direction of these two variables this week indicates a decrease en the amount of Bitcoin supplied to exchanges despite the price decline, suggesting that long-term investors may have begun reducing their holdings. A general downward trend en the Bitcoin price appears likely.
Exchange Reserve
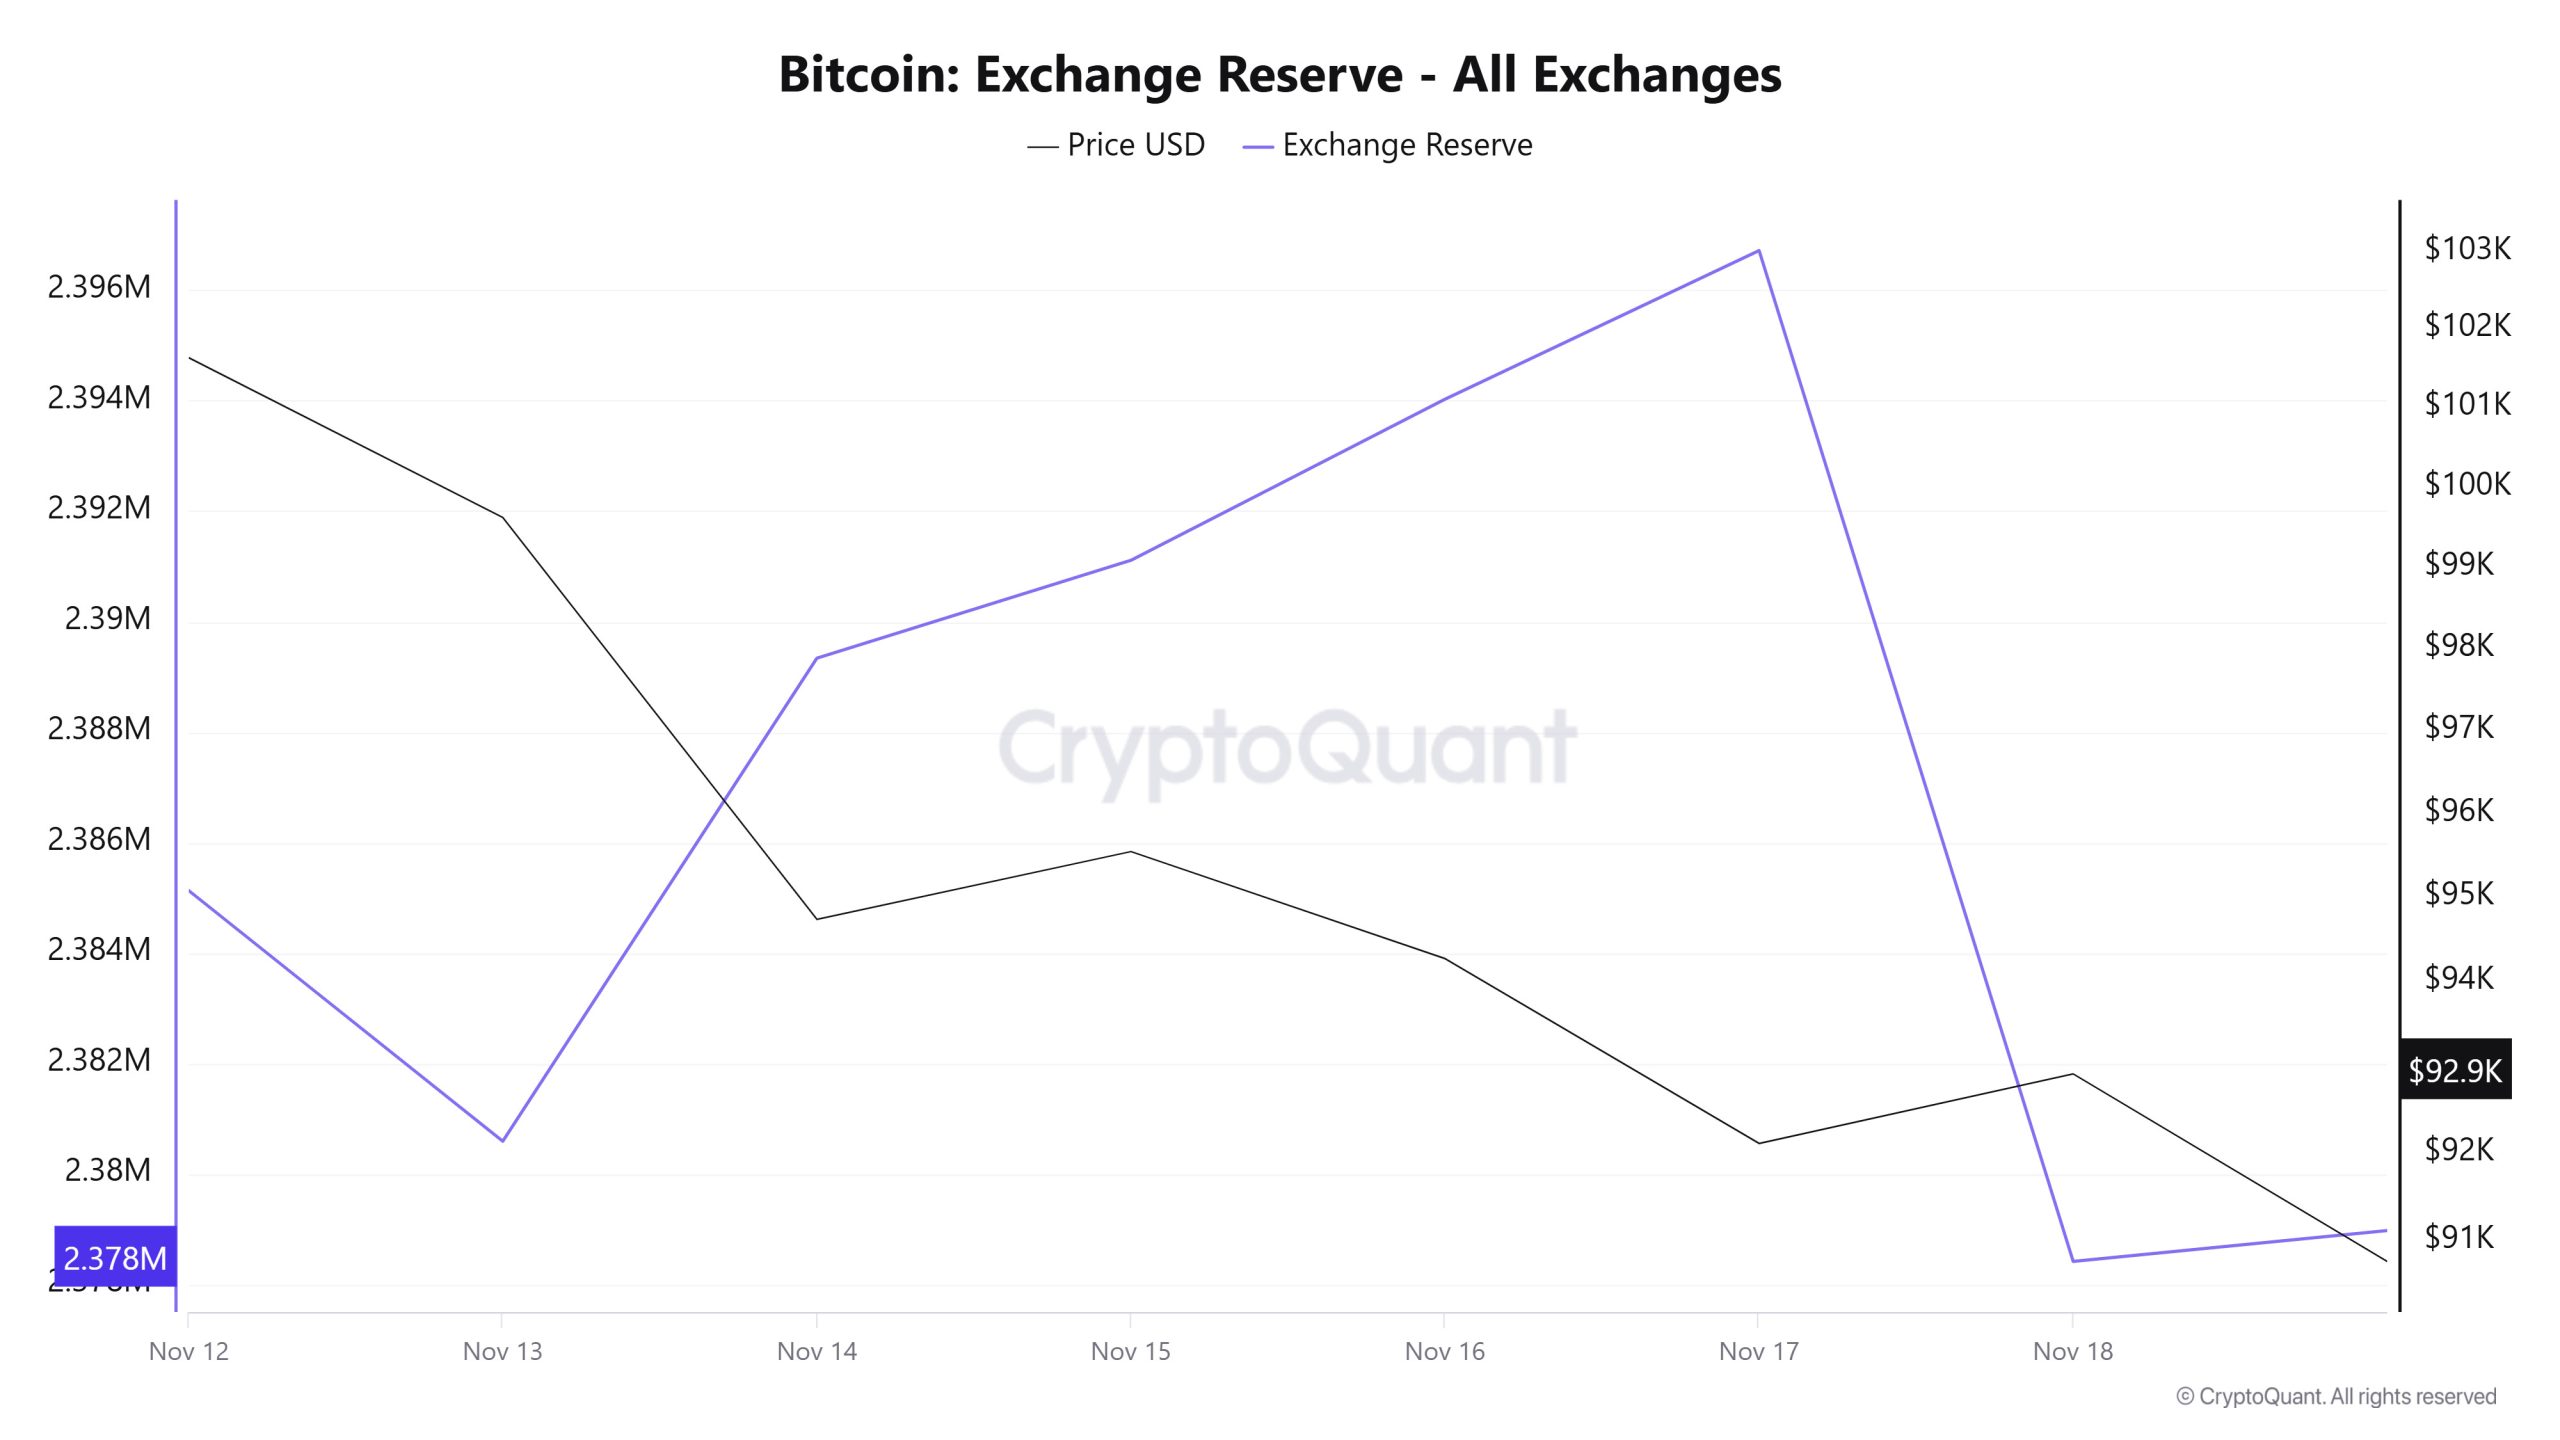
Between November 12 and 18, 2025, Bitcoin reserves el exchanges declined from 2,387,610 BTC to 2,378,419 BTC, resulting en a net outflow of 9,191 BTC. During this period, reserves decreased por approximately 0.38%, while the BTC price fell from $103,102 to $92,914, losing 9.88% of its value. The decline en exchange reserves during this period of sharp price decline indicates that most of the selling was done through exchanges and that investors were cautious. As buying appetite en the market is weak, no strong momentum has emerged to support a short-term recovery. With selling pressure el the price likely to persist en the short term, volatility may increase.
| Date | Exchange Inflow | Exchange Outflow | Exchange Netflow | Exchange Reserve | BTC Price ($) |
|---|---|---|---|---|---|
| 12-Nov | 22,019 | 24,497 | -2,478 | 2,385,132 | 103,102 |
| 13-Nov | 33,887 | 38,424 | -4,537 | 2,380,595 | 99,621 |
| 14-Nov | 71,558 | 62,812 | 8,746 | 2,389,341 | 94,731 |
| 15-Nov | 16,341 | 14,570 | 1,771 | 2,391,112 | 95,538 |
| 16-Nov | 16,970 | 14,053 | 2,916 | 2,394,028 | 94,266 |
| 17-Nov | 58,392 | 55,702 | 2,690 | 2,396,718 | 92,108 |
| 18-Nov | 53,444 | 71,743 | -18,299 | 2,378,419 | 92,914 |
Fees and Revenues
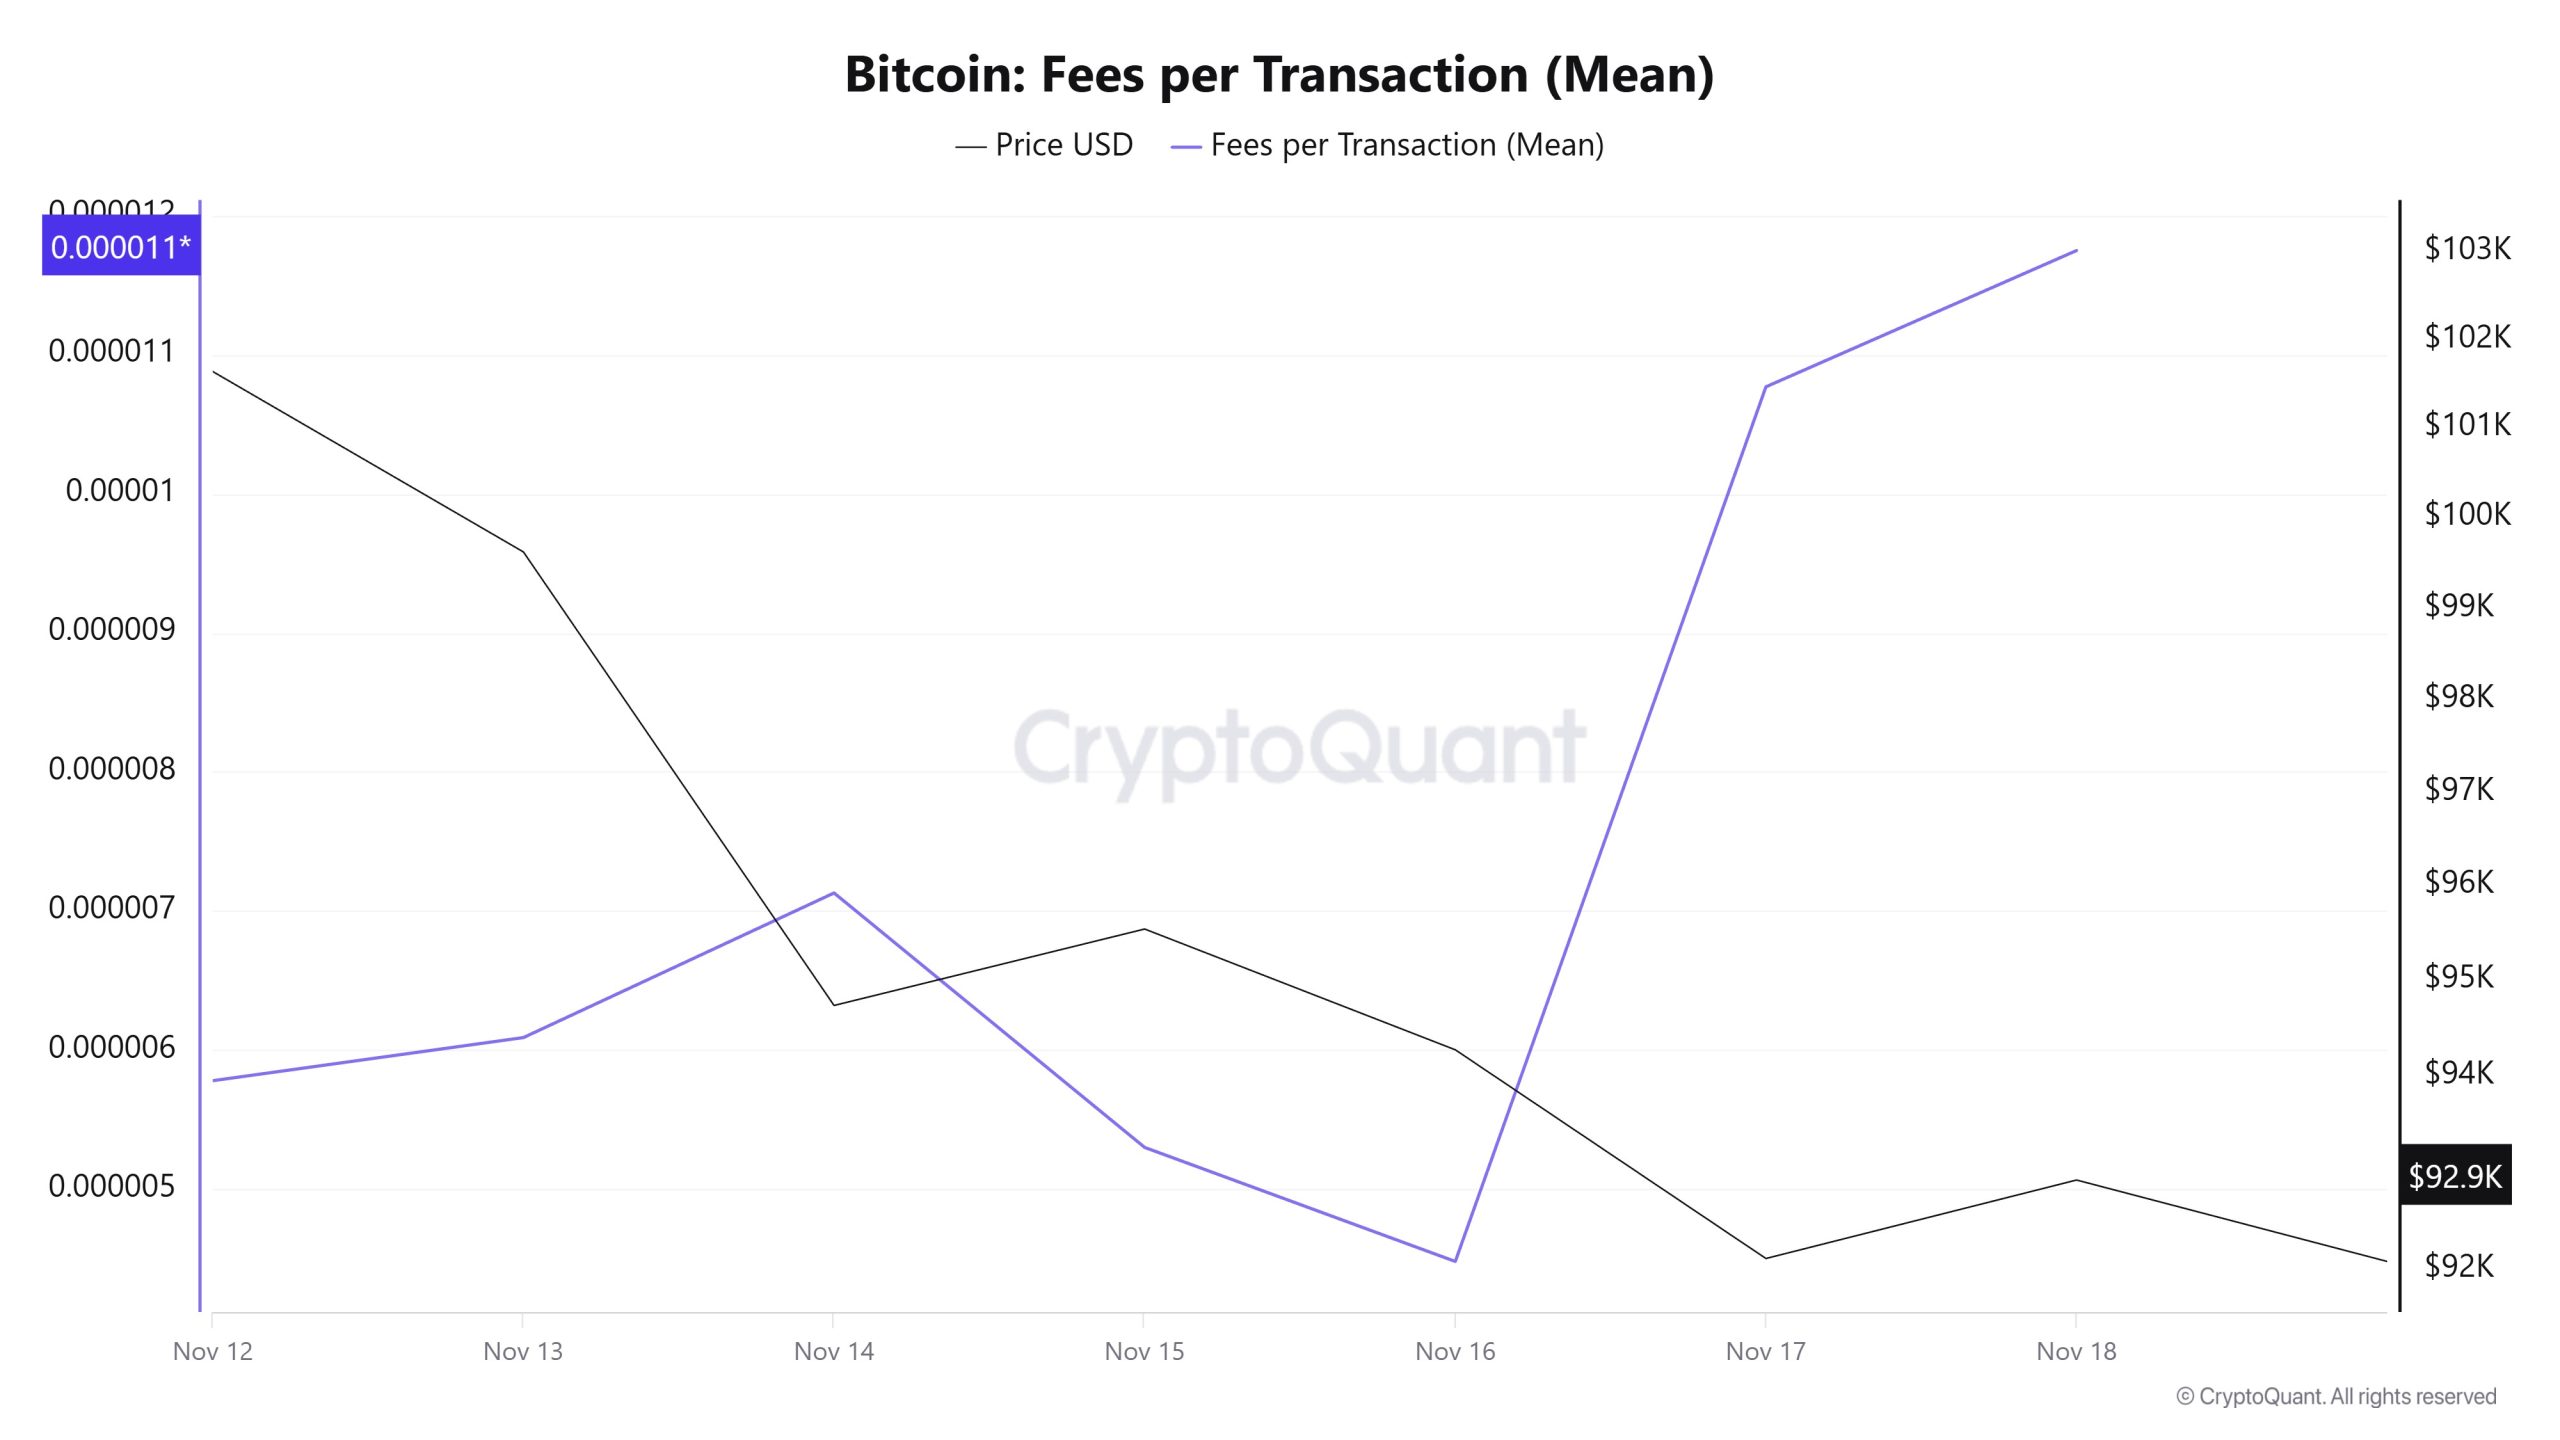
When examining the Bitcoin Fees per Transaction (Mean) data for the period between November 12-18, it is observed that the indicator reached 0.00000578 el November 12, the first day of the week.
A fluctuating trend was observed until November 16, and el that date, the indicator recorded its lowest value of the week at 0.00000448.
In this context, as a result of a significant increase en Bitcoin price volatility as of November 16, the indicator regained momentum and followed a positive trend due to the impact of price volatility.
On November 18, the last day of the weekly period, the indicator closed the week at 0.00001175.
Bitcoin: Fees (Total)
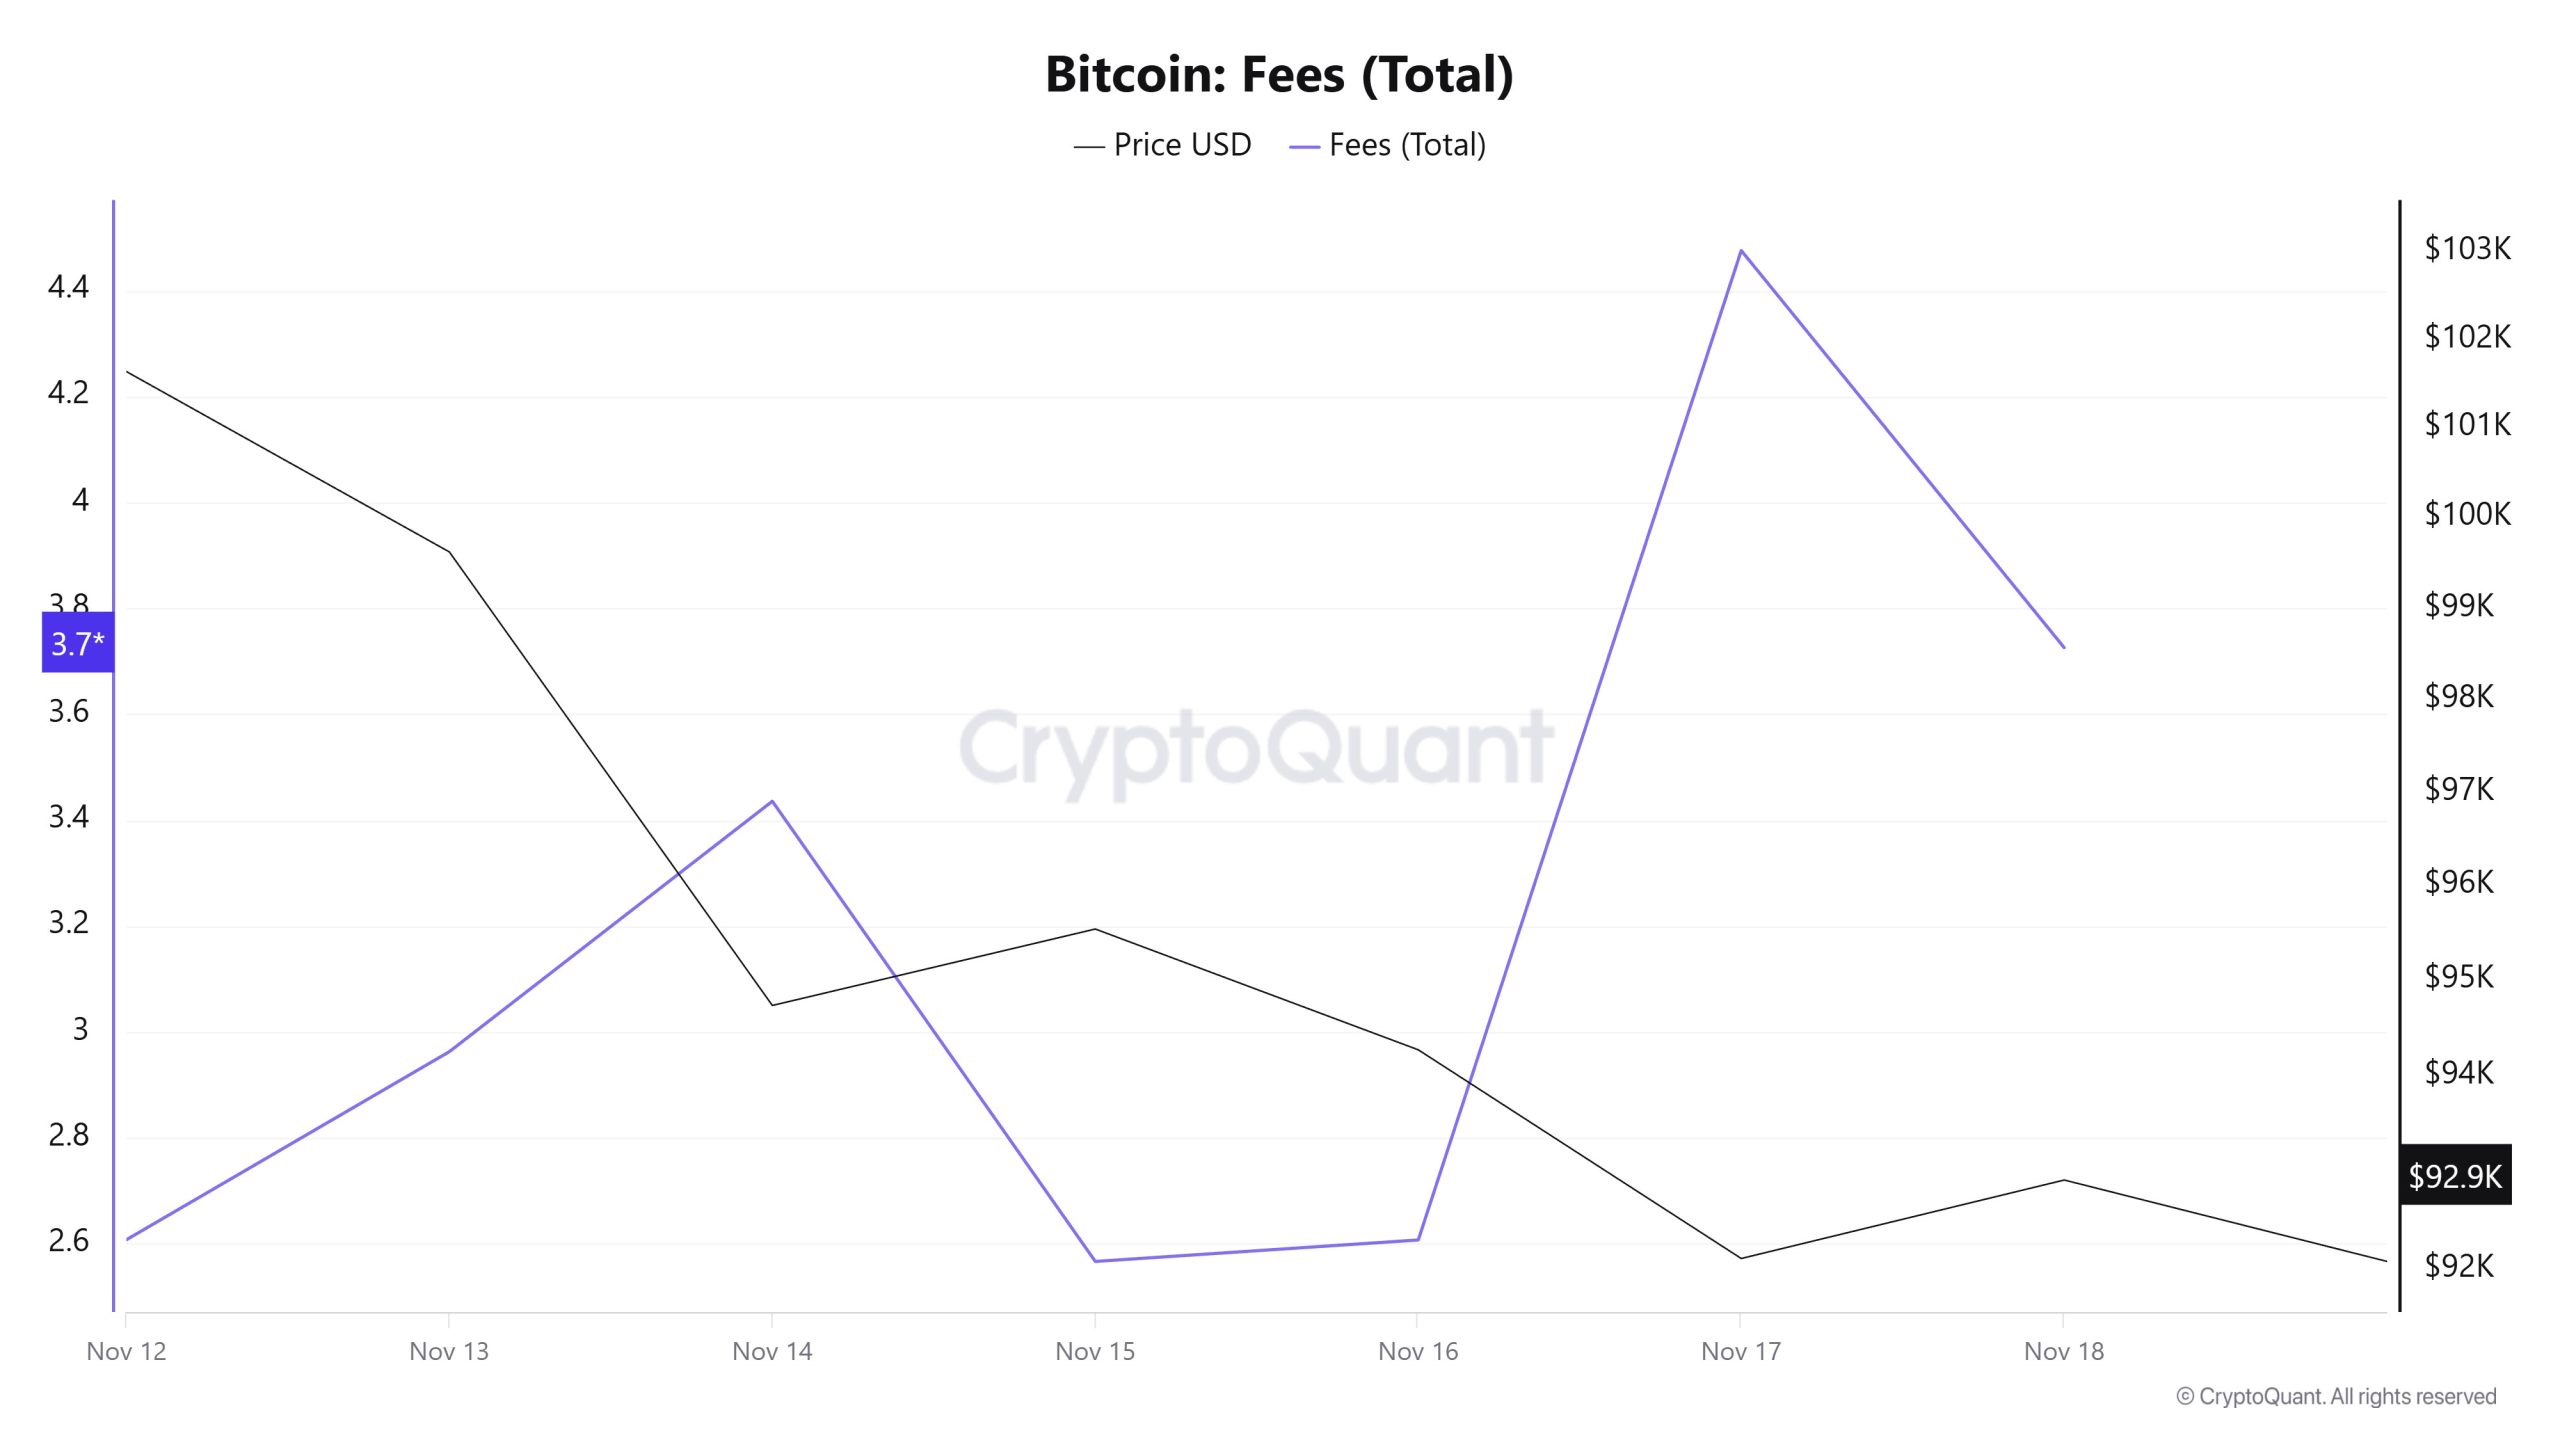
Similarly, when examining the Bitcoin Fees (Total) data for the period between November 12 and 18, it is observed that the indicator reached 2.60791945 el November 12, the first day of the week.
A fluctuating trend was observed until November 15, and el this date, the indicator recorded the week’s lowest value at 2.56695356.
In this context, as of November 16, a significant increase en Bitcoin price volatility resulted en the indicator regaining momentum and following a positive trend due to the impact of price volatility.
On November 18, the last day of the weekly period, the indicator closed the week at 3.72578633.
Miner Flows
“Bitcoin Miner Reserve Visual to be Added”
According to data obtained from the Miner Reserve table, this week has seen sharp intraday fluctuations en the Bitcoin reserves held en miners’ wallets, but overall, a limited upward trend has been observed. During the period under review, a fluctuating correlation structure stands out, with Bitcoin price and miner reserves moving en the same direction el some days and en opposite directions el others. The overall picture for this week indicates a weak relationship dominated por short-term fluctuations rather than a clear and strong correlation between price and miner reserves.
Miner Inflow, Outflow, and Netflow
Between November 12 and 18, 65,085 Bitcoin were withdrawn from miners’ wallets, while 65,267 Bitcoin were deposited into miners’ wallets during the same period. This week’s Miner Netflow was 182 Bitcoin. Meanwhile, the Bitcoin price was $101,634 el November 12 and $92,914 el November 18.
Throughout the week, Bitcoin inflows into miner wallets (Miner Inflow) were higher than Bitcoin outflows from miner wallets (Miner Outflow), resulting en a positive net flow (Miner Netflow).
| Date | Miner Inflow | Miner Outflow | Miner Netflow |
|---|---|---|---|
| Nov. 12 | 5,683.83 | 5,364.40 | 319.43 |
| Nov. 13 | 9,602.32 | 9,551.90 | 50.42 |
| Nov. 14 | 14,635.74 | 13,958.70 | 677.04 |
| Nov. 15 | 5,385.09 | 6,687.03 | −1,301.94 |
| Nov. 16 | 6,070.26 | 4,902.95 | 1,167.31 |
| Nov. 17 | 11,548.47 | 11,719.66 | −171.19 |
| Nov. 18 | 12,341.16 | 12,900.23 | −559.07 |
Transaction
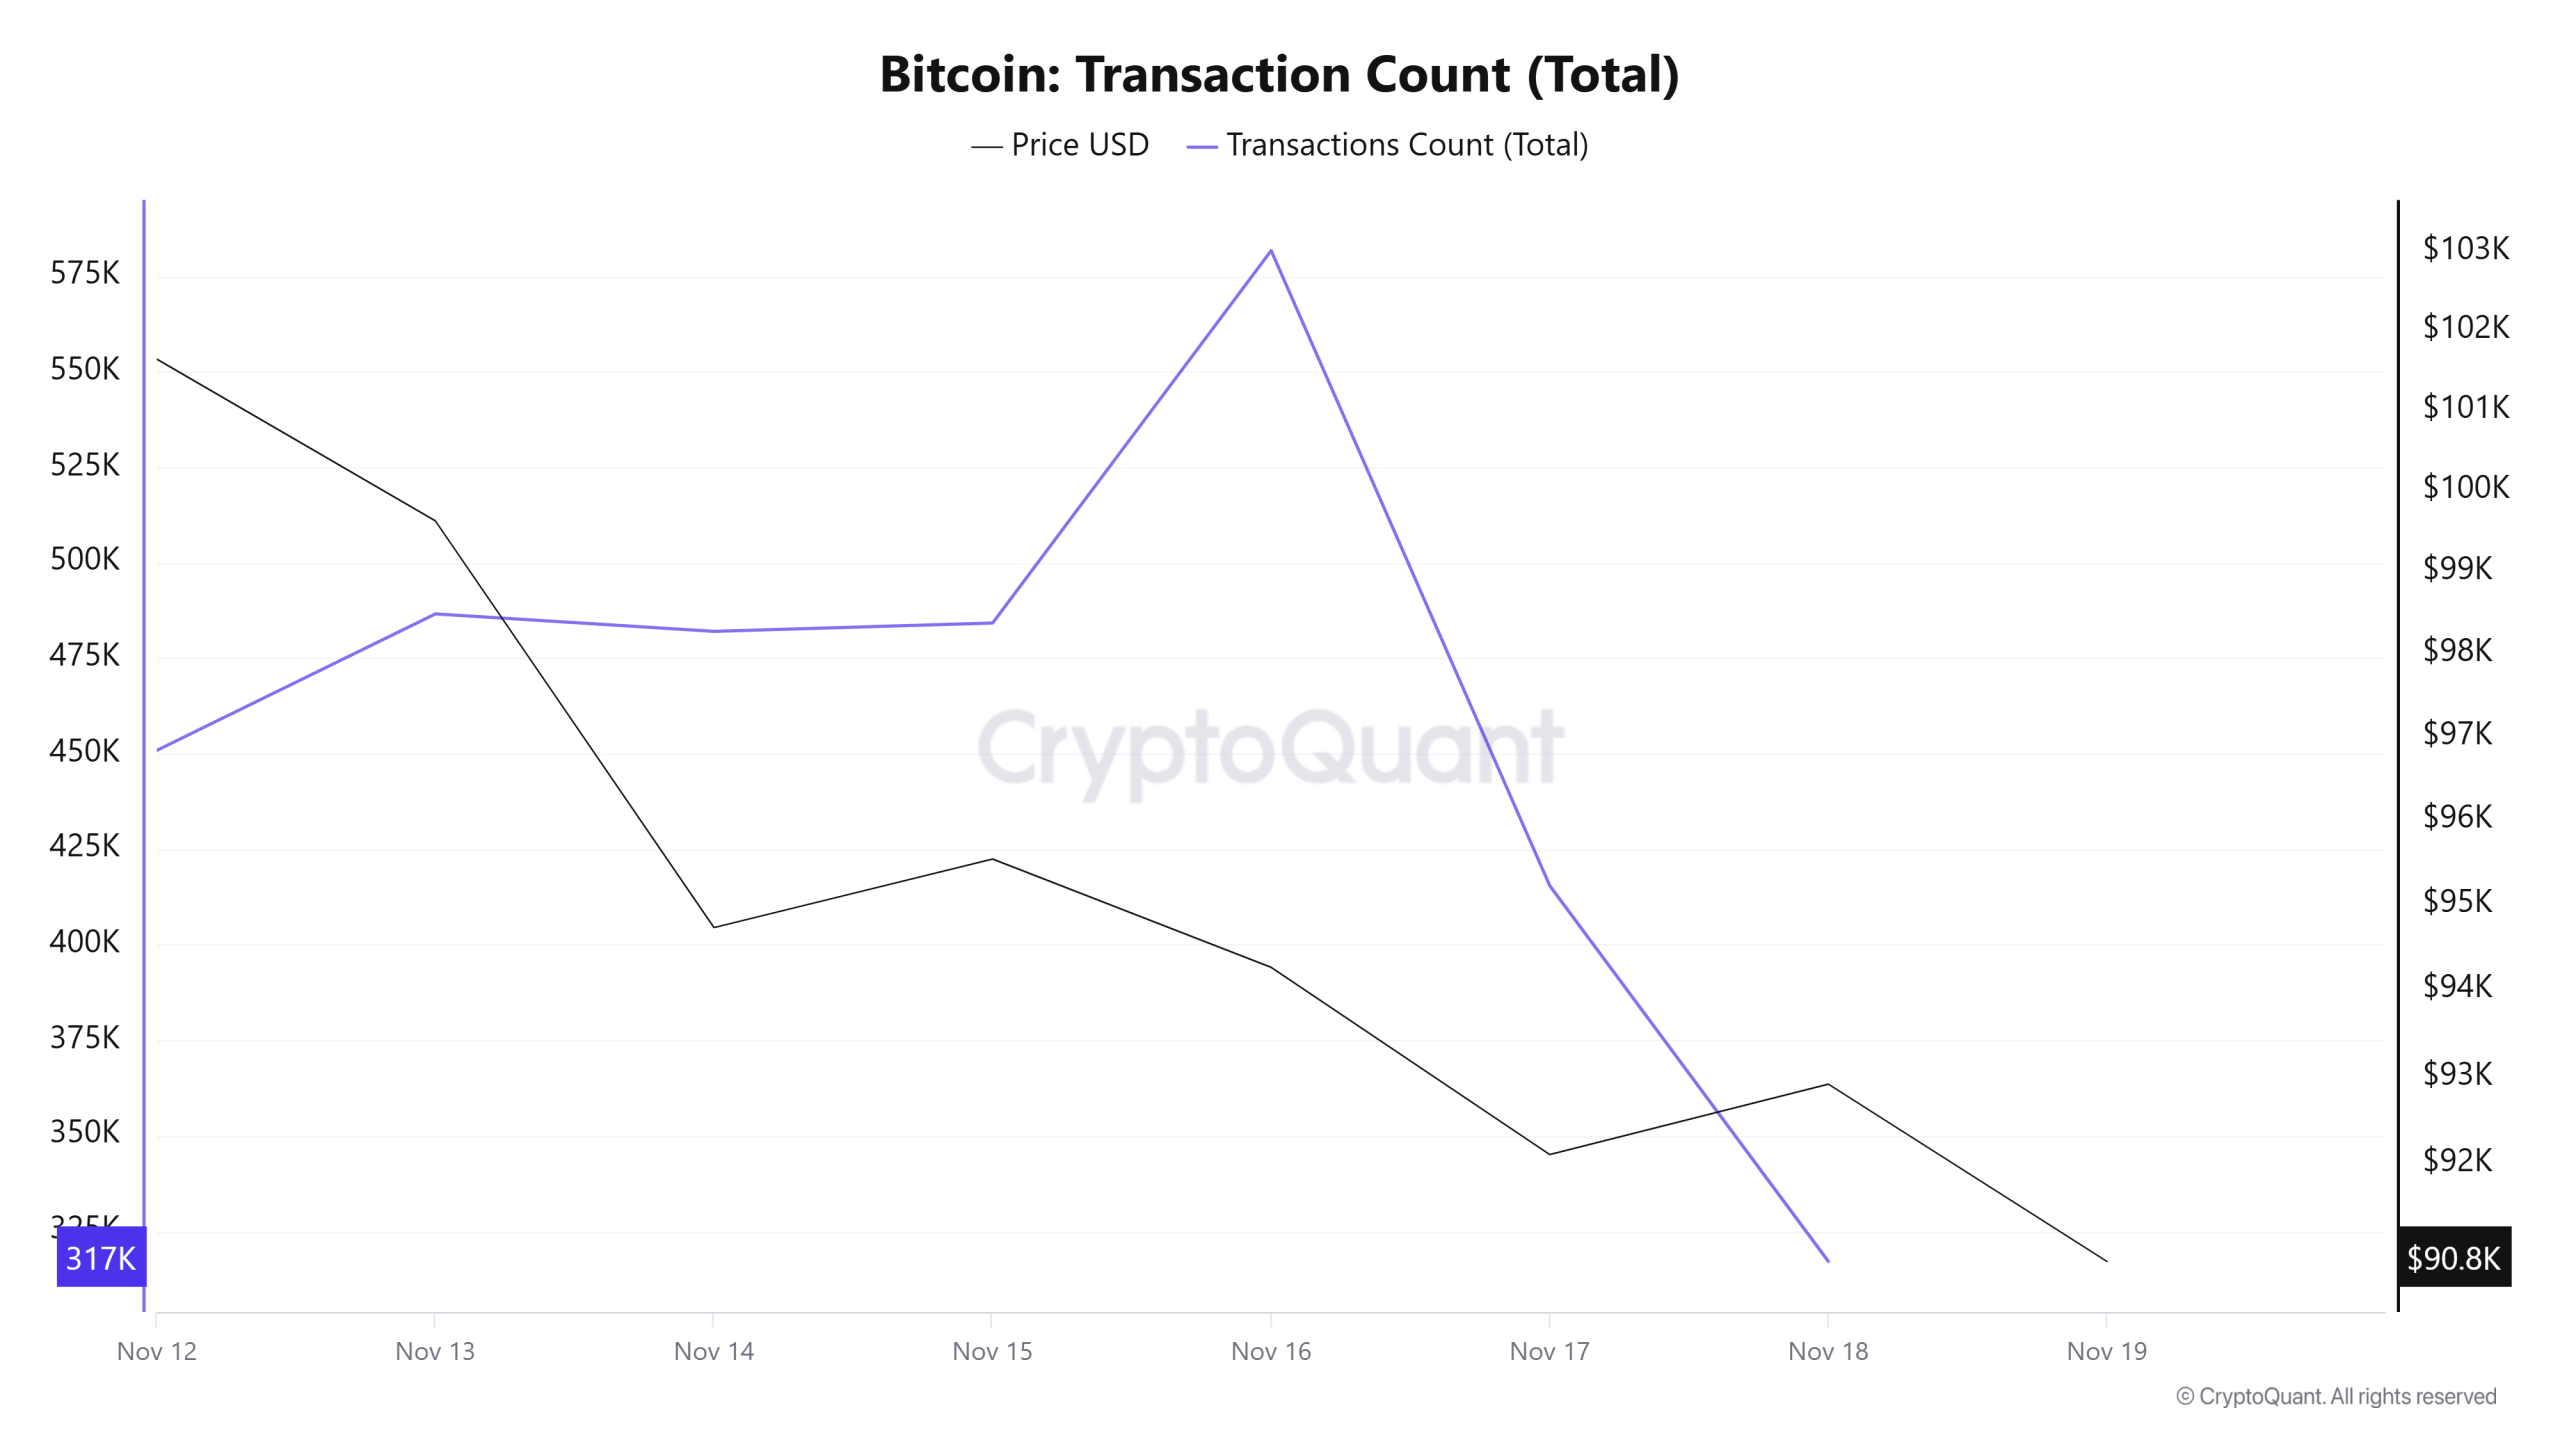
Last week, 3,036,930 transactions were executed el the Bitcoin network, while this week the number of transactions increased por 5.96% to reach 3,217,864. The highest transaction volume of the week was recorded el November 16 at 581,693, while the lowest transaction count was recorded el November 18 at 317,106. When examining the relationship between transaction count and price, a balanced correlation was observed throughout the week. On the other hand, the surge en weekend activity, which had not been seen for several weeks, appears to have resumed this week.
It is noteworthy that en almost all weeks when prices fell sharply, el-chain activity intensified over the weekend, while during periods of flat or rising prices, activity was more intense during the week.
Tokens Transferred
During the previous period, a total of 5,633,523 BTC was transferred, while this week it increased por 20% to reach 6,760,478 BTC. The highest daily transfer of the week was recorded el November 18 at 1,342,779 BTC, while the lowest transfer volume was recorded el November 15 at 672,462 BTC. The correlation between the amount of tokens transferred and the price remained positively weighted el a weekly basis. In particular, the sharp increase en transfer volumes between November 15 and 18 raised the number of tokens transferred to the level at the beginning of the period, compared to the 50% drop en a single move between October 14 and 15.
As the amount of Bitcoin transferred increases, the smaller increase en the number of transactions indicates the presence of higher-value, higher-volume, and more frequent transactions during this period. This pattern suggests that the network is exhibiting more active and larger user behavior. However, the decline en price indicates that this is due to selling.
Whale Activities
Whales Data:
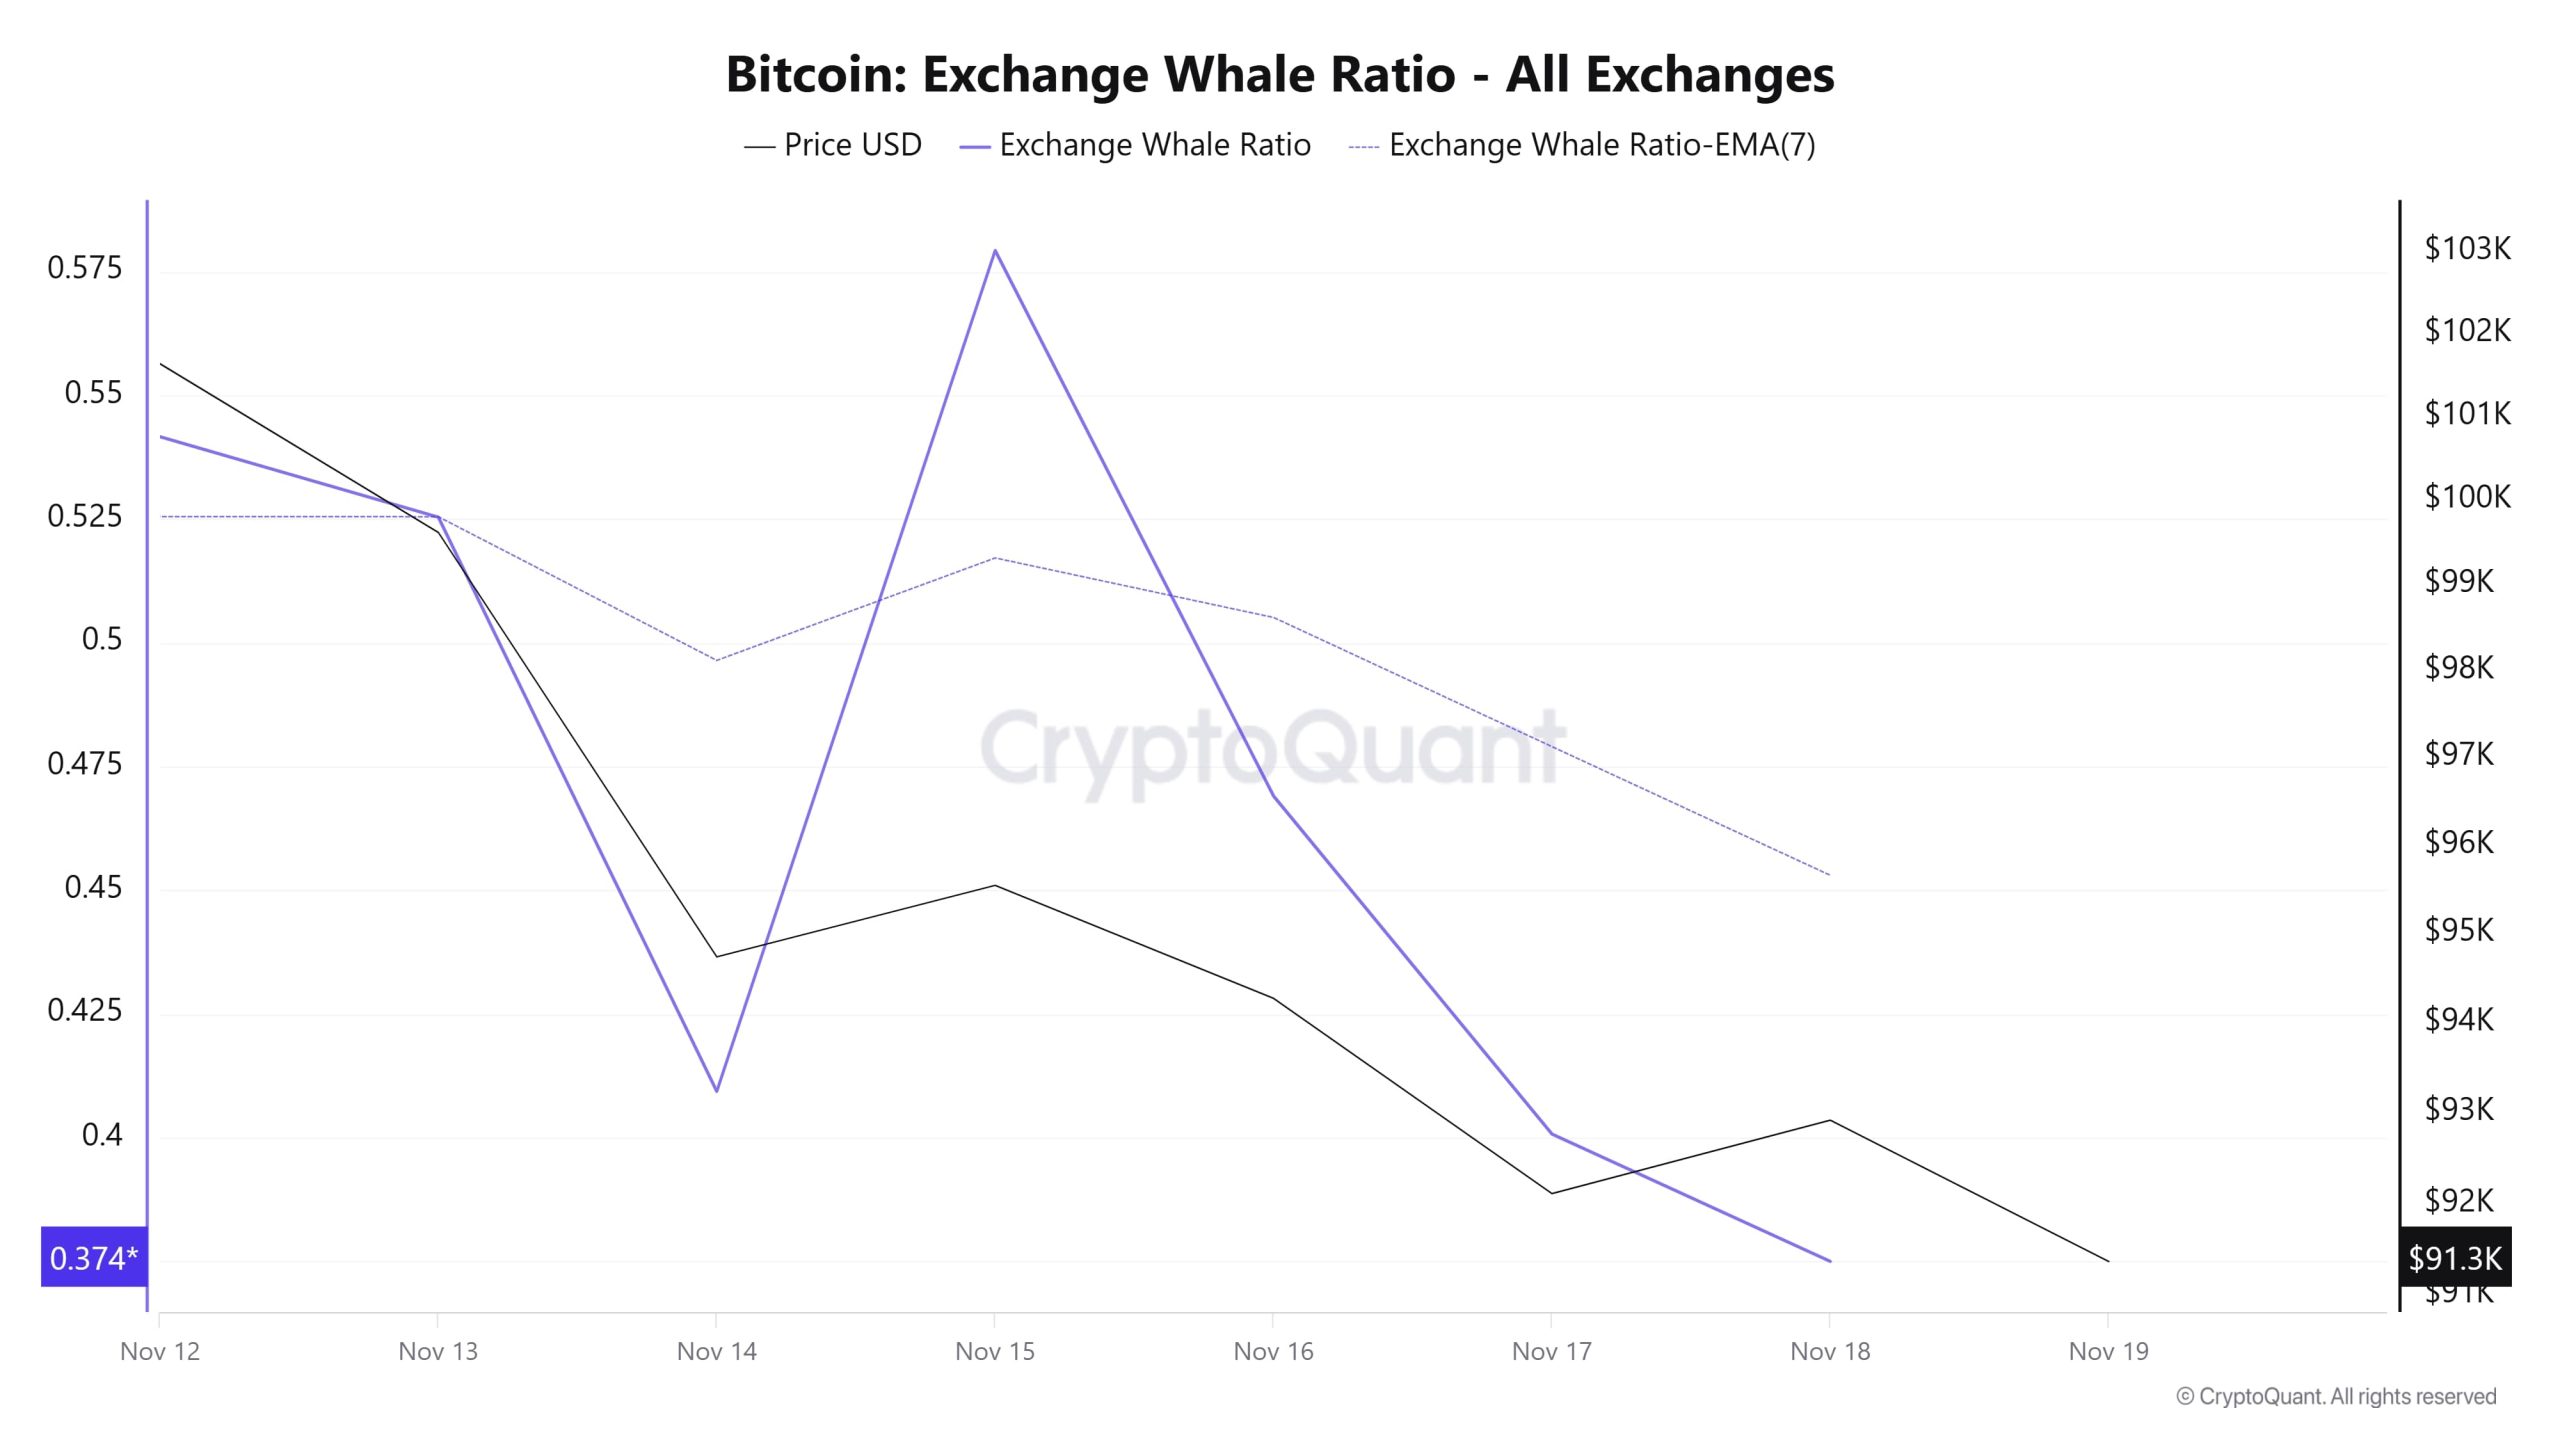
Looking at whale activity el centralized exchanges over the past 7 days based el cryptocurrency market data, we see that although there was an uptrend en a narrow time frame en the middle of the process, there was a downward trend towards the end. Looking at the Exchange Whale Ratio metric, el November 12, the first day of the 7-day period, the ratio of whales using centralized exchanges was 0.541. It peaked el November 15, rising to 0.579. When this ratio is above the 0.35–0.45 range, it generally means that whales are frequently using centralized exchanges. Currently at 0.374, the metric shows that whales are using centralized exchanges very little. This value also marked the lowest point of the process. During this process, BTC was priced between $105,100 and $89,000. This indicated that centralized exchanges were being used por whales to sell. At the same time, total BTC transfers increased por 21% compared to last week, with 6,760,462 BTC moving. Data shows whale accumulation during price declines: In the first half of November 2025, whales holding between 1,000 and 10,000 BTC accumulated over 45,000 BTC, making it one of the largest weekly accumulations of the year. This indicates that large-scale investors view price declines as a buying opportunity and are strengthening their long-term holding strategy despite broader market uncertainty. On the other hand, it shows that long-term wallets have accumulated over 345,000 BTC since October, representing the largest buying wave en recent times. As a result, this contrast between retail panic and institutional confidence appears to have become the defining feature of the current market environment.
BTC Onchain Overall
| Metric | Positive 📈 | Negative 📉 | Neutral ➖ |
|---|---|---|---|
| Active Addresses | ✓ | ||
| Breakdowns | ✓ | ||
| Derivatives | ✓ | ||
| Supply Distribution | ✓ | ||
| Exchange Supply Ratio | ✓ | ||
| Exchange Reserve | ✓ | ||
| Fees and Revenues | ✓ | ||
| Miner Flows | ✓ | ||
| Transaction | ✓ | ||
| Whale Activity | ✓ |
*The metrics and guidance provided en the table do not alone explain or imply any expectation of future price changes for any asset. Digital asset prices can fluctuate based el many different variables. The el-chain analysis and related guidance are intended to assist investors en their decision-making process, and basing financial investments solely el the results of this analysis may lead to unfavorable outcomes. Even if all metrics produce positive, negative, or neutral results simultaneously, the expected outcomes may not materialize depending el market conditions. It would be beneficial for investors reviewing the report to take these warnings into consideration.
Legal Notice
The investment information, comments, and recommendations contained en this document do not constitute investment advisory services. Investment advisory services are provided por authorized institutions el a personal basis, taking into account the risk and return preferences of individuals. The comments and recommendations contained en this document are of a general nature. These recommendations may not be suitable for your financial situation and risk and return preferences. Therefore, making an investment decision based solely el the information contained en this document may not result en outcomes that align with your expectations.
NOTE: All data used en Bitcoin el-chain analysis is based el CryptoQuant.

