Active Adresses
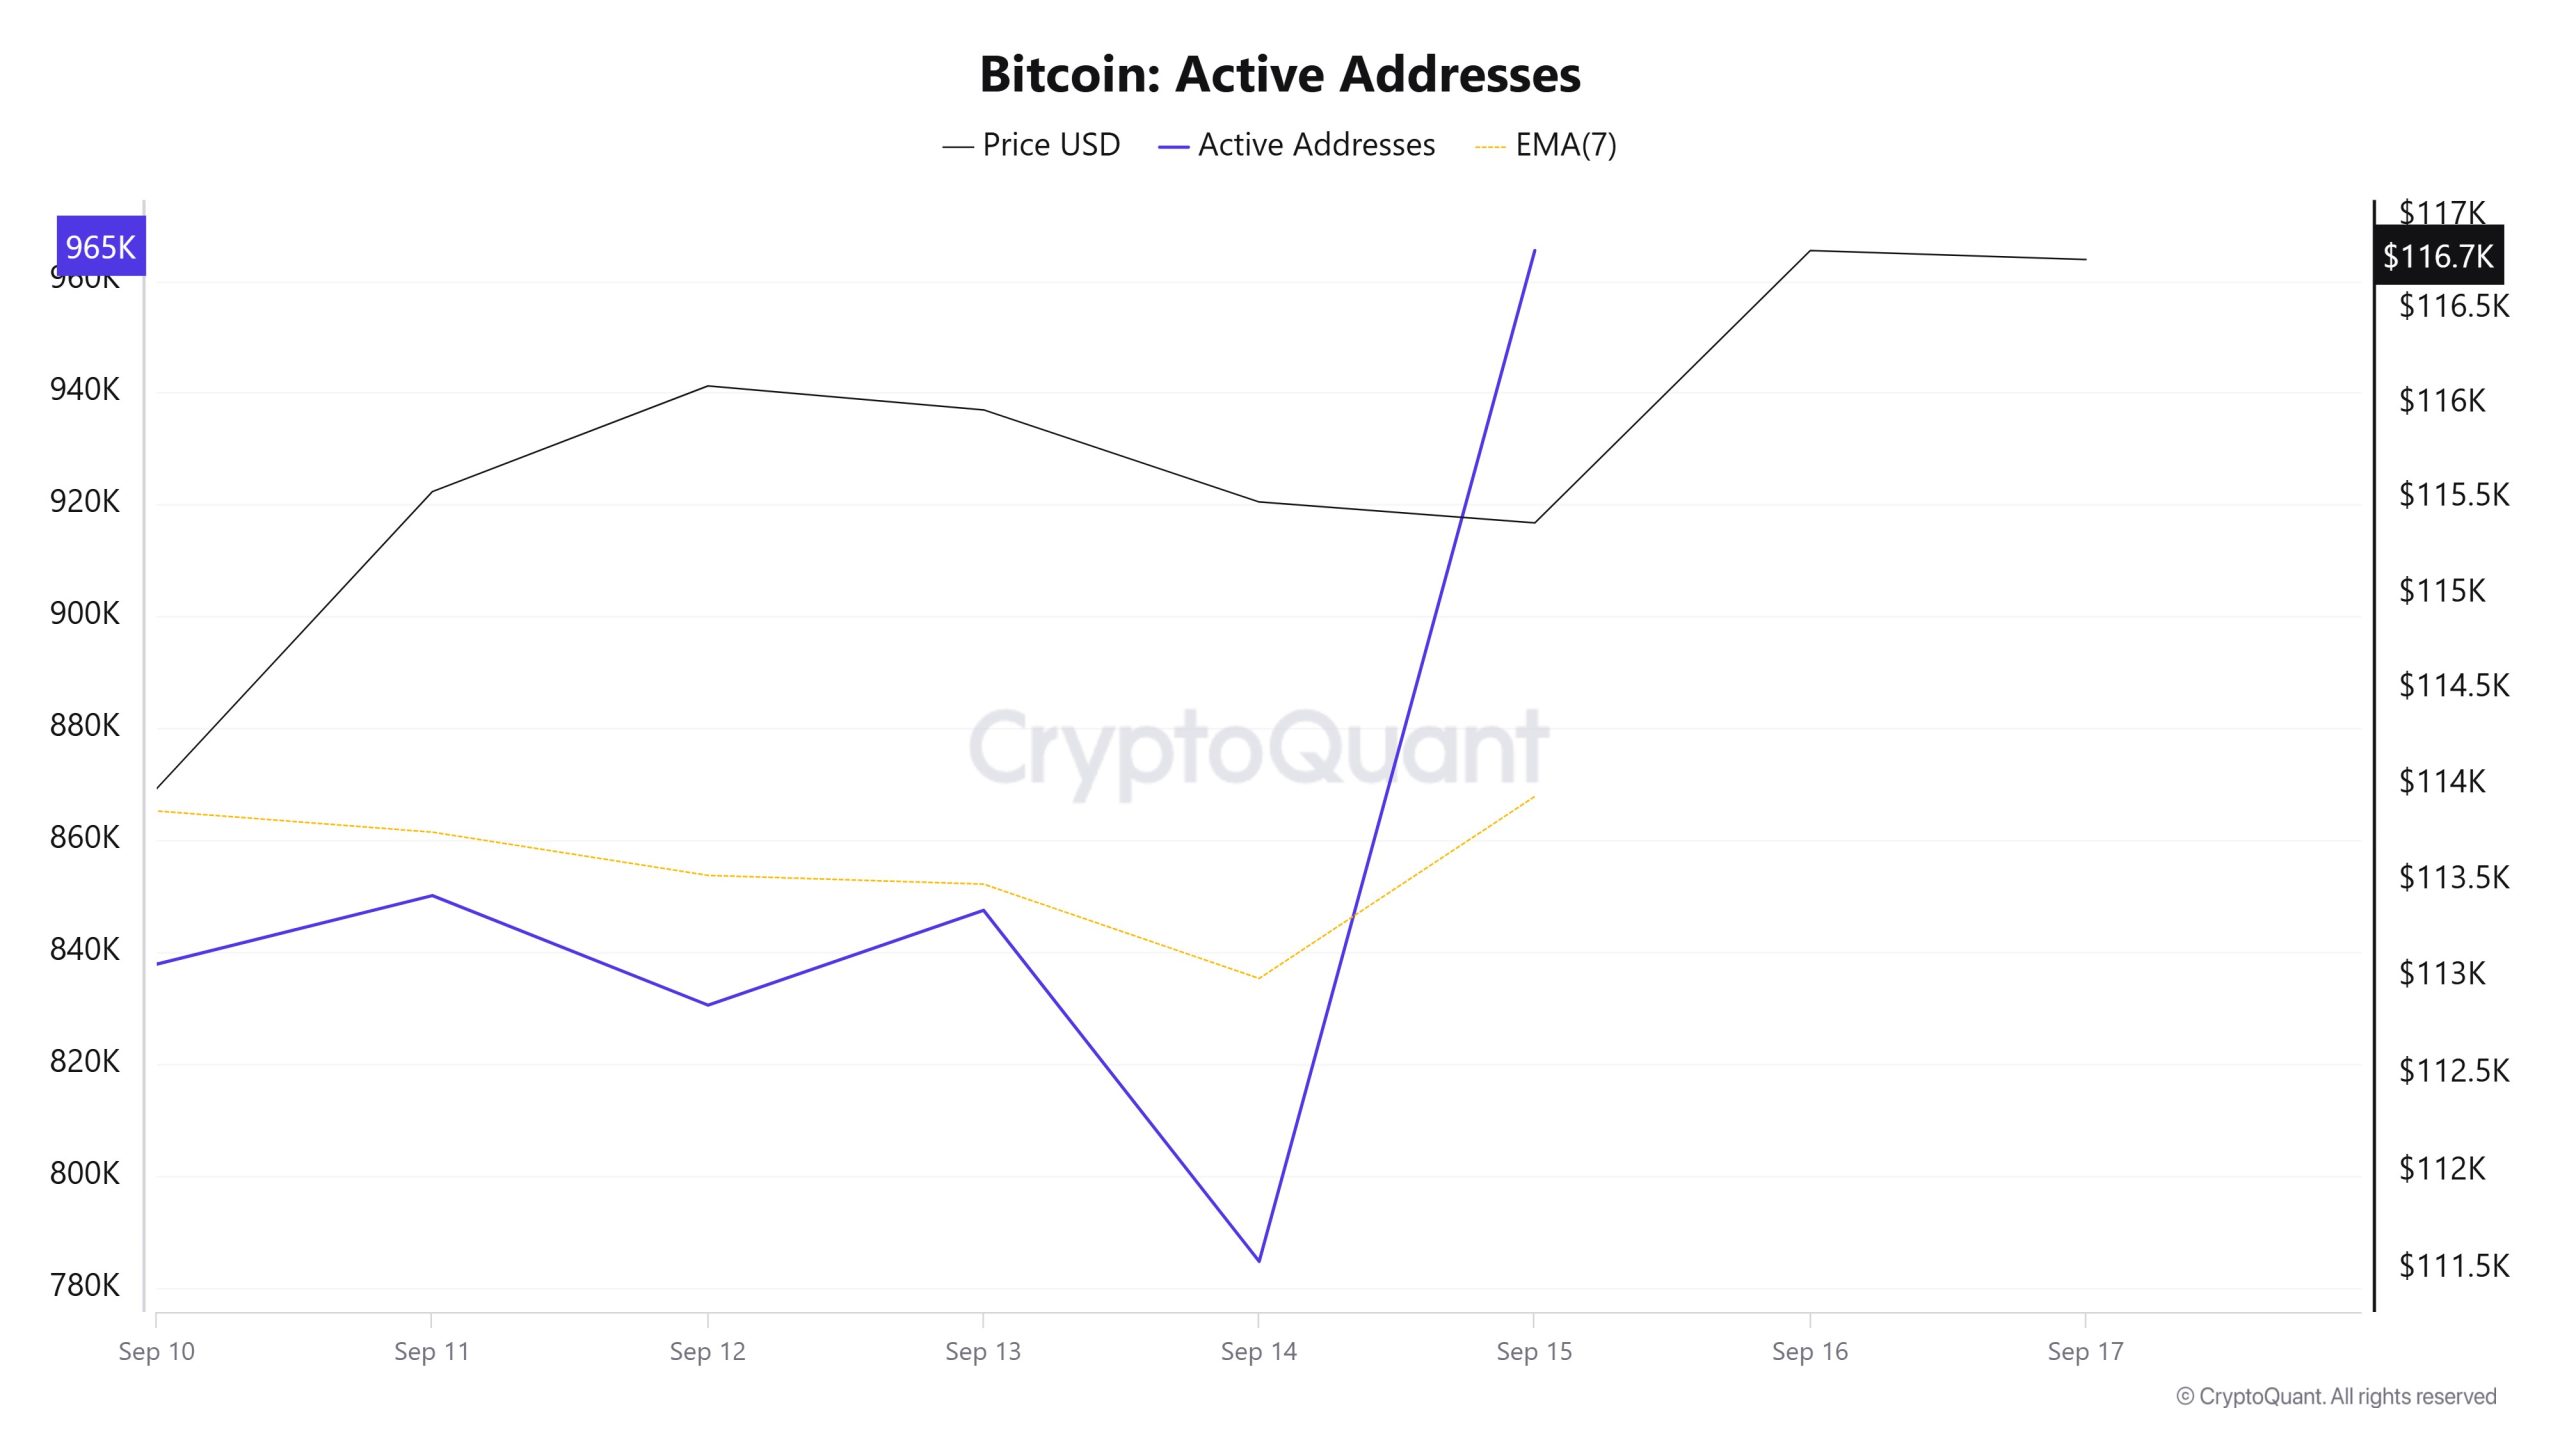
Between September 10 and September 17, 965,410 active addresses entered the Bitcoin network. In this process, the Bitcoin price rose up to $116,000. Especially el September 14, the decline en the number of active addresses was observed to move the price en the band towards $ 115,000, while Bitcoin went to $ 116,000 with the increase en the number of active addresses el September 15. From a technical point of view, it is noteworthy that there were upward movements at the intersection of the 7-day simple moving average (SMA) with the price el September 10. This technical signal indicates buying el the market.
Active Sending Addresses
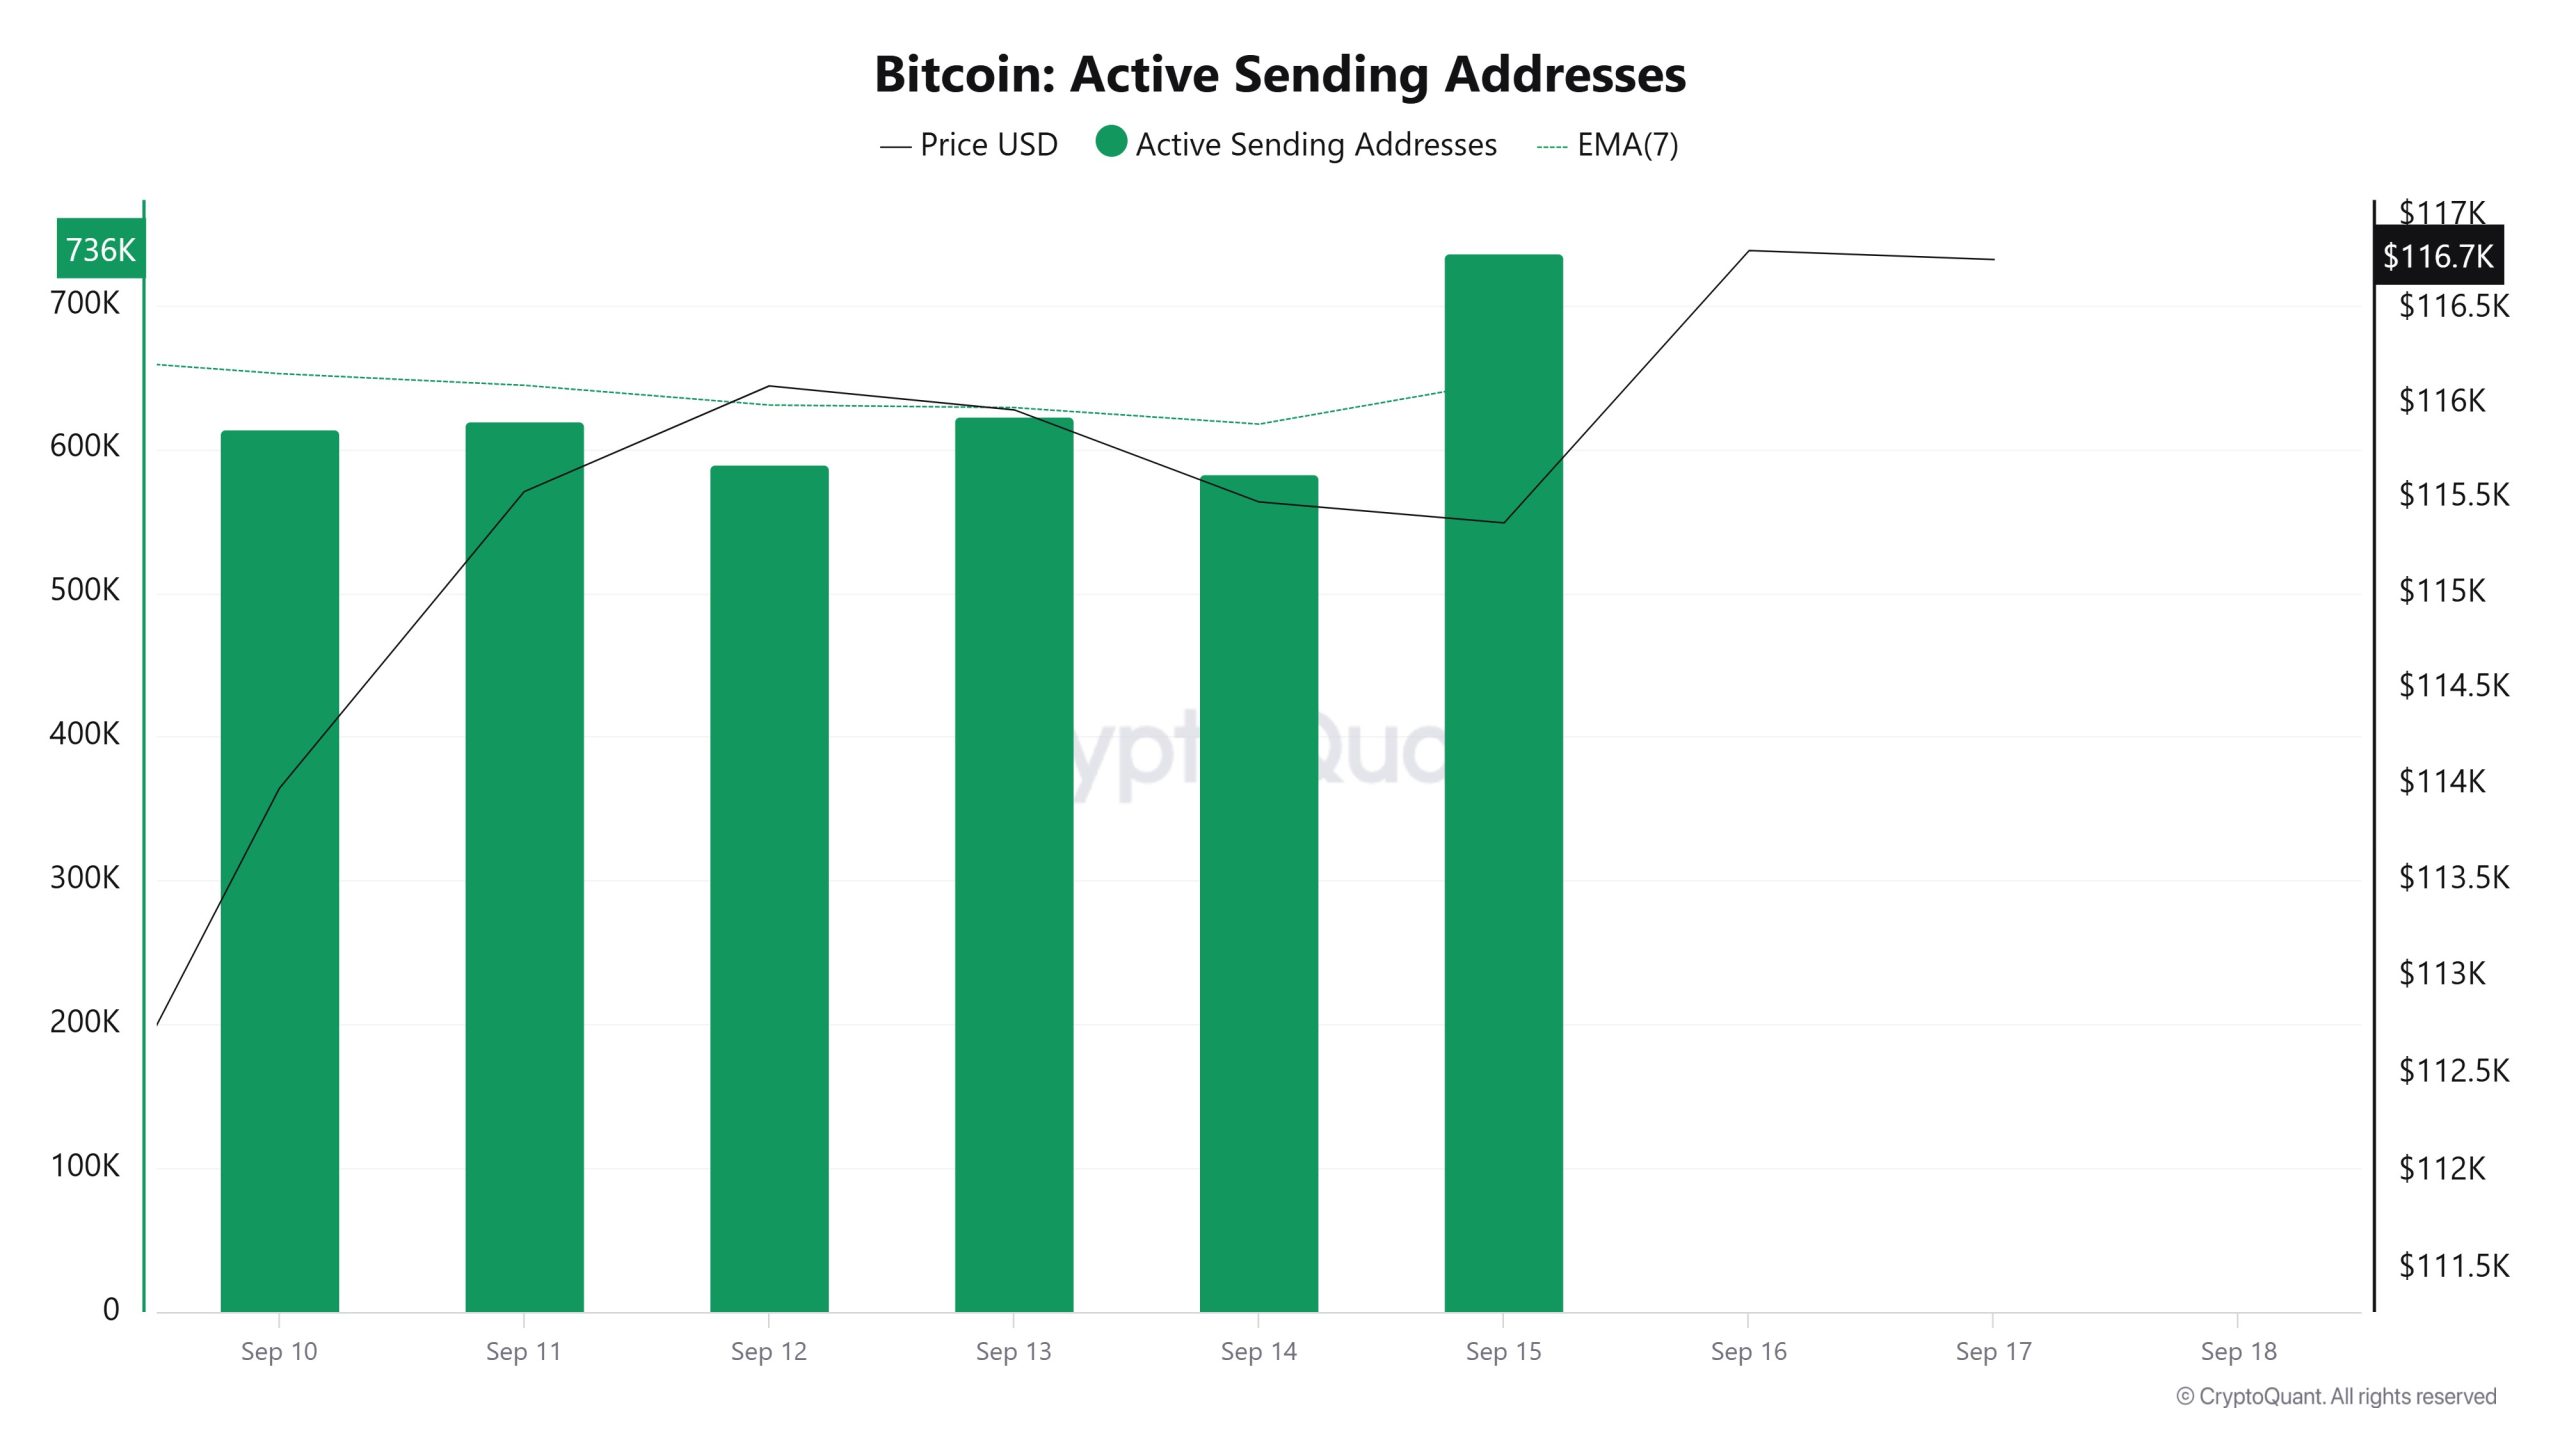 Between September 10 and September 17, there was an upward trend en the “Active Sending Addresses” metric. On the day of the price high, this metric stood at 736,451, indicating that user activity el the Bitcoin network has moved en tandem with the price. This data suggests that the $116,000 level has bullish support not only en terms of price, but also en terms of el-chain address activity. Overall, the Active Sending Addresses metric trended upwards during this period.
Active Receiving Addresses
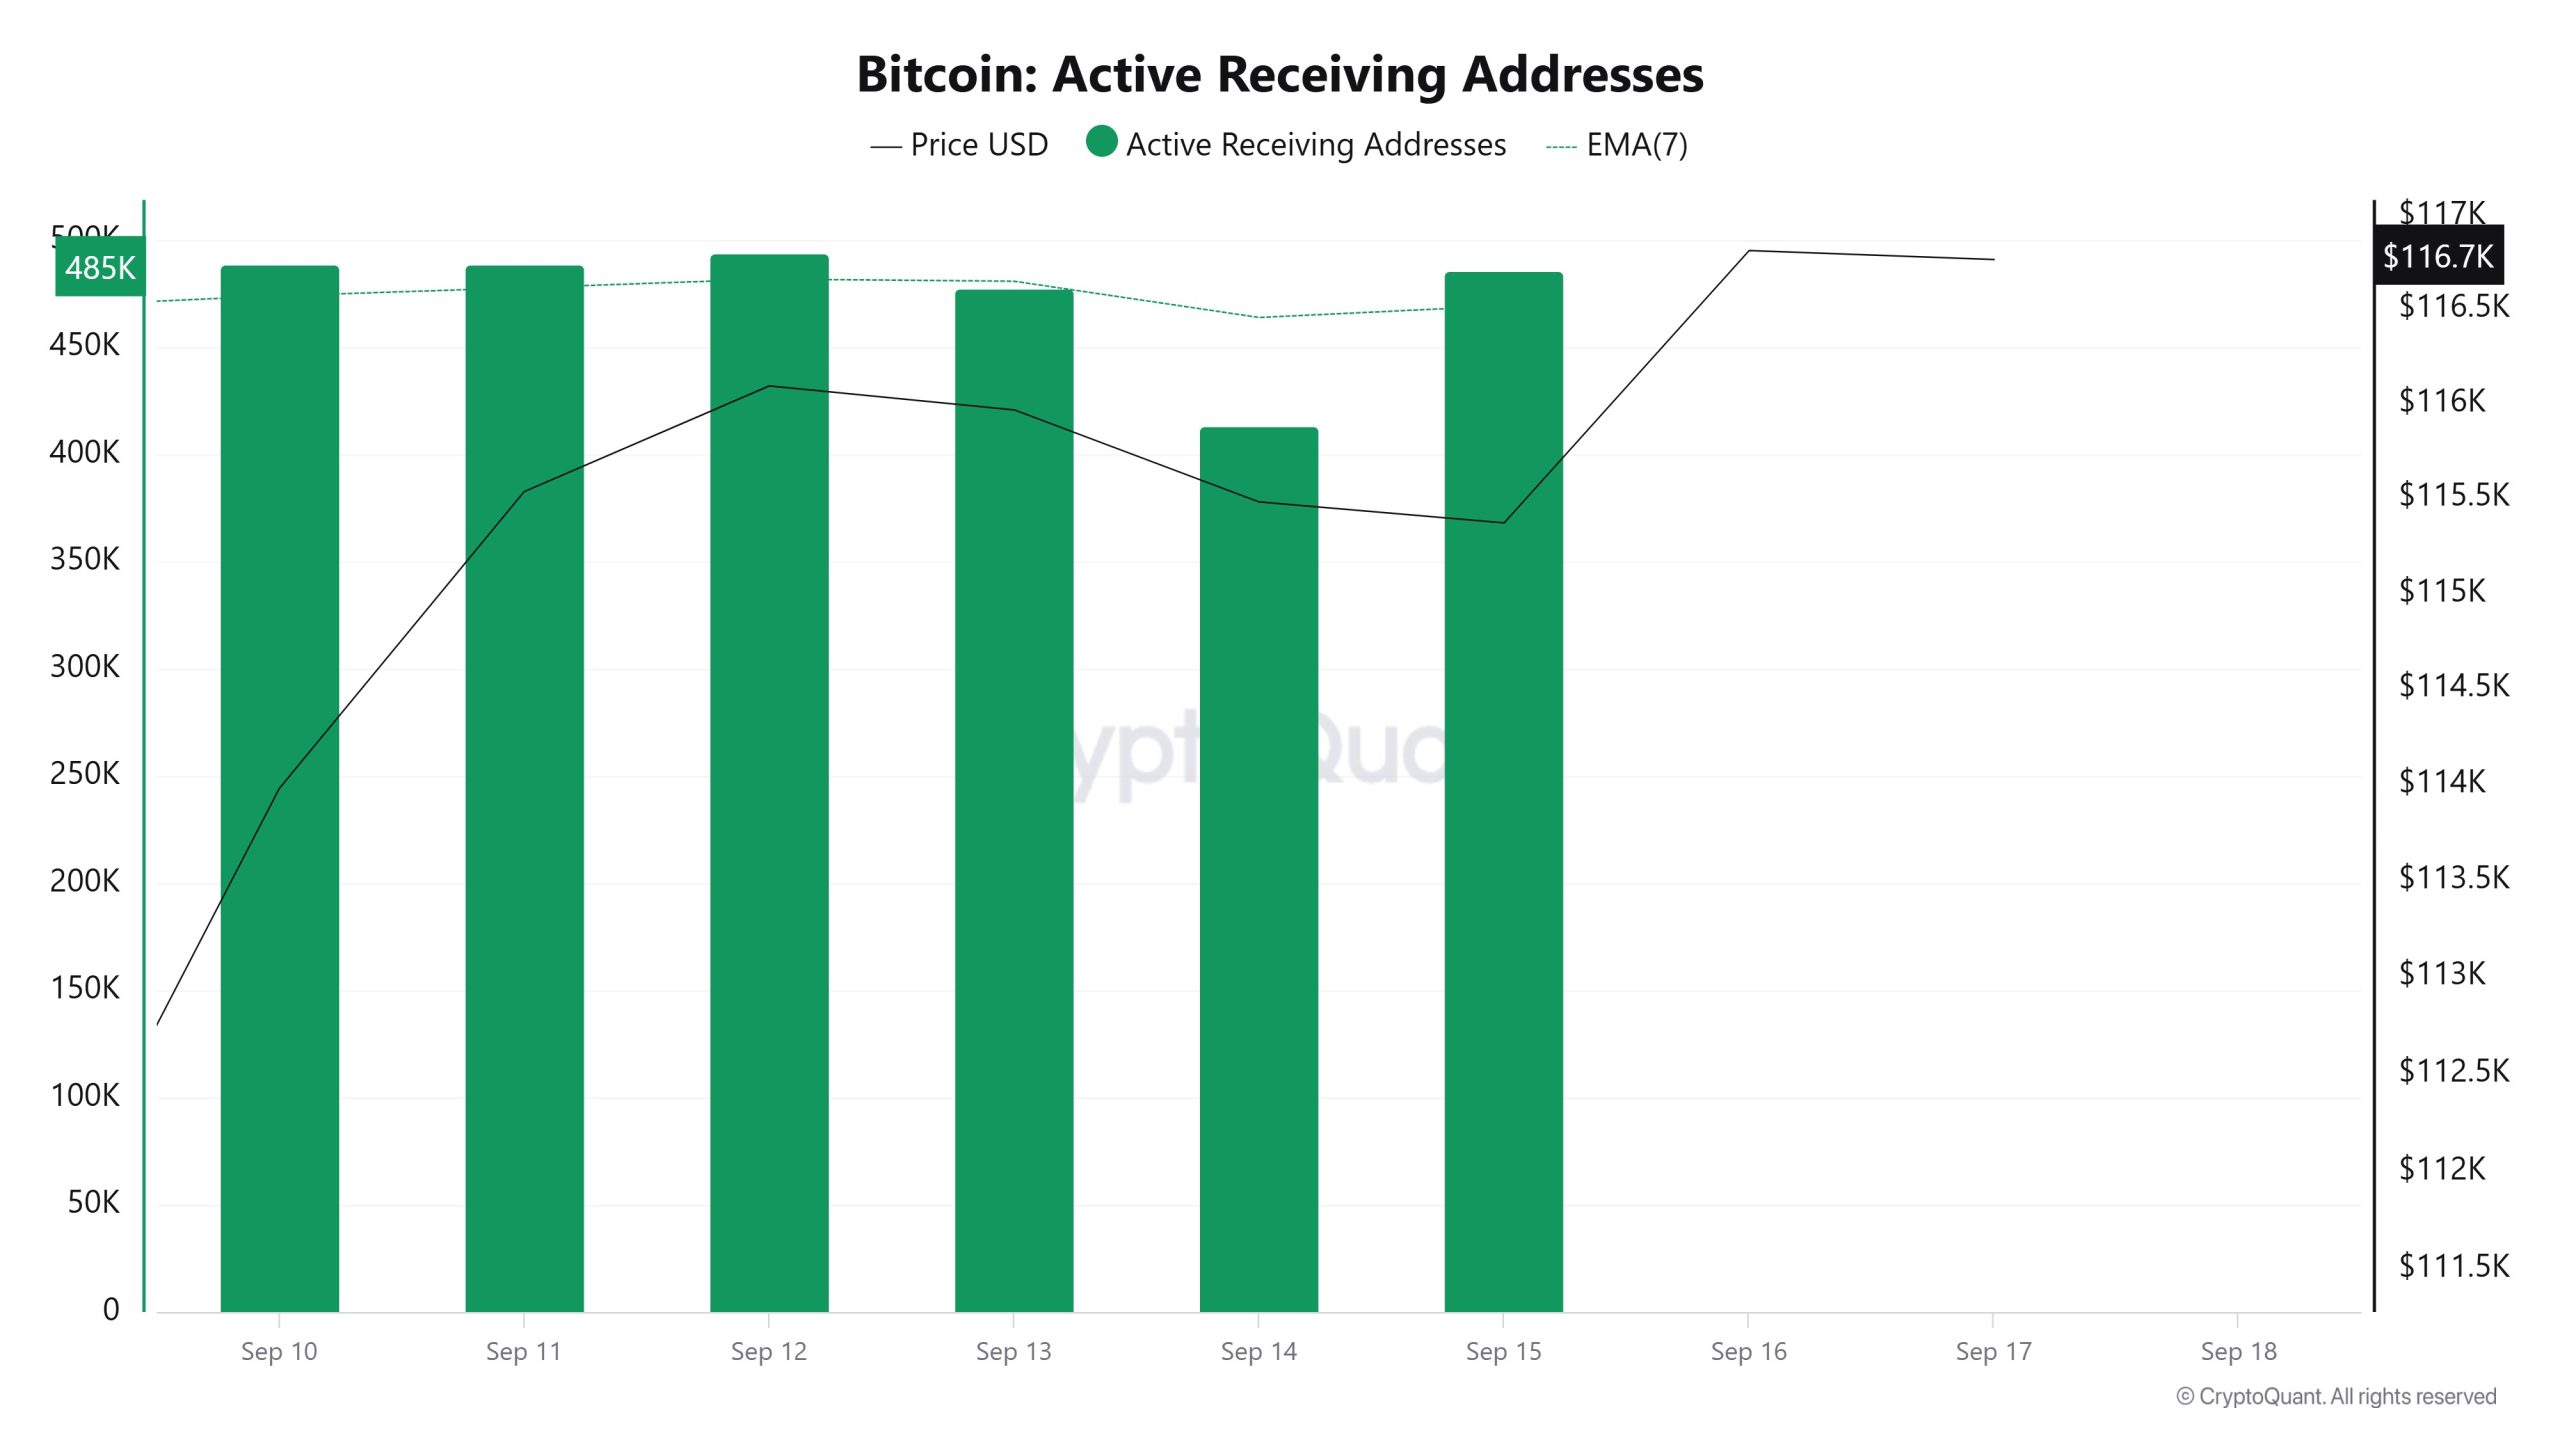 Between September 10th and September 17th, there was a regular rise en active buy addresses with the Black Line (price line). On the day the price reached its high, active buying addresses rose as high as 486,560, indicating that sellers were buying Bitcoin at $115,000.
Breakdowns
MRVR
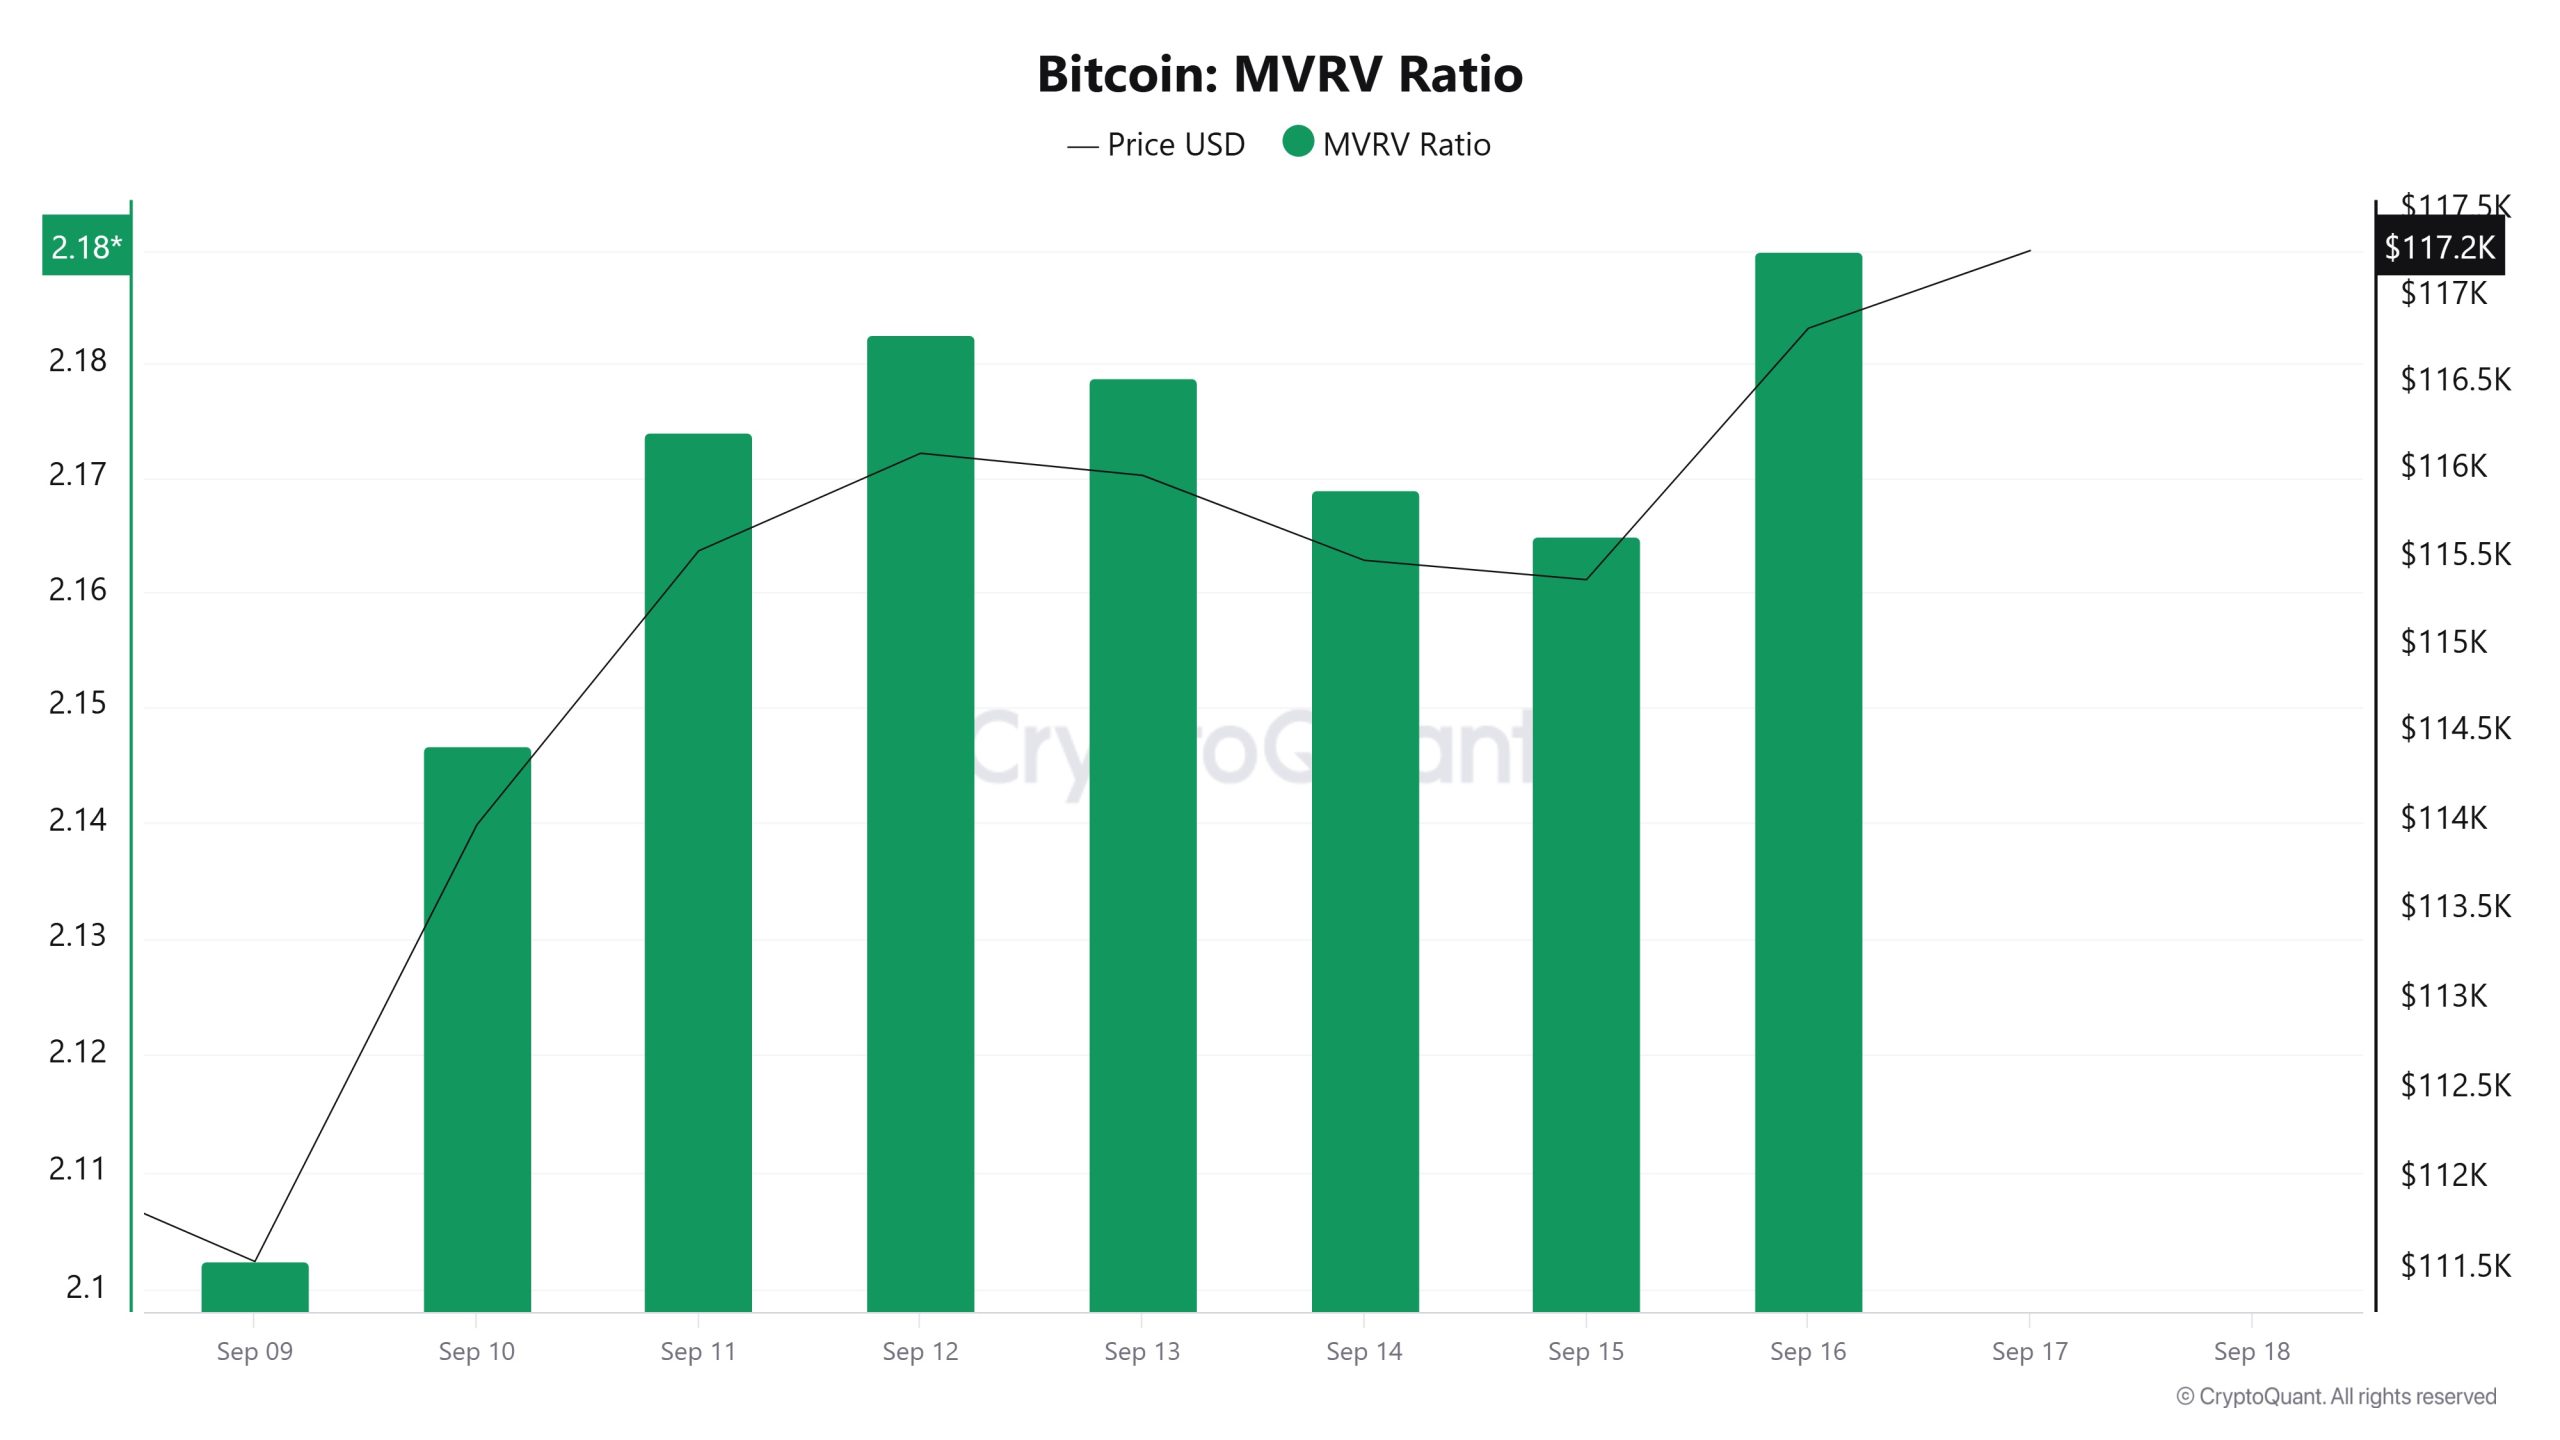 On September 10, the Bitcoin price was at $113 979 while the MVRV Ratio was 2.146.
As of September 16, the Bitcoin price rose to $116 816, an increase of 2.49%, while the MVRV Ratio rose to 2.189, an increase of 2.00%.
Realized Price
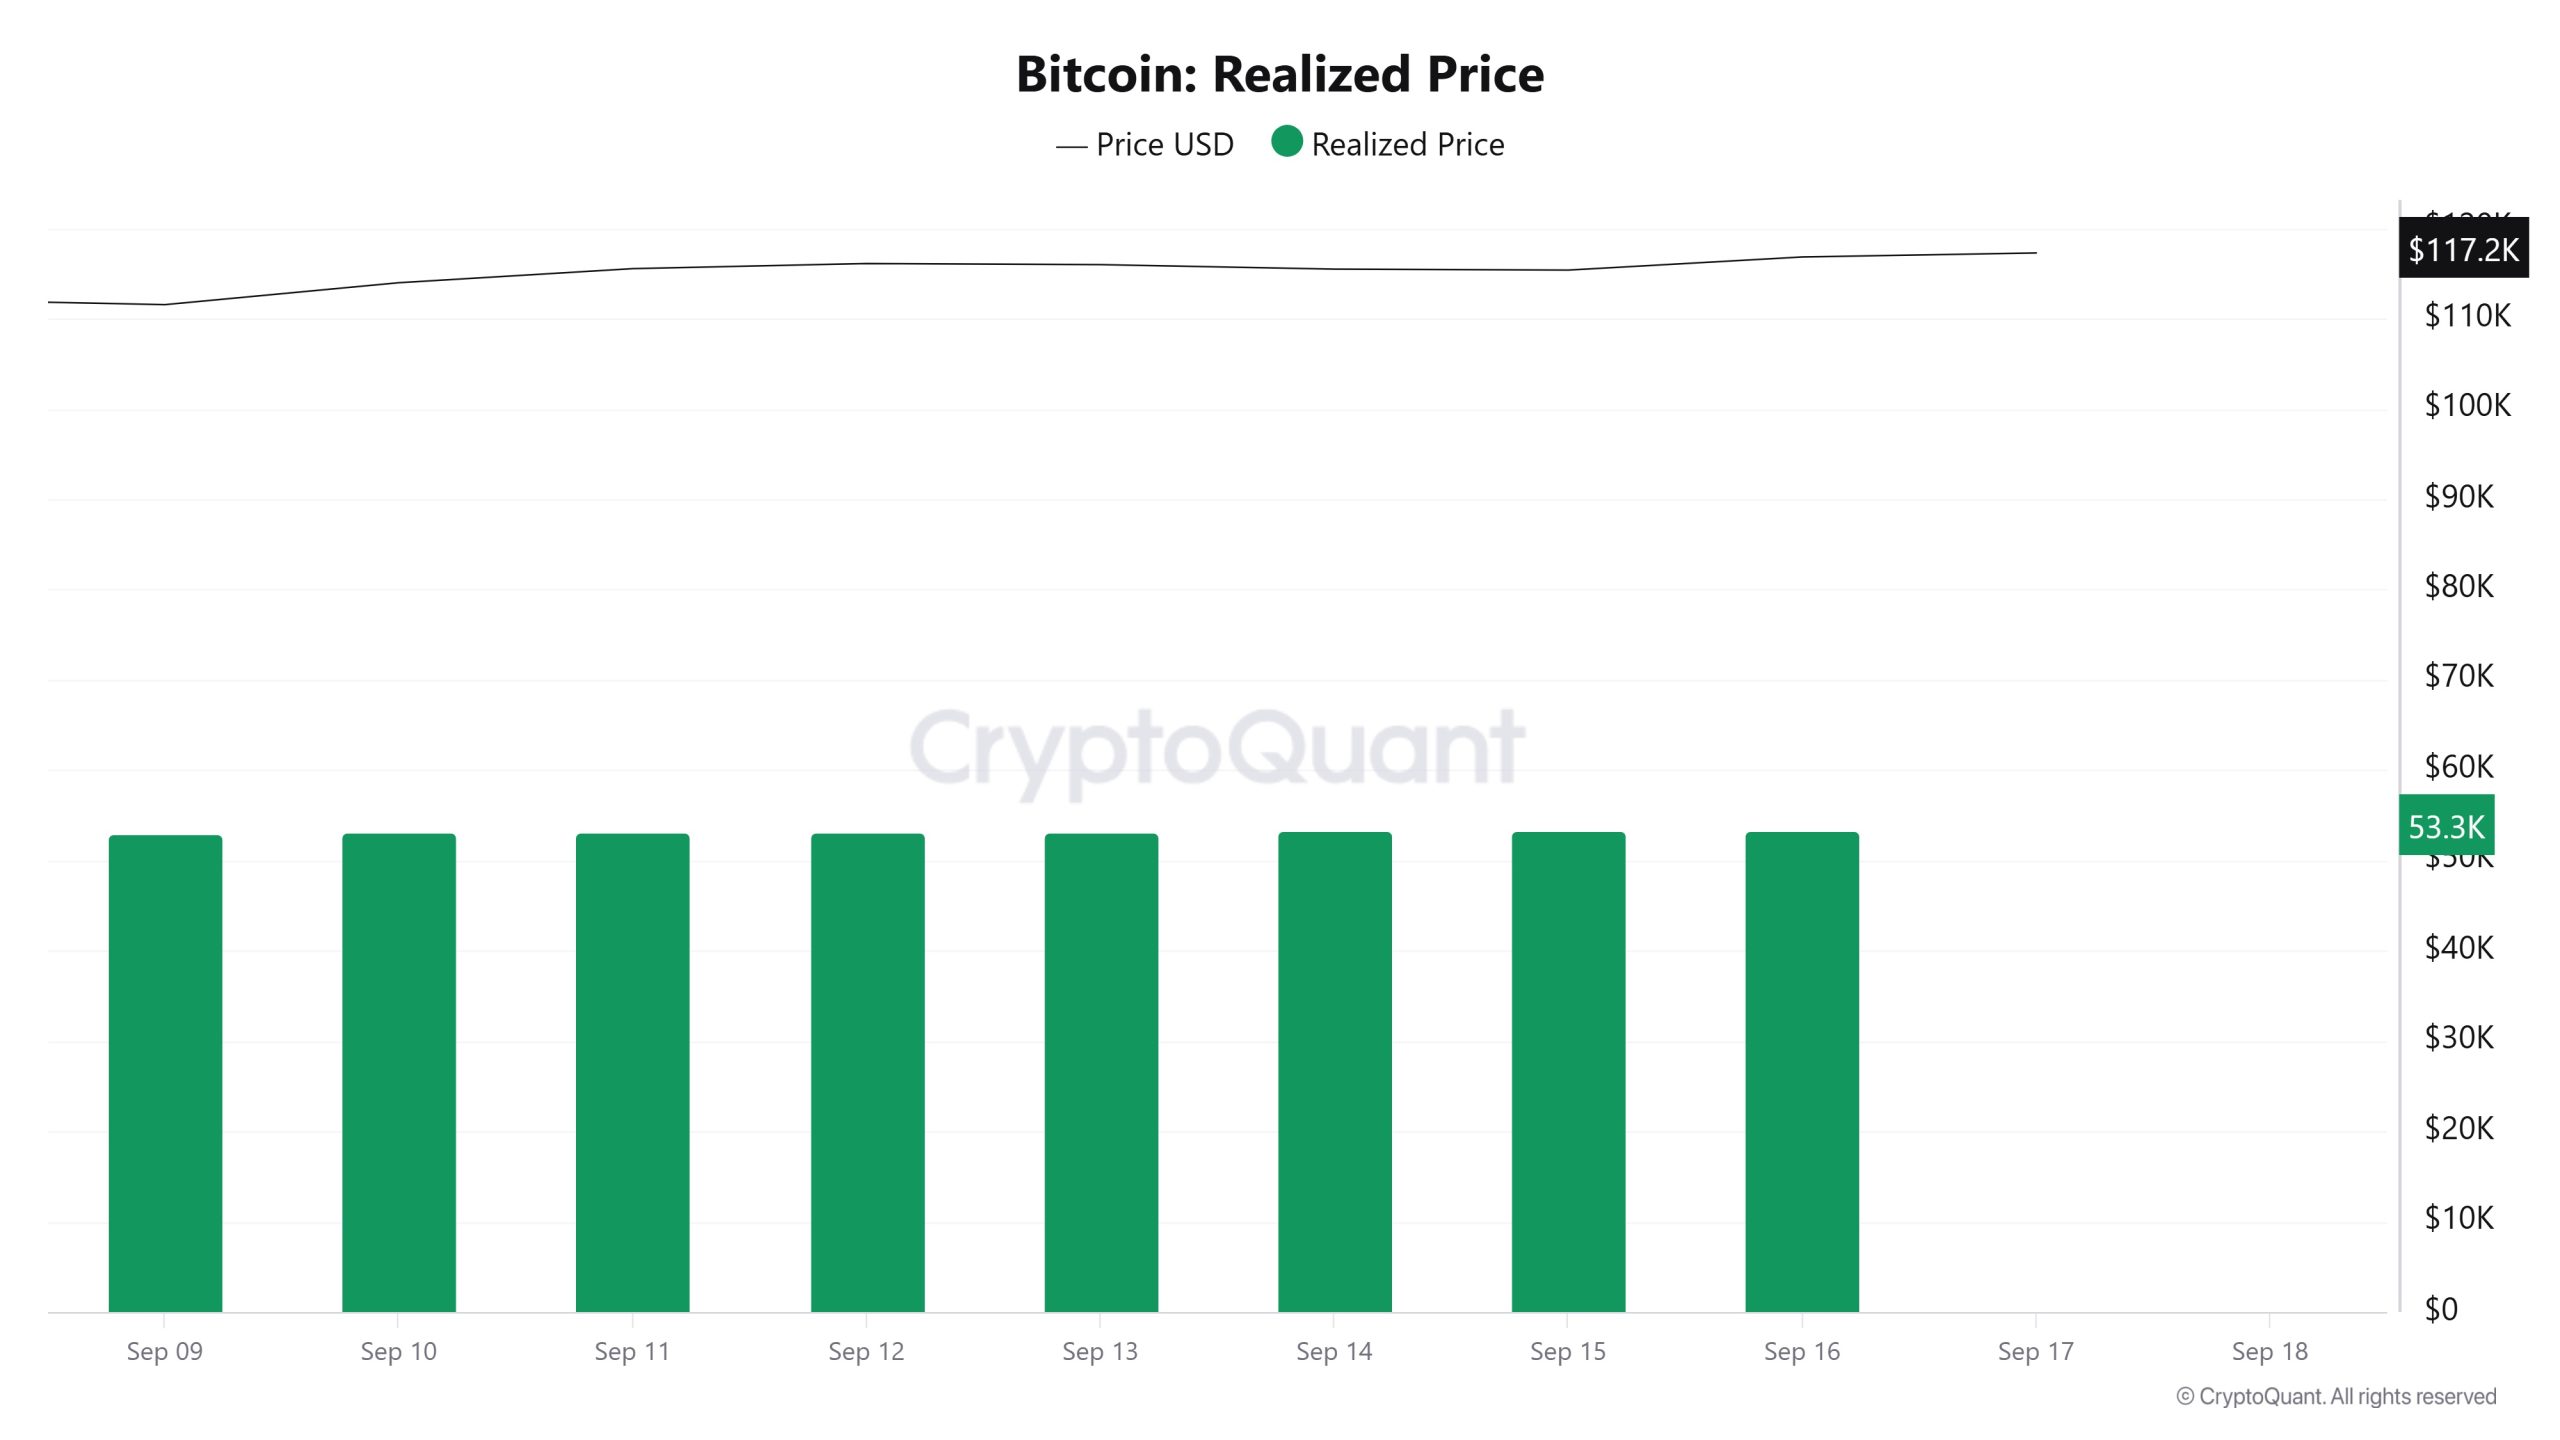 On September 10, Bitcoin price was at $113 979 while Realized Price was at 53 095.
As of September 16, the Bitcoin price rose to $116 816, an increase of 2.49%, while the Realized Price rose to 53 341, an increase of 0.46%.
Spent Output Profit Ratio (SOPR)
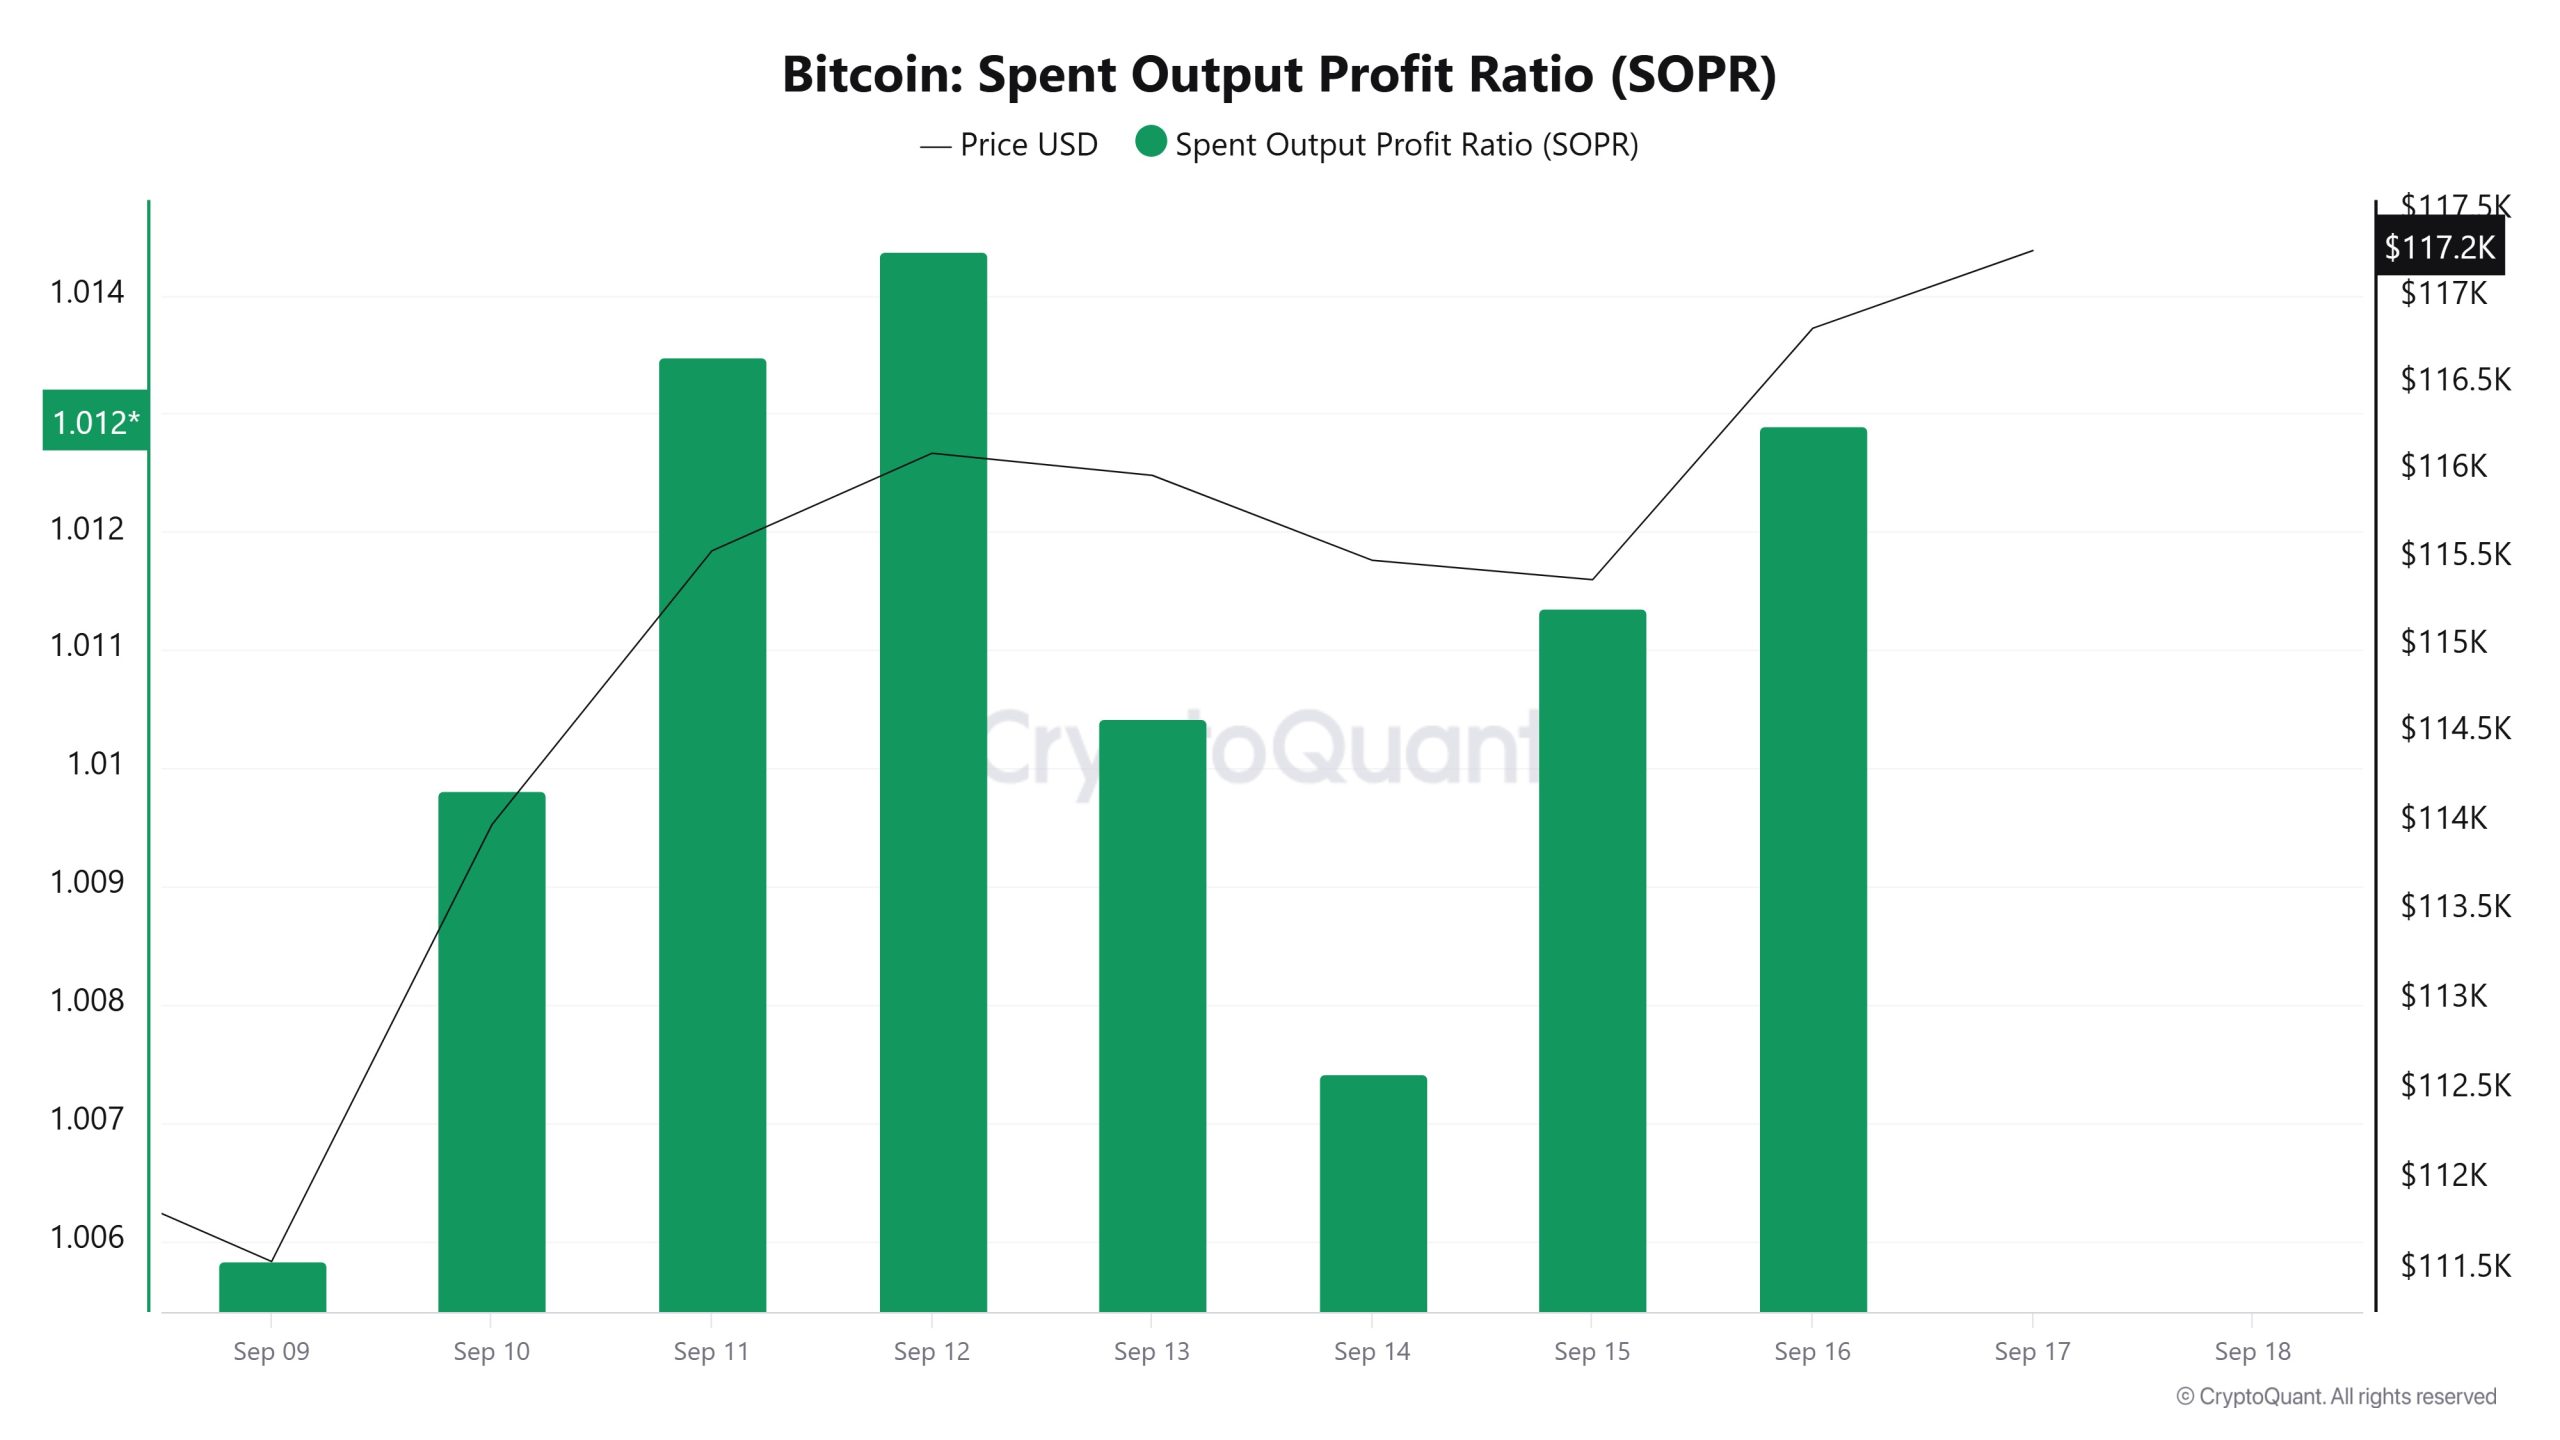 On September 10, the Bitcoin price was at $113 979 while the SOPR metric was at 1,009.
As of September 16, the Bitcoin price was at $116 816, up 2.49%, while the SOPR metric was at 1,012, up 0.30%.
Derivatives
Open Interest
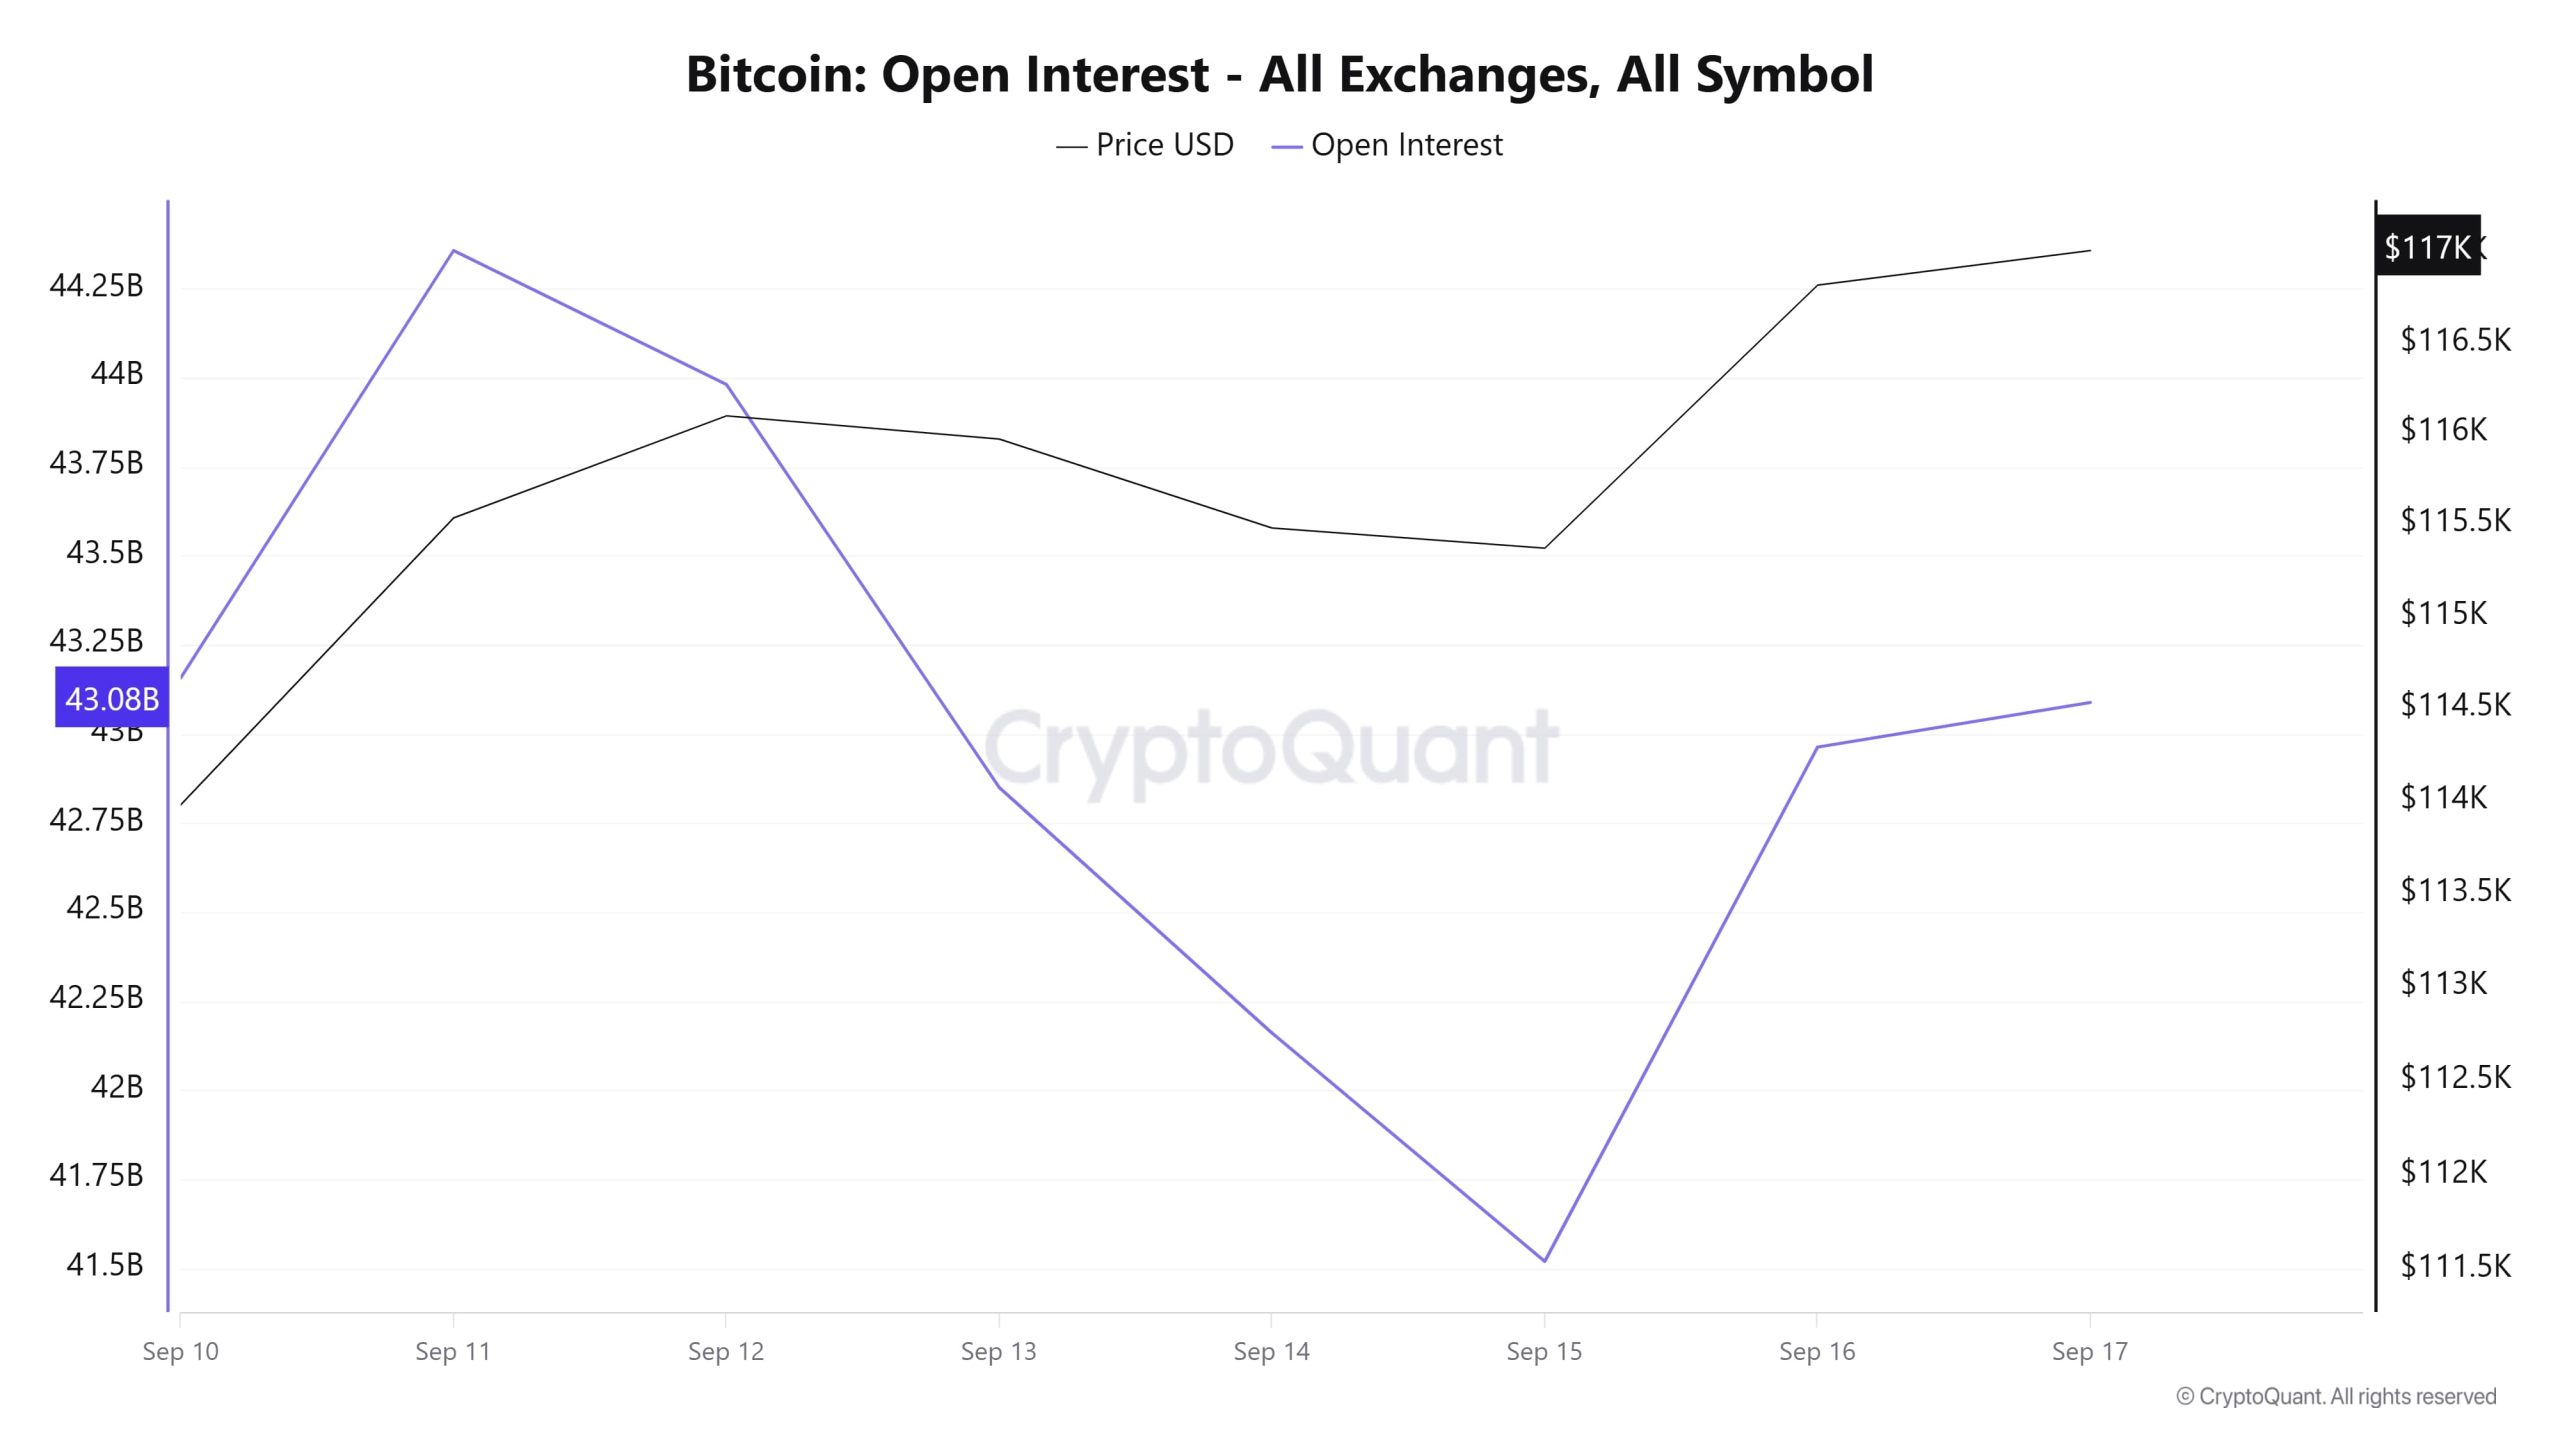
The open position en Bitcoin futures rose from $43.25 billion el September 10 to around $44.25 billion el September 11. Open interest then fell sharply to $41.5 billion el September 15 and then recovered to over $43 billion el September 17. On the price side, Bitcoin, which was at $112,000 el September 10, reached $117,000 el September 17 with a gradual rise. Overall, the chart shows that while the price followed a steady uptrend, there were sharp fluctuations en open positions and the market went through a period of strong liquidation or position closure, especially between September 11-15.
Funding Rate
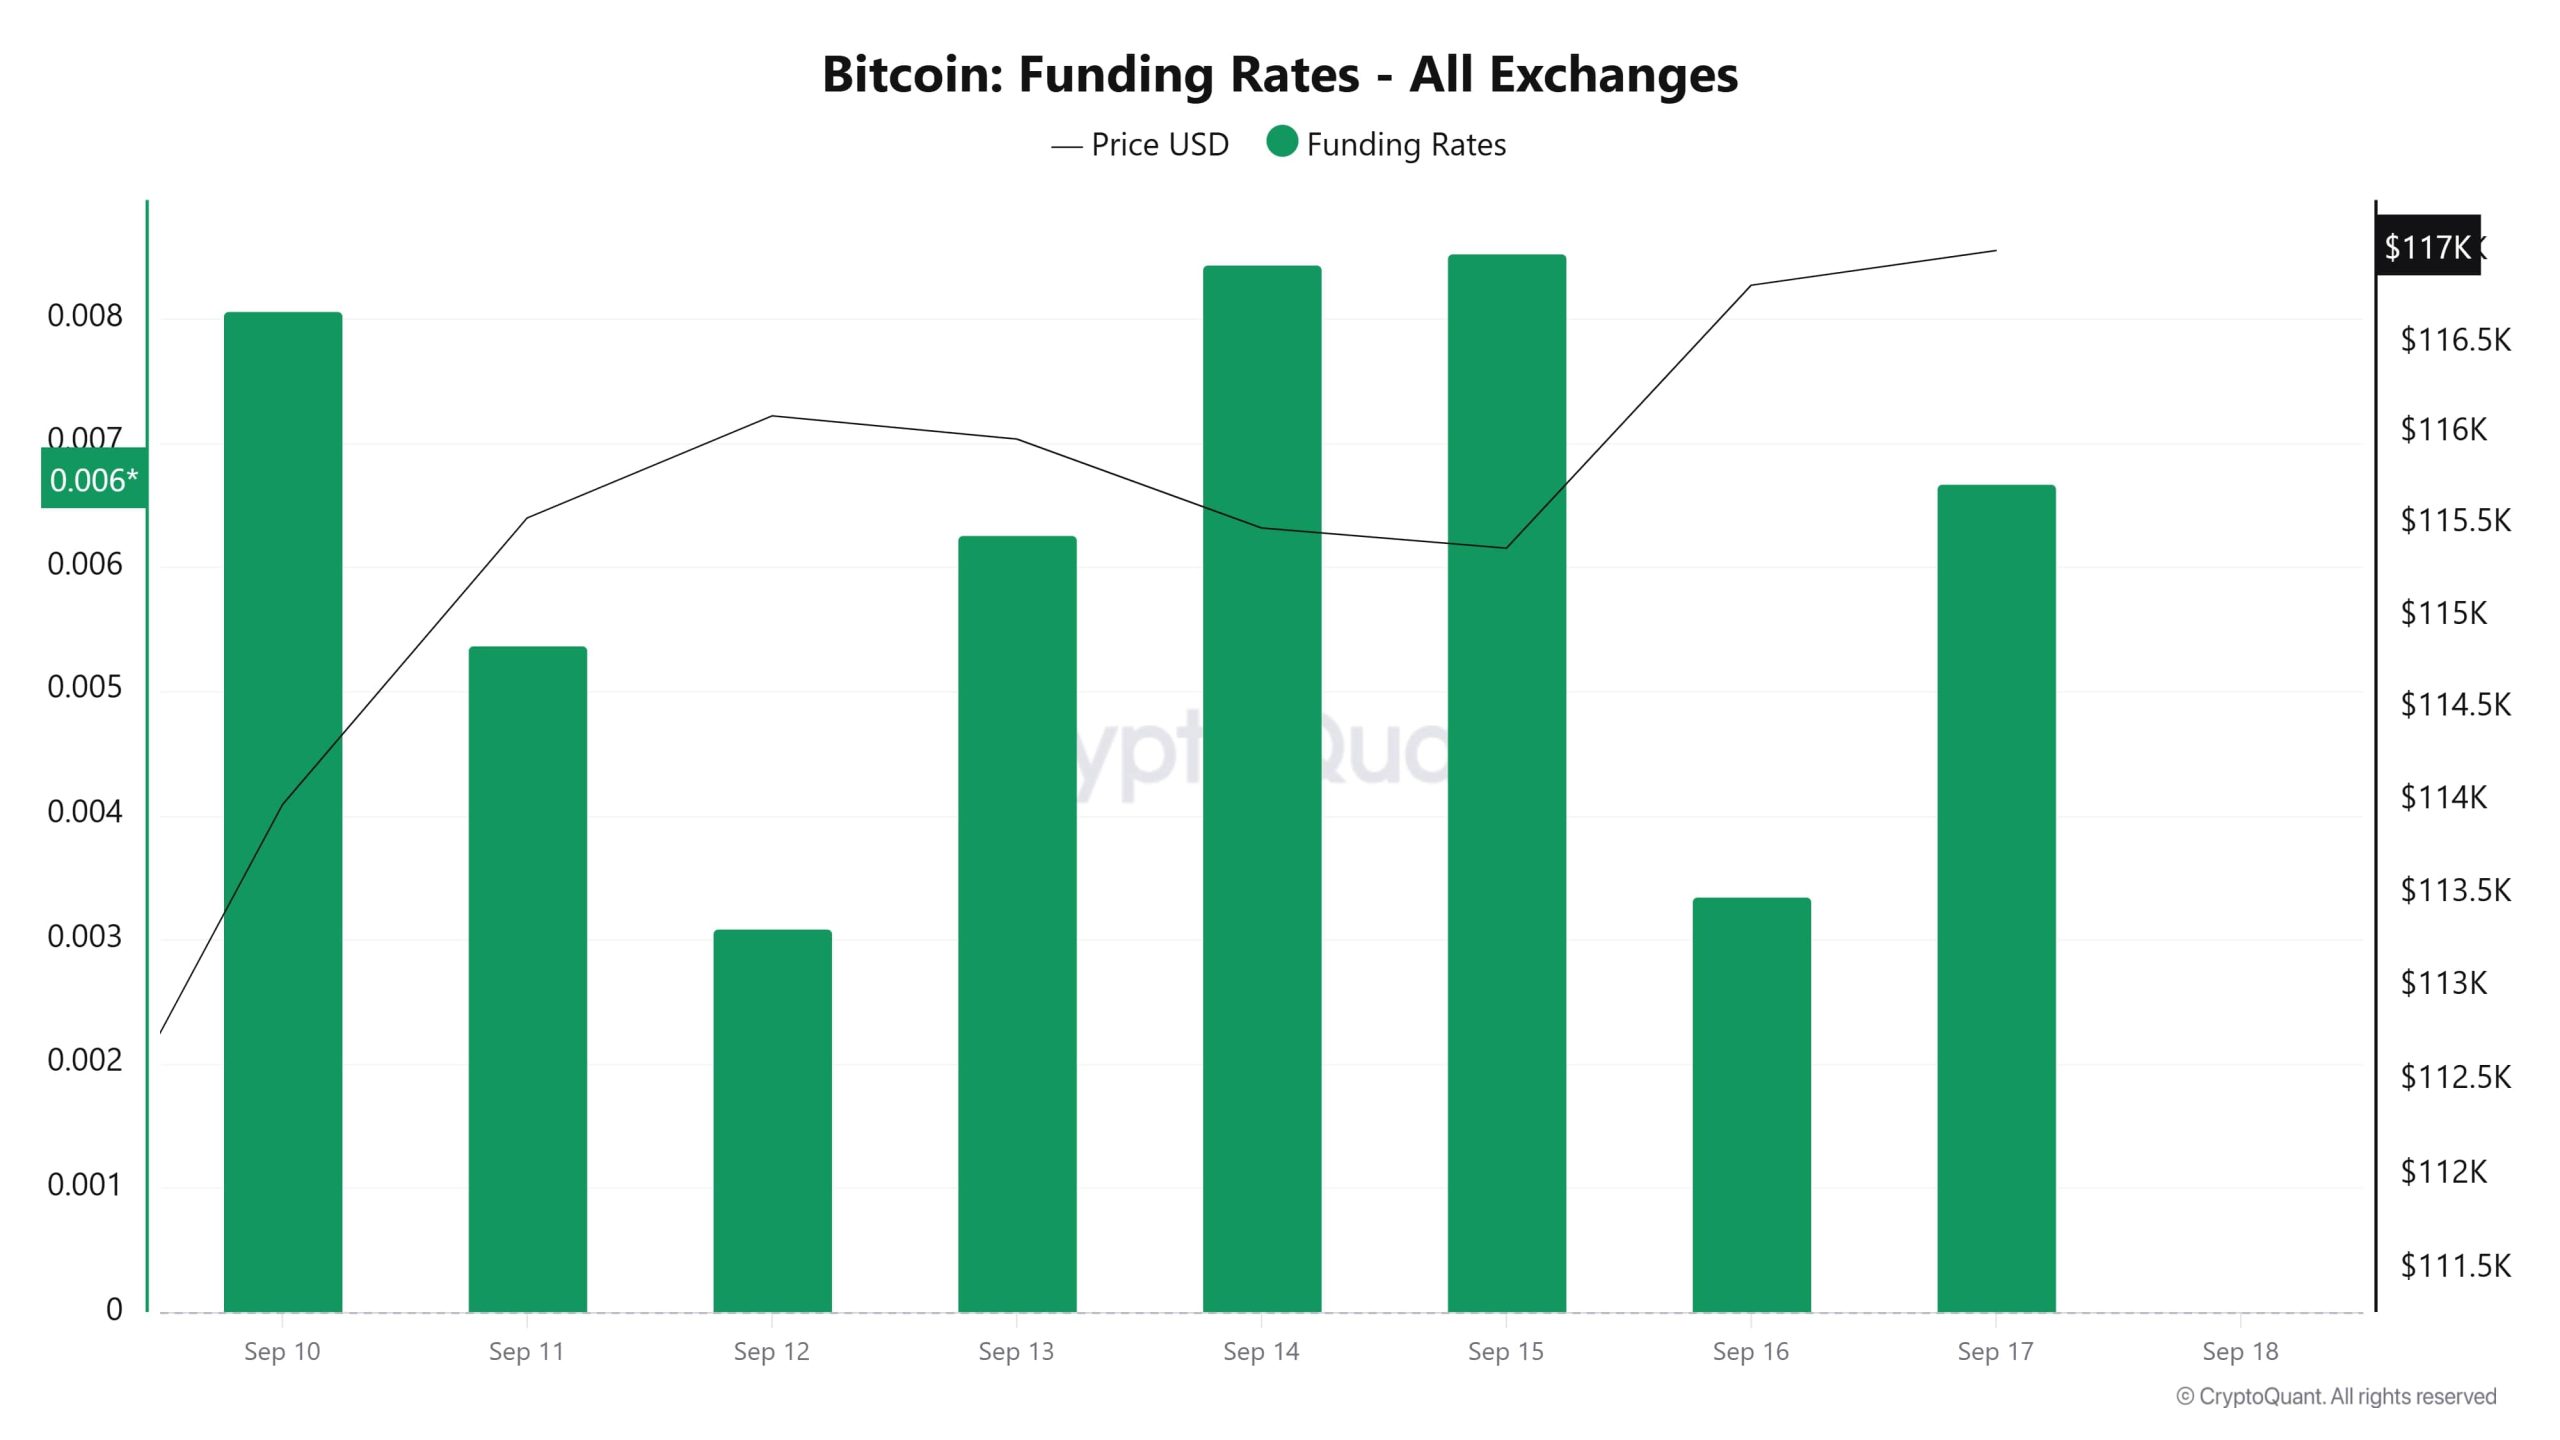 Bitcoin’s funding rate recorded a highly positive reading of 0.008 el September 10, before hitting a low of 0.003 el September 12. On September 13 and 14, the rates rose again, reaching above 0.008, indicating the weight of long positions. On September 15, similarly high levels were maintained, before falling sharply to around 0.003 el September 16. On September 17, the funding rate rose to 0.0065, indicating that the long appetite was once again prominent en the market. In this process, the Bitcoin price continued its gradual rise from $112,000 to $117,000, while funding rate fluctuations reflect the directional changes en leveraged transactions.
Long & Short Liquidations
Last week, with the BTC price rising from $111,000 to over $117,000, mainly short positions were liquidated. 166 million dollars of long and 281 million dollars of short trades were liquidated.
| Date | Long Amount (Million $) | Short Amount (Million $) |
|---|---|---|
| September 10 | 6.35 | 40.21 |
| September 11 | 10.22 | 32.06 |
| September 12 | 5.73 | 154.94 |
| September 13 | 9.82 | 3.25 |
| September 14 | 10.36 | 3.89 |
| September 15 | 116.54 | 15.86 |
| September 16 | 7.17 | 31.31 |
| Total | 166.19 | 281.52 |
Supply Distribution
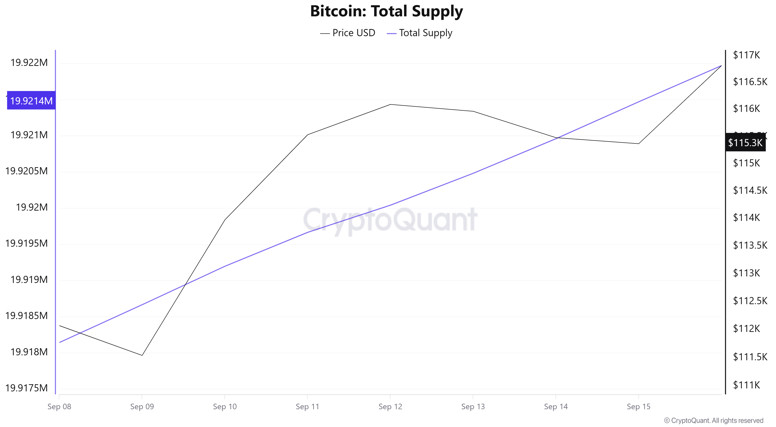
Total Supply: It reached 19,921,467 units, an increase of about 0.0167% compared to last week.
New Supply: The amount of BTC produced this week was 3,325.
Velocity: Velocity, which was 12.30 last week, was 12.16 as of September 15.
| Wallet Categoría | 08.09.2025 | 15.09.2025 | Change (%) |
|---|---|---|---|
| < 1 BTC | 8.4593% | 8.4677% | 0.0084% |
| 1 – 10 BTC | 11.4080% | 11.3856% | -0.0224% |
| 10 – 100 BTC | 24.6349% | 24.5960% | -0.0389% |
| 100 – 1k BTC | 29.7390% | 29.8515% | 0.1125% |
| 1k – 10k BTC | 17.9420% | 17.8859% | -0.0561% |
| 10k+ BTC | 7.8138% | 7.8132% | -0.0006% |
According to the latest weekly data, Bitcoin wallet distribution presented a mixed picture. While the share of wallets holding <1 BTC increased slightly por 0.0084%, there was a slight decrease of 0.0224% en the 1-10 BTC range and 0.0389% en the 10-100 BTC group. The 100-1,000 BTC range recorded a more significant increase of 0.1125%, while the 1,000-10,000 BTC band saw a decrease of 0.0561%. 10,000+ BTC wallets, representing the largest investors, saw a limited decline of 0.0006%.
Exchange Supply Ratio
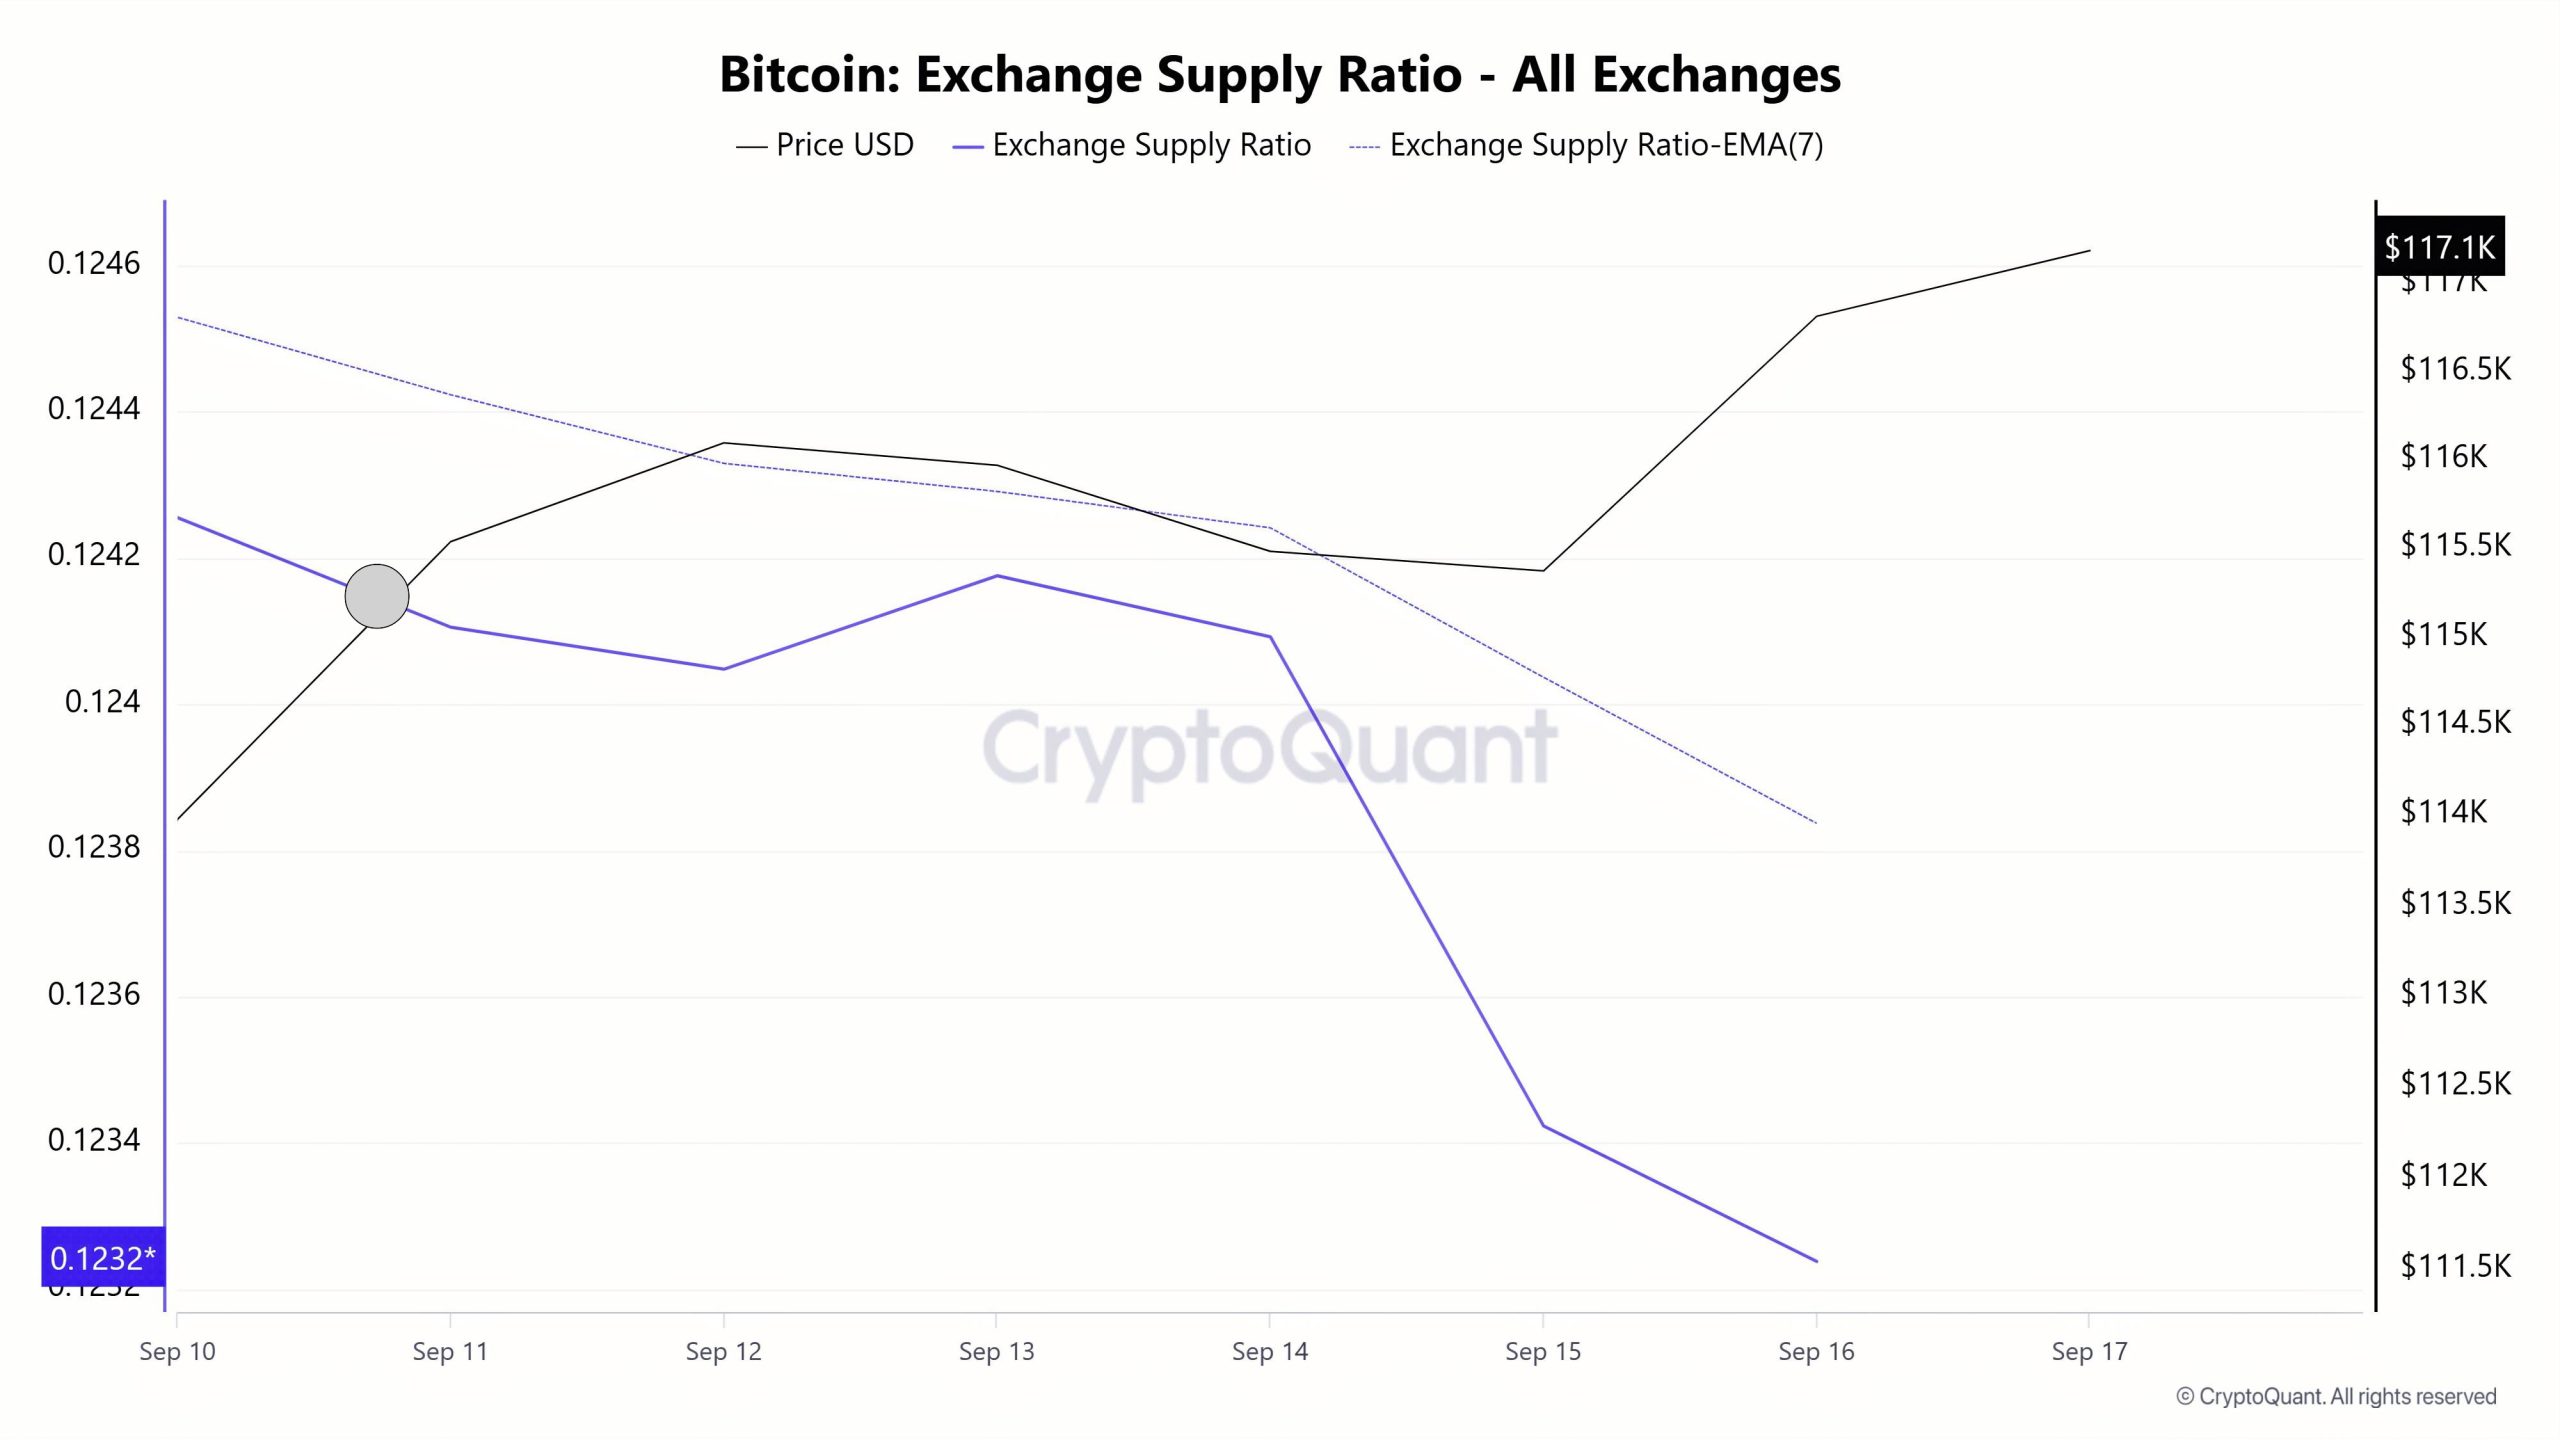
Data from the Bitcoin Exchange Supply Ratio table, which shows how much of Bitcoins are held el exchanges compared to the total supply of Bitcoins, showed low rates this week. This week’s data reveals that the general trend is for a negative correlation between the price of Bitcoin and the rate of supply entering exchanges, dominated por a negative correlation en these two variables. It shows that most Bitcoins continue to be sold out of wallets and are not ready for sale en the market.
Between September 10 and September 17, the Bitcoin Exchange Supply Ratio decreased from 0.124225556 to 0.12323794. During this period, the Bitcoin price rose from $113,000 to $117,000. Notably, el September 14-15, at the intersection of the price and the Exchange Supply Ratio, there was a significant rise en the Exchange Supply Ratio as the price continued to fall. This suggests that despite the price rise, the amount of Bitcoin supplied to exchanges has decreased, possibly indicating that long-term investors continue to hold their holdings. It is seen that the price of Bitcoin is generally bullish.
Exchange Reserve
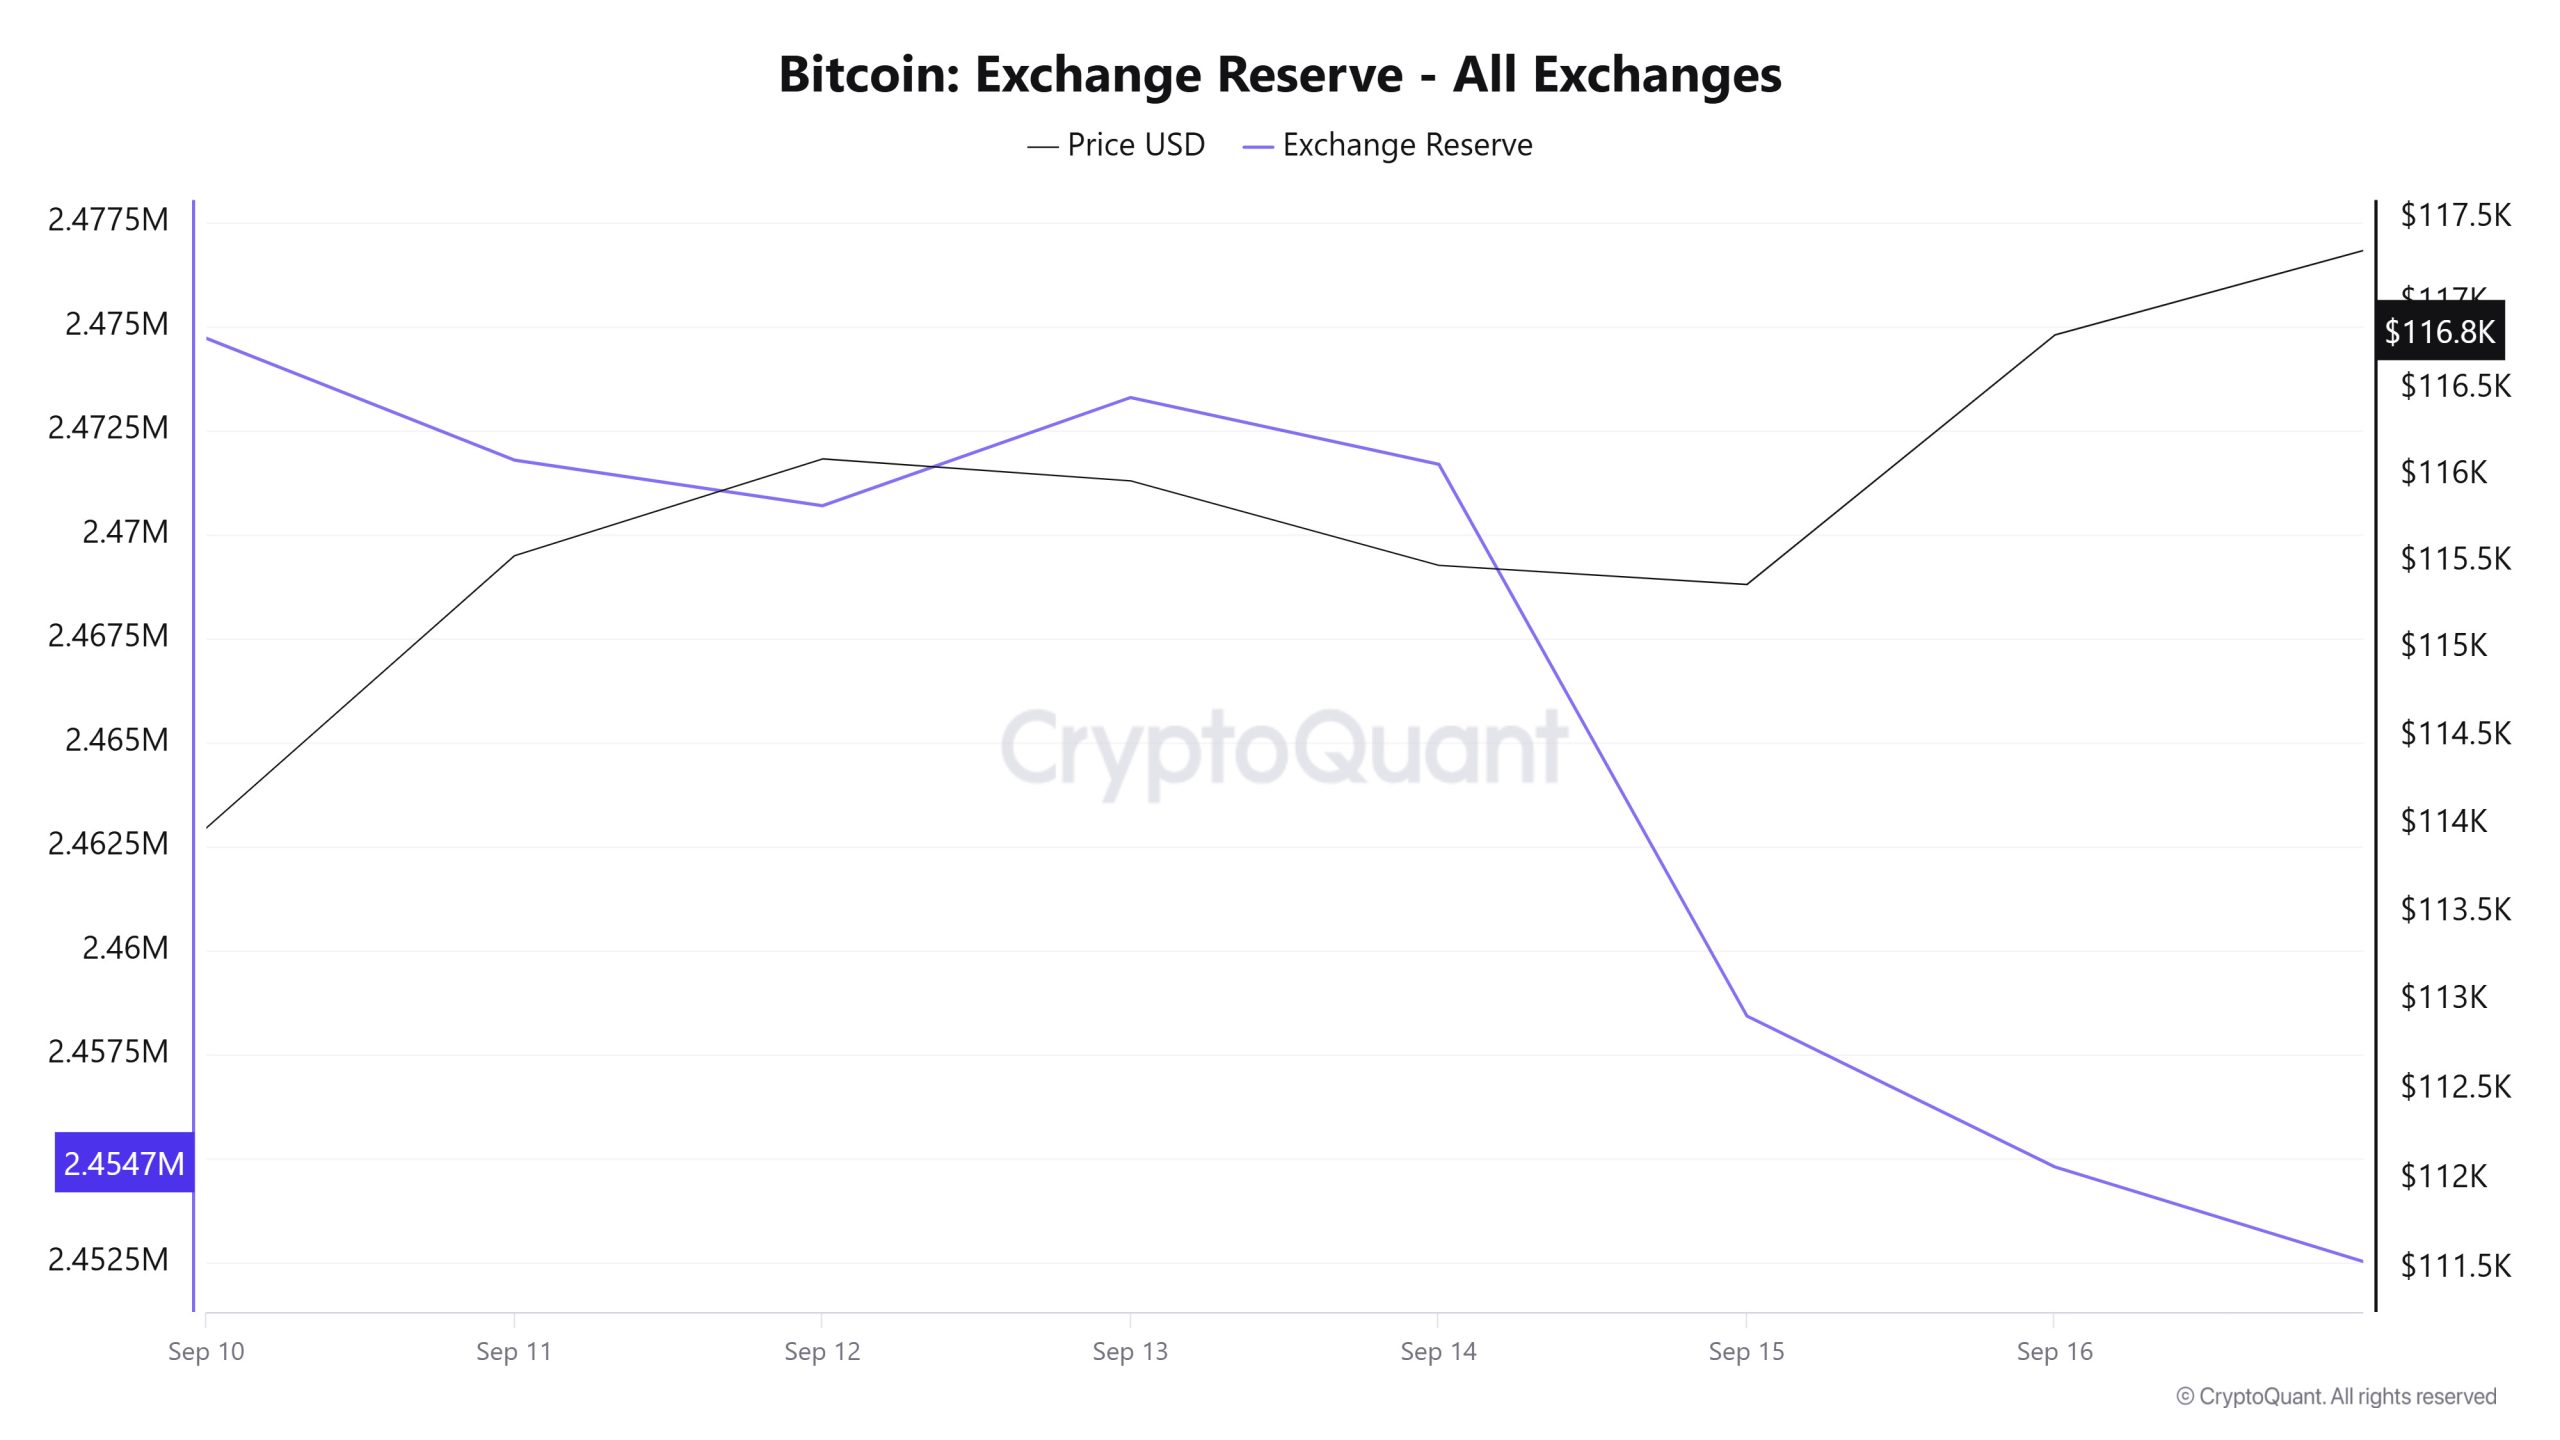
Between September 10-16, 2025, Bitcoin reserves el exchanges decreased from 2,474,711 BTC to 2,454,789 BTC, for a total net outflow of 19,922 BTC. In this process, there was a decrease of approximately 0.80% en reserves. In the same period, the BTC price rose from $111,538 to $116,817, gaining about 4.73%. The fact that reserves continued to fall while the price rose indicates that the contraction en supply combined with demand to support the upward price movement. Declining supply and buoyant demand provide a strong basis for an uptrend en the medium term.
| Date | 10-Sep | 11-Sep | 12-Sep | 13-Sep | 14-Sep | 15-Sep | 16-Sep |
|---|---|---|---|---|---|---|---|
| Exchange Inflow | 33,826 | 27,062 | 36,721 | 15,567 | 11,826 | 28,019 | 27,382 |
| Exchange Outflow | 35,937 | 29,988 | 37,817 | 12,967 | 13,431 | 41,281 | 31,014 |
| Exchange Netflow | -2,111 | -2,927 | -1,097 | 2,600 | -1,605 | -13,262 | -3,632 |
| Exchange Reserve | 2,474,711 | 2,471,785 | 2,470,688 | 2,473,288 | 2,471,683 | 2,458,421 | 2,454,789 |
| BTC Price | 111,538 | 115,537 | 116,096 | 115,969 | 115,482 | 115,371 | 116,817 |
Fees and Revenues
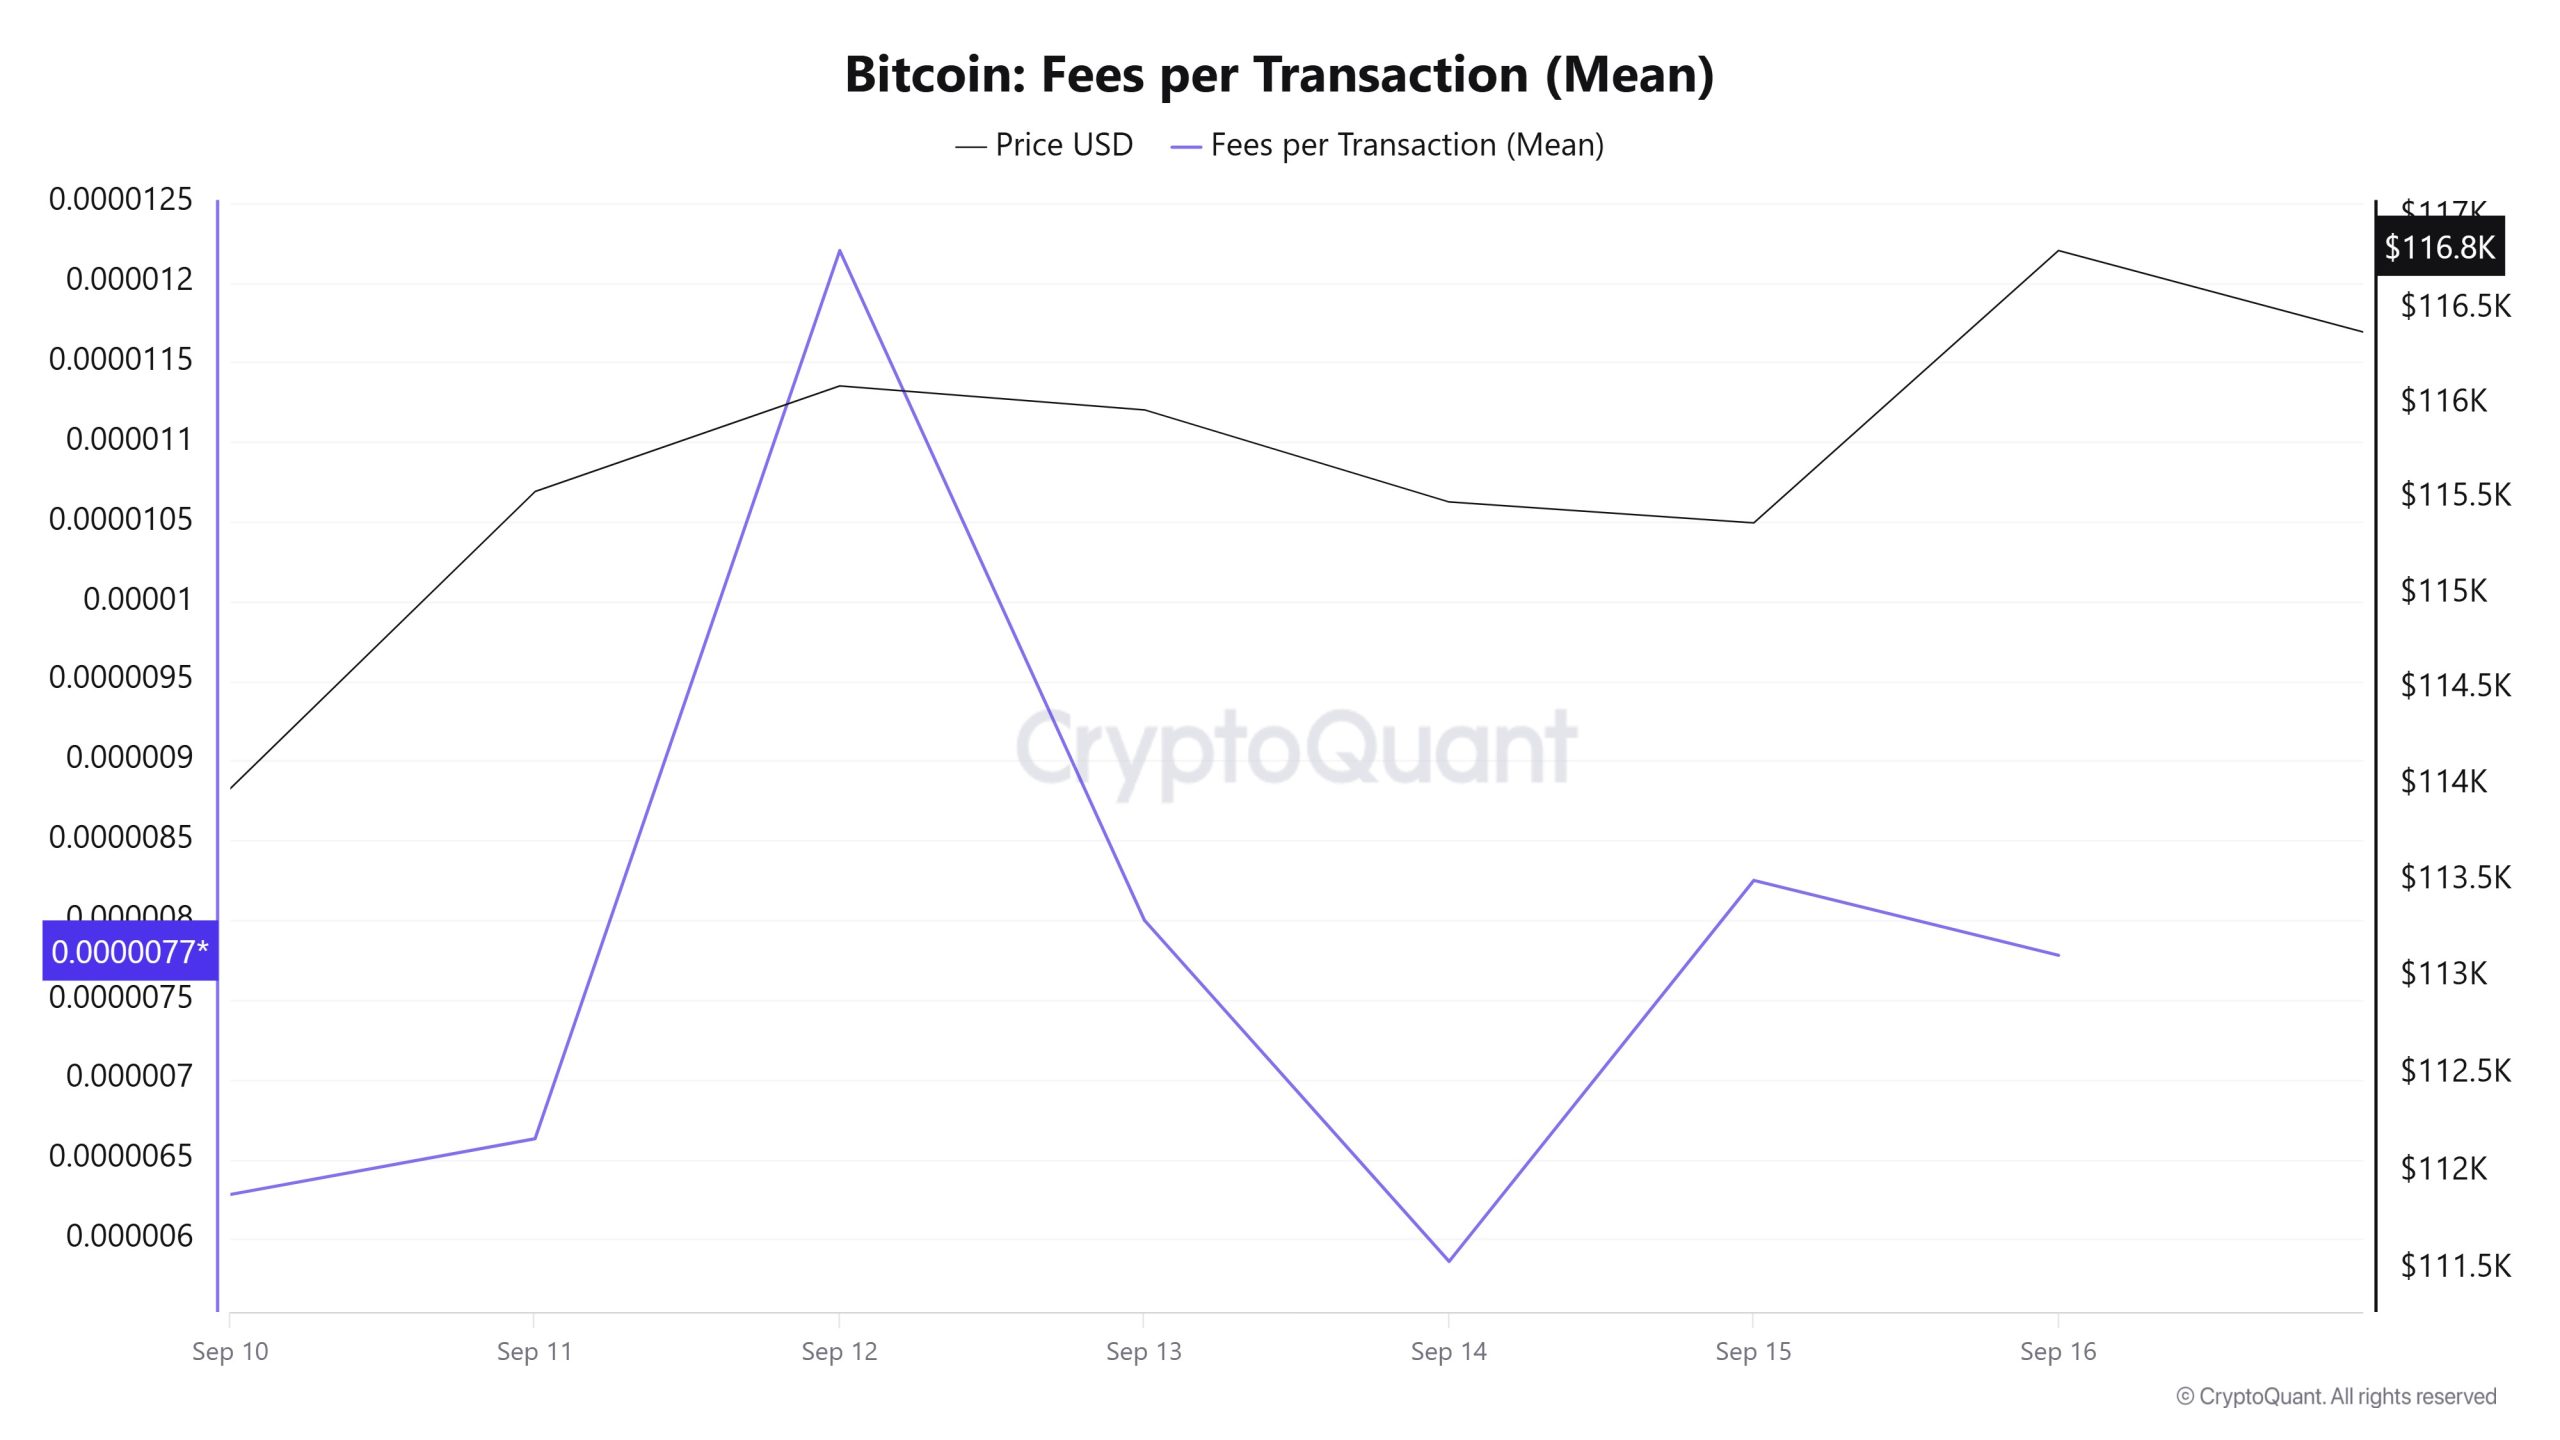
Analyzing the Bitcoin Fees per Transaction (Mean) data between September 10 and 16, it is seen that the indicator was realized at 0.00000628 el September 10, the first day of the week.
As of September 12, the value peaked and fluctuated after this date due to the volatility en Bitcoin price. On September 14, it fell to 0.00000586, recording the lowest value of the week. In the following days, the Bitcoin Fees per Transaction (Mean) indicator resumed its upward trend and closed at 0.00000778 el September 16, the last day of the week.
Bitcoin: Fees (Total)
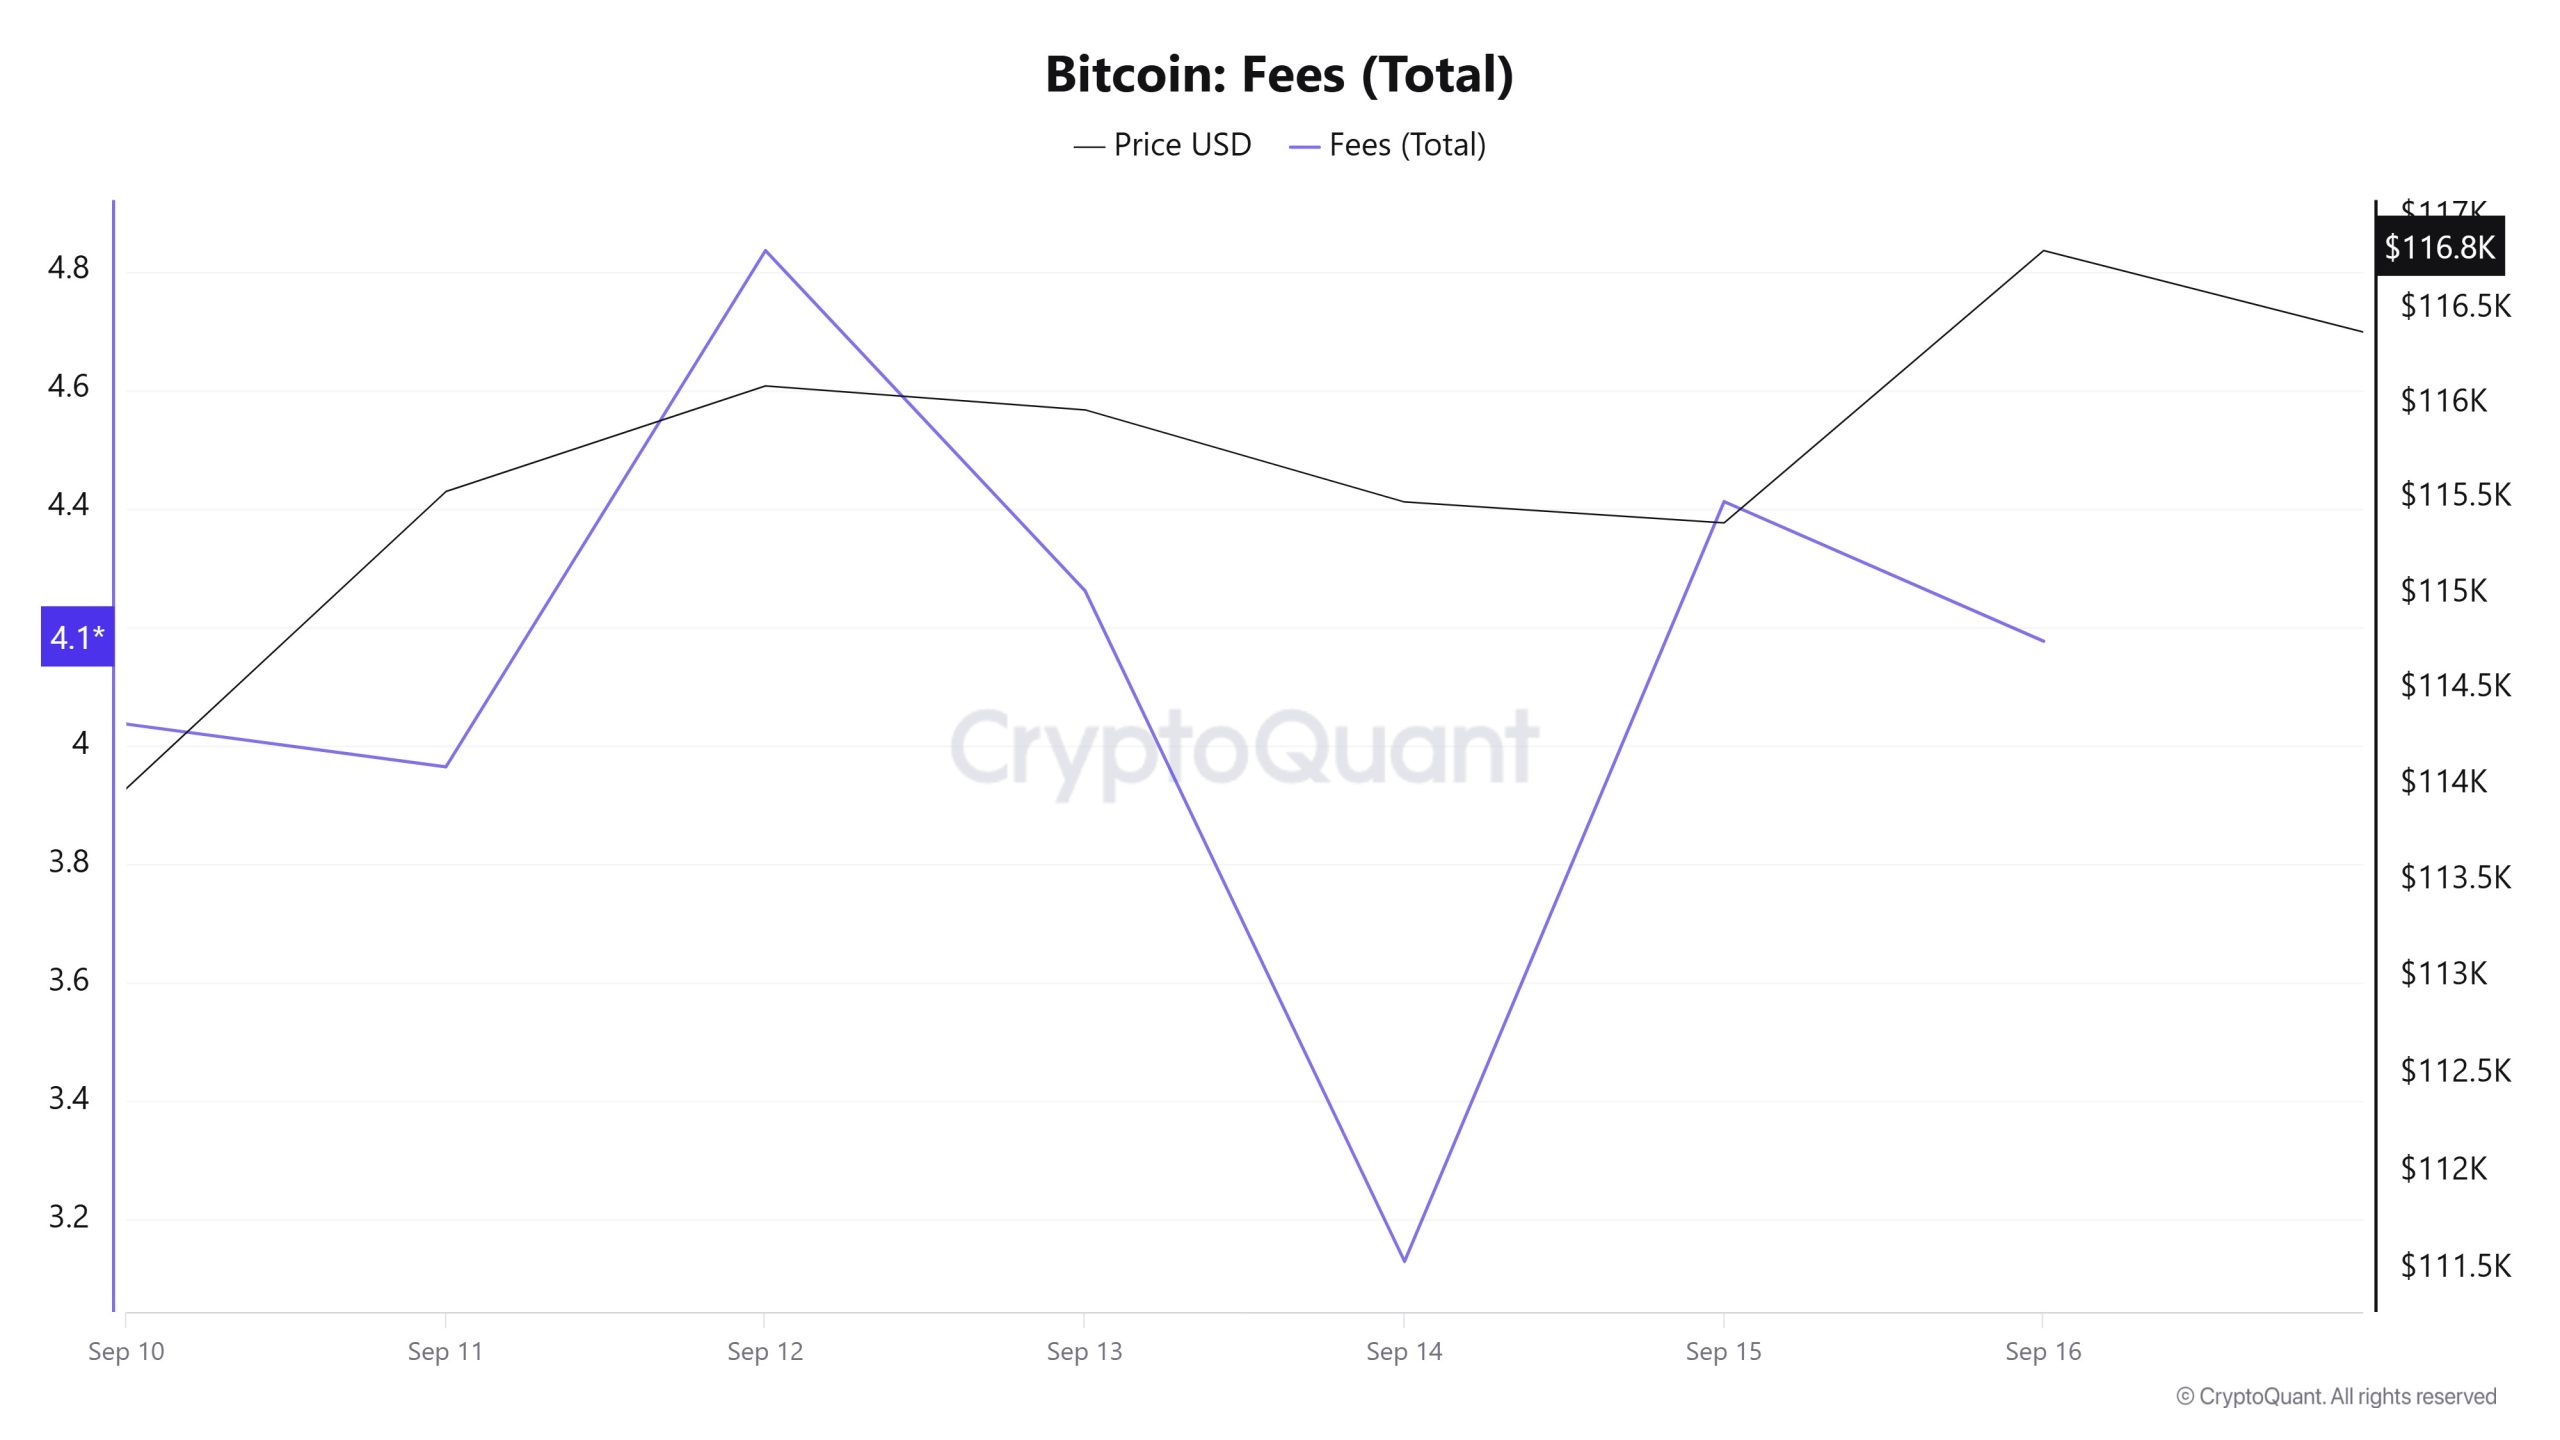
Similarly, when Bitcoin Fees (Total) data between September 10 and 16 are analyzed, it is seen that the indicator was at 4.03630375 el September 10, the first day of the week.
On September 12, the value peaked and fluctuated after this date due to the volatility en Bitcoin price. On September 14, it fell to 3.12992572 and recorded the lowest value of the week. In the following days, the Bitcoin Fees (Total) indicator entered an upward trend again and closed at 4.1760888 el September 16, the last day of the week.
Miner Flows
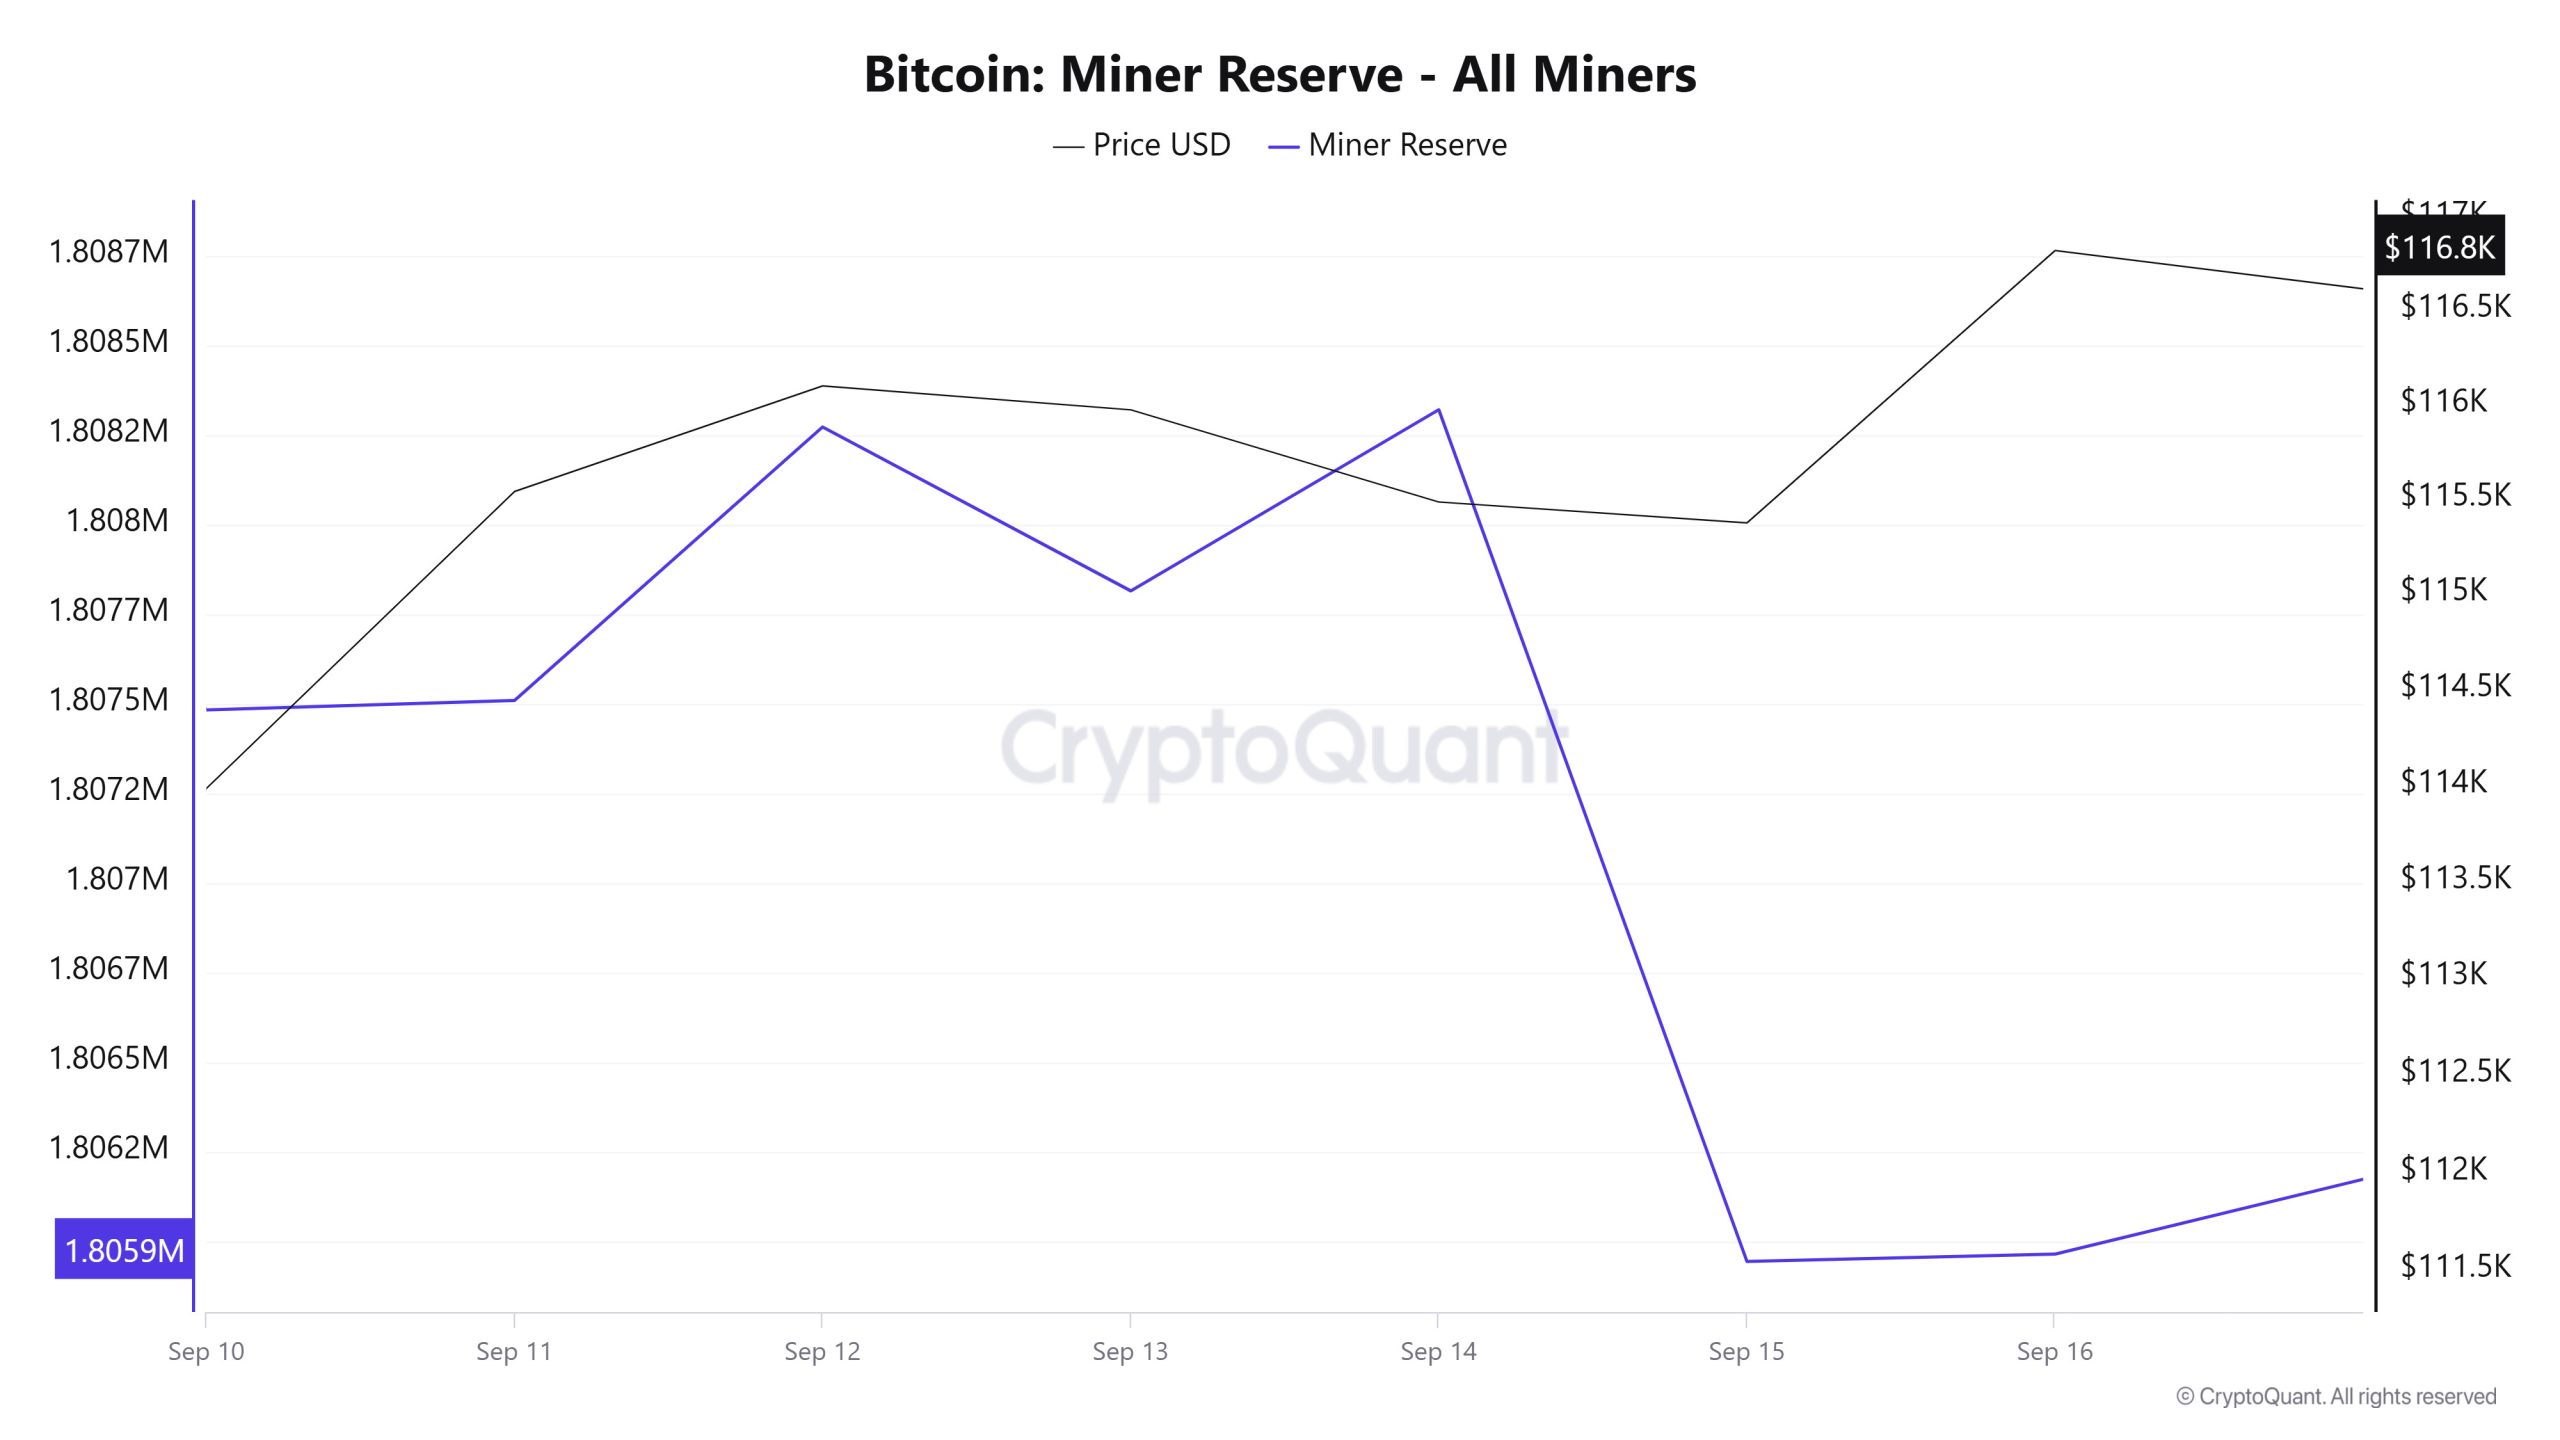
According to the data obtained from the Miner Reserve table, there has been a slight decrease en Bitcoin reserves held en miners’ wallets this week. There is a positive correlation between Bitcoin price and Miner Reserve over the time period analyzed.
Miner Inflow, Outflow and Netflow
Between September 10 and September 16, 39,870 Bitcoins exited miners’ wallets and 37,069 Bitcoins entered miners’ wallets between the same dates. The Miner Netflow for this week was -2,801 Bitcoin. Meanwhile, the Bitcoin price was $113,979 el September 10 and $116,816 el September 16.
For the week, the net flow (Miner Netflow) was negative as Bitcoin inflow into miner wallets (Miner Inflow) was less than Bitcoin outflow from miner wallets (Miner Outflow).
| Sept. 10 | Sept. 11 | Sept. 12 | Sept. 13 | Sept. 14 | Sept. 15 | Sept. 16 | |
|---|---|---|---|---|---|---|---|
| Miner Inflow | 6,853.92 | 5,493.47 | 6,475.56 | 3,321.41 | 2,612.04 | 5,343.42 | 6,969.50 |
| Miner Outflow | 8,135.83 | 5,467.48 | 5,712.20 | 3,778.77 | 2,106.34 | 7,720.54 | 6,949.11 |
| Miner Netflow | -1,281.91 | 25.98 | 763.36 | -457.35 | 505.69 | -2,377.11 | 20.40 |
Transaction
![]()
Last week, there were 3,436,735 transactions el the Bitcoin network, while this week the number of transactions increased por about 9.59% to 3,766,256. The highest trading volume for the week was 643,069 transactions el September 10, while the lowest was 396,393 el September 12. The part of the period from September 13 to 16 remained almost stable and stuck to the average, which is a rare phenomenon that has not been seen for a long time. We also observe continued intense activity el the network, with an increase en the number of transactions compared to last week. However, it can also be said that this increase could be a preparation before a major surge.
Tokens Transferred
While a total of 4,651,806 BTC was transferred last week, this week the transfer volume decreased por 9.11% to 4,190,675 BTC. The highest daily transfer volume of the week was 745,891 BTC el September 15, while the lowest transfer volume was 393,011 BTC el September 14. The correlation between the amount transferred and the price fluctuated throughout the period. In addition, the relationship between the amount of tokens transferred and the price was predominantly negatively correlated during this period.
Considering both the increase en the number of transactions and the decrease en the number of tokens transferred, it can be concluded that small amounts were more likely to change hands during the period. When we examine the relationship with price, we see that this exchange may be mostly a sale-intensive network activity.
Whale Activities
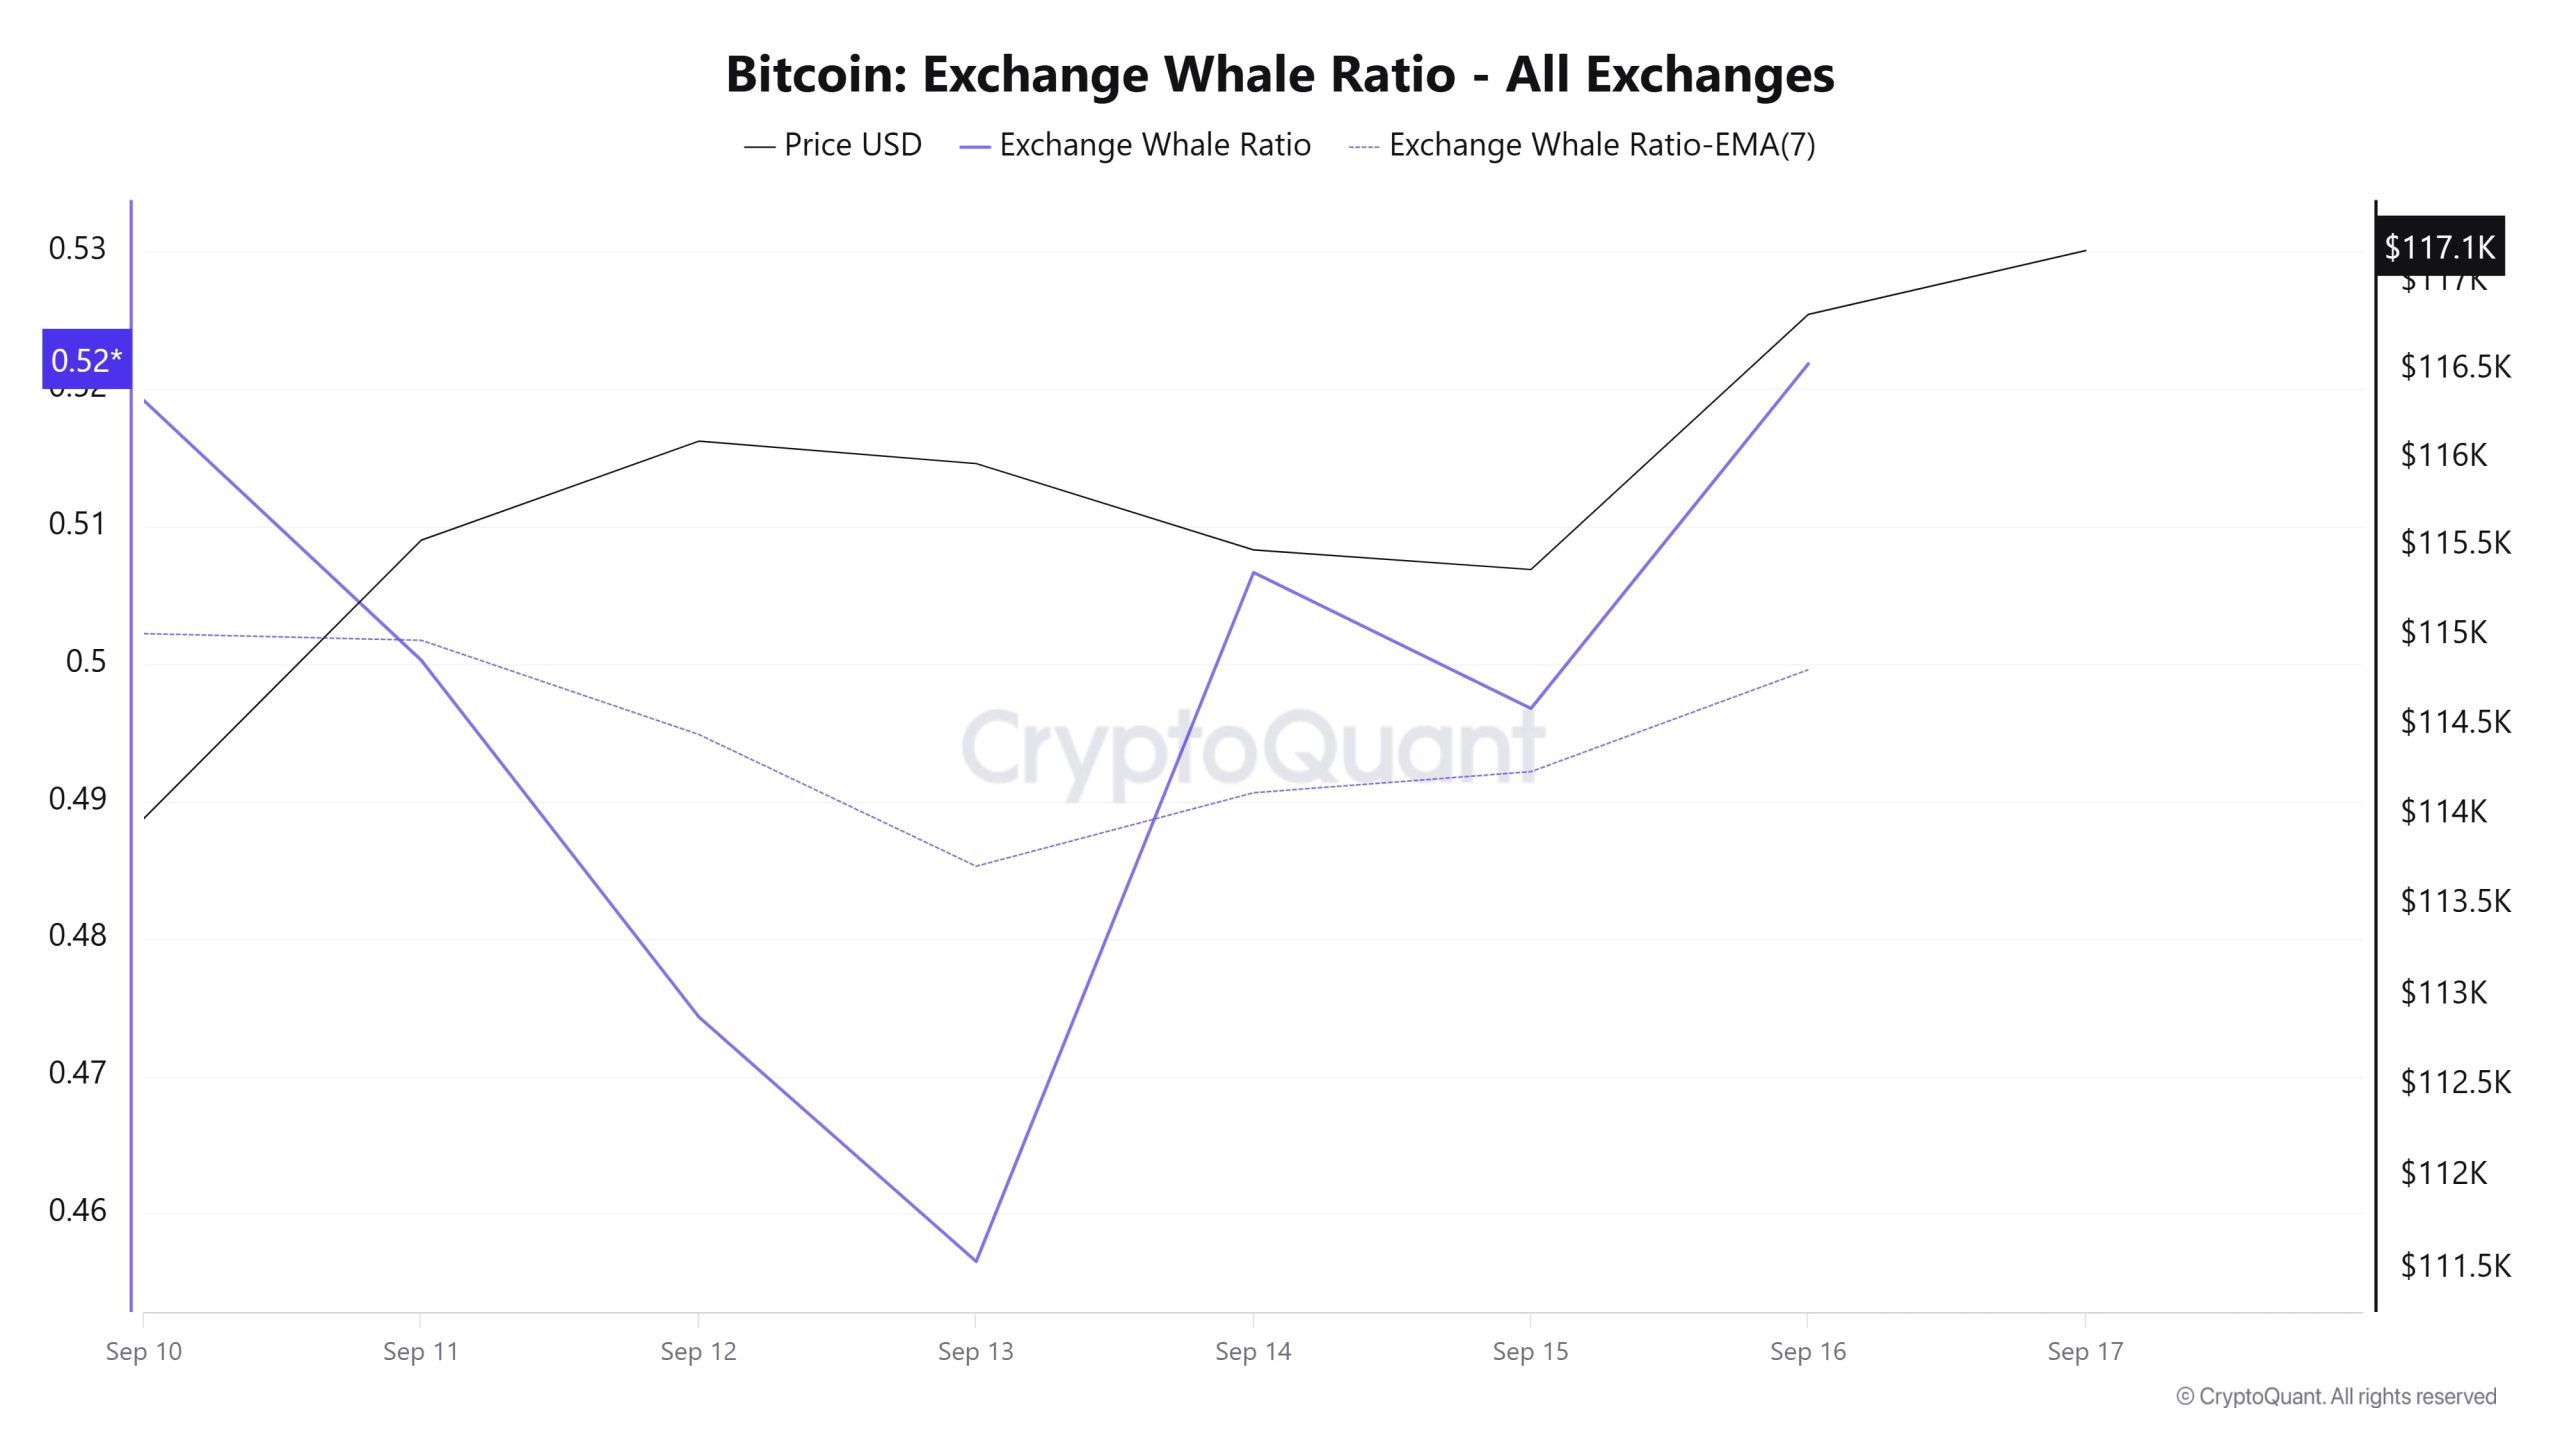
Whales Data:
Over the last 7 days, according to data from the cryptocurrency market, whale activity el centralized exchanges has declined from the beginning to the middle of the process. When we look at the Exchange Whale Ratio metric, the rate of whales using central exchanges was 0.519 el September 10, the first day of the 7-day period. The lowest point occurred el September 13 and fell to 0.456. When this ratio is above 0.35, it usually means that whales use central exchanges frequently. The metric, which currently has a value of 0.521, seems to have caught the upward momentum and at the same time has formed the peak of the process. BTC is seen to have risen from 112,000 dollars to 117,000 values en this process. At the same time, it is seen that 4,191,191 BTC moved, showing a 10% decrease en total BTC transfer compared to last week. When we look at the data, wallets holding between 10 and 10,000 BTC have accumulated over 203,000 BTC en the last six months. This shows that the growth en wallets is strongly correlated with Bitcoin price movements and is an important factor affecting the direction of the market. As a result, big pockets continue to accumulate BTC. This continues to be reflected en parallel with the price. But increased use of centralized exchanges could trigger profit-taking.
BTC Onchain Overall
| Metric | Positive 📈 | Negative 📉 | Neutral ➖ |
|---|---|---|---|
| Active Addresses | ✓ | ||
| Breakdowns | ✓ | ||
| Derivatives | ✓ | ||
| Supply Distribution | ✓ | ||
| Exchange Supply Ratio | |||
| Exchange Reserve | ✓ | ||
| Fees and Revenues | ✓ | ||
| Miner Flows | ✓ | ||
| Transaction | ✓ | ||
| Whale Activities | ✓ |
*The metrics and guidance en the table do not, en and of themselves, describe or imply an expectation of future price changes for any asset. The prices of digital assets may vary depending el many different variables. The onchain analysis and related guidance are intended to assist investors en their decision-making process, and making financial investments based solely el the results of this analysis may result en harmful transactions. Even if all metrics produce a positive, negative or neutral result at the same time, the expected results may not be seen according to market conditions. Investors reviewing the report would be well advised to heed these caveats.
Legal Notice
The investment information, comments and recommendations contained en this document do not constitute investment advisory services. Investment advisory services are provided por authorized institutions el a personal basis, taking into account the risk and return preferences of individuals. The comments and recommendations contained en this document are of a general type. These recommendations may not be suitable for your financial situation and risk and return preferences. Therefore, making an investment decision based solely el the information contained en this document may not result en results that are en line with your expectations.
NOTE: All data used en Bitcoin onchain analysis is based el Cryptoqaunt.