
Active Addresses
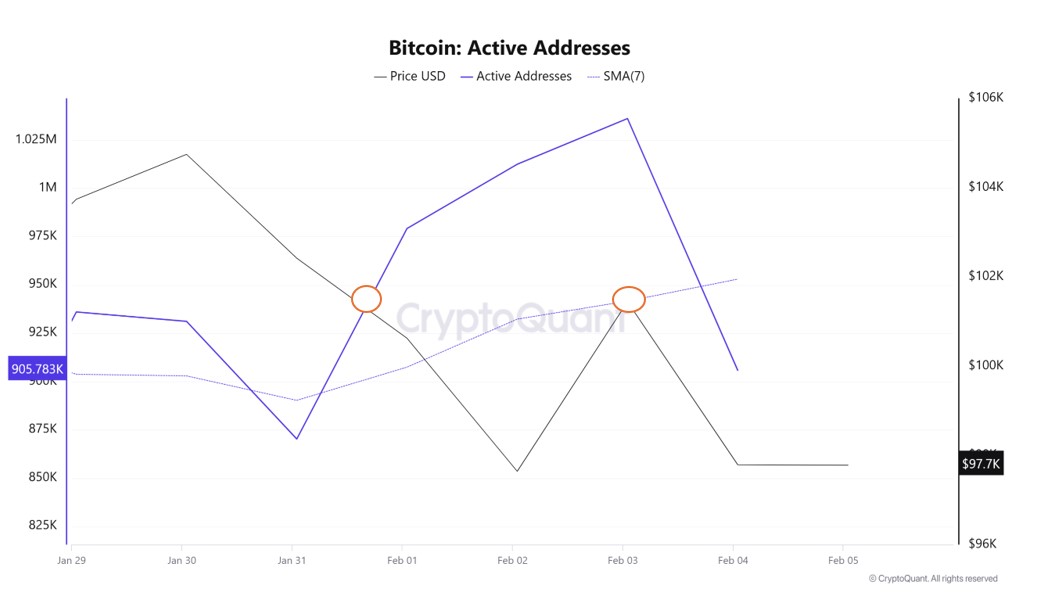
In the number of active addresses, there were 1,036,123 entries to exchanges between January 29 and February 3, 2025 this week. Bitcoin fell from 104,000 to 97,000 during this period. Bitcoin buying accelerated at the intersection of price and the number of active addresses in the region marked on the chart, which is the highest number of active addresses since the first days of February and the number of addresses ready to trade. On January 31, the number of active addresses, which fell to 870,247, may indicate that the market is falling, and investors are selling out of fear. When we follow the 7-day simple moving average, it is observed that the price follows a downward trend on the dates when these average cuts the price. Bitcoin reached 907,440 in correlation with the active address EMA (7). This situation indicates that the Bitcoin price is experiencing entries from 101,000 levels.
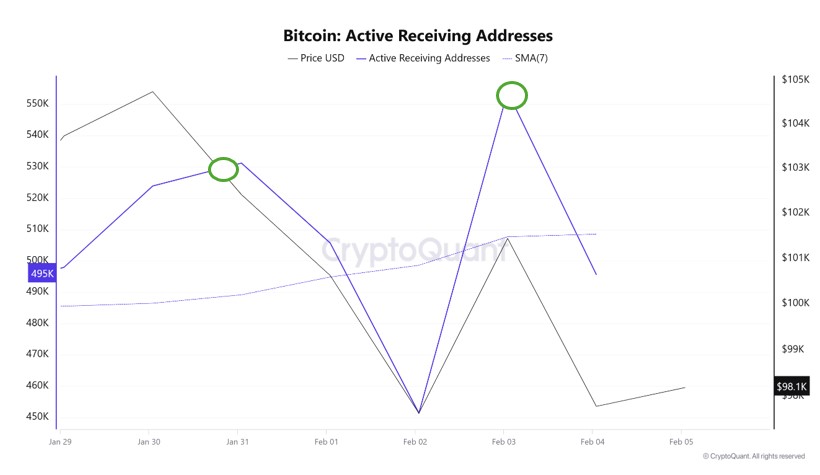
On the Active Receiving Addresses, it is seen that on February 3, when the price was at 101,000, the number of buyers approached the highest levels, 554,032, and the longest buying was at the level where investors went to increase their bitcoin positions. However, on the chart, the SMA (7-Day) is close to changing the trend direction (entering the bullish zone) at the intersection with the price at 507,696. This may indicate the costing levels of buyers before the price rises.
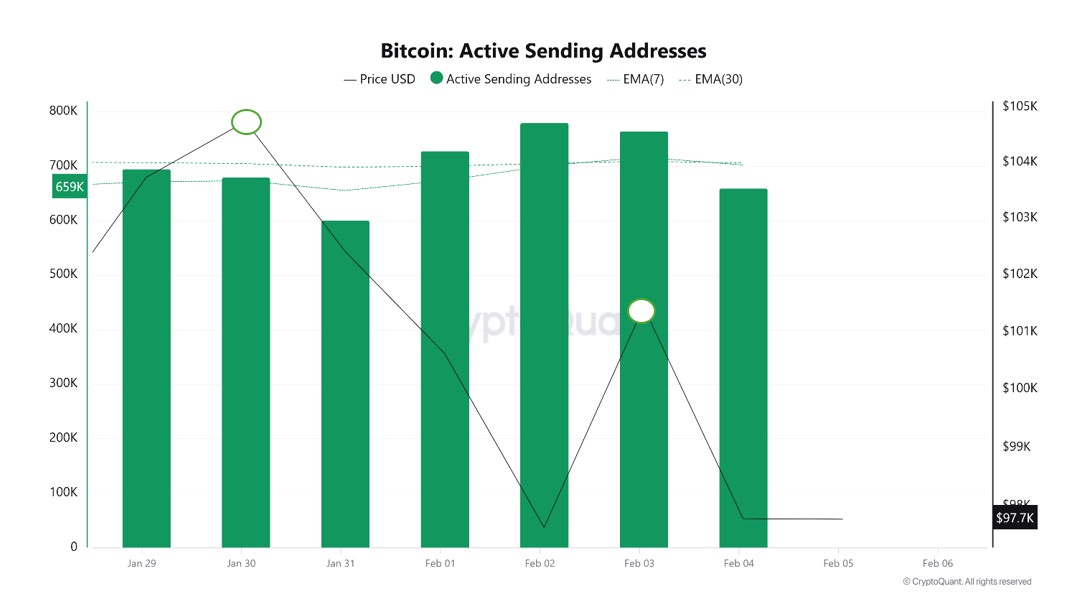
On the exits, there was a significant increase in active shipping addresses towards January 31, along with the Black Line (price line). On the day of the price peak, active shipping addresses rose to 679,711 , indicating that buyers sold their positions as Bitcoin remained at 103,000 for a while.
Breakdowns
MRVR
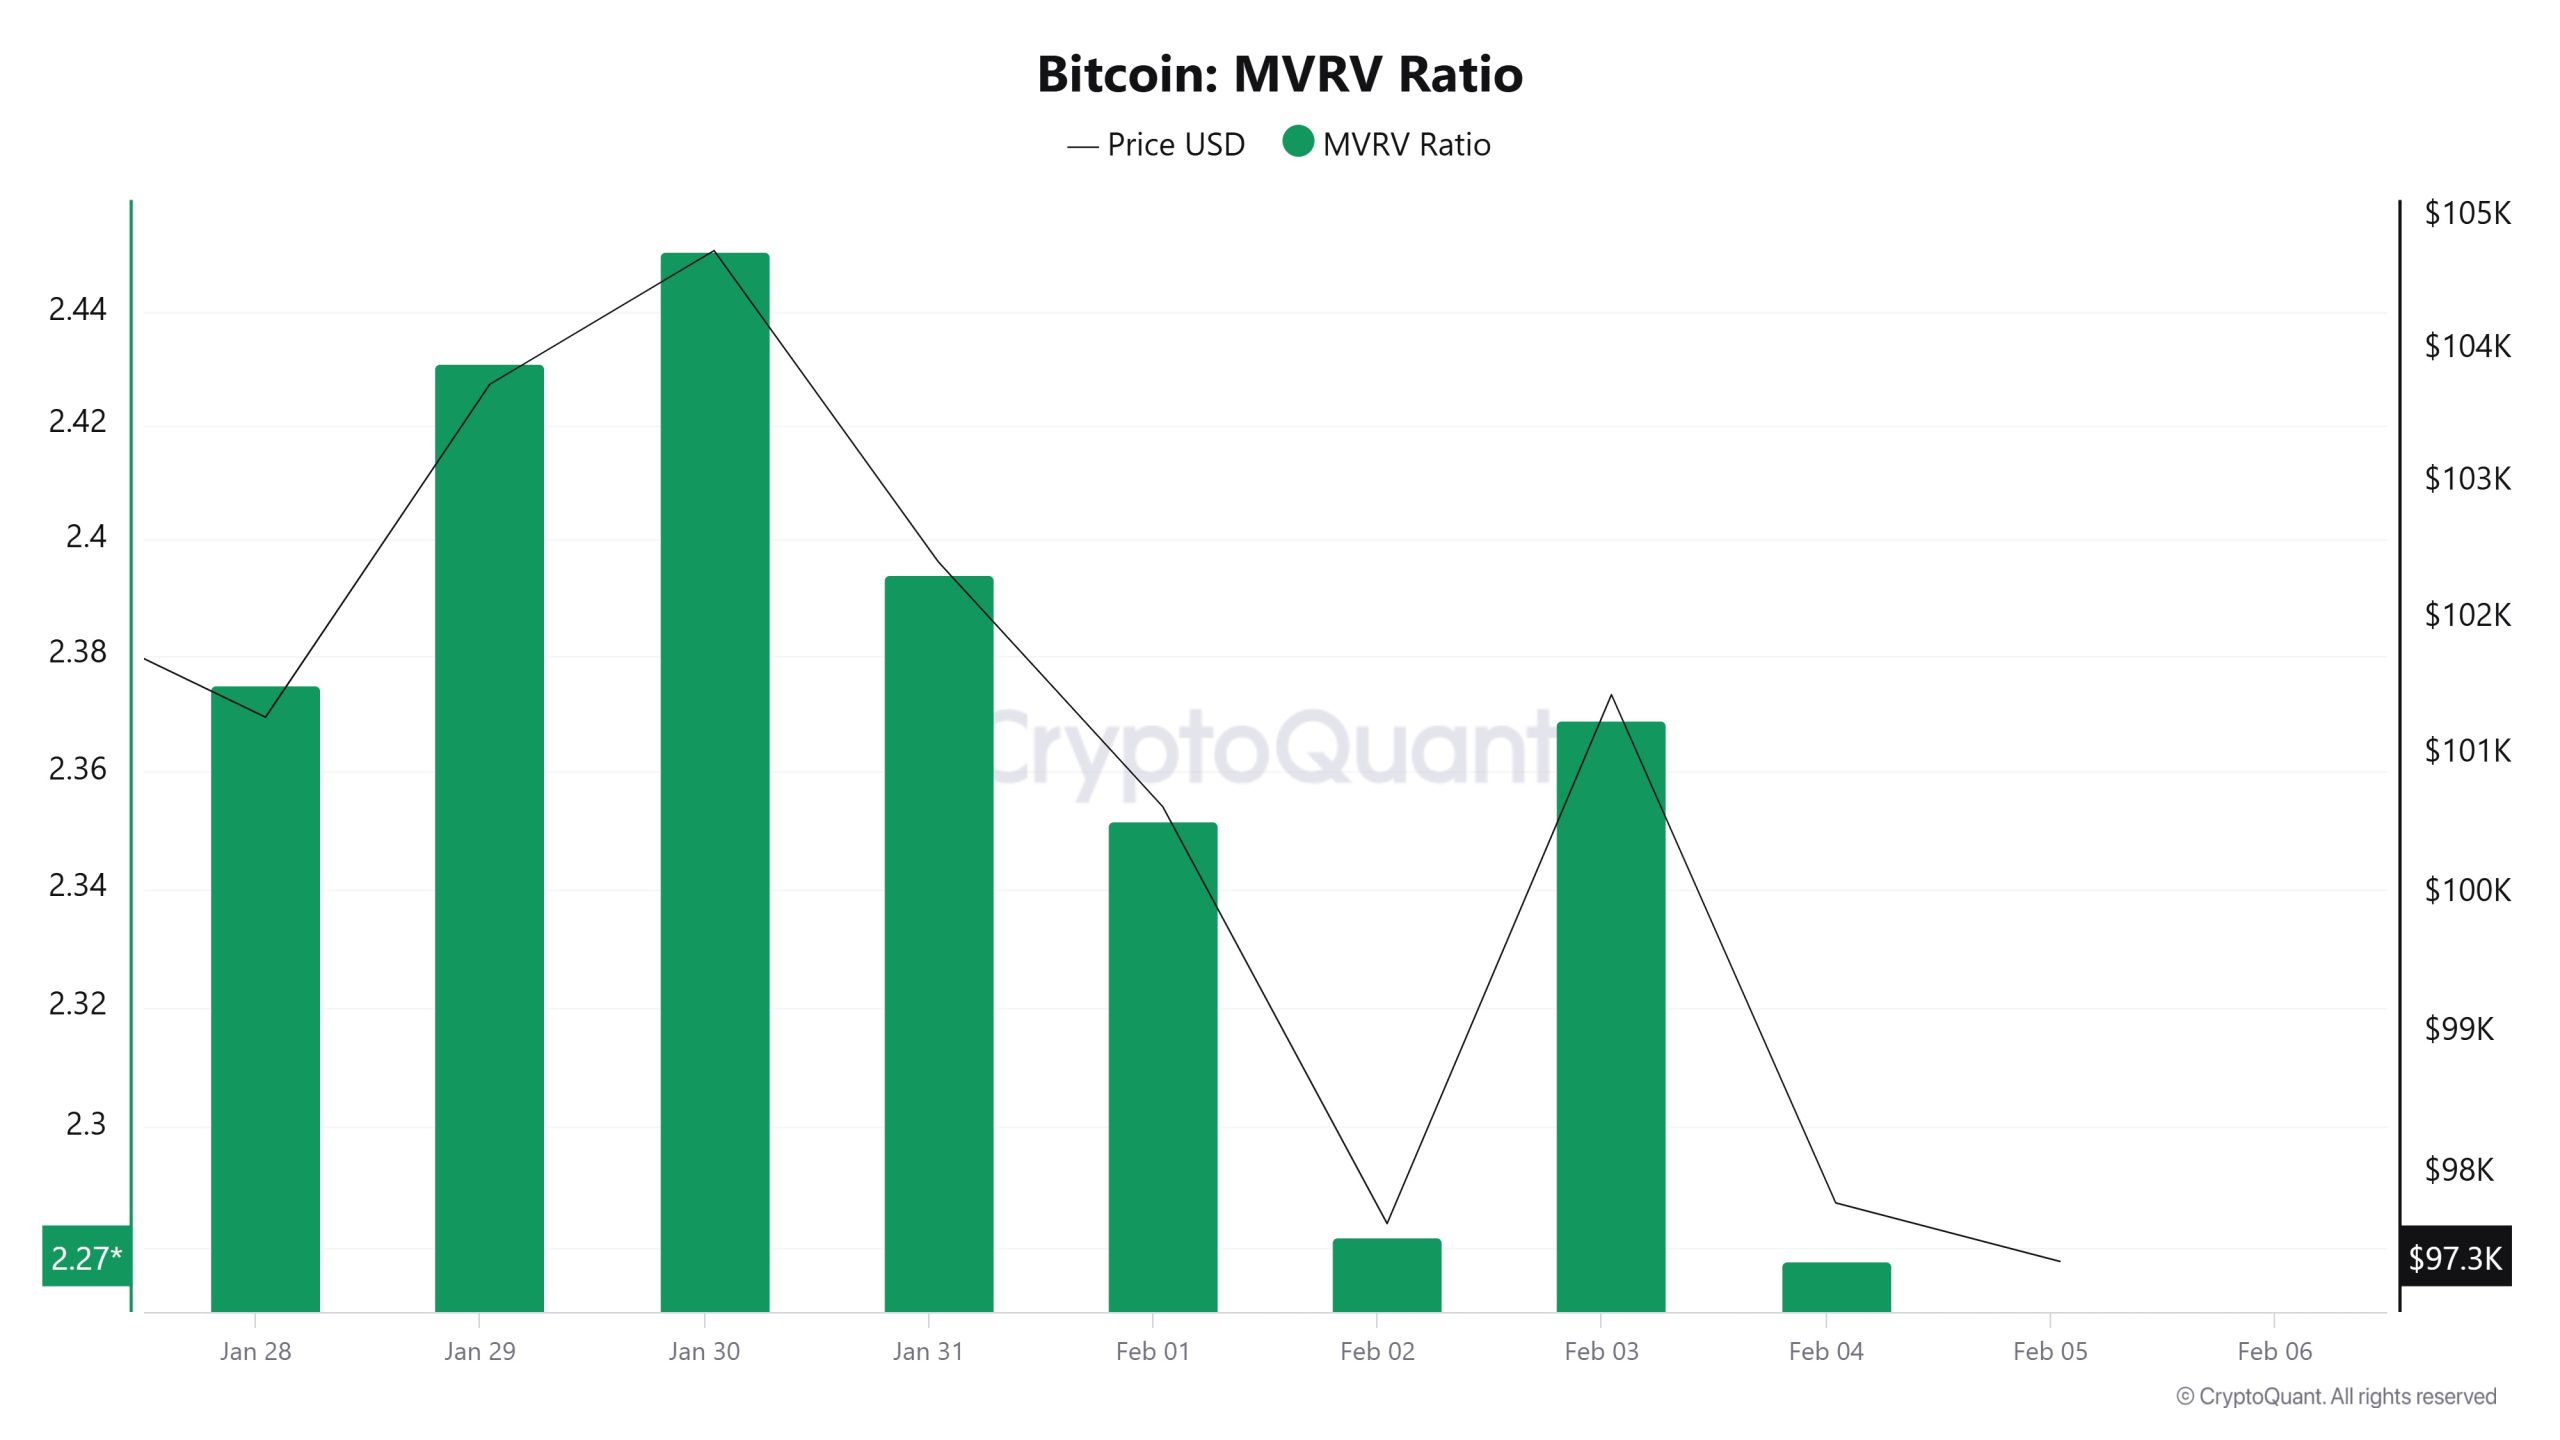
On January 29, the Bitcoin price was 103,737 while the MVRV Ratio was 2.43. As of February 4, the Bitcoin price was down to 97,788, while the MVRV Ratio was 2.27. Compared to last week, Bitcoin price decreased by 5.73% and MVRV Ratio decreased by 6.58%.
Realized Price
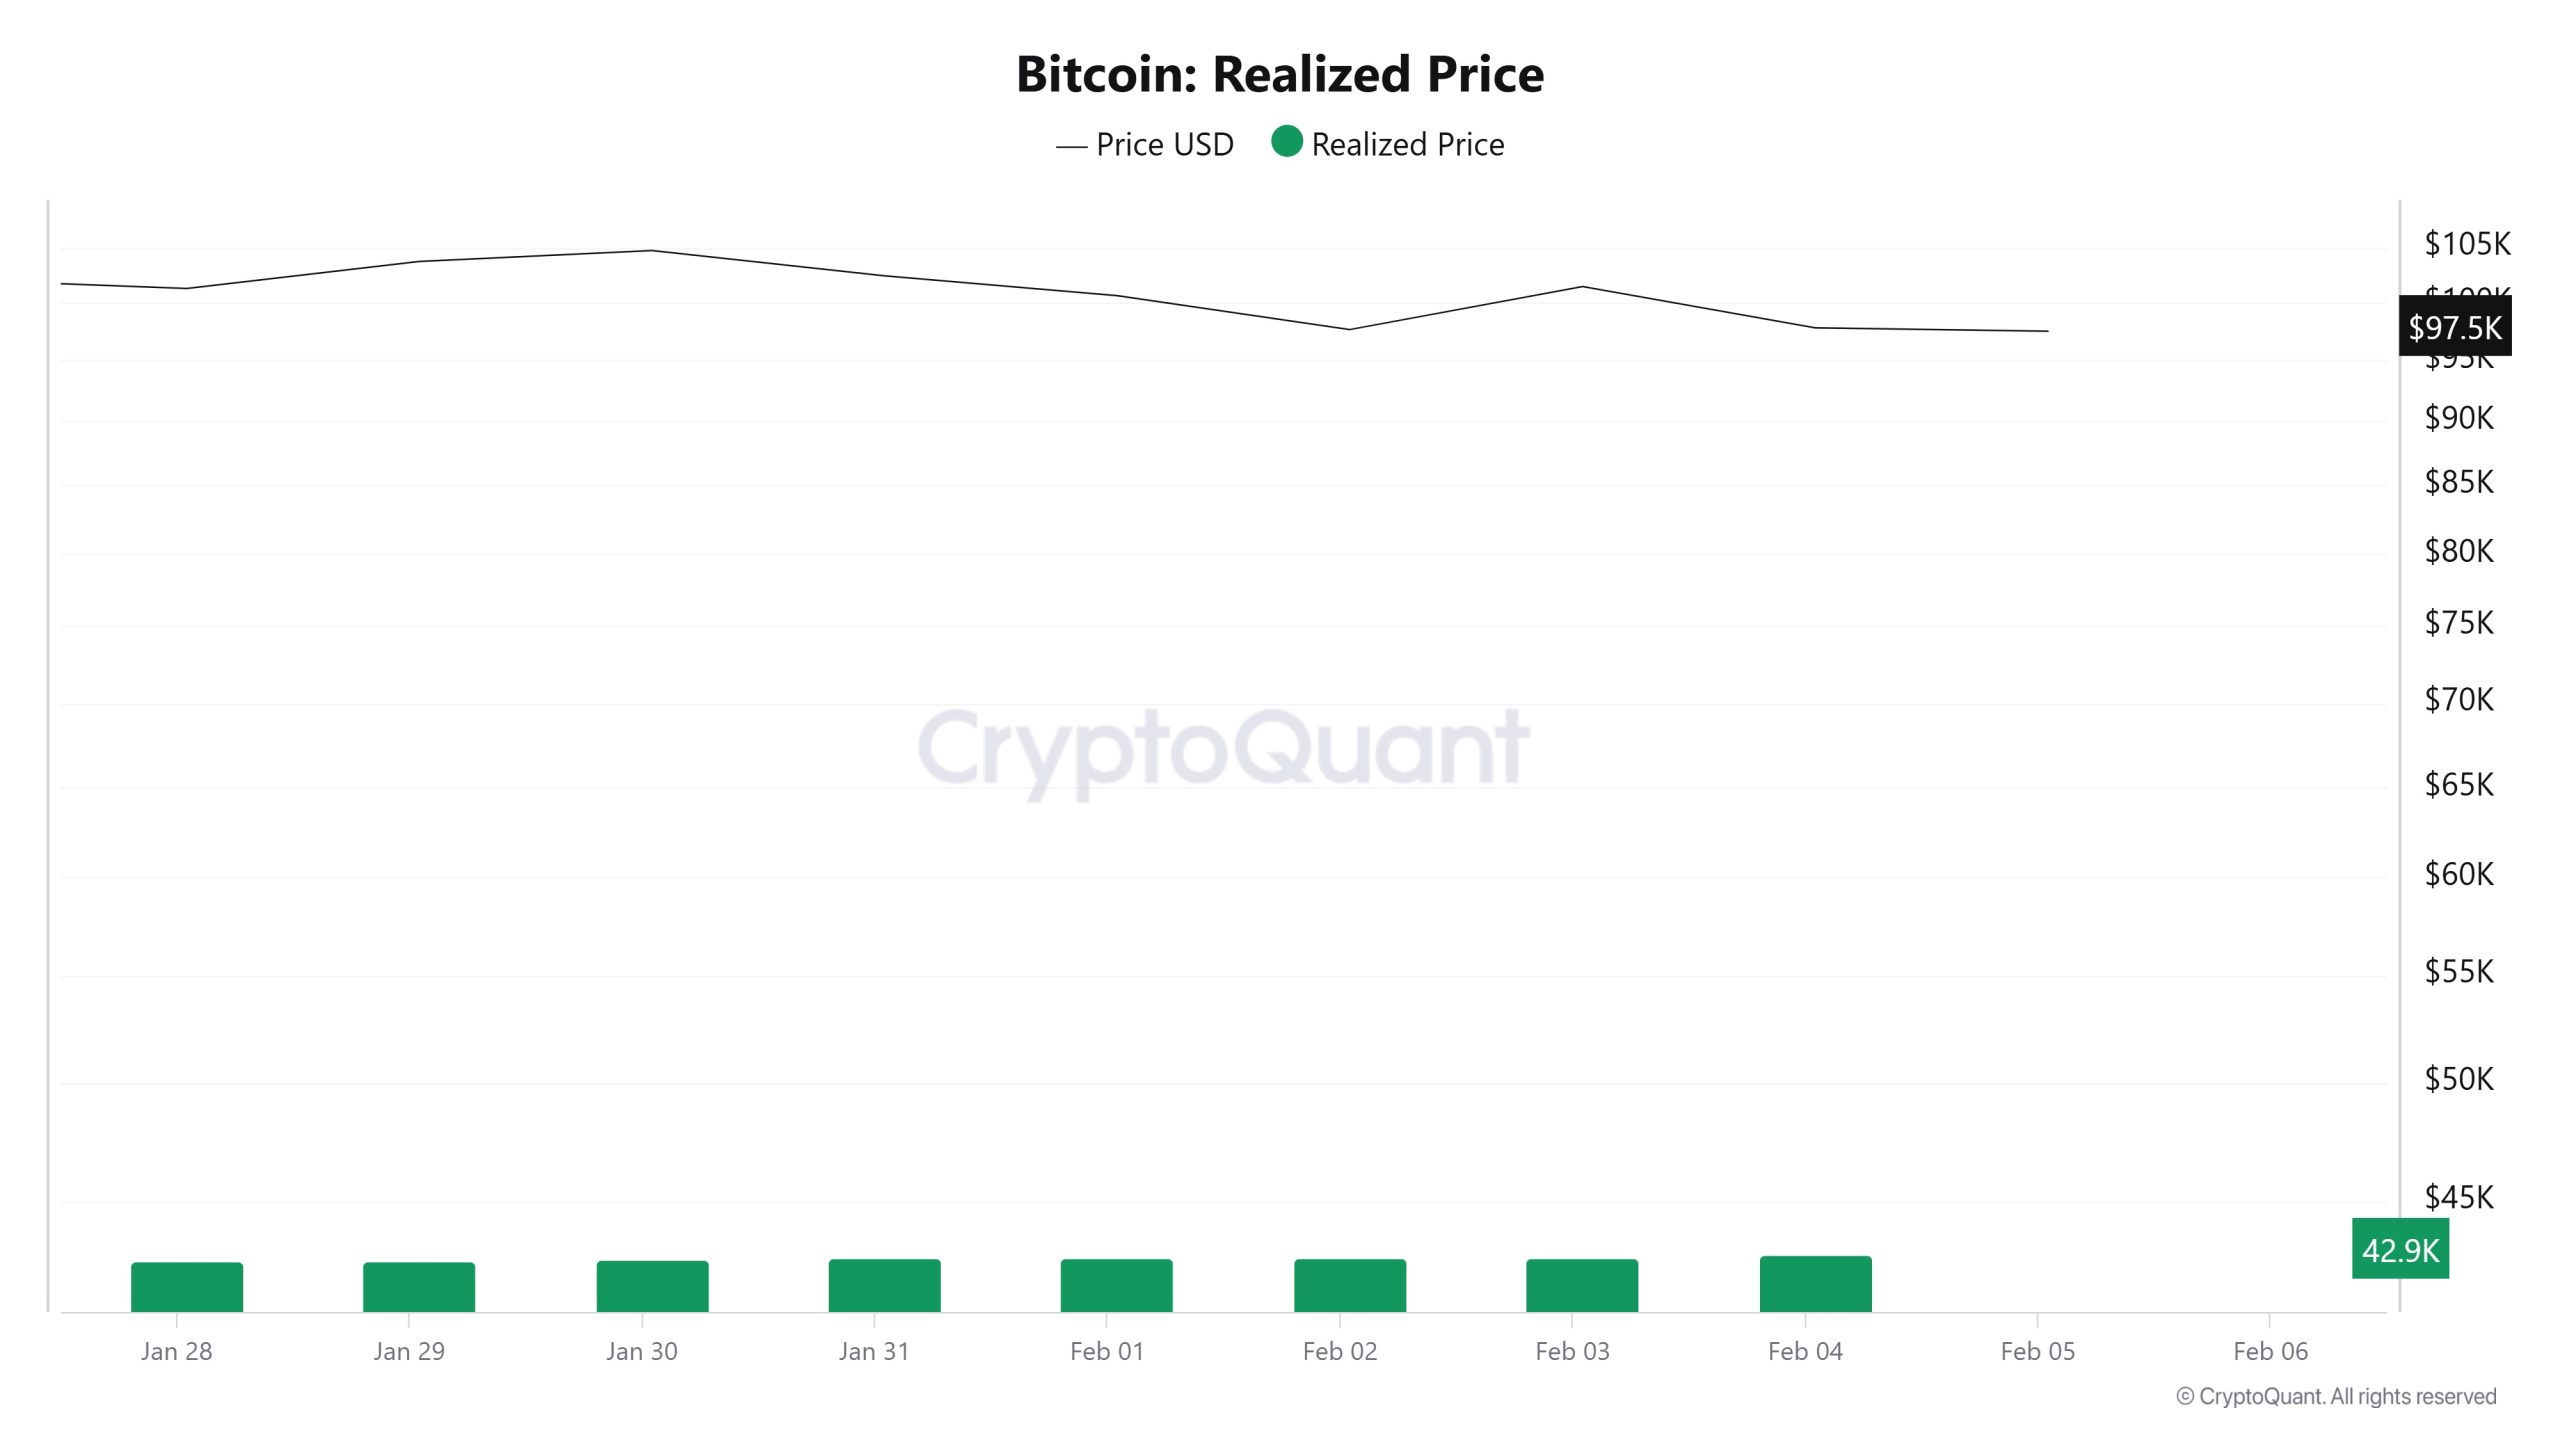
On January 29, the Bitcoin price was 103,737 while the Realized Price was 42,673. As of February 4, the Bitcoin price was down to 97,788 while the Realized Price was 42,933. Compared to last week, Bitcoin price decreased by 5.73% while Realized Price increased by 0.61%.
Spent Output Profit Ratio (SOPR)
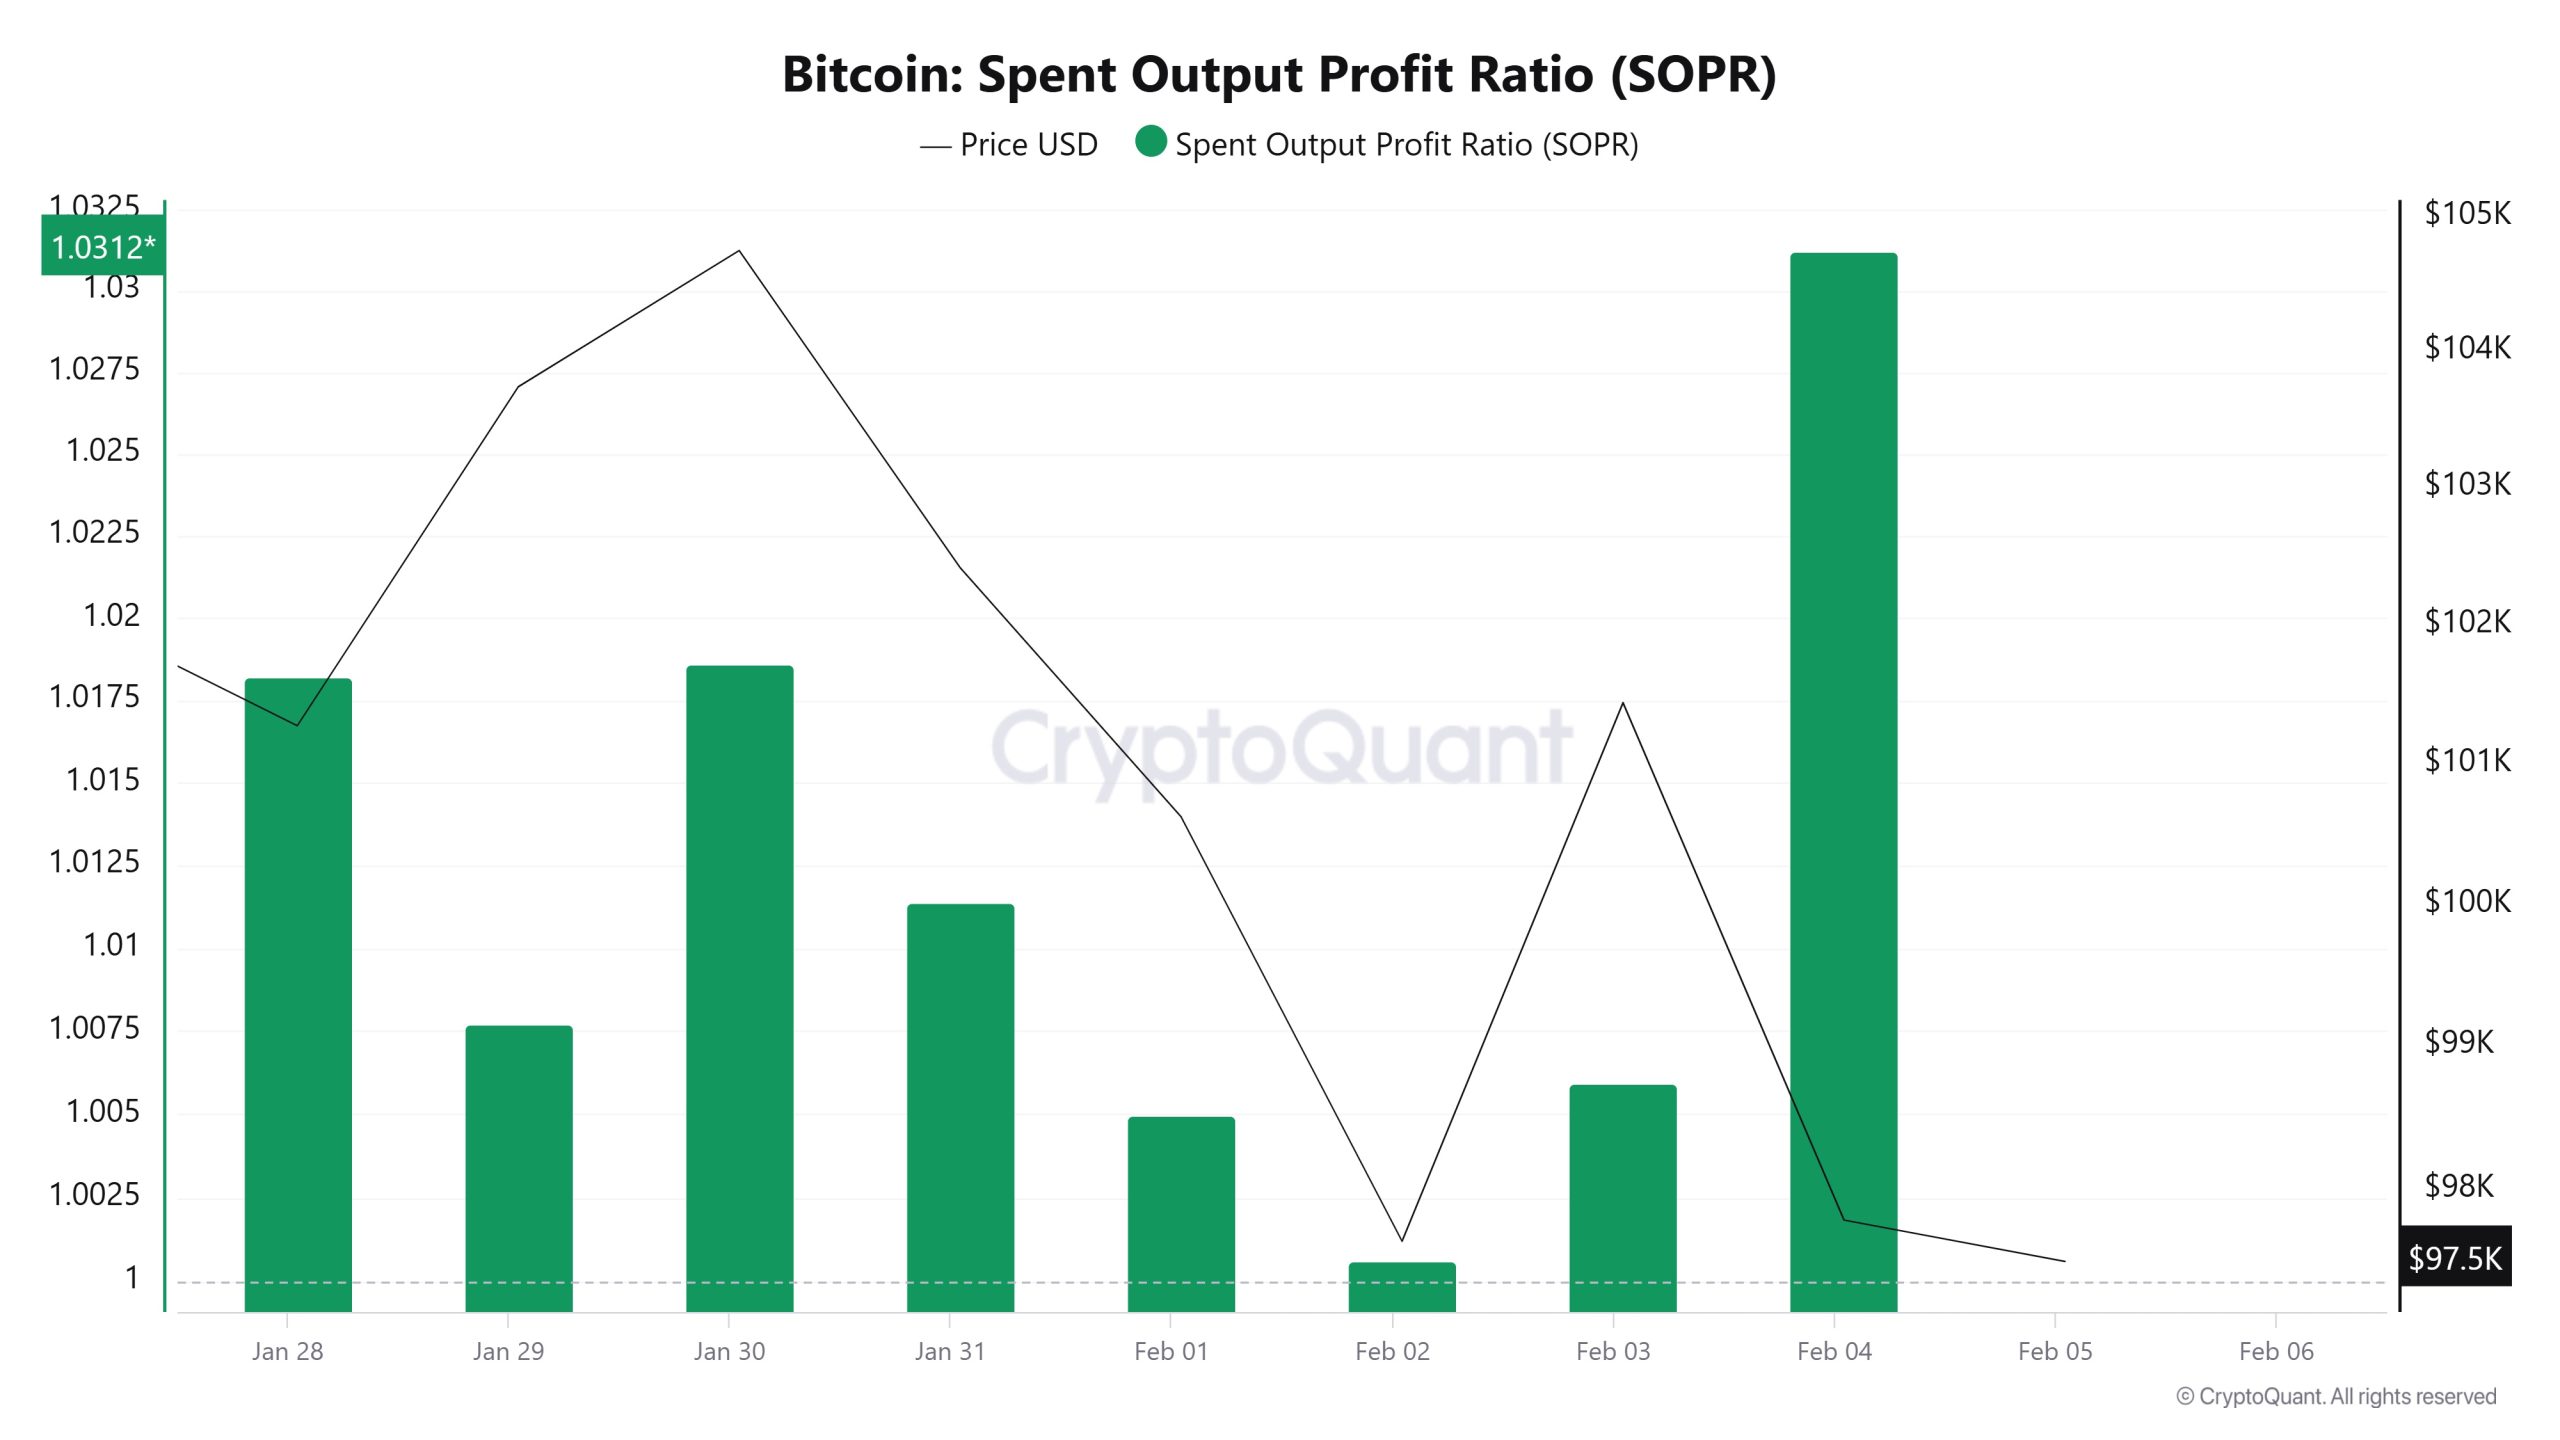
On January 29, the Bitcoin price was 103,737, while the SOPR metric was 1. As of February 4, the Bitcoin price fell to 97,788 while the SOPR metric rose to 1.03. Compared to last week, the Bitcoin price has risen by 5.73% and the SOPR metric has risen by about 3%.
Derivatives
Open Interest
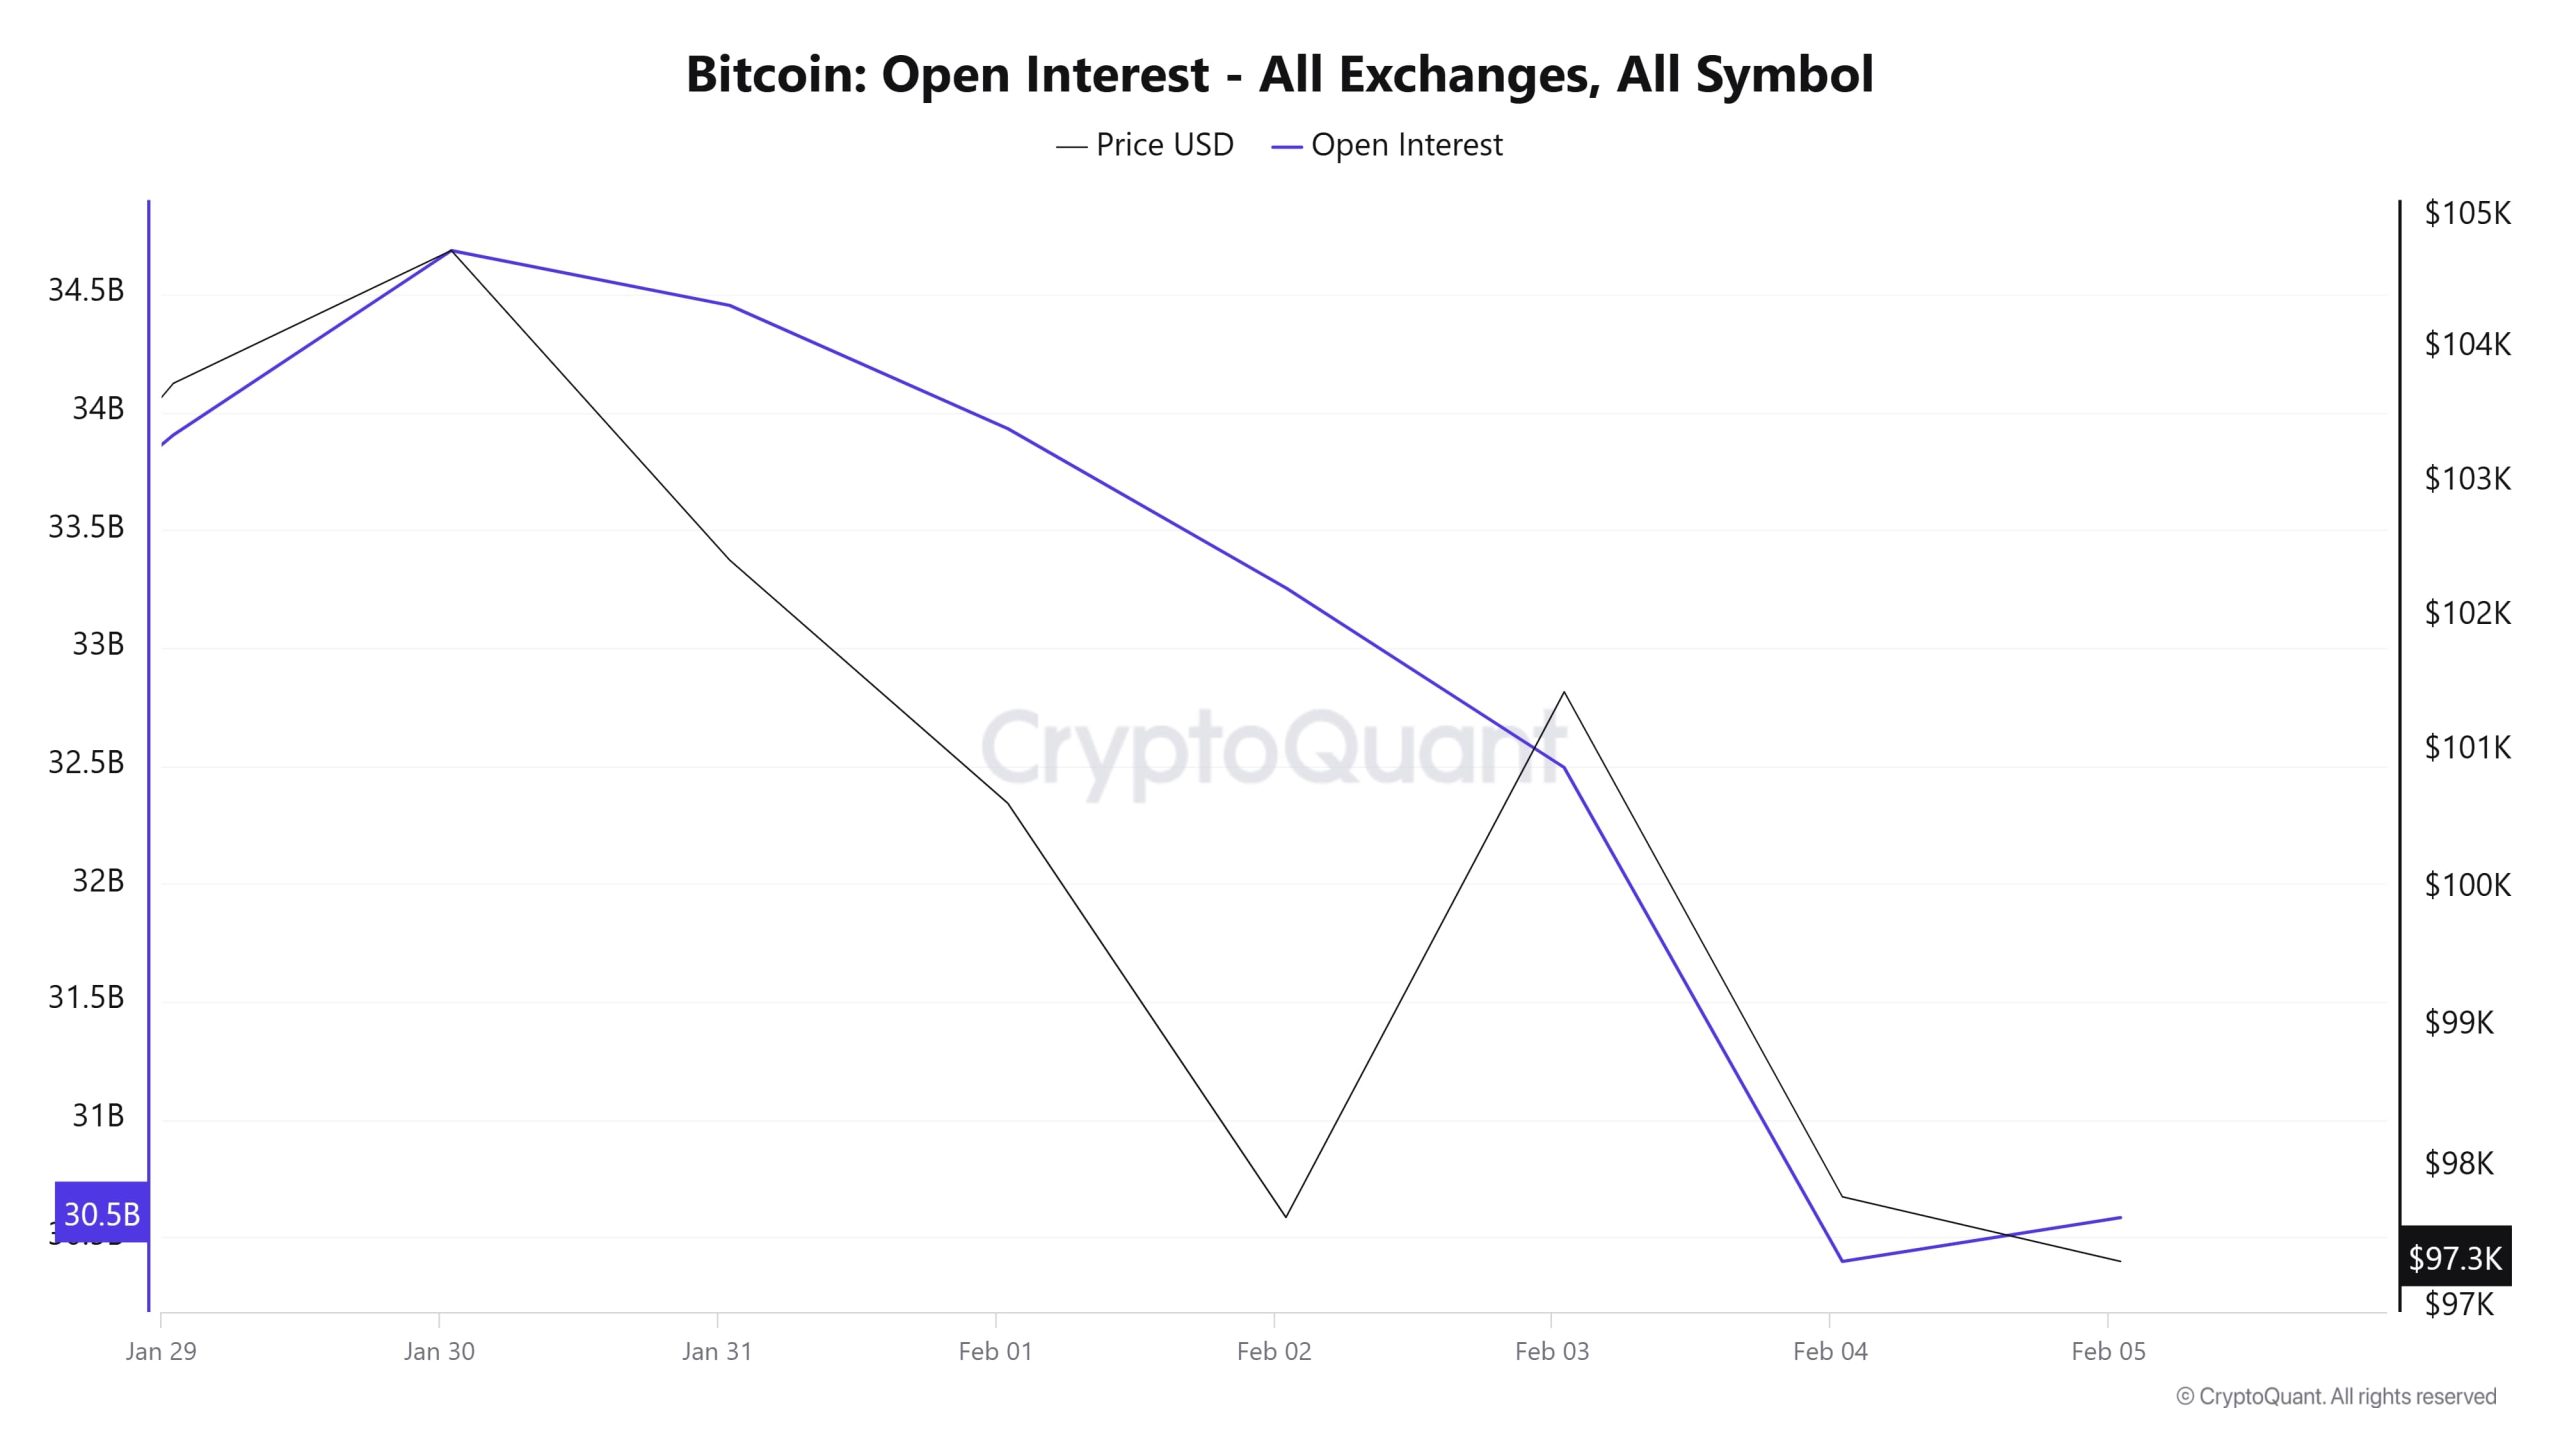
The chart shows that Bitcoin’s Open Interest (OI) and price movements have generally moved in parallel over the last week. On January 29, OI was at $30.6 billion, rising with price and peaking at $34.5 billion on January 30. After this point, however, both price and OI gradually decline. On February 2, as the price fell sharply, the OI also declined sharply, suggesting that the market was liquidating, and investors were closing positions. On February 3, the price attempts a short-lived recovery, but the OI remains at low levels, suggesting that confidence in the market has not fully returned. On February 4, both price and OI hit lows, and a large portion of leveraged positions were liquidated or closed. As of February 5, there is a slight rebound but no strong bullish signal yet. Overall, the decline in Open Interest suggests that the use of leverage in futures trading is decreasing, and investors’ risk appetite is declining.
Funding Rate
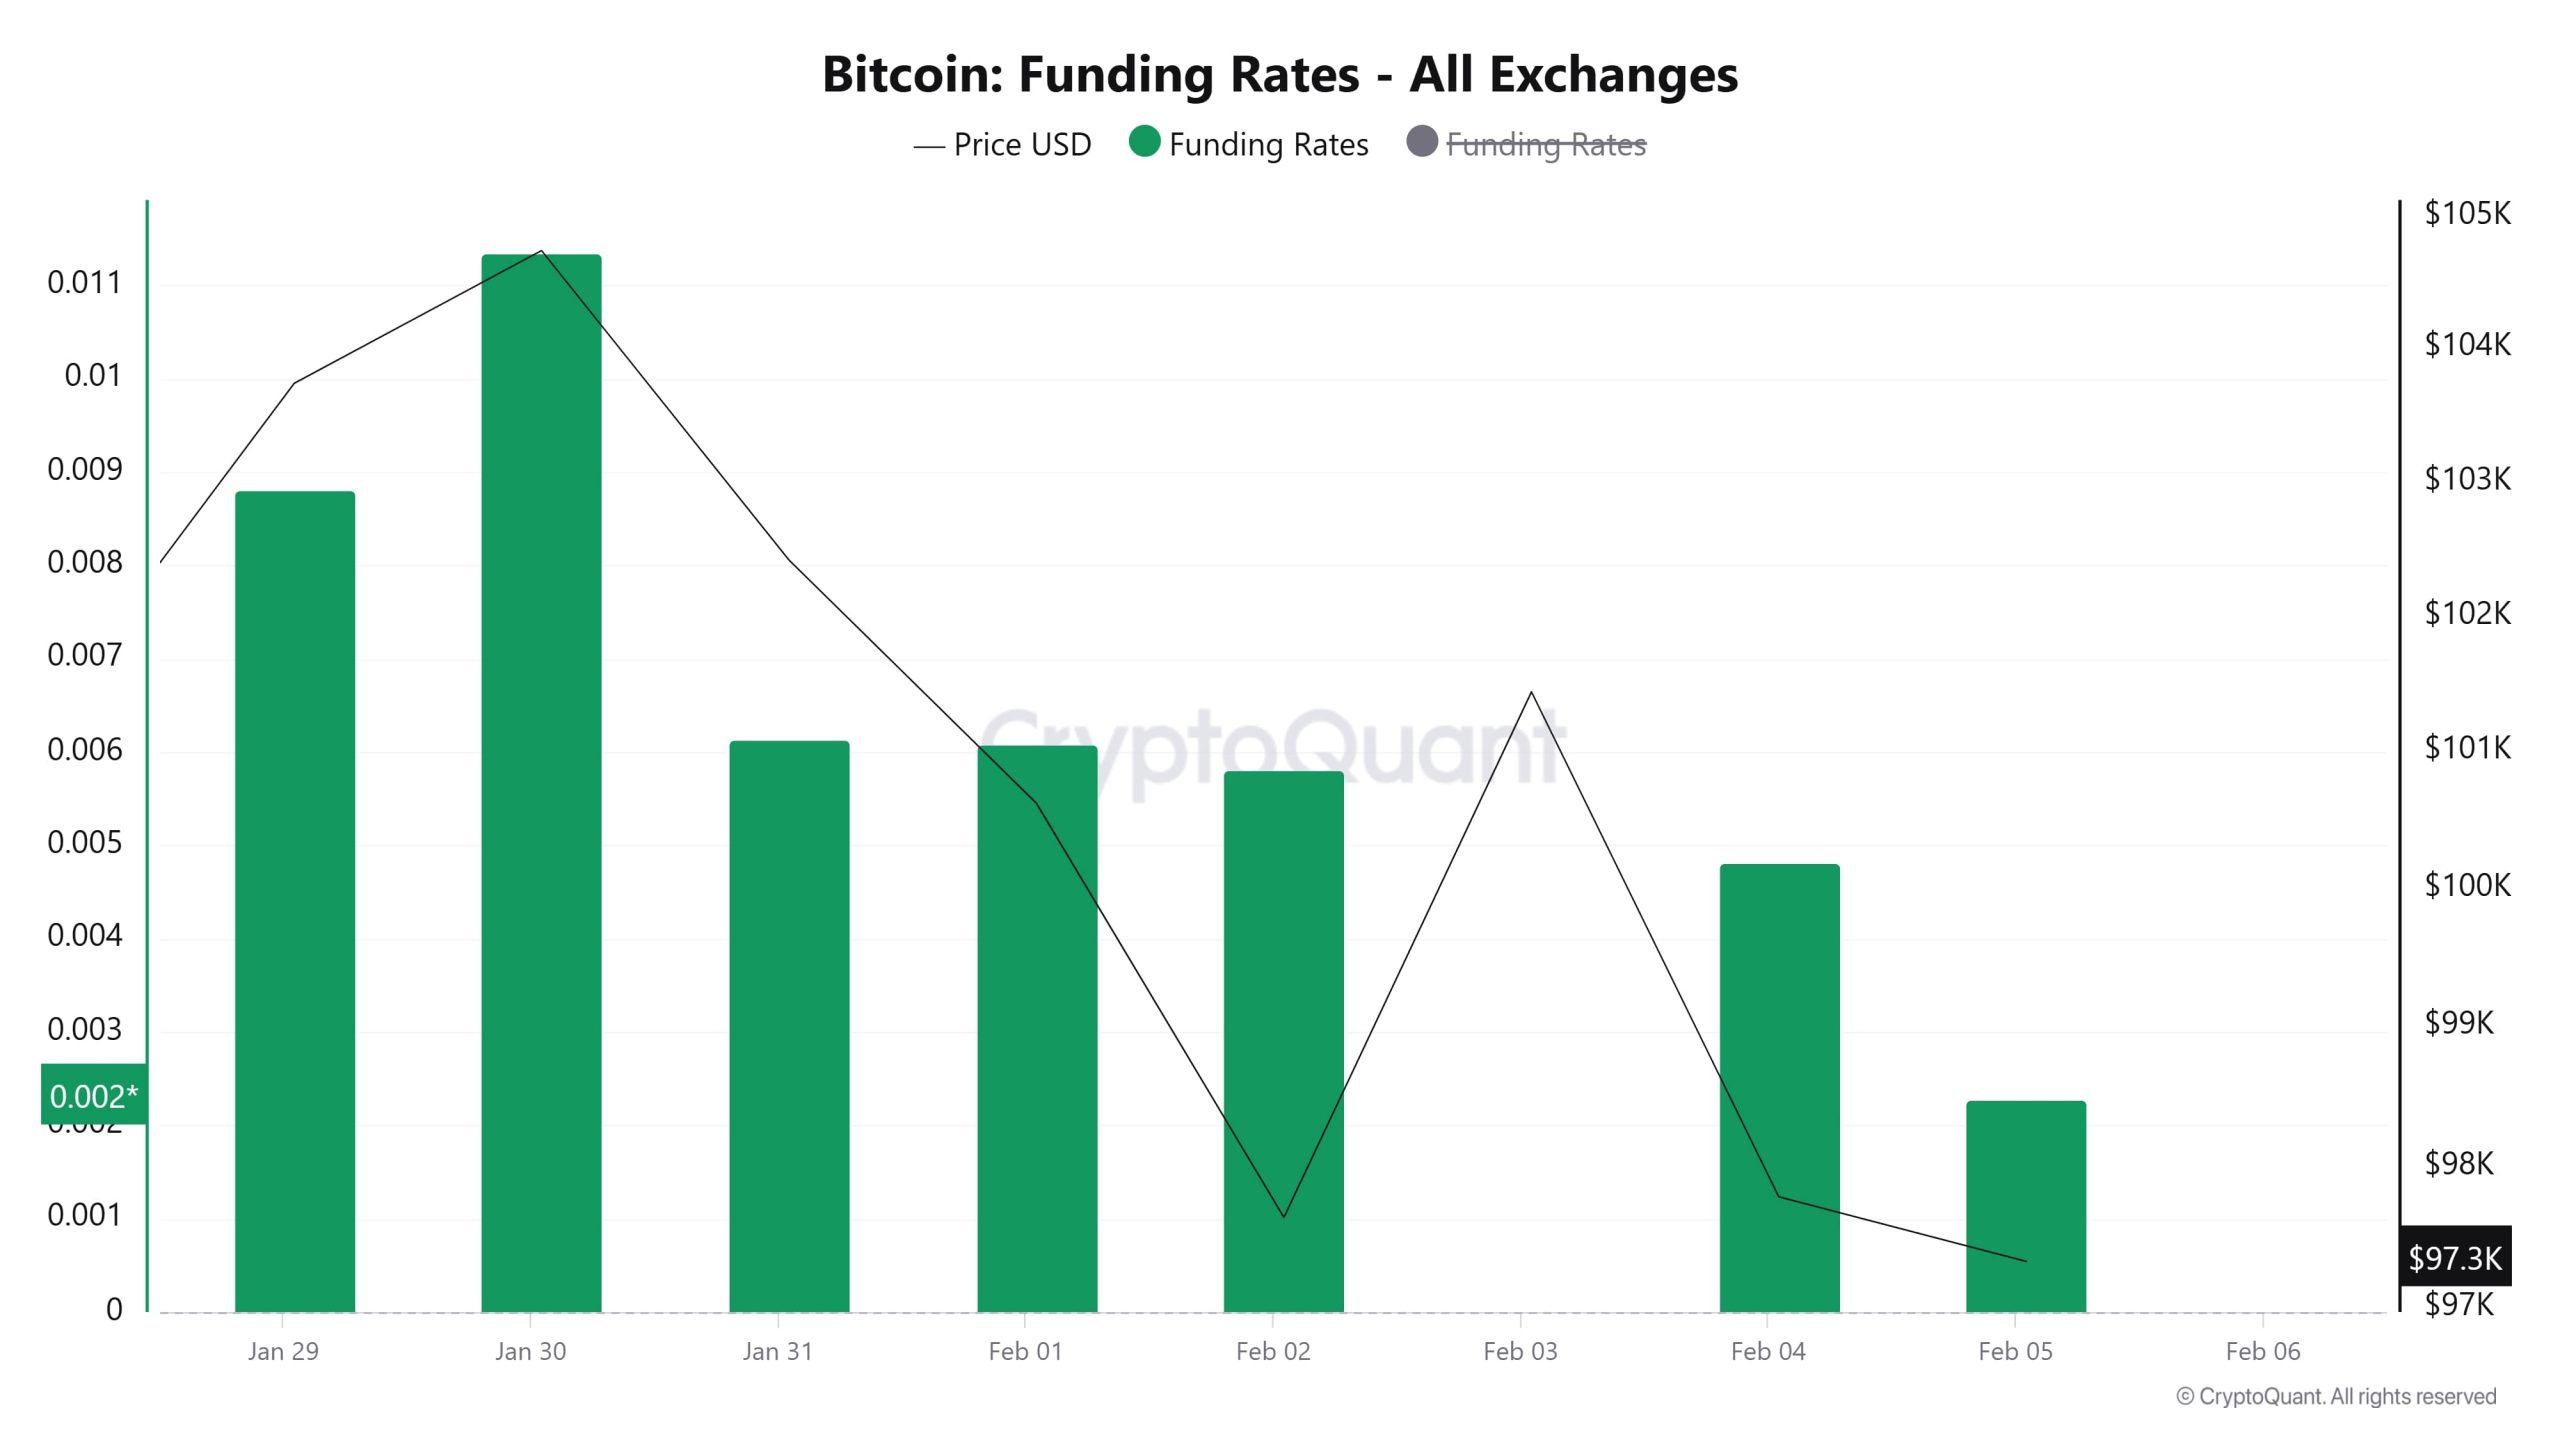
When Bitcoin’s funding rate and price movements are evaluated together in the chart, it is seen that the funding rate started positive on January 29 and peaked at 0.011 on January 30. This rise indicates that long positions were concentrated, and investors were expecting a rise. However, as the price started to decline, the funding rate also started to decline gradually. From February 1 onwards, there is a noticeable decline in the funding rate, hence a decrease in the number of investors opening long positions. On February 2 and 3, the funding rate remained flat as the price declined sharply, but on February 4, the funding rate also declined sharply as the price bottomed out. As of February 5, the funding rate is still positive, but it is considerably lower than before and the impact of long trades in the market has weakened.
Long & Short Liquidations
With BTC falling from $106,000 to $91,000 after the tariff announcements, we see that a large amount of long transactions have been liquidated in the market. In contrast, short liquidations remained relatively low at $68 million.
| Date | Long Amount (Million $) | Short Amount (Million $) |
|---|---|---|
| January 29 | 4.62 | 7.20 |
| January 30 | 2.01 | 5.14 |
| January 31 | 16.35 | 3.76 |
|
February 1
|
16.76 | 2.13 |
|
February 2
|
37.04 | 8.35 |
| February 3 | 94.25 | 28.76 |
| February 4 | 28.54 | 12.96 |
| TOTAL | 199.57 | 68.30 |
Supply Distribution
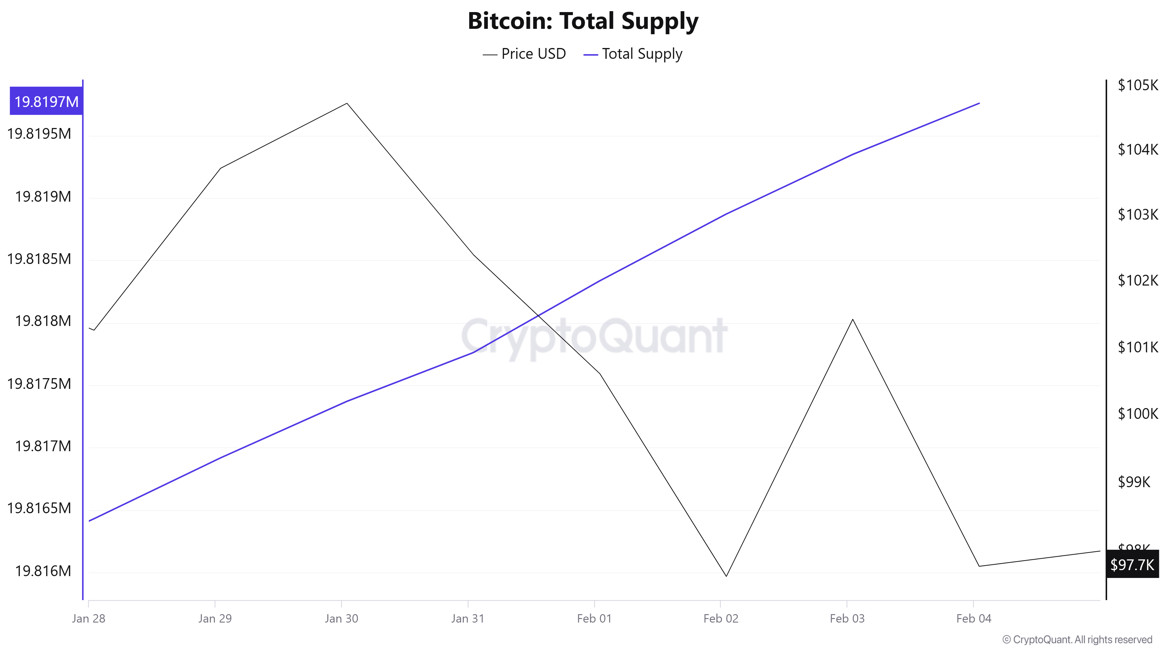
Total Supply: It reached 19,819,757 units, up about 0.0325% from last week.
New Supply: The amount of BTC produced this week was 6,433.
Velocity: Continued decline compared to the previous week.
| Wallet Category | 28.01.2025 | 04.02.2025 | Change (%) |
|---|---|---|---|
| < 0.1 BTC | 1.590% | 1.349% | -15.16% |
| 0.1 – 1 BTC | 5.409% | 5.405% | -0.07% |
| 1 – 100 BTC | 32.266% | 32.313% | 0.15% |
| 100 – 1k BTC | 22.646% | 23.084% | 1.93% |
| 1k – 100k BTC | 34.818% | 34.339% | -1.38% |
| > 100k BTC | 3.270% | 3.269% | -0.03% |
When we look at the Bitcoin supply distribution, there was a significant decrease of 15.16% in the “< 0.1 BTC” category, while a very small decrease of 0.07% was observed in the “0.1 – 1 BTC” category. While there was a slight increase of 0.15% in the “1 – 100 BTC” category, the biggest change was in the “100 – 1k BTC” category with an increase of 1.93%, indicating that the number of wallets at this level has grown significantly. In contrast, there was a 1.38% decrease in the “1k – 100k BTC” category, indicating that some of the large investors reduced their holdings. The “> 100k BTC” category recorded a small decrease of 0.03%. Overall, medium-sized investors (100 – 1k BTC) are more active in the market, while the number of small investors is decreasing and large investors (1k+ BTC) are selling some.
Exchange Reserve
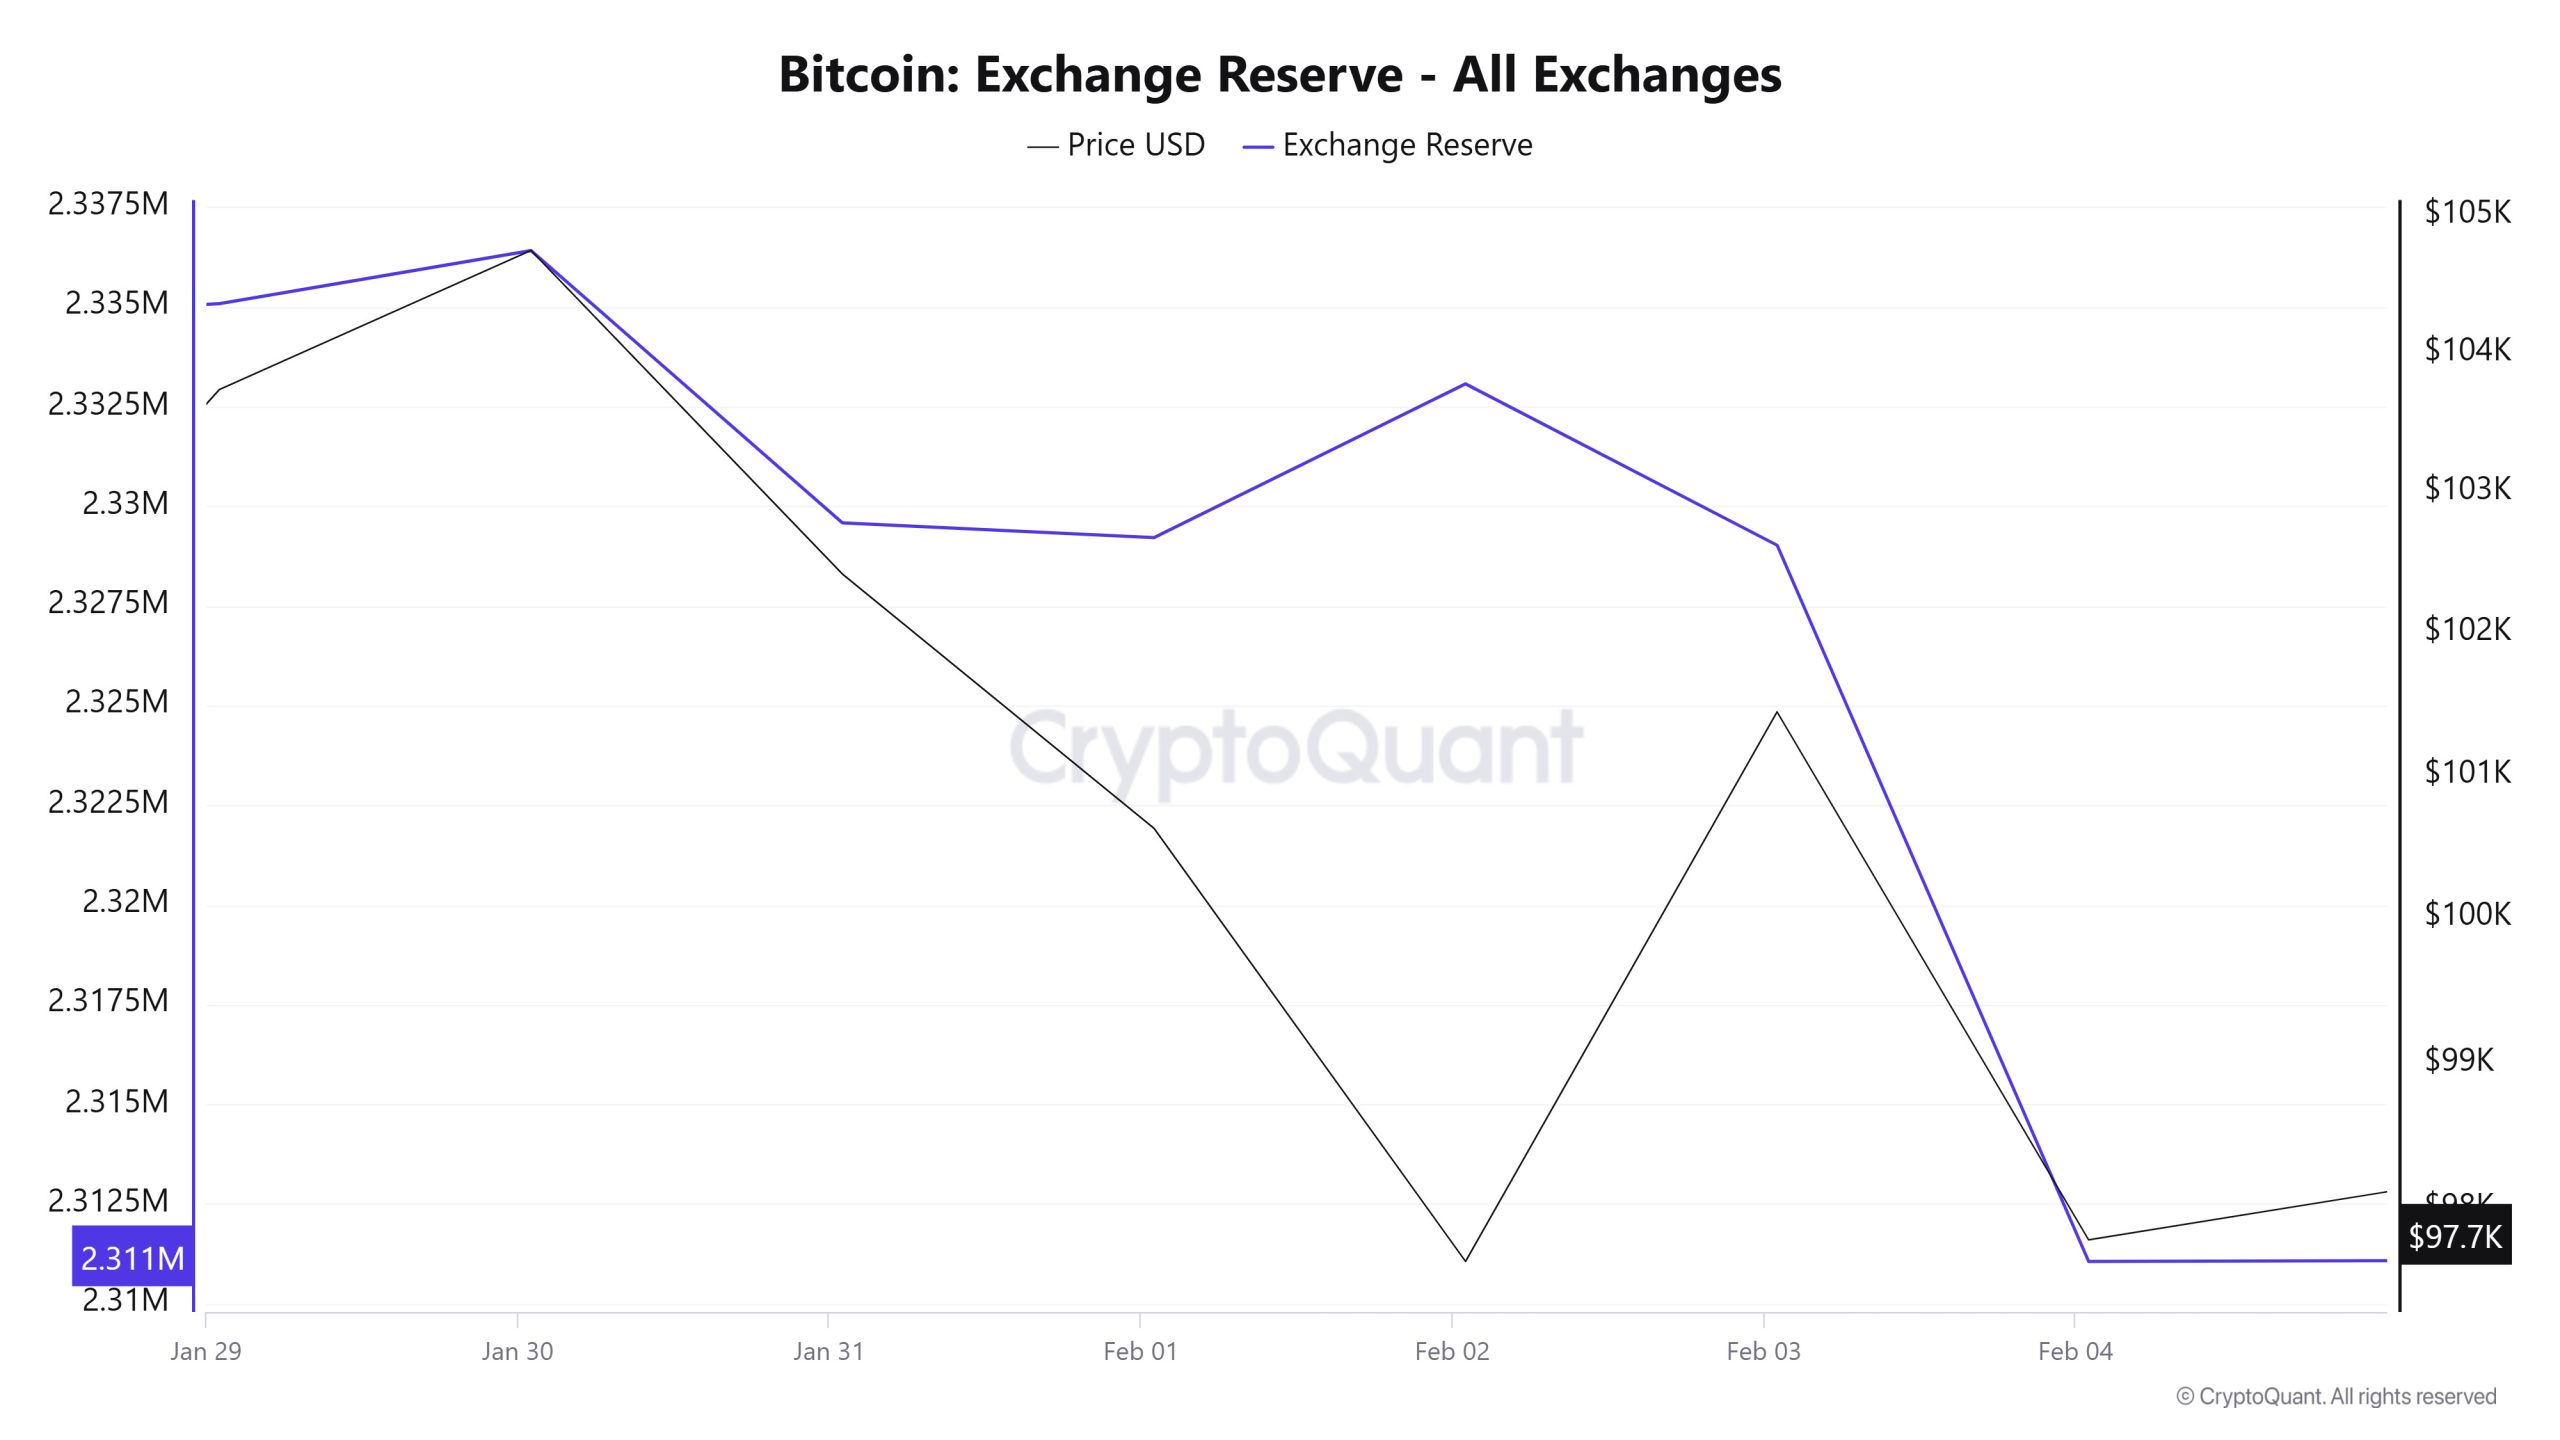
Between January 29 and February 4, 2025, Bitcoin reserves on exchanges decreased from 2,335,075 BTC to 2,311,056 BTC. In total, there was a net outflow of 24,019 BTC during this period and exchanges’ Bitcoin reserves decreased by 1.03%. The most notable movements during this period occurred on February 4, 2025. On this date, a net outflow of 17,964 BTC was recorded from exchanges and a sharp drop in reserves was observed. However, on February 2, a net inflow of 3,859 BTC attracted attention. The price of Bitcoin fell by approximately 5.7% during this period. Bitcoin, which closed at $103,737 on January 29, 2025, closed at $97,788 on February 4, 2025.
| Date | Exchange Inflow | Exchange Outflow | Exchange Netflow | Exchange Reserve | BTC Price |
|---|---|---|---|---|---|
| 29-Jan | 22,910 | 22,489 | 421 | 2,335,075 | 103,737 |
| 30-Jan | 30,989 | 29,656 | 1,334 | 2,336,409 | 104,744 |
| 31-Jan | 37,244 | 44,075 | -6,831 | 2,329,578 | 102,416 |
| 1-Feb | 14,804 | 15,174 | -370 | 2,329,208 | 100,623 |
| 2-Feb | 23,253 | 19,394 | 3,859 | 2,333,067 | 97,642 |
| 3-Feb | 66,234 | 70,282 | -4,048 | 2,329,019 | 101,440 |
| 4-Feb | 36,469 | 54,433 | -17,964 | 2,311,056 | 97,788 |
Fees and Revenues
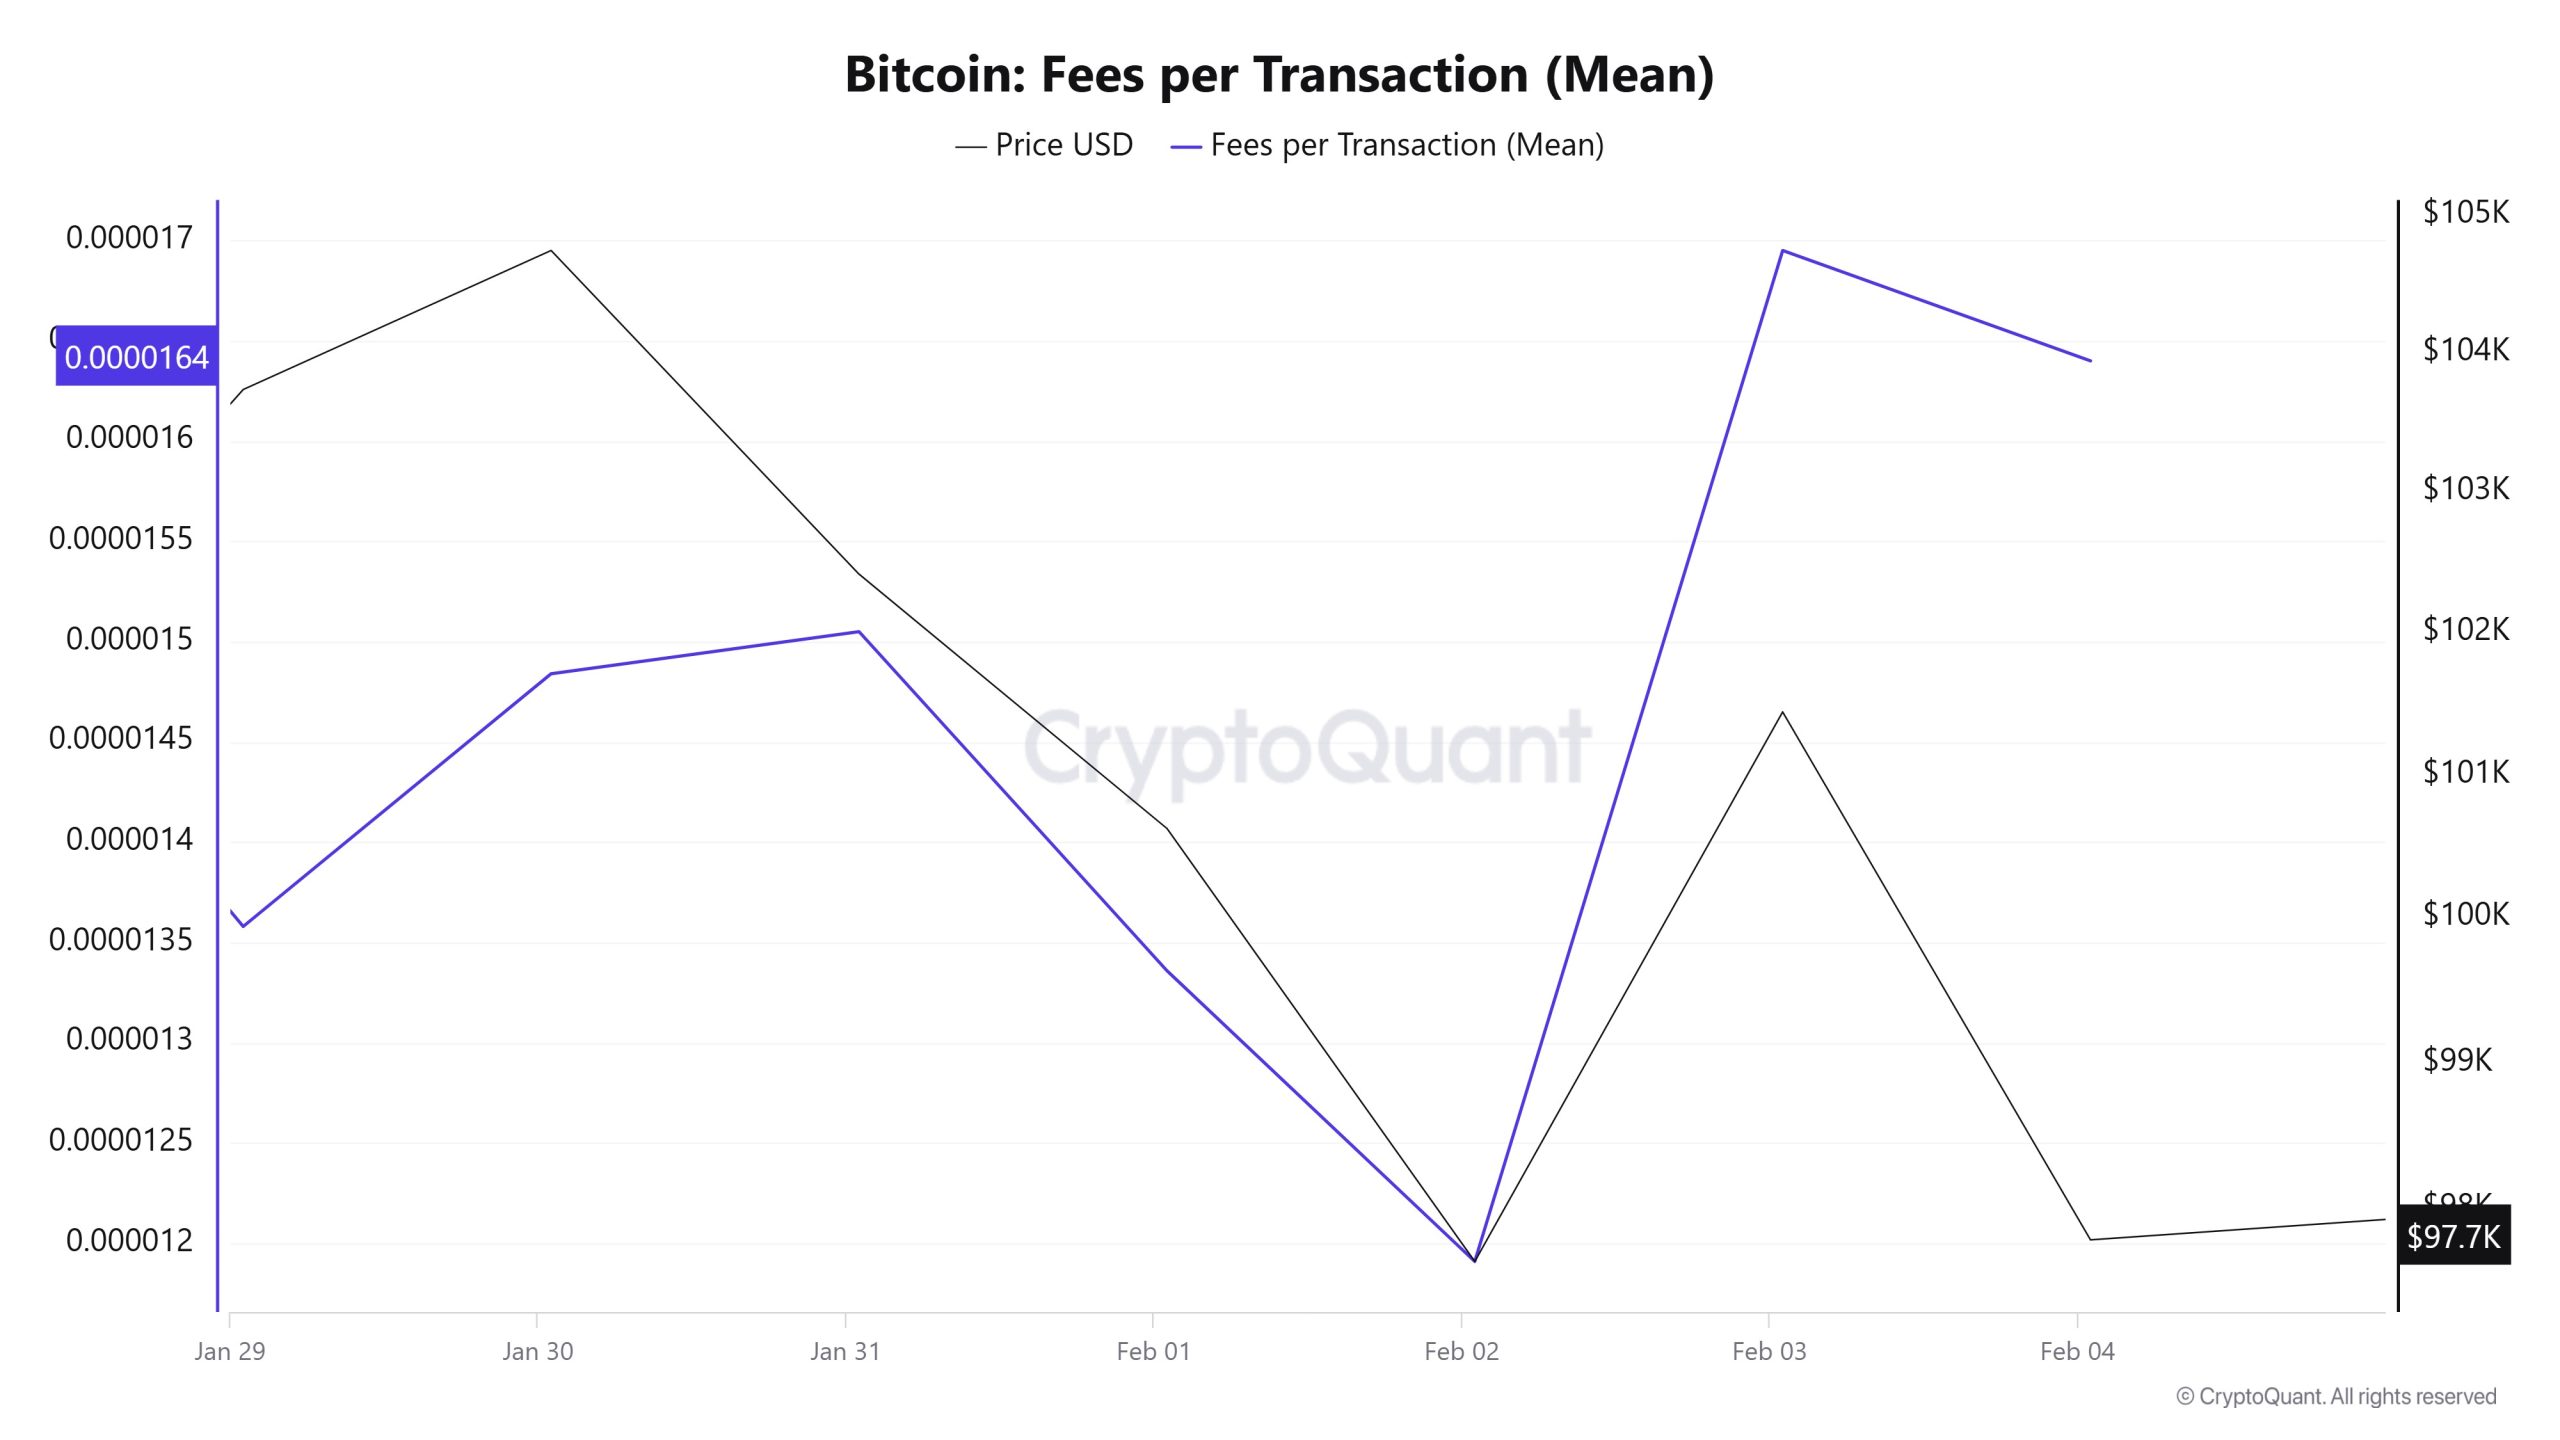
Between January 29 and February 04, when Bitcoin Fees per Transaction (Mean) data is analyzed, it is seen that this value was at 0.00001358 on January 29, the first day of the week. Until February 02, the Fees per Transaction (Mean) value, which followed a similar course with the Bitcoin price, decreased to 0.00001191 on February 02, reaching the lowest value of the week.
Since then, an upward trend has been observed with increasing high volatility and reached its highest value of the week on February 03, reaching 0.00001695. In the following days, Fees per Transaction (Mean) remained stable in line with the relatively low volatility in Bitcoin price.
Accordingly, on February 04, the last day of the weekly period, Fees per Transaction (Mean) closed at 0.0000164.
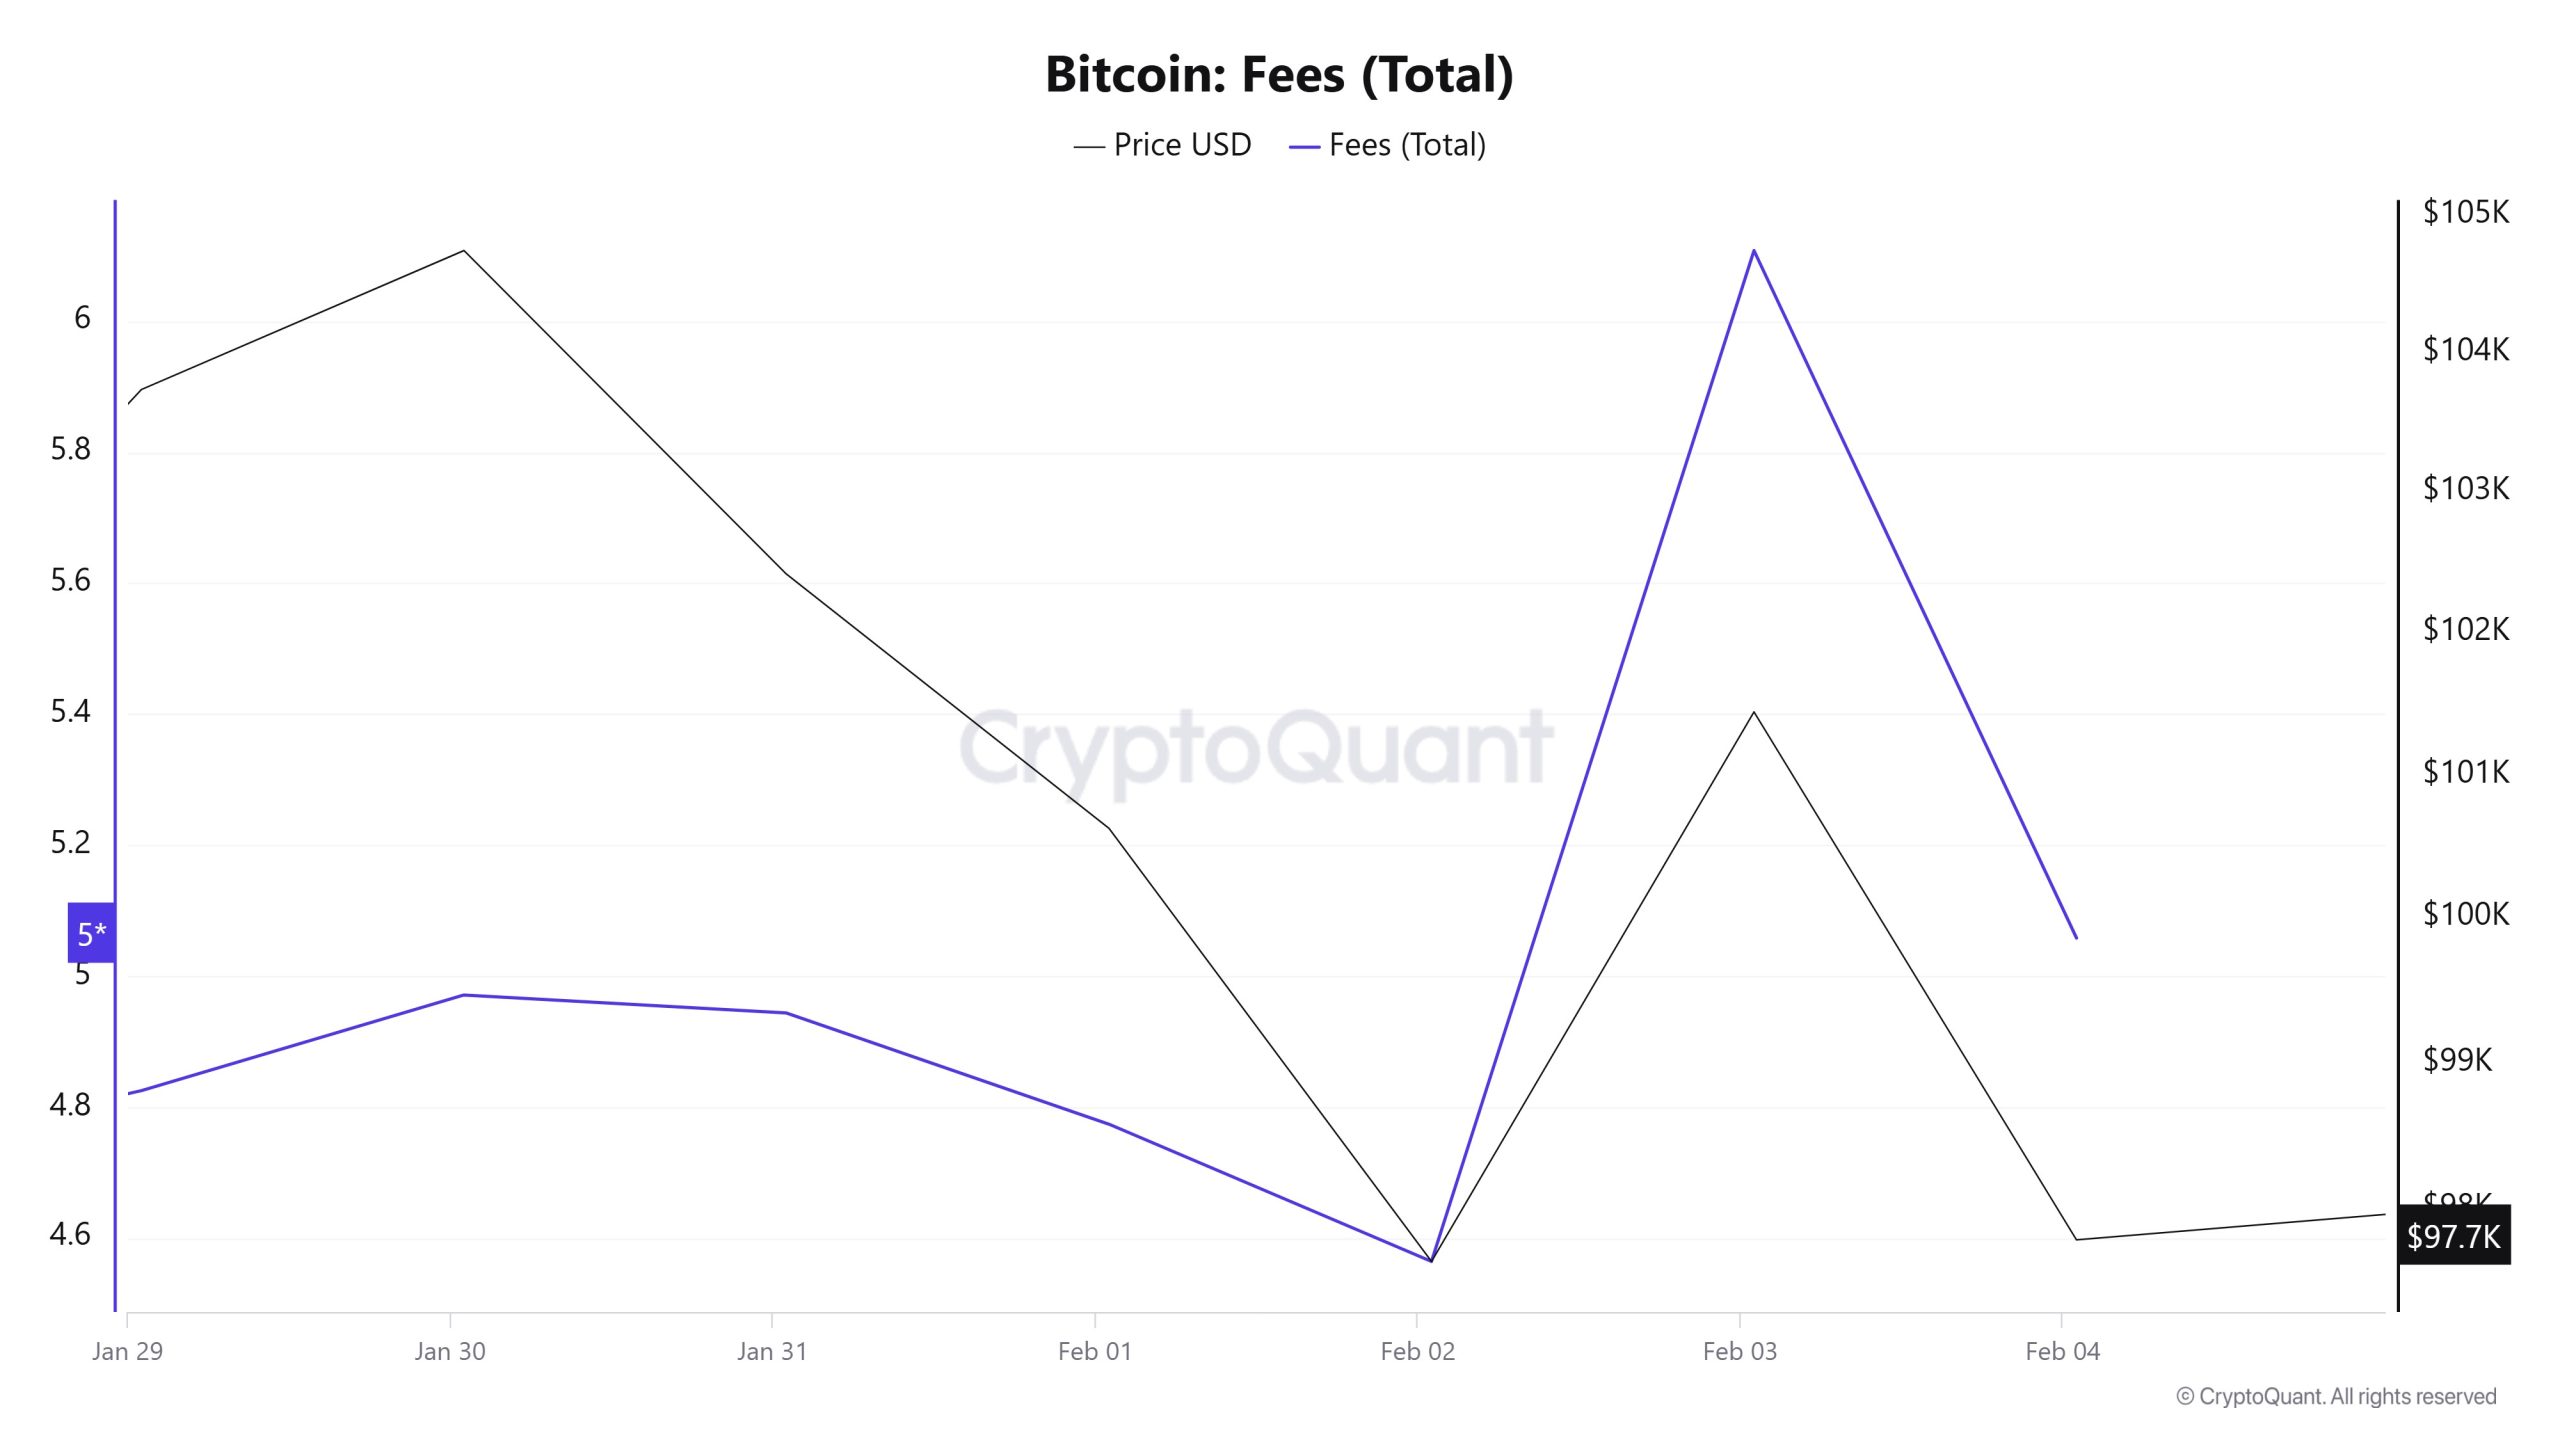
Between January 29 and February 04, when Bitcoin Fees (Total) data is analyzed, it is observed that the Bitcoin Fees (Total) value, which was at 4.82486544 on January 29, the first day of the week, showed a gradual decrease until February 02 and reached the lowest value of the week by decreasing to 4.56401992 on this date.
However, as of February 02, Bitcoin Fees (Total) value started to rise due to the increased volatility in Bitcoin price and reached 6.10799185 on February 03, recording the highest value of the week.
On February 04, the last day of the weekly period, Bitcoin Fees (Total) closed at 5.05799066.
Miner Flows
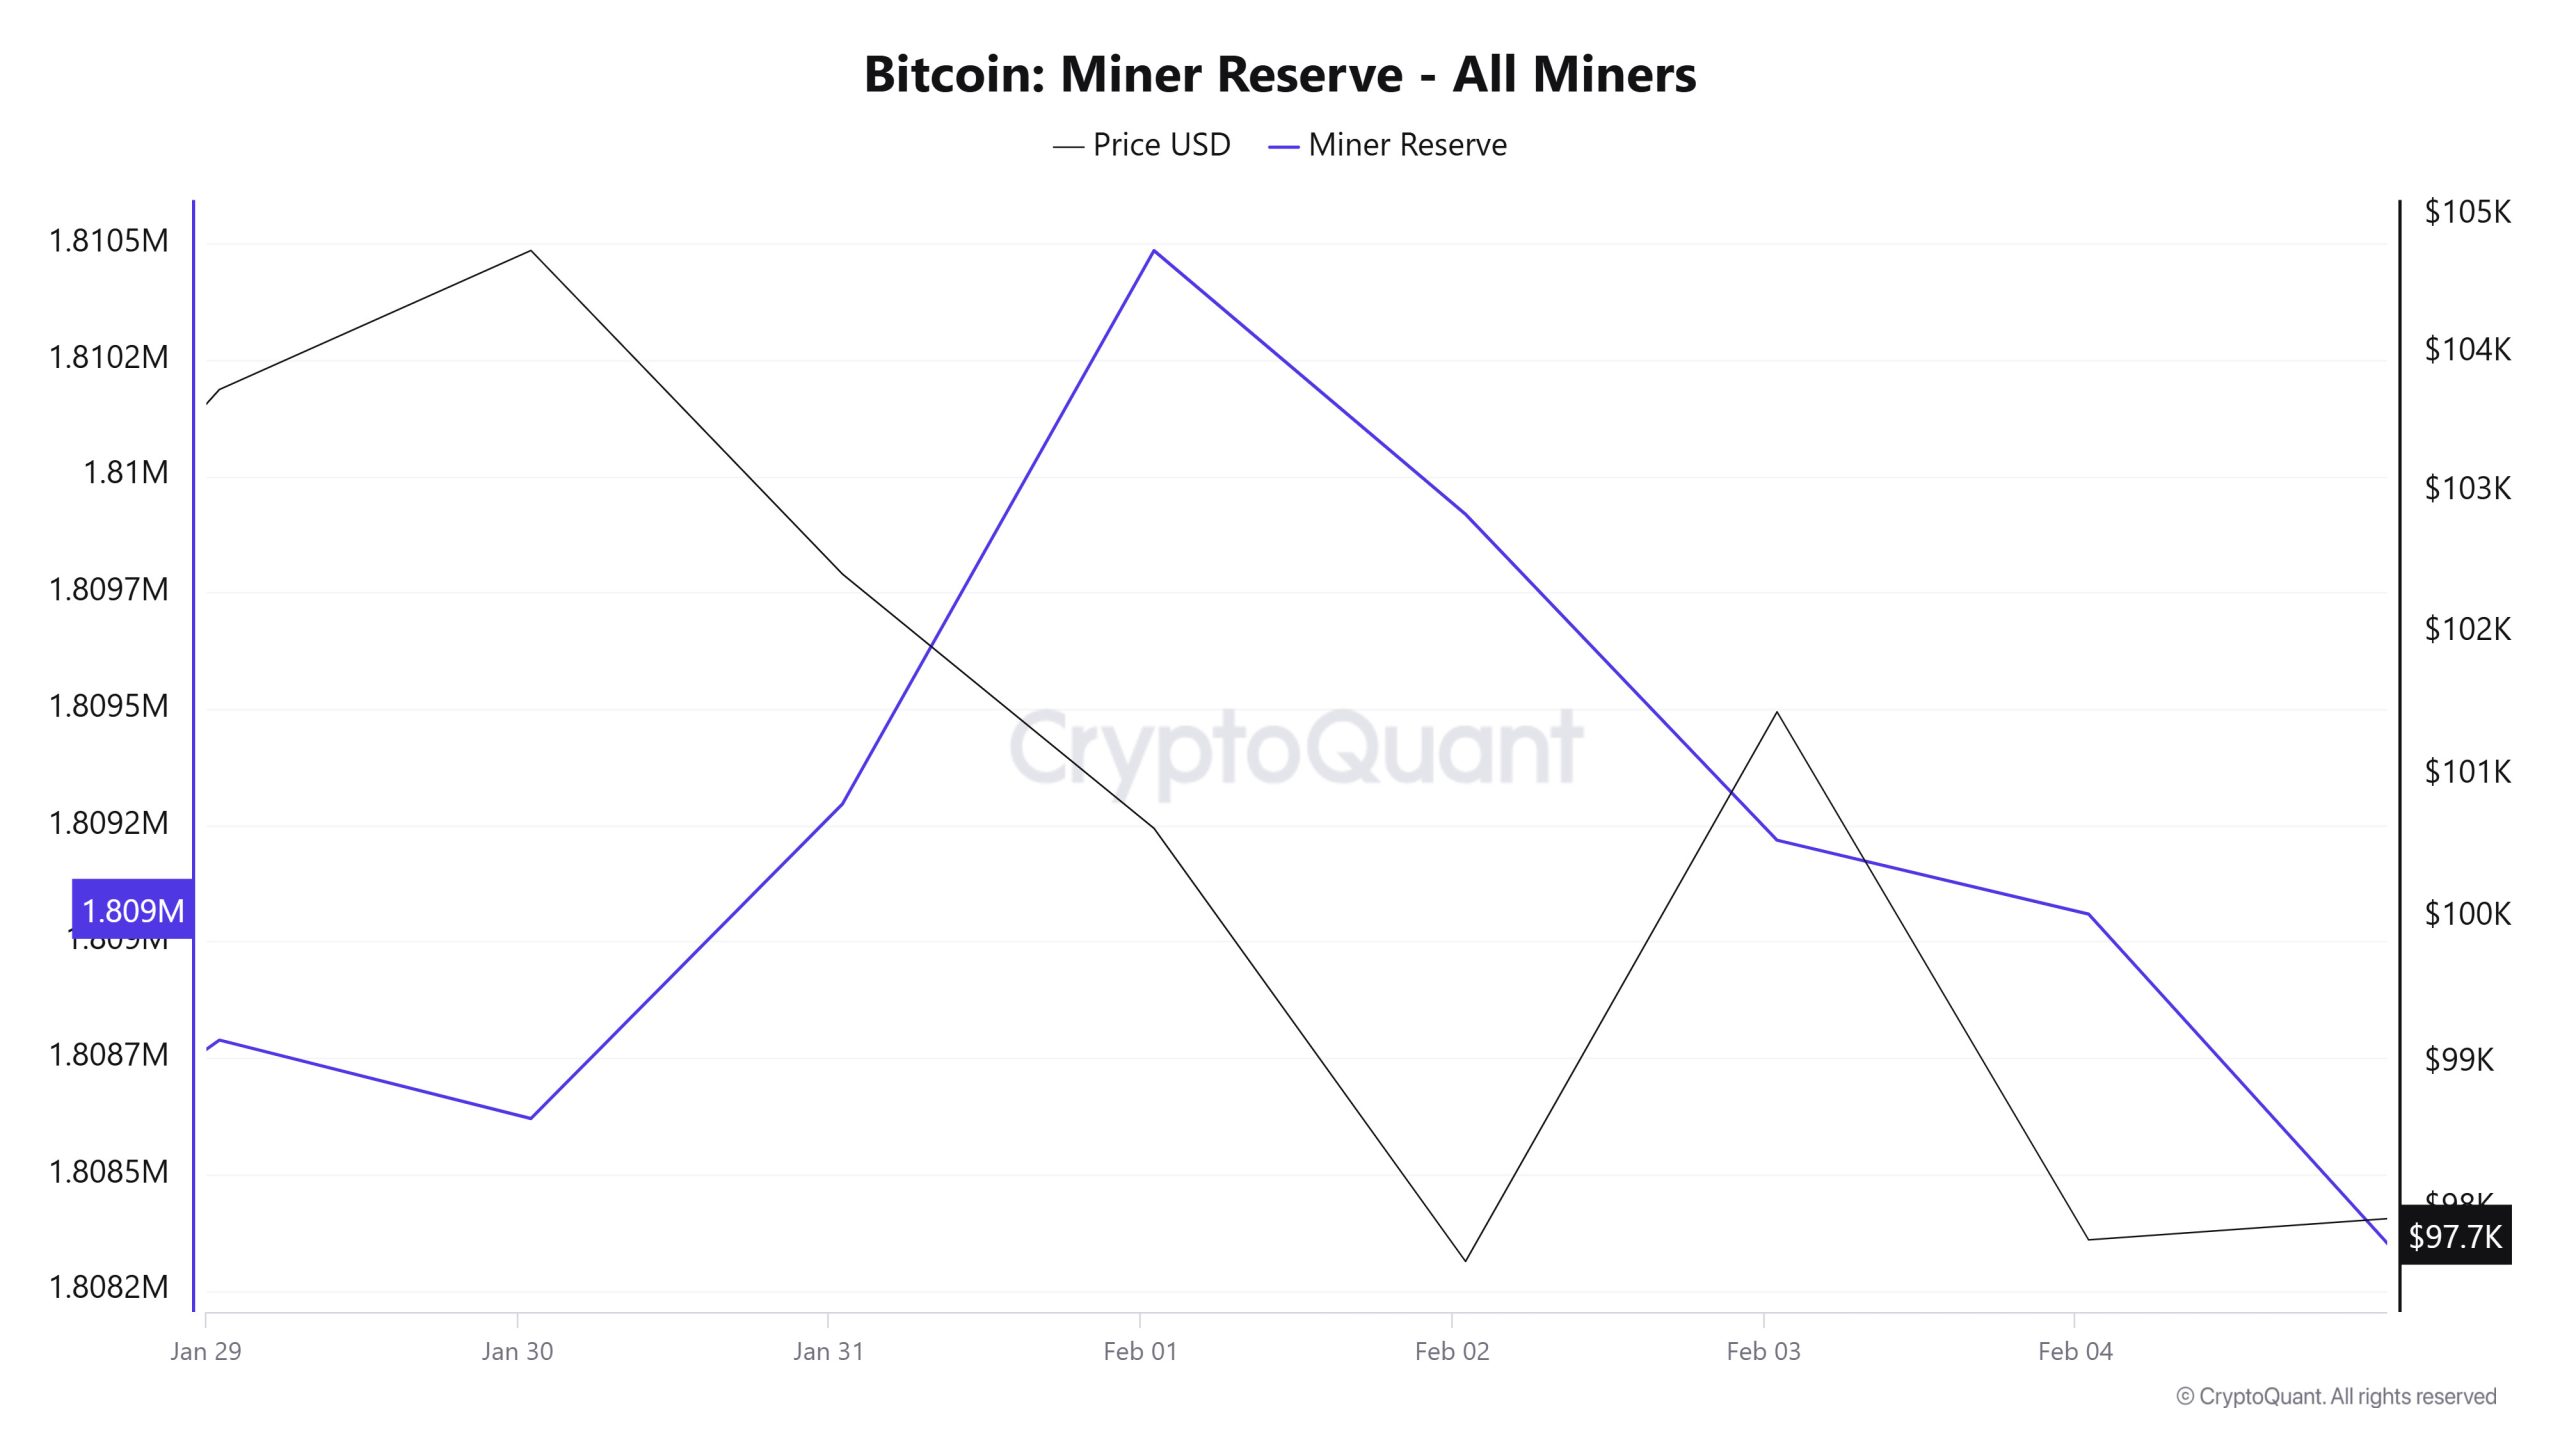
As can be seen in the Miner Reserve table, the number of Bitcoins in miners’ wallets increased this week. Although Miner Reserve and Bitcoin price seemed to have a negative correlation during this week, by the end of the week, the correlation between Miner Reserve and Bitcoin price turned positive.
Miner Inflow, Outflow and Netflow
Between January 29 and February 4, 55,015 Bitcoins exited miners’ wallets and 55,761 Bitcoins entered miners’ wallets between the same dates. The Miner Netflow for this week was 746 Bitcoin. Meanwhile, the Bitcoin price was $103,737 on January 29 and $97,788 on February 4.
For the week, the net flow (Miner Netflow) was positive as Bitcoin inflow into miner wallets (Miner Inflow) was higher than Bitcoin outflow from miner wallets (Miner Outflow).
| Date | Miner Inflow | Miner Outflow | Miner Netflow |
|---|---|---|---|
| January 29 | 6,412.20 | 5,936.70 | 475.50 |
| January 30 | 6,828.40 | 6,996.97 | -168.57 |
| January 31 | 7,781.00 | 7,105.25 | 675.76 |
| February 1 | 3,932.12 | 2,743.14 | 1,188.98 |
| February 2 | 7,110.68 | 7,677.14 | -566.46 |
| February 3 | 15,673.33 | 16,373.75 | -700.42 |
| February 4 | 8,023.68 | 8,182.16 | -158.48 |
Transaction
Transaction Count
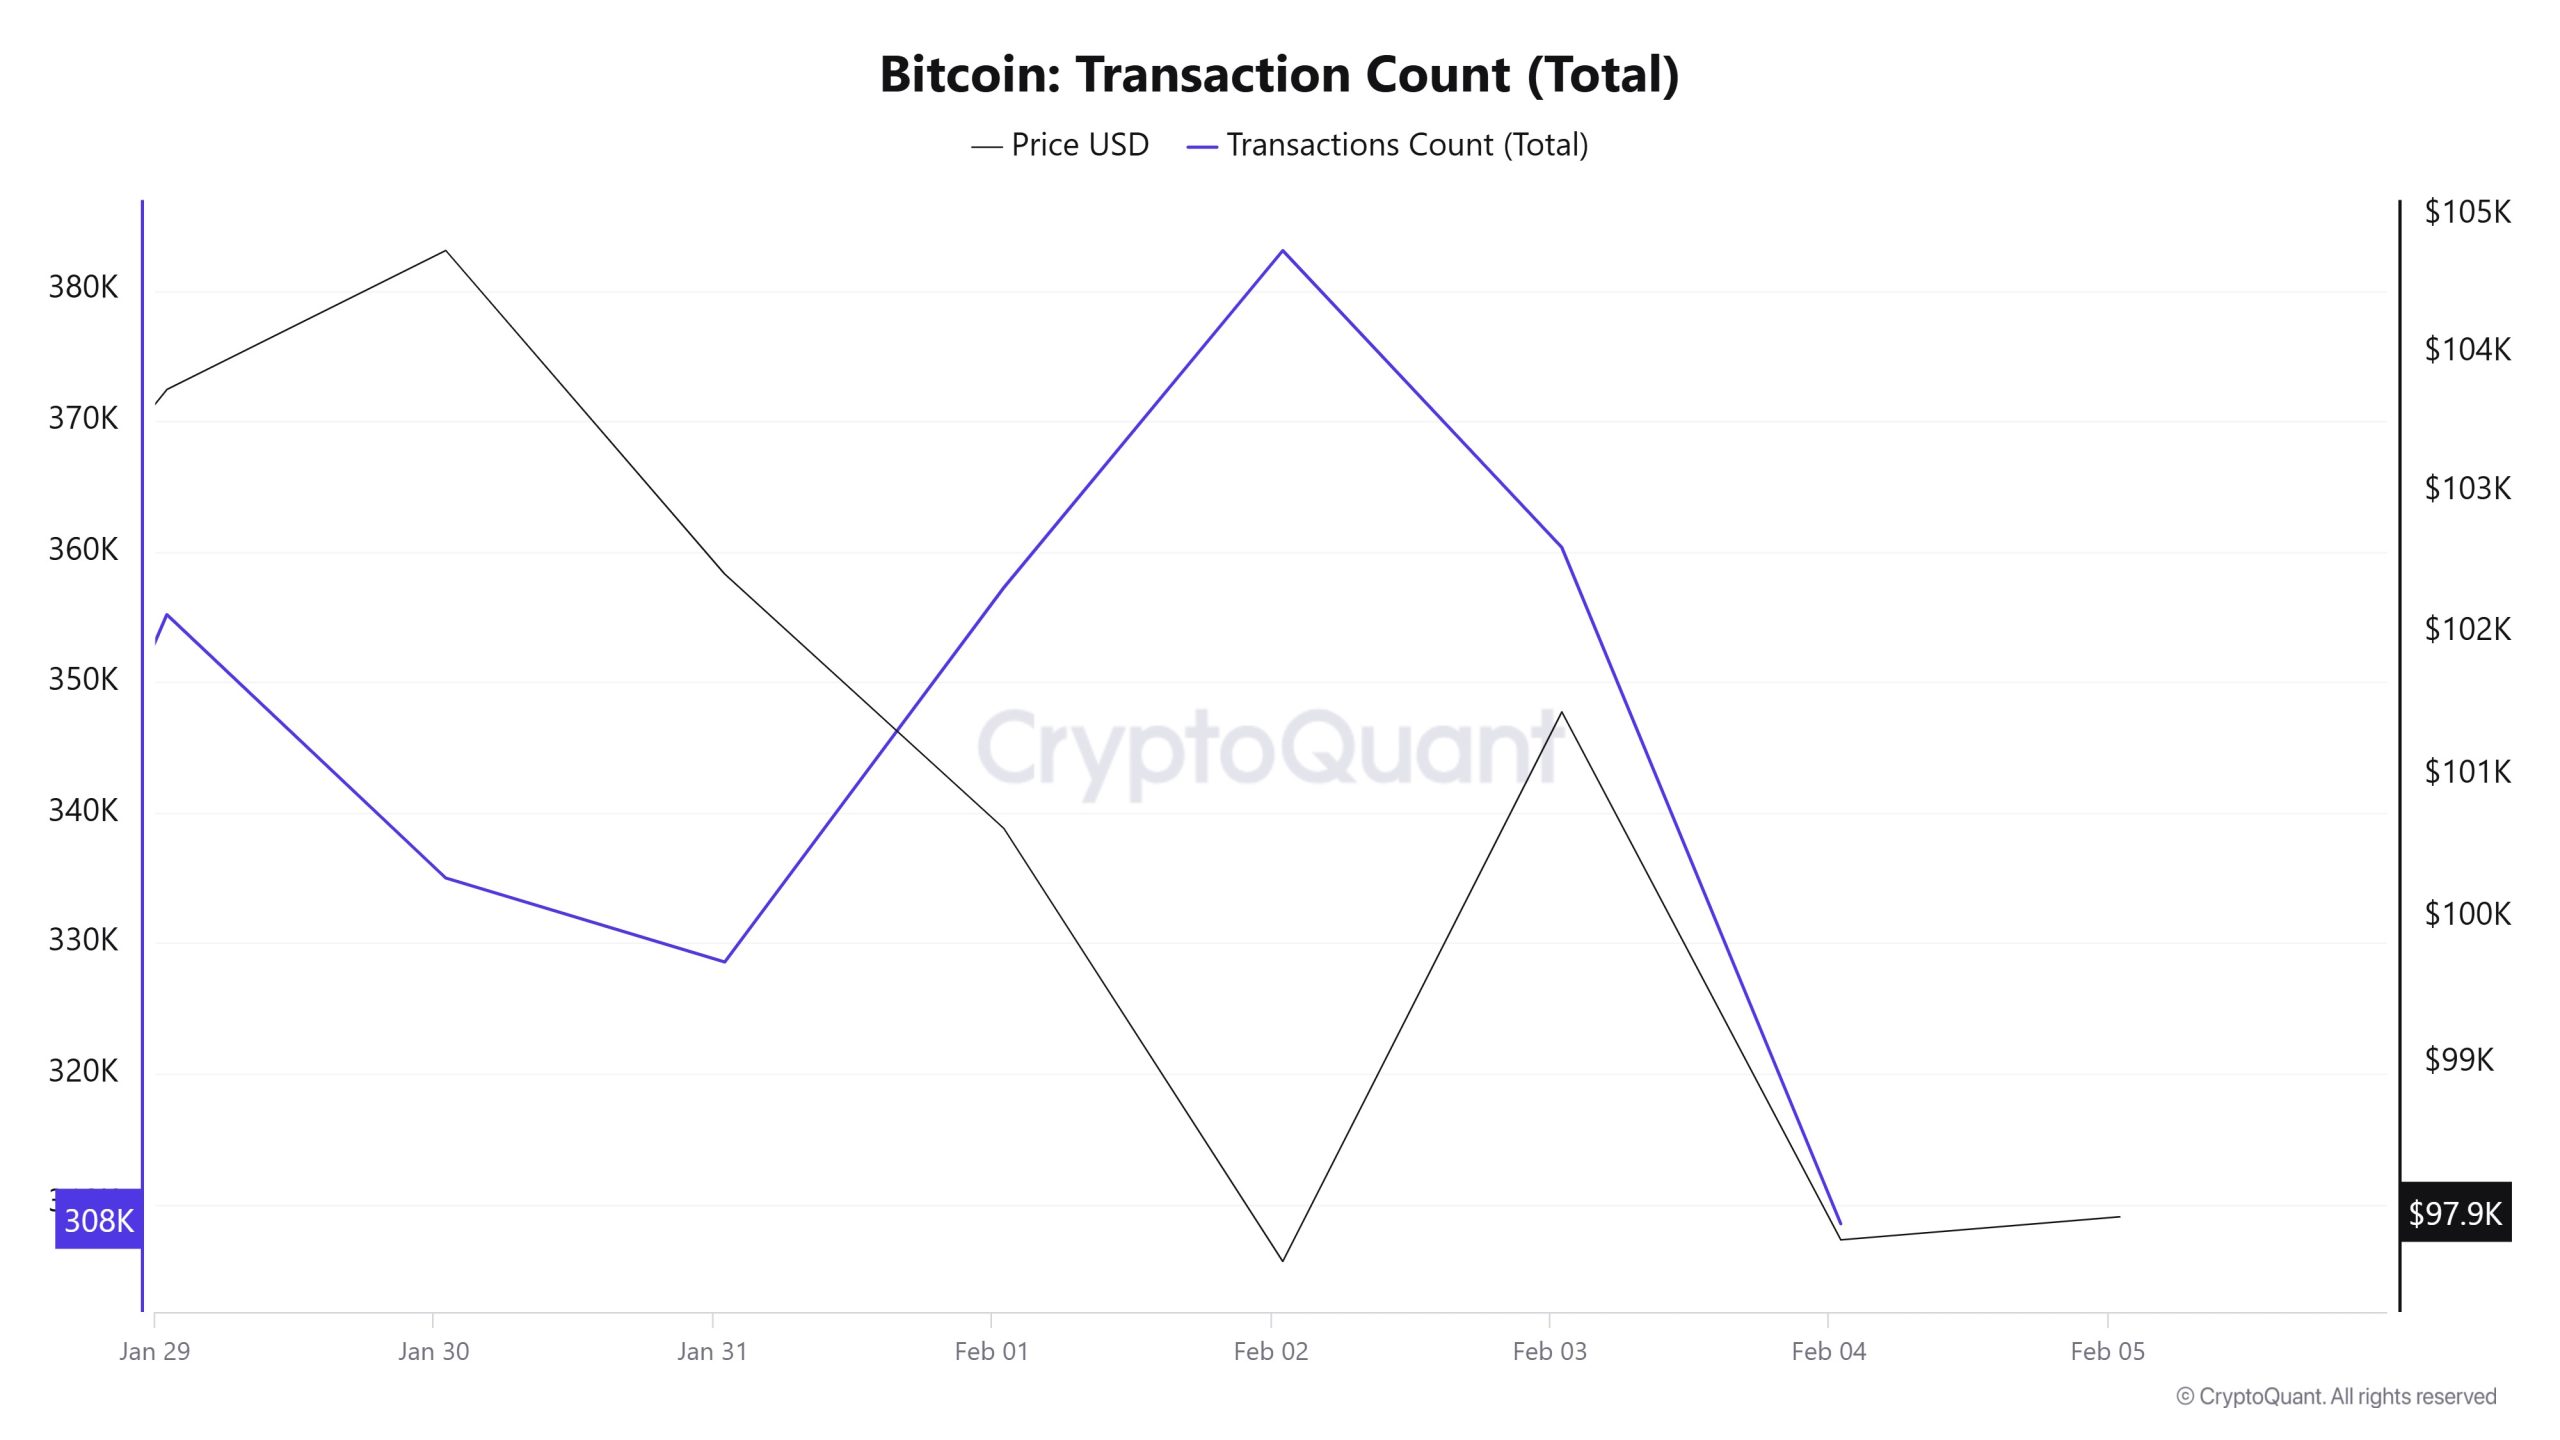
A total of 2,427,886 transactions took place between January 29 and February 4, an increase of 0.62% compared to the previous week (January 22-28). It is noteworthy that the lowest volume of transactions on the network occurred on Tuesday, February 4. This indicates a different trend from the trading dips usually observed on weekends. The highest number of transactions for the week was 383,087 on February 2, which interestingly coincided with the highest trading volume on a Sunday on a weekend. The main point is that although the Bitcoin price has had a very volatile week, there has been no extraordinary change in the weekly average number of trades compared to the previous week.
Tokens Transferred
Between January 29 and February 4, the amount of Bitcoin transferred was 4,568,006 BTC, an increase of 3.51% compared to the previous week (January 22-28). As in previous periods, it was observed that the amount of Bitcoin transferred on Saturdays and Sundays was at the lowest levels. However, it is noteworthy that the lowest amounts of Bitcoin transferred and the highest number of transactions occurred on the same days. This suggests that despite the high number of transactions, the total amount of Bitcoin transferred remained low. This points to a market movement that is dominated by smaller-scale transfers.
Whale Activities
CryptoQuant revealed the increased activity of new Bitcoin whales or STH in an X post on the Bitcoin Whale outlook. CryptoQuant published a chart showing that these new whales have grown significantly and have reached 60% of the total realized capitalization of major players. The published chart shows a sharp increase in the proportion of new whales. These investors entered the active growth phase when the BTC price touched $55,000. Their market share increased from 43% to 60% of the total realized capitalization of the major players. “This is a perfect example of the contrasting behavior between whales and retail traders, and following whales rather than retail investors is generally considered a better choice,” said CryptoQuant’s Darkfost. During the market declines after the middle of the last 7-day period, Bitcoin whales continued to make their moves in the middle of this market trend. BTC daily transactions are still above 380k in 24 hours, albeit near the lowest range in the last 12 months. Over time, BTC daily transfer volumes have fallen below $1 billion per day, despite occasional whale transactions. On the other hand, according to Glassnode, addresses holding more than 1,000 BTC increased their holdings by about 5% in the last 24 hours. In one notable transaction, 1,137 BTC (worth about 119.7 million $ ) was transferred to Cumberland, a major trading firm. This is a sign that institutional players are stepping in.
Whales Data
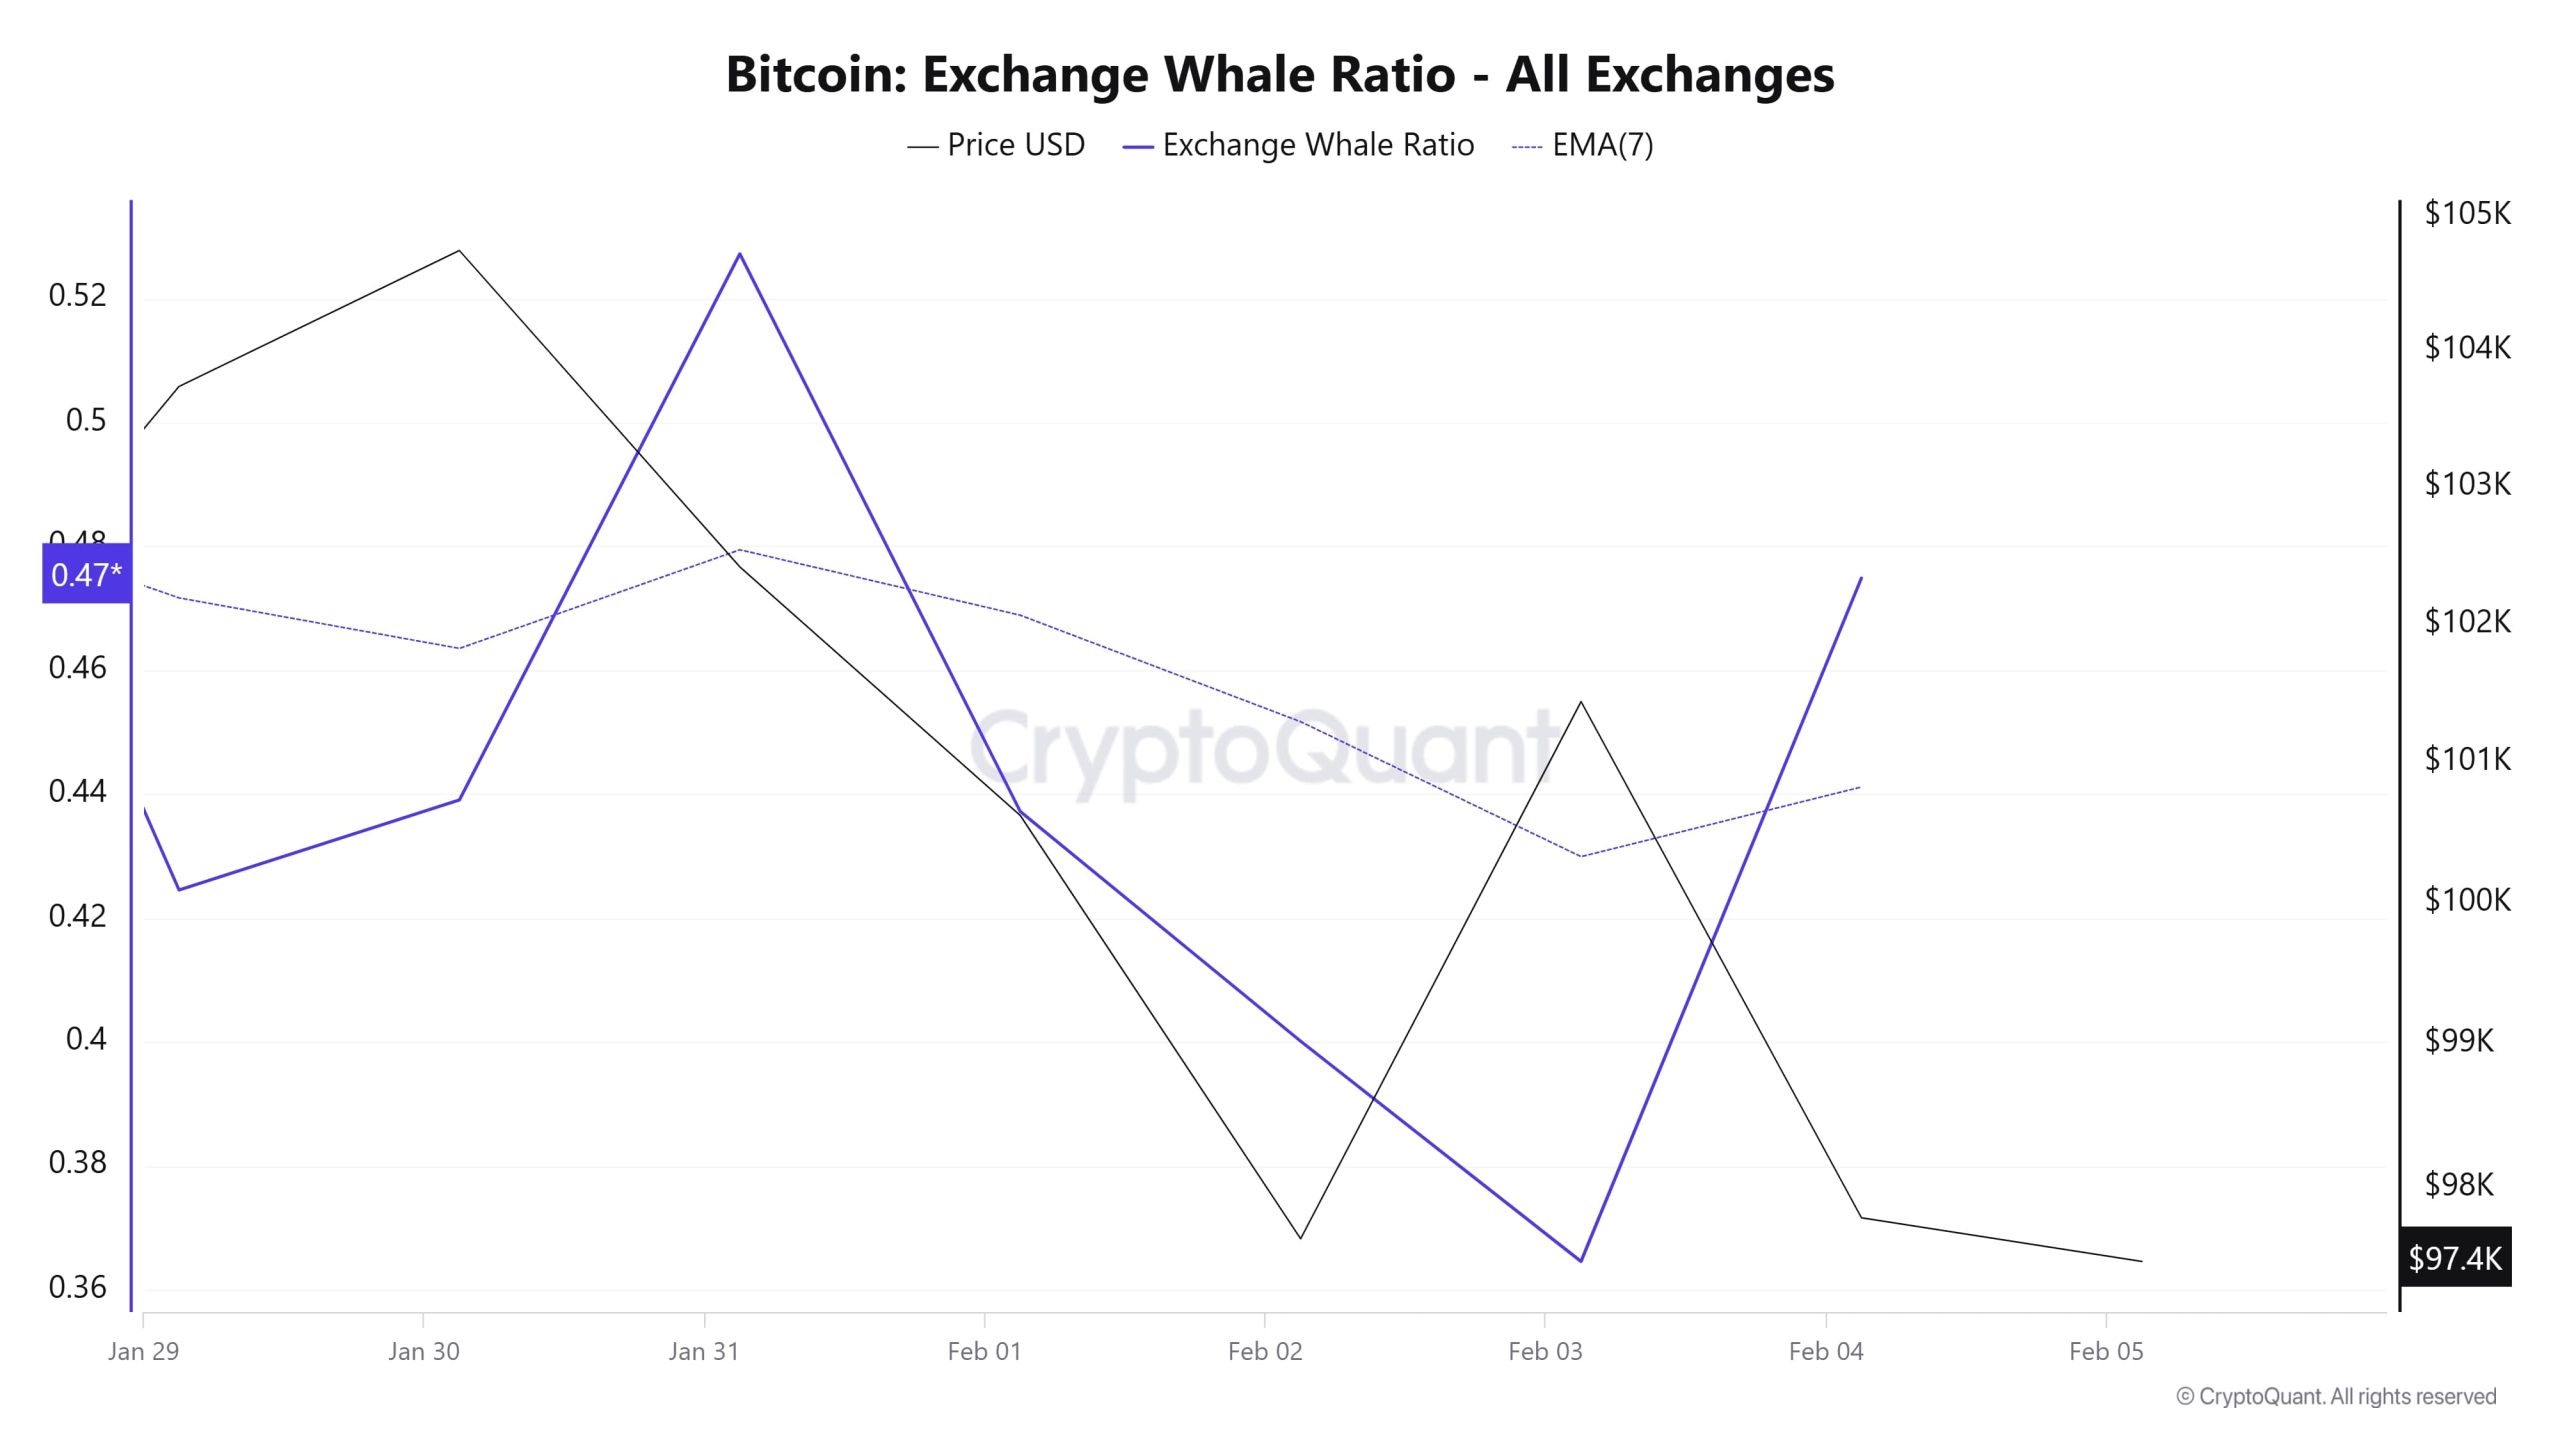
According to the remarkable data in the cryptocurrency market in the last 7 days, whale activity on the central exchange has reached high levels. When we look at the last 7-day whale movements, the use of central exchanges by whales varies. When we look at the Exchange Whale Ratio metric, it showed that at the beginning of the 7-day period, whales did not use central exchanges very often compared to the past, and the value was measured as 0.42. This measurement reached 0.52 in the middle of the process, showing us that whales started to use the central exchange very intensively. At the time of writing, the value is 0.47. When this ratio is above 0.350, it usually means that whales use centralized exchanges frequently. At the same time, the total BTC transfer was in line with last week, with 4,568,006 BTC moving.
LEGAL NOTICE
The investment information, comments and recommendations contained in this document do not constitute investment advisory services. Investment advisory services are provided by authorized institutions on a personal basis, taking into account the risk and return preferences of individuals. The comments and recommendations contained in this document are of a general type. These recommendations may not be suitable for your financial situation and risk and return preferences. Therefore, making an investment decision based solely on the information contained in this document may not result in results that are in line with your expectations.
NOTE: All data used in Bitcoin onchain analysis is based on Cryptoqaunt.
