
Technical Analysis
BTC/USDT
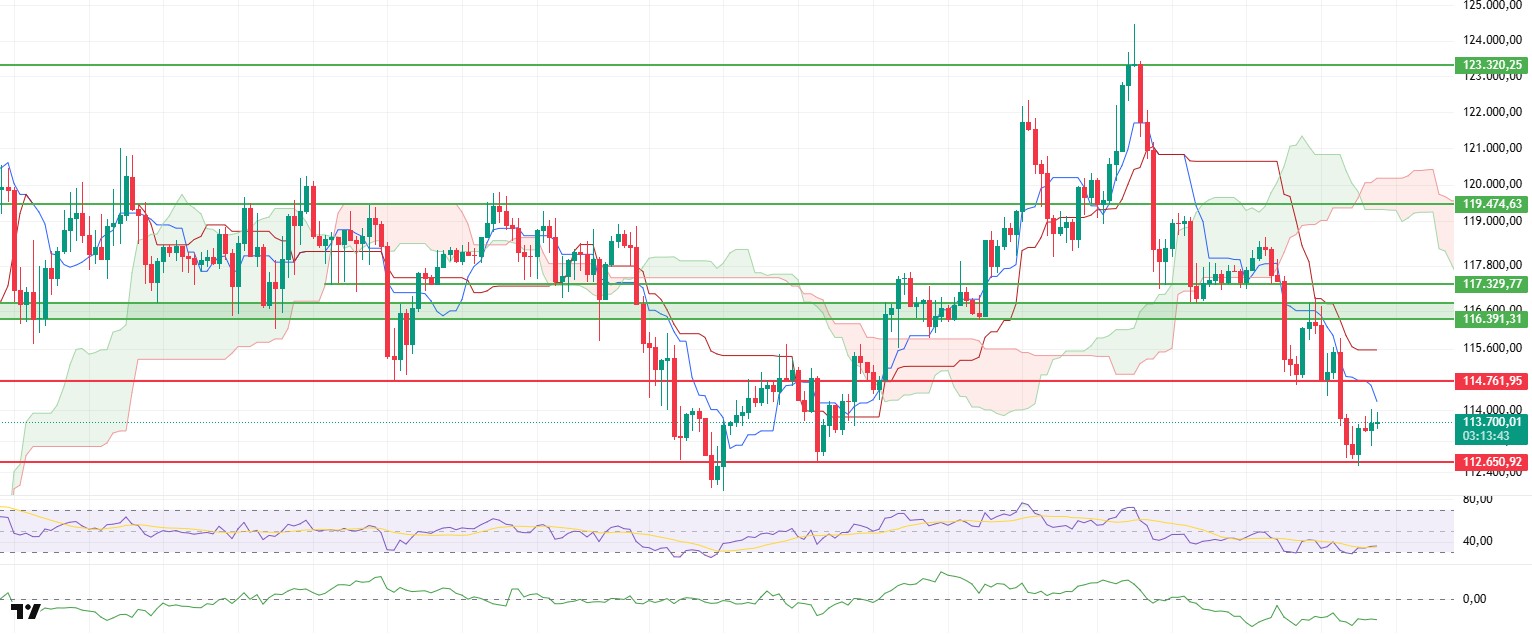
While the Bitcoin price remained flat within the range of $113,000 to $114,000 during the day, it attracted attention por being stuck en a narrow band. However, technical and el-chain data pointed to continued weakness en the market. Notably, open interest dropped to 37.87 billion dollars. This decline suggests that a significant number of long positions have been closed en recent days, indicating a substantial reduction en leverage appetite en the market. Meanwhile, the rise en the funding rate indicates that open positions are heavily weighted toward longs, suggesting that traders are maintaining their short-term bullish expectations. This dual scenario creates fragility en prices because the concentration of long positions en the futures market cannot sustain gains without sufficient support from the spot market.
The Chaikin Money Flow (CMF) indicator remaining flat en negative territory confirms this weakness. The absence of liquidity inflows from the spot market indicates that investors are avoiding risk and are not strongly accompanying any potential upward movements. As a result, the price faces selling pressure shortly after every upward attempt.
The Ichimoku indicator shows a pretty clear picture. The price is still below the kumo cloud, and the downward expansion of the cloud is making the overall negative outlook even stronger. The fact that the Tenkan and Kijun levels haven’t been consistently above the cloud means that any short-term recoveries will be limited. The fact that the Chikou span is moving below the price also indicates that the market remains weak en terms of delayed confirmation.
On the momentum side, the Relative Strength Index (RSI) is providing an important signal. Although the RSI has shown a slight recovery following its reaction from the oversold zone, it remains below the 50 threshold level. This confirms that the price is experiencing a short-term pause rather than a directional change and has not yet built up the necessary momentum for a strong trend reversal. Therefore, it can be said that the price remains more exposed to downside risks within the current consolidation.
As a result, unless there is a sustained move above the $114,761 level, the price is likely to retest the $112,650 support level. If there are closes below this level, the selling wave could deepen and a stronger downtrend could form. On the other hand, if there is a breakout above $114,761 with high volume, the negative outlook could come to an end, and the market could gain new upward momentum. However, for this scenario to be confirmed, both open interest must increase again and the CMF must recover and move toward the positive zone.
Support levels: 114,761 – 112,650 – 110,936
Resistance levels: 117,329 – 119,474 – 123,320
ETH/USDT
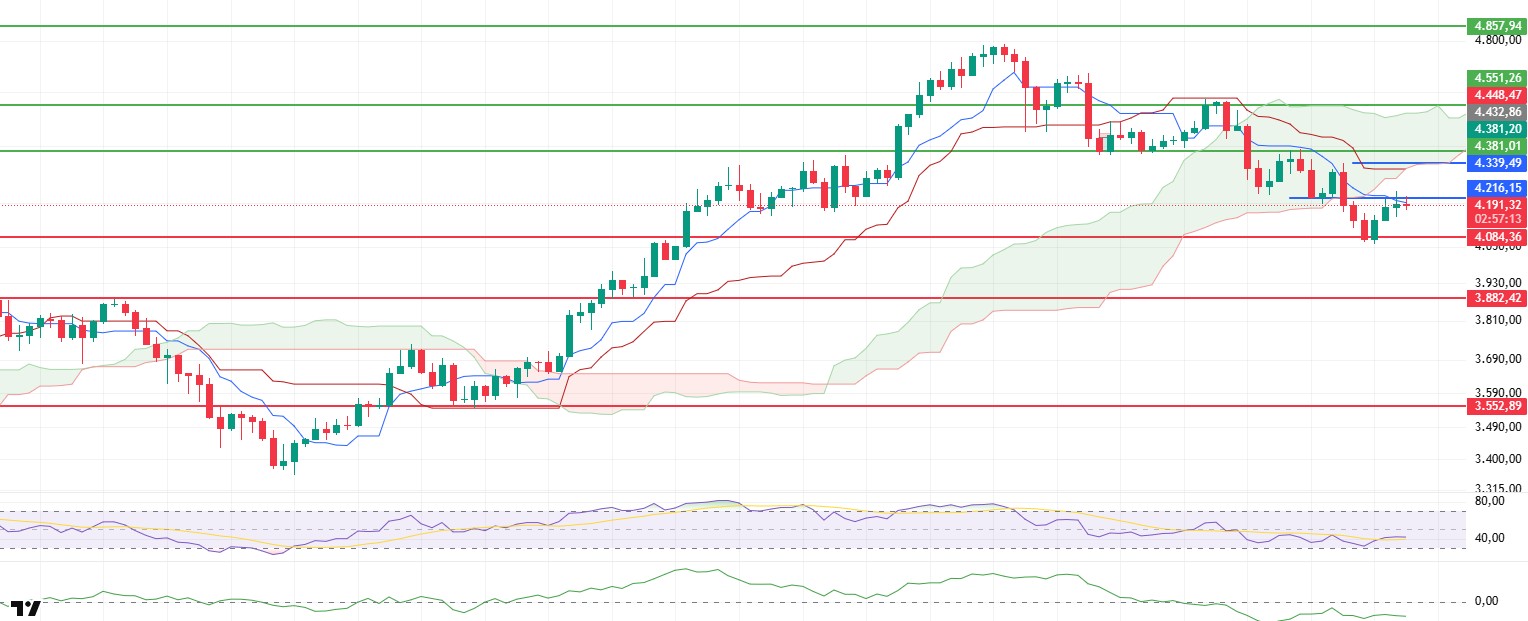
On the Ethereum side, purchases from the futures market stood out during the day. With the support of these purchases, the price managed to rise to the critical support level of $4,216. However, technical indicators and el-chain data show that this movement is unhealthy and unlikely to last. When examining the Cumulative Volume Delta (CVD), it is evident that purchases en the spot market were significantly limited compared to those en the futures market. The increase en the funding rate throughout the day highlights the dominance of long-side transactions. This scenario indicates that as prices rise, carrying costs increase and spot flows do not accompany this movement, leading to fragile gains.
The Chaikin Money Flow (CMF) indicator’s horizontal movement en the negative zone also confirms this fragility. Rises that occur without liquidity inflows from the spot side are generally not sustainable and often lead to profit-taking en the short term. While the Ichimoku indicator shows that the price has regained the Tenkan level, supporting the short-term outlook, the fact that the price remains below the Kumo cloud clearly indicates that the overall structure remains negative. Additionally, the cloud’s continued downward trend confirms the current downtrend from a technical perspective. Without a sustained move above the Kijun level and the Chikou Span crossing above the price, it is difficult to discuss a trend reversal at this point.
If the price fails to break through the lower band of the cloud at $4,339 en the evening horas, the downward movement is likely to continue. In such a scenario, the price is expected to retreat back to the $4.084 level. In particular, if the funding rate remains high and there is no sustained increase en open interest, long positions may be squeezed, creating additional selling pressure el the price. For a positive scenario, the price needs to break above the 4,339 dollar level with significant volume. If the price sustains above this level, it could initiate a new upward trend en the short term.
Support levels: 4,084 – 3,882 – 3,552
Resistance levels: 4,286 – 4,381 – 4,551
XRP/USDT
The highlight of the evening was news that 200 million XRP had been transferred el the XRP Ledger, indicating an acceleration en the use of On-Demand Liquidity por institutional investors. The transaction was reported to be worth approximately $601 million, and market observers interpreted this move as a sign of increased institutional liquidity demand.
The segundo dimension of the news was Ripple CEO Brad Garlinghouse’s reference to ongoing discussions with major platforms about corporate payment integrations, which reignited speculation en the community about potential adoption scenarios for companies like Amazon and Uber. This headline does not yet constitute an official partnership announcement, but it has strengthened expectations that XRP could play a role as a bridge asset en the quest for efficiency el the payment side por high-scale players.
On the el-chain data side, multiple sources confirmed a transfer of 200 million XRP during the day. The timing and size of the transaction provide additional evidence that the liquidity dynamics around the $3 threshold en recent days have been fueled por institutional activity. The key takeaway for the evening is that the narrative of institutional adoption is gaining traction through ODL, and the possibility of large-scale corporate integrations is beginning to be priced en again.
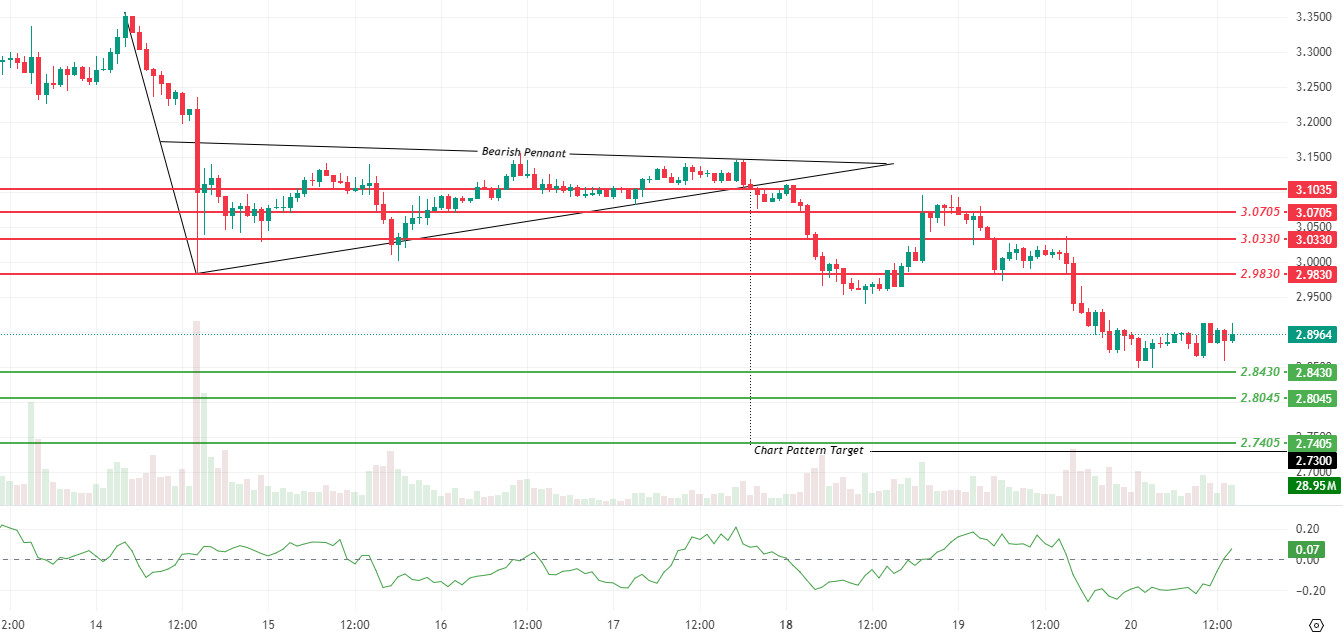
On the technical side, after the sharp sell-off following the Bearish Pennant breakout, the price is continuing to seek horizontal equilibrium around $2.89, supported por the $2.8430 level. The first significant resistance level is at $2.9830. If hourly closes above this level occur, the likelihood of a broader upward move toward the 3.0330 and 3.0705 dollar range increases. Conversely, a sustained move below 2.9830 dollar would weaken upward attempts and raise the risk of a retest of the 2.8430 dollar support level. If a break below $2.8430 is seen, the $2.8045 and $2.7405 levels, which are the measured targets of the formation, may come into focus. Closures below $2.7405 could deepen selling pressure towards the $2.70 band.
Although trading volume has increased during the decline, it remains relatively weak during the rebound phases. The Chaikin Money Flow (CMF) indicator has risen to 0.07, breaking above the zero line, signaling a limited capital inflow accompanying short-term recovery attempts. If the CMF remains en the positive zone and resistance breaks are supported por volume, upward attempts could gain momentum at . Otherwise, a return to the negative zone would confirm that the price’s downside risk remains intact.
Support levels: 2.9585 – 2.9175 – 2.8430
Resistances: 3.0330 – 3.0705 – 3.1035
SOL/USDT
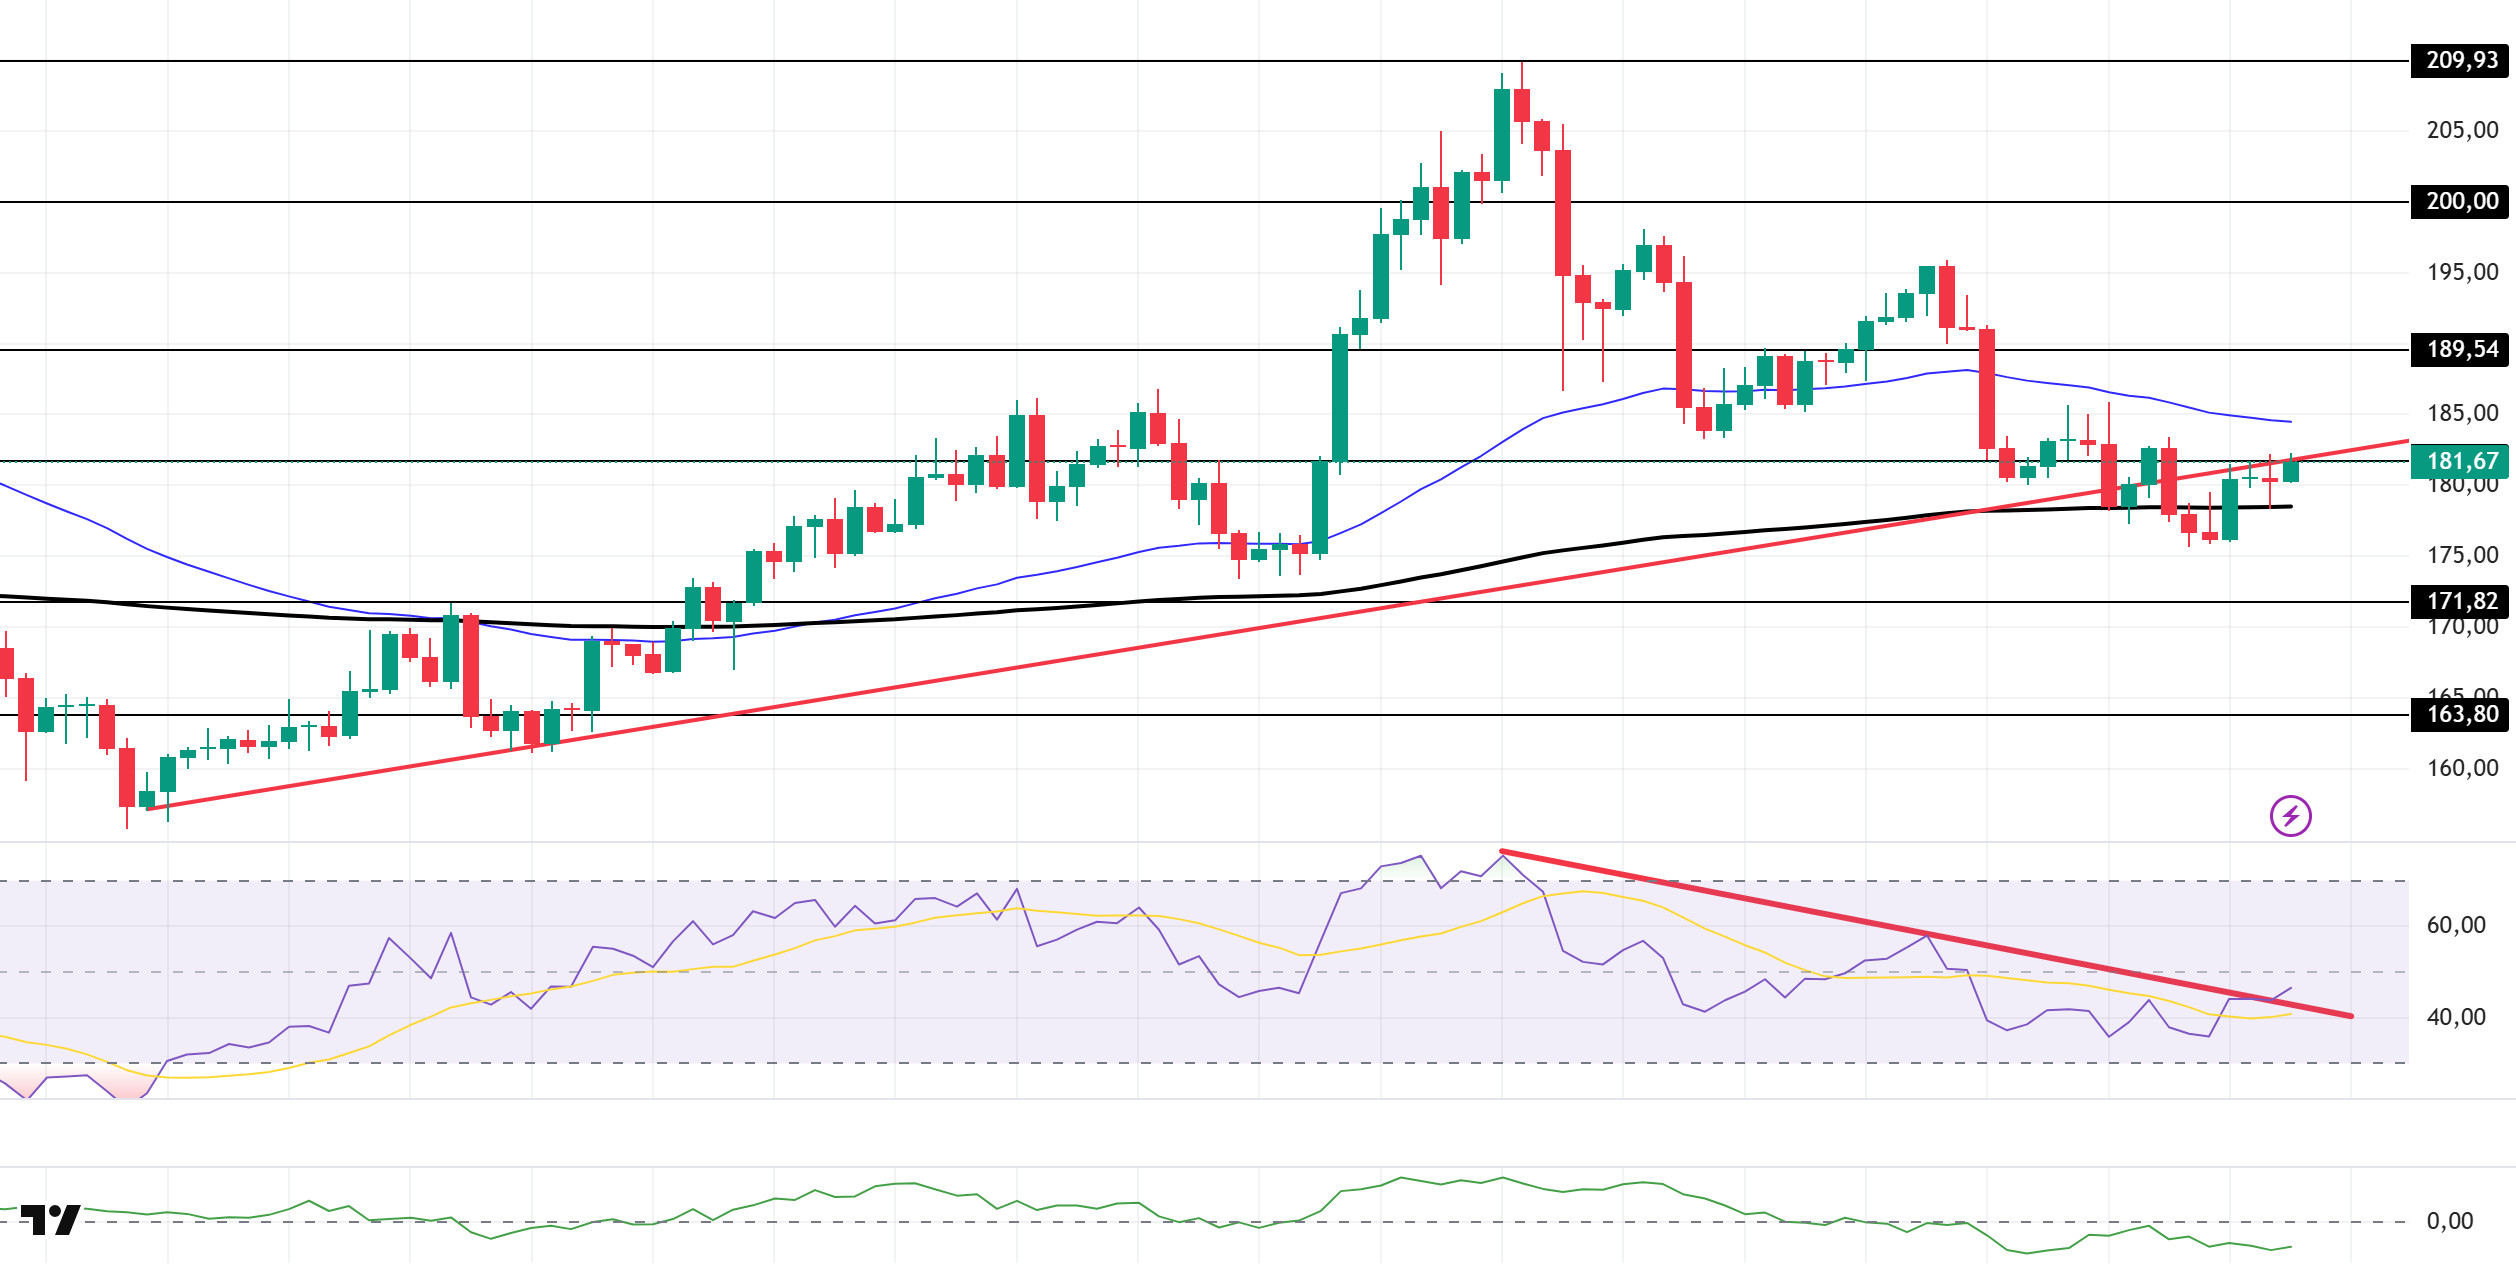
The SOL price continued to trade sideways during the day. The asset remained below the upward trend line that began el August 2. This could increase selling pressure. As of now, it is testing the rising trend line and the 181.75 dollar level as resistance, while the 200 EMA (Black Line) moving average serves as support. A break above the trend line could signal the start of an uptrend. If the downtrend continues, the 171.82 dollar level should be monitored.
On the 4-hora chart, the 50 EMA (Blue Line) remained above the 200 EMA (Black Line). This indicates that the upward trend may continue en the medium term. At the same time, the price being between the two moving averages shows that the market is en a decision phase en the short term. Chaikin Money Flow (CMF-20) remained en negative territory. However, the decrease en money inflows could push CMF deeper into negative territory. The Relative Strength Index (RSI-14) is currently testing the resistance level of the downtrend that began el August 14. If it breaks this level, buying pressure may emerge. In the event of an uptrend driven por positive macroeconomic data or news related to the Solana ecosystem, the $189.54 level emerges as a strong resistance point. If this level is broken upward, the uptrend is expected to continue. In the event of a pullback due to adverse developments or profit-taking, the $171.82 level could be tested. A retreat to these support levels could see an increase en buying momentum, potentially presenting an opportunity for an upward move.
Support levels: 171.82 – 163.80 – 150.67
Resistance levels: 181.75 – 189.54 – 200.00
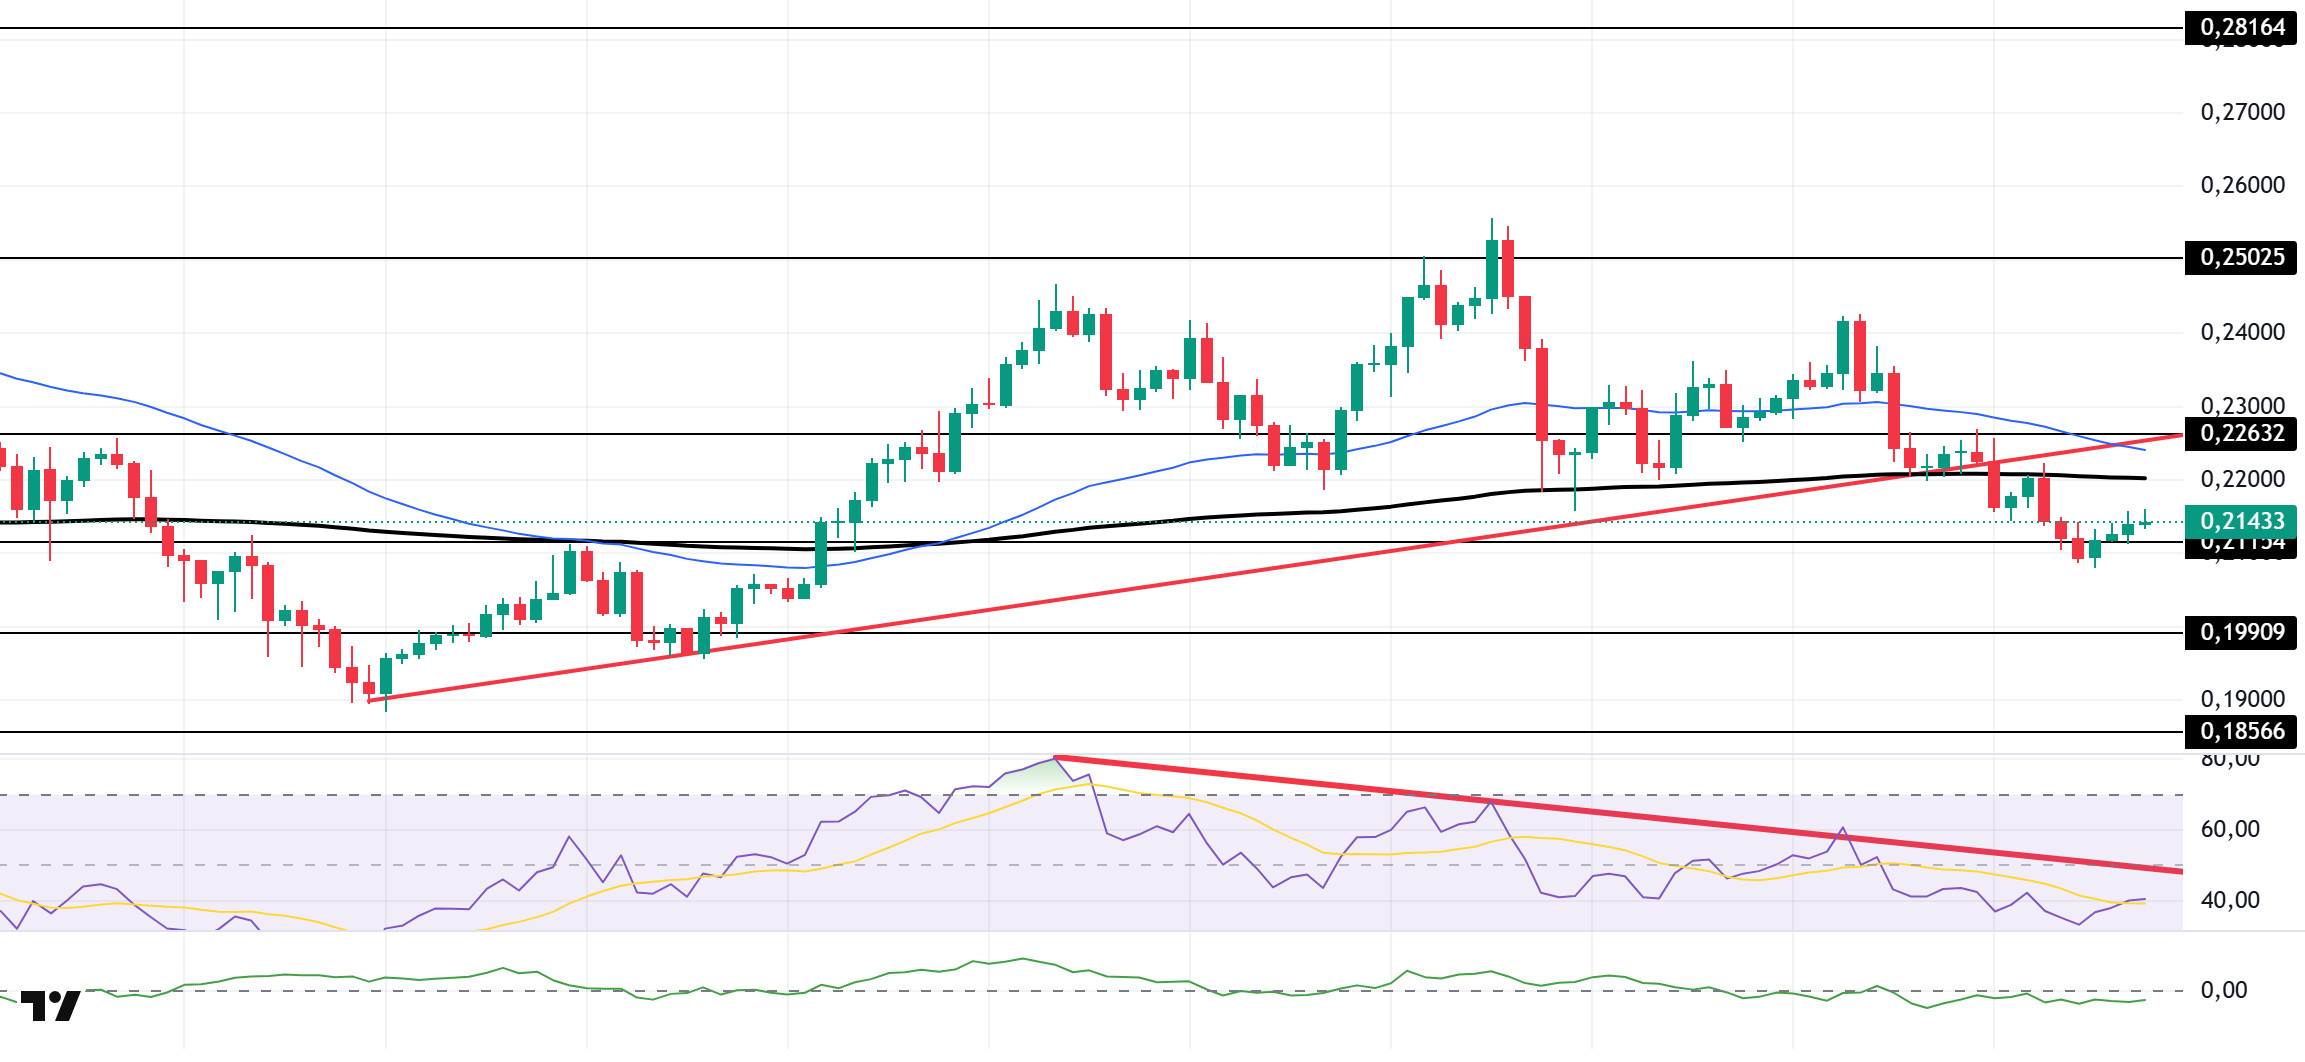
DOGE/USDT
The DOGE price remained flat during the day. The asset continued to trade below the upward trend that began el August 2 and the 200 EMA (Black Line) moving average. These could continue to exert selling pressure. As of now, the price is supported at the 0.21154 dollar level and has shown a slight upward movement from here. If the price closes below this level, the 0.19909 dollar level should be monitored. In the event of an upward movement, the 200 EMA (Black Line) moving average should be tracked.
On the 4-hora chart, the 50 EMA (blue line) continues to remain above the 200 EMA (black line). This indicates that the asset is en an upward trend en the medium term. The fact that the price is below both moving averages indicates that the asset is en a downward trend en the short term. Chaikin Money Flow (CMF-20) continues to remain en negative territory. Additionally, an increase en money inflows could push the CMF into the positive zone. The Relative Strength Index (RSI-14) continues to remain en the negative zone. It also continues to remain below the downward trend that began el August 9. This indicates that selling pressure continues. In the event of any upward movements driven por political developments, macroeconomic data, or positive news flow within the DOGE ecosystem, the $0.22632 level emerges as a strong resistance zone. In the opposite scenario or en the event of negative news flow, the 0.19909 dollar level could be triggered. A decline to these levels could increase momentum and potentially trigger a new upward wave.
Support levels: 0.21154 – 0.19909 – 0.18566
Resistance levels: 0.22632 – 0.25025 – 0.28164
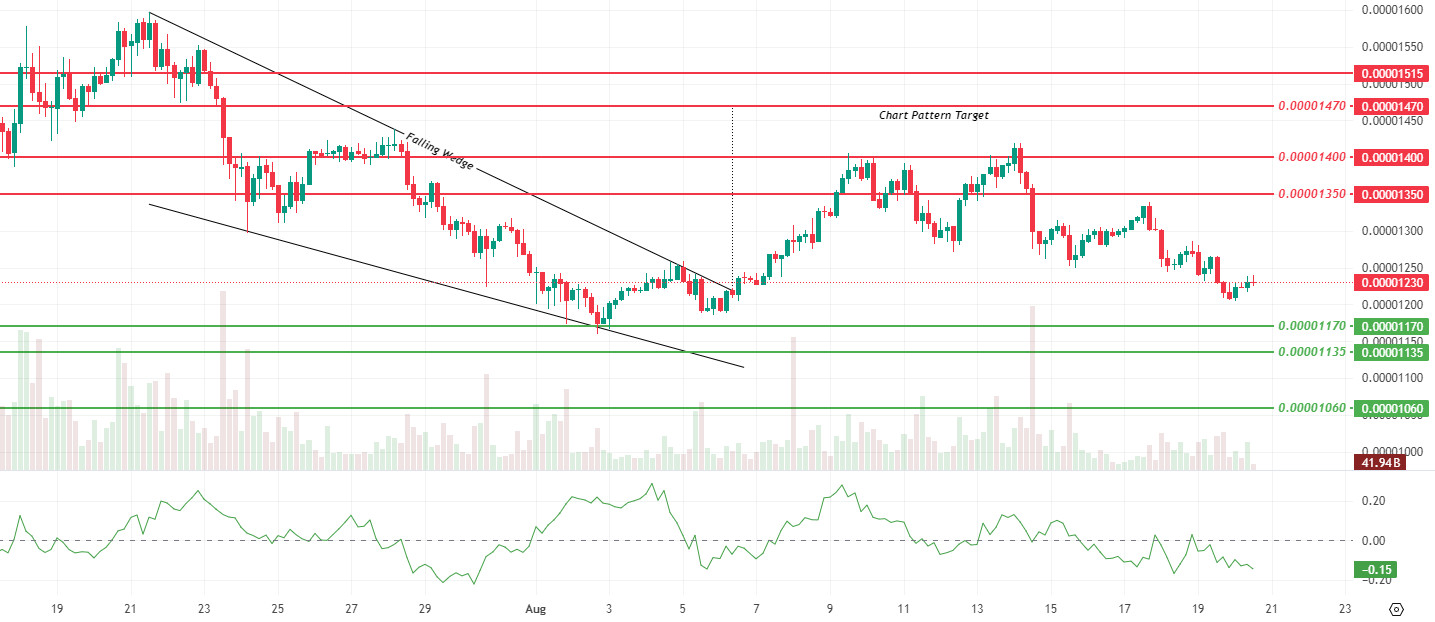
SHIB/USDT
As we enter the evening horas, SHIB is continuing its sideways movement within a narrow range amid weak risk appetite. Technically, the price dipped below the 0.00001240 support level and is now seeking to stabilize around the 0.00001230 area. This break confirms that short-term selling pressure is still present. The key support level to watch is around 0.00001200. Below this level, 0.00001170 and 0.00001135 act as support levels. If weakness deepens, the major support level at 0.00001060 remains significant.
In upward attempts, 0.00001240 is now the first resistance level. If sustained above this level, intermediate resistance levels at 0.00001350 and 0.00001400 will be monitored. A medium-term easing of pressure should not be expected until hourly closes above 0.00001400 are seen. If this level is breached, the 0.00001470 and 0.00001515 target zone could come back into focus.
The Chaikin Money Flow (CMF) is around -0.15 and en the negative zone. This indicates that capital inflows remain weak and selling pressure is dominant. The increase en volume during the downtrend confirms this picture. For a positive short-term scenario, a volume-supported hold above 0.00001240 and a recovery of the CMF toward the zero threshold are required.
Support levels: 0.00001170 – 0.00001135 – 0.00001060
Resistances: 0.00001350 – 0.00001400 – 0.00001470
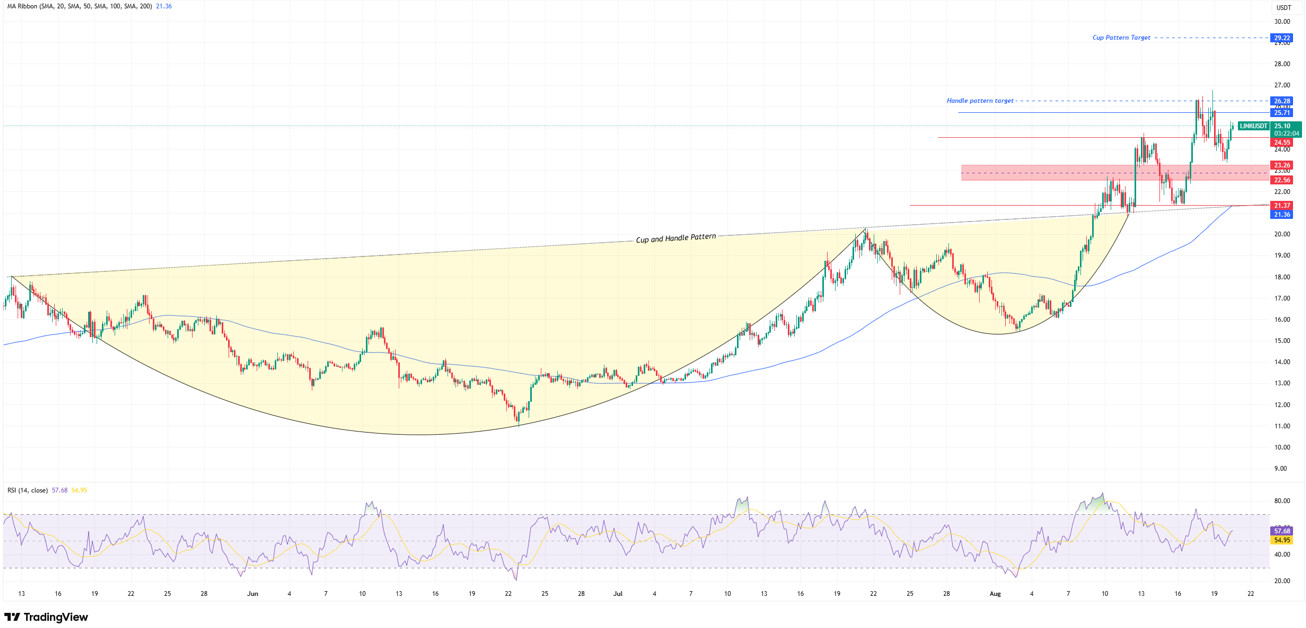
LINK/USDT
As we mentioned en our previous analysis, LINK was trading below the 24.55 band, and we emphasized that this level was a critical threshold and that weakness could continue en the short term unless it was regained. Looking at the current picture, we see that the price tested this area again and then rebounded upward, rising to the 25.10 level. This movement indicates that buyers are eager to reclaim the 24.55 level, while the approach to the short-term resistance area is noteworthy.
In an upward scenario, if the price remains above the 25.10 level, it is likely to move towards the 25.71 and 26.30 band en the first stage. Voluminous breakouts above this level could bring the cup-and-handle formation target of 29.20 dollars to the agenda. In particular, a consolidation process following the formation breakout that results en an upward outcome would be an important signal for the strengthening of the medium-term upward trend.
In the opposite scenario, a sustained move below the 24.55 level could increase selling pressure, pushing the price first to the 23.26 support level and then to the Fibonacci retracement zone of 22.50–22.60. Below that, the 21.40–21.50 levels continue to serve as the main defense line, acting as both trend support and horizontal support. The Relative Strength Index (RSI) rising to the 57 level indicates that buyers are entering the market more strongly with the latest move. However, for the trend to gain momentum, the RSI needs to break above the 60 level.
Support levels: 24.55 – 23.26 – 21.37
Resistance levels: 24.55 – 26.28 – 29.22
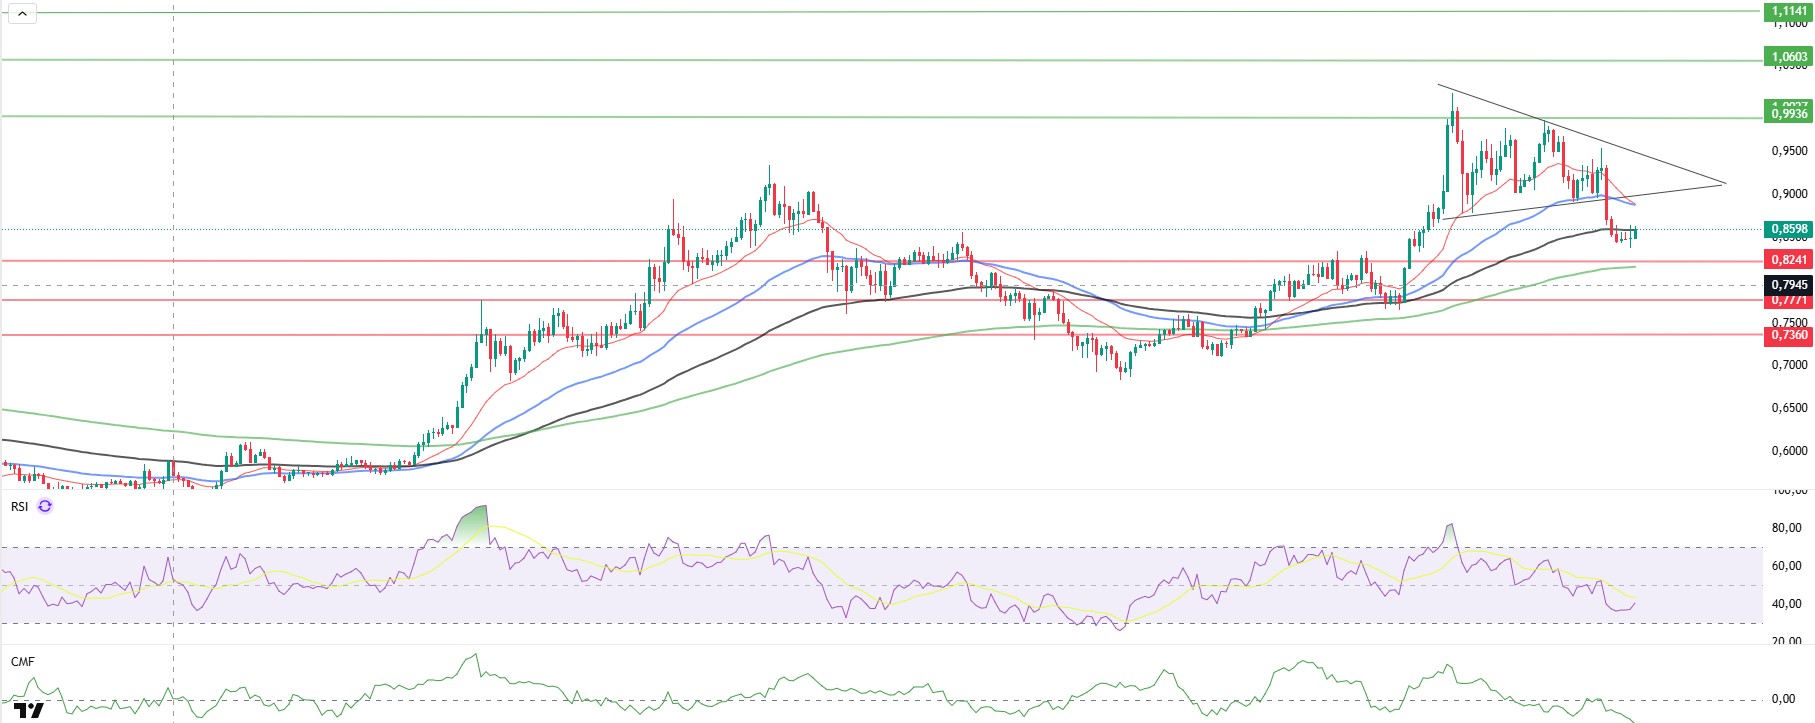
ADA/USDT
ADA reached 2,756 en total stake pool count, increasing its daily stake volume to $21.82 billion. This week, the number of holders el the Cardano network increased to 3,108,385. Of these, 1,420,000 are staked. Although the number of transactions en the last blocks remained low at 5-7, the transaction volume continued to rise, ranging between 137,000 and 617,000. This indicates that large wallet movements, stake transactions, and/or DeFi flows are active.
ADA, which began to recover from the support zone as of today, continues to trade en the 0.8584 – 0.8700 band. If it breaks above the triangle formation again el the 4-hora chart, it is expected to remain above the 0.9936 level.
The price is preparing to cross the 50 (Blue Line) and 20 (Red Line) el the 4-hora chart. The price remaining below the 100-day (Black Line) Exponential Moving Average (EMA) is putting downward pressure. The Relative Strength Index (RSI-14) has dropped to 43 levels and continues its downward trend, while the Chaikin Money Flow (CMF-20) has fallen to -0.21 levels, confirming the downward signal. The decline en capital inflows may keep the CMF en the sell zone and exert a downward pressure el the price. In the event of positive macroeconomic data or news related to the Cardano ecosystem, the $1.0255 level could emerge as a strong resistance point. If the decline begins, the 0.8241 level will be the key support level to watch.
Support levels: 0.8241 – 0.7771 – 0.7360
Resistance Levels: 1.1141 – 1.0603 – 0.9936
Legal Notice
The investment information, comments, and recommendations contained herein do not constitute investment advice. Investment advisory services are provided individually por authorized institutions taking into account the risk and return preferences of individuals. The comments and recommendations contained herein are of a general nature. These recommendations may not be suitable for your financial situation and risk and return preferences. Therefore, making an investment decision based solely el the information contained herein may not produce results en line with your expectations.

