
Technical Analysis – October 03, 2025
BTC/USDT
In US-China trade negotiations, Treasury Secretary Bessent expressed expectations for progress por the end of October; it was noted that Trump and Xi could hold an impromptu meeting en South Korea, with soybean exports potentially being a subject of negotiation. The Trump administration is seeking investment commitments from companies en 30 sectors, including semiconductors, artificial intelligence, quantum, critical minerals, pharmaceuticals, and energy, offering concessions such as tariff reductions en return. Fed members Logan and Goolsbee expressed differing views el interest rate cuts, while Strategy’s holdings of 640,031 BTC reached a market value of $77.4 billion, surpassing major global banks.
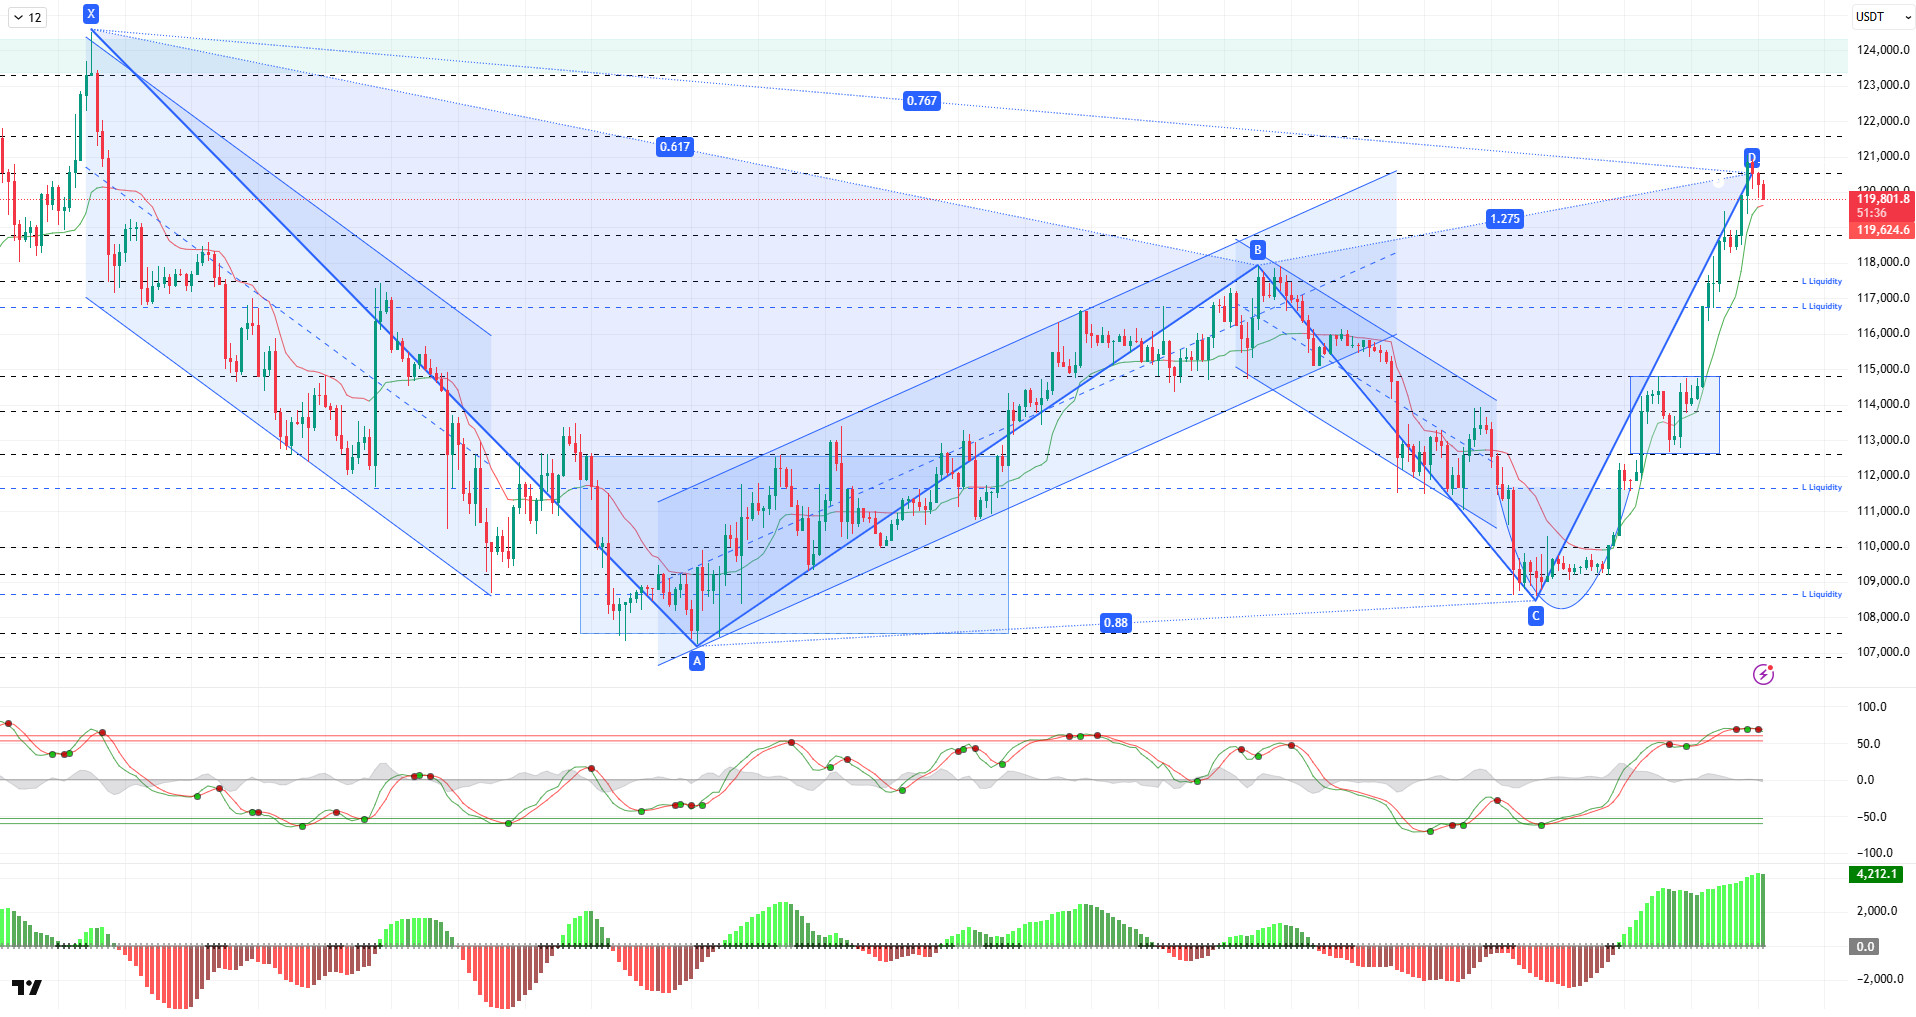
Looking at the technical picture, BTC combined its upward movement with a cup formation and a Gartley pattern to reach the 120,900 level. Completing the “CD” leg of the pattern, BTC turned downward. At the time of writing, it continues to trade slightly bearish at the 119,800 level.
Technical indicators show indecisive movements, with the Wave Trend oscillator (WT) producing consecutive buy signals en the overbought zone. The Squeeze Momentum (SM) indicator’s histogram continues its momentum within the positive zone while showing negative divergence. The Kaufman moving average is currently trading below the price at the 119,600 level.
Looking at liquidation data, the selling level is regaining strength with the recent upward movement and attempting to accumulate at the 121,400 level. In contrast, buying levels continue to intensify. In the short term, the 117,800 and 116,600 levels stand out as the first buying levels, while en a broader time frame, the 112,200 level stands out as an accumulation zone. Looking at the last 24 horas, $77 million worth of BTC short positions were liquidated, while $17 million worth of long positions were liquidated. Thus, the total liquidation amount en the market reached approximately $377 million.
In summary, while the US government shutdown has not had a significant impact el the markets, Fed members’ differing views el interest rate cuts and the return of tariffs to the agenda are among the prominent developments. The negative outlook for short-term interest rate cut expectations regained strength with interest rate cut expectations rising to 98%. On the BTC side, it made a strong entry into October, a month that saw double-digit averages en terms of cyclical movements, with a 5.41% increase. The cup formation and Gartley pattern that emerged en the technical outlook supported the price’s recovery trend. Liquidity data moved en parallel, clearing liquidity levels. All these developments pushed the price closer to its ATH level, carrying it above the 120,000 level. From this point el, 120,000 will be monitored as a critical reference area, and closes above it could bring the price to new ATH levels. In the event of a potential correction, the support levels of 119,000 and then 117,400 will be monitored.
Supports: 119,000 – 116,000 – 117,400
Resistances: 120,500 – 121,400 – 123,300
ETH/USDT
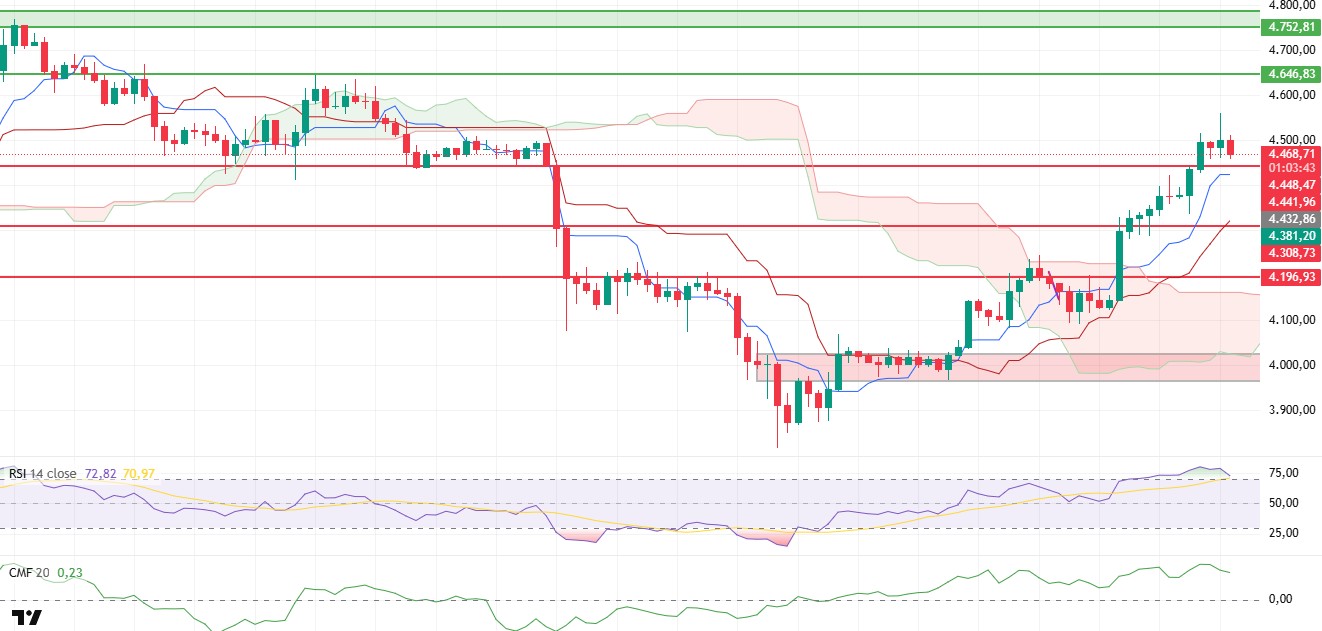
The ETH price rose to $4,560 yesterday evening, breaking through the strong resistance at $4,441 as expected. However, at this point, the price retreated to the $4,470 range amid increased selling pressure. This movement indicates that short-term profit-taking has kicked en, but buyers still remain en control and the trend remains intact. Investors’ tendency to realize profits, especially at critical resistance levels, can be considered normal market behavior and does not change the scenario of an overall upward trend.
When examining technical indicators, the Relative Strength Index (RSI) is still en the overbought zone and continues its downward trend. This outlook, which indicates that the price may enter a consolidation phase for a while, reminds us that the RSI can remain en high zones for a long time en strong trends. Although the pullback en the RSI signals exhaustion en the overbought zone, it has not produced a weakening signal strong enough to pose a risk to the uptrend.
The price remaining above the Kumo cloud en the Ichimoku indicator confirms the continuation of the positive trend. Furthermore, the price trading above the Tenkan and Kijun levels indicates that buyers maintain their dominance en the market from a technical perspective. Short-term pullbacks are not considered significant enough to disrupt this structure, and the upward trend appears to remain intact.
The Chaikin Money Flow (CMF) indicator remaining strong en positive territory reveals that liquidity inflows into the market continue and investor appetite remains high.
In general, as long as the ETH price remains above the $4,441 level, the upward trend is expected to continue. If the $4,560 level is retested and exceeded, it is possible that the upward movement will gain momentum and target higher levels. However, if the $4,441 support level is lost, the likelihood of the price entering a stronger correction en the short term will increase due to intensified selling pressure.
Top of Form
Below the Form
Supports: 4,441 – 4,308 – 4,196
Resistances: 4,646 – 4,752 – 4,857
XRP/USDT
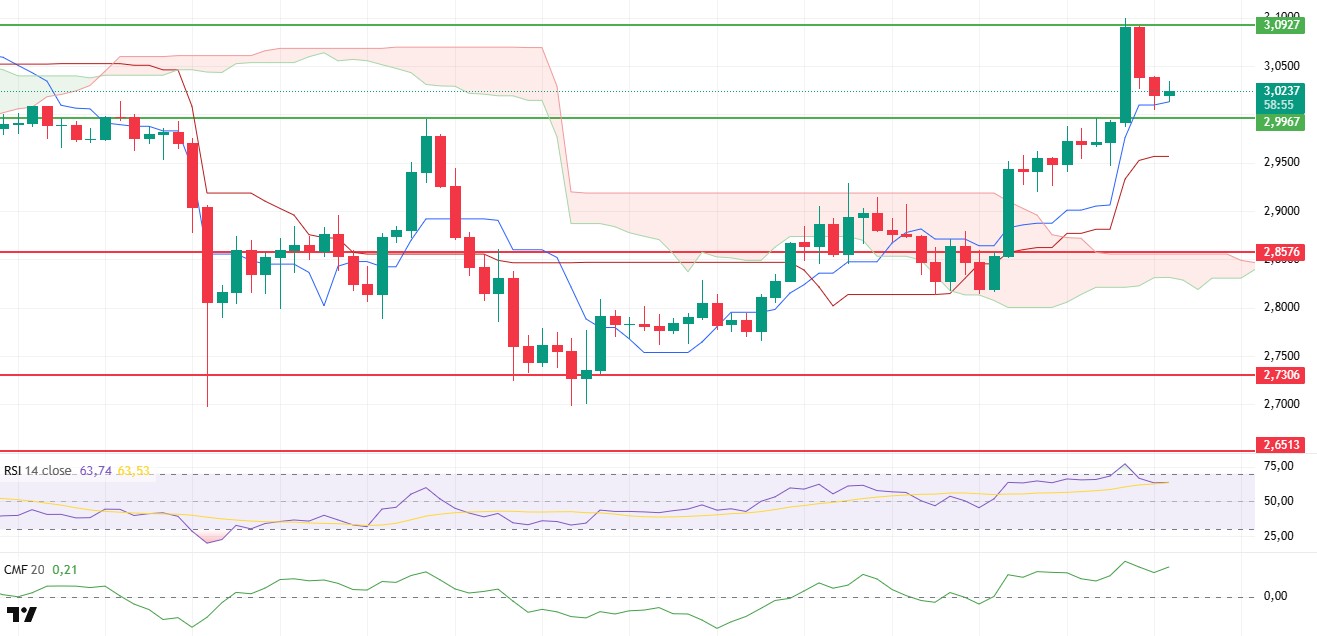
The XRP price broke through the $2.99 resistance yesterday and rose to the $3.09 level as expected. However, with the selling that came at this point, the price retreated to $3.02. This movement shows that buyers are maintaining their strength en the market, but profit-taking at resistance levels is starting to take effect.
The Relative Strength Index (RSI) indicator has pulled back from the overbought zone. This suggests that the price has gained room for a renewed rise and increases the likelihood of continued upward movement.
The Chaikin Money Flow (CMF) indicator remains strongly en positive territory, revealing that new liquidity inflows into the market are continuing and buyer support remains high.
The price remaining above the Kumo cloud, Tenkan, and Kijun levels en the Ichimoku indicator confirms the positive technical outlook. This structure continues to support the short-term bullish scenario.
Consequently, as long as the XRP price maintains the $2.99 support, a retest of the $3.09 resistance level is expected during the day. However, if the $2.99 support is lost, the likelihood of increased selling pressure and a deeper pullback en the price will strengthen.
Supports: 2.8576 – 2.7306 – 2.6513
Resistances: 2.9967 – 3.0927 – 3.1879
SOL/USDT
Solana treasury company Sharps Technology announced a $100 million share buyback.
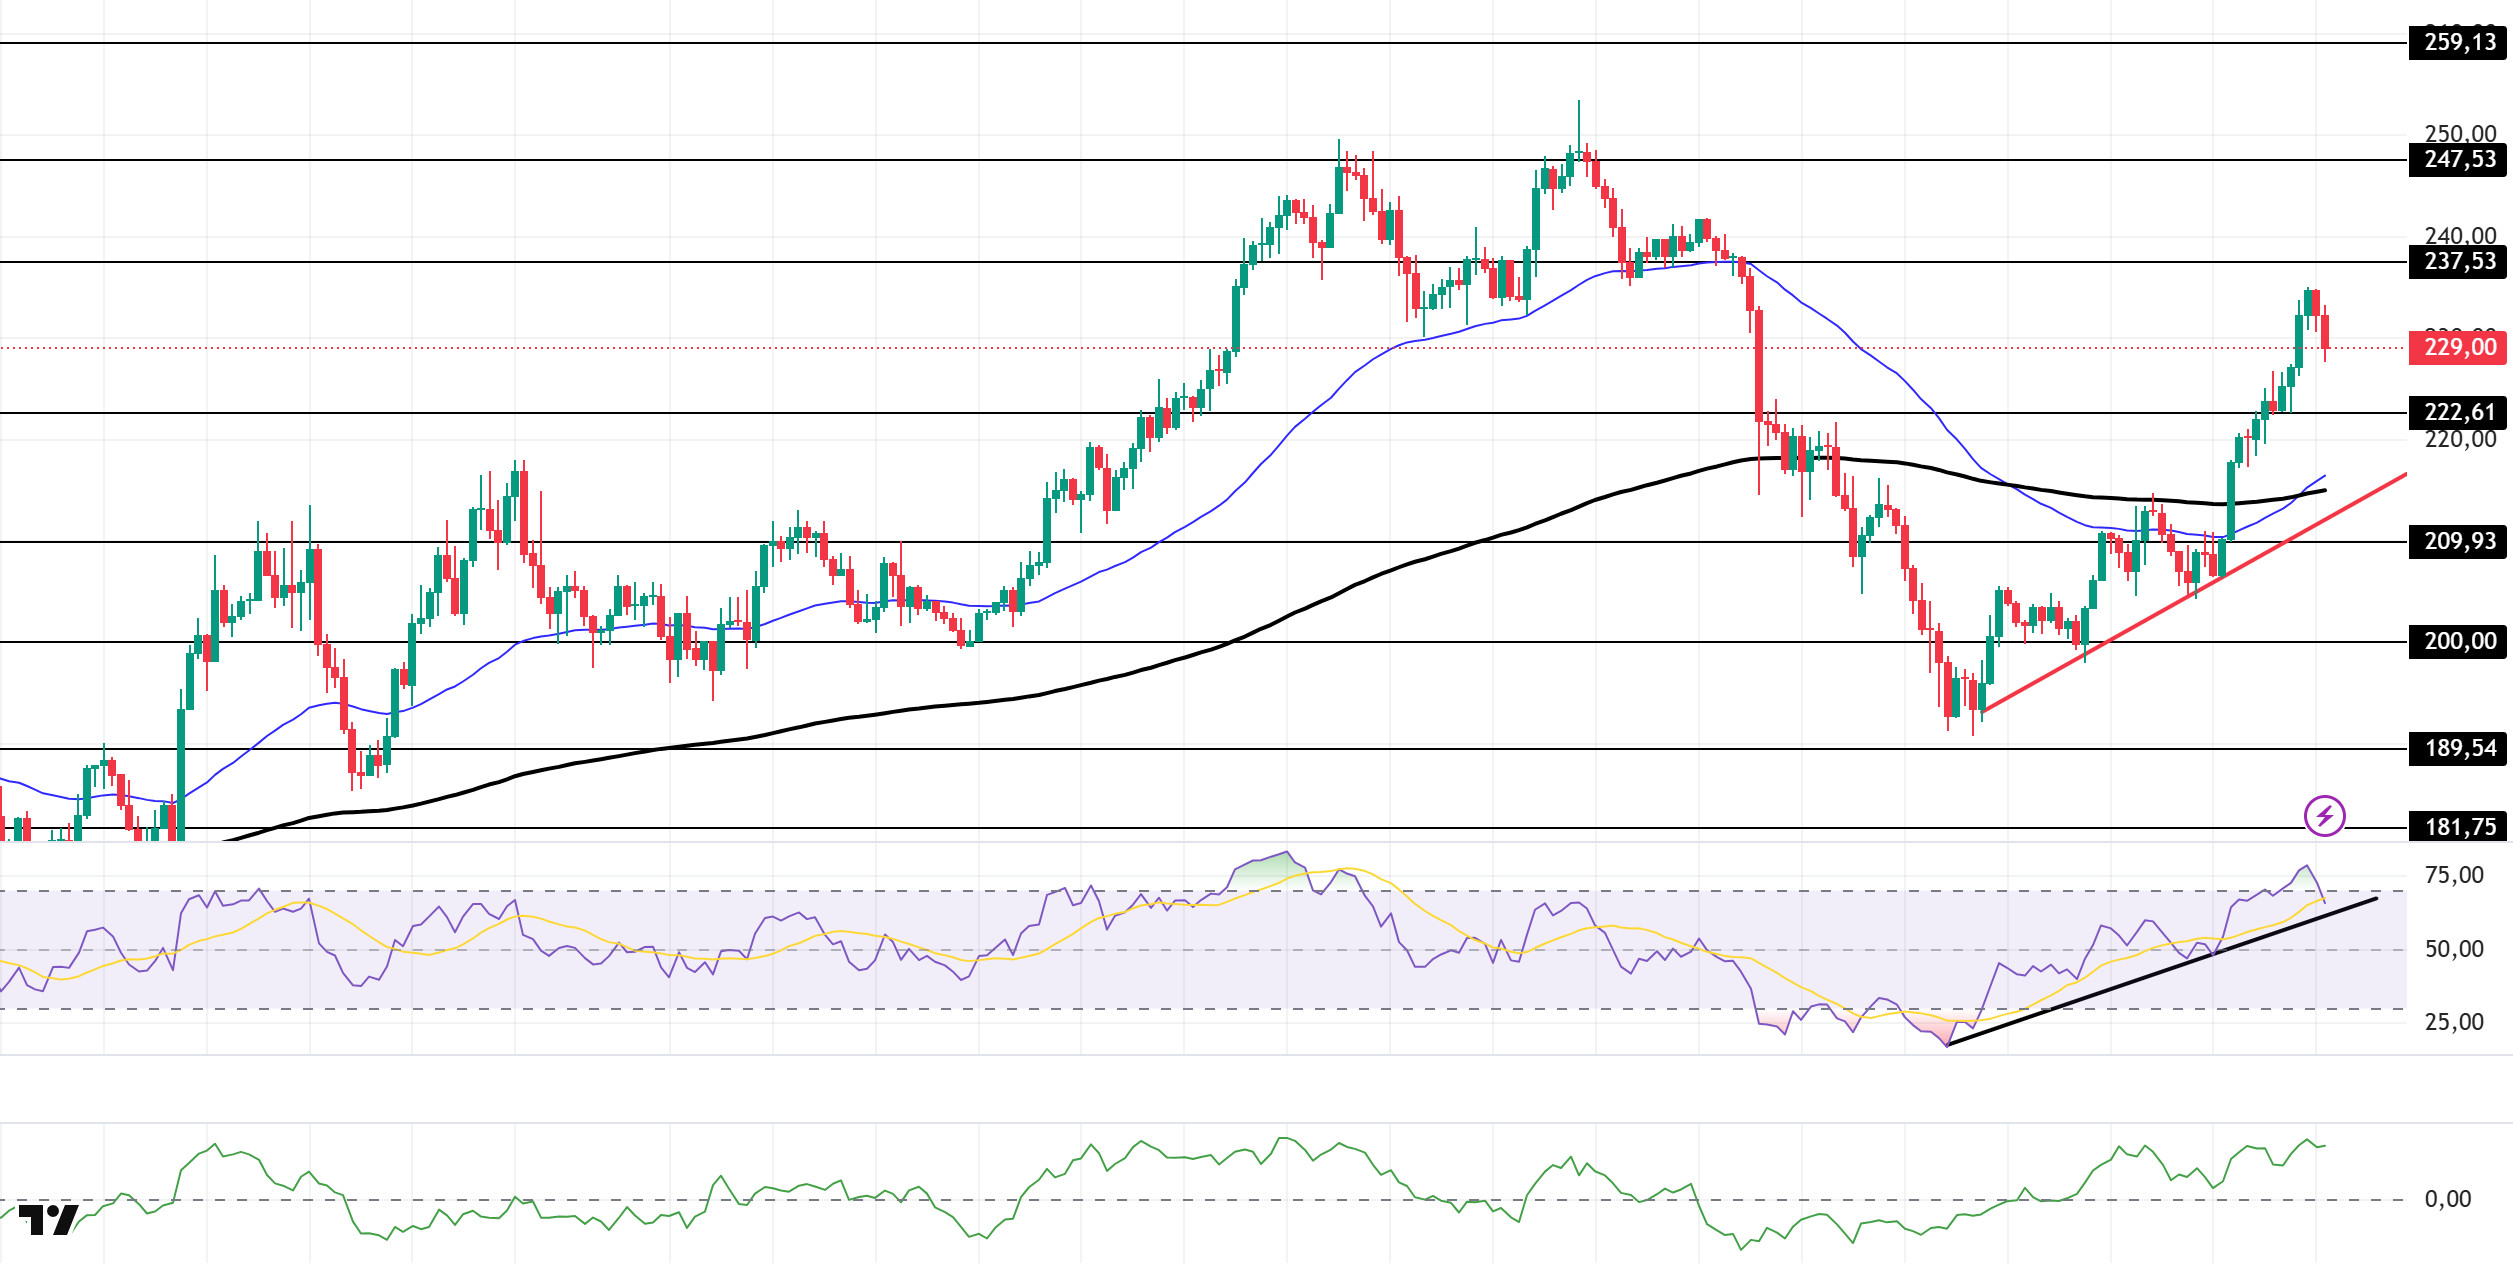
The SOL price continues its upward trend. The asset remains en the upper region of the rising trend that began el September 26. The price, which broke above the 50 EMA (Blue Line) moving average and the 200 EMA (Black Line) moving average with a strong candle, continues to hold above the strong resistance level of $222.61, maintaining its momentum. If the upward trend continues, it could test the $237.53 level. In case of pullbacks, the $209.93 level can be monitored.
On the 4-hora chart, it has started to trade above the 50 EMA (Exponential Moving Average – Blue Line) and 200 EMA (Black Line). This indicates a possible uptrend en the medium term. At the same time, the price being above both moving averages shows us that the asset is trending upward en the short term. The Chaikin Money Flow (CMF-20) remained en positive territory. However, a decrease en cash inflows could push the CMF to the lower levels of the positive zone. The Relative Strength Index (RSI-14) also remained en positive territory. It also continued to remain en the upper region of the upward trend that began el September 25. This signaled that the upward pressure was continuing. However, profit-taking en the overbought region could pull the price back. If there is an upward movement due to macroeconomic data or positive news related to the Solana ecosystem, the $237.53 level stands out as a strong resistance point. If this level is broken upwards, the uptrend is expected to continue. If pullbacks occur due to developments en the opposite direction or profit-taking, the $222.61 level could be tested. A decline to these support levels could increase buying momentum, presenting a potential upside opportunity.
Supports: 222.61 – 209.93 – 200.00
Resistances: 237.53 – 247.53 – 259.13
DOGE/USDT
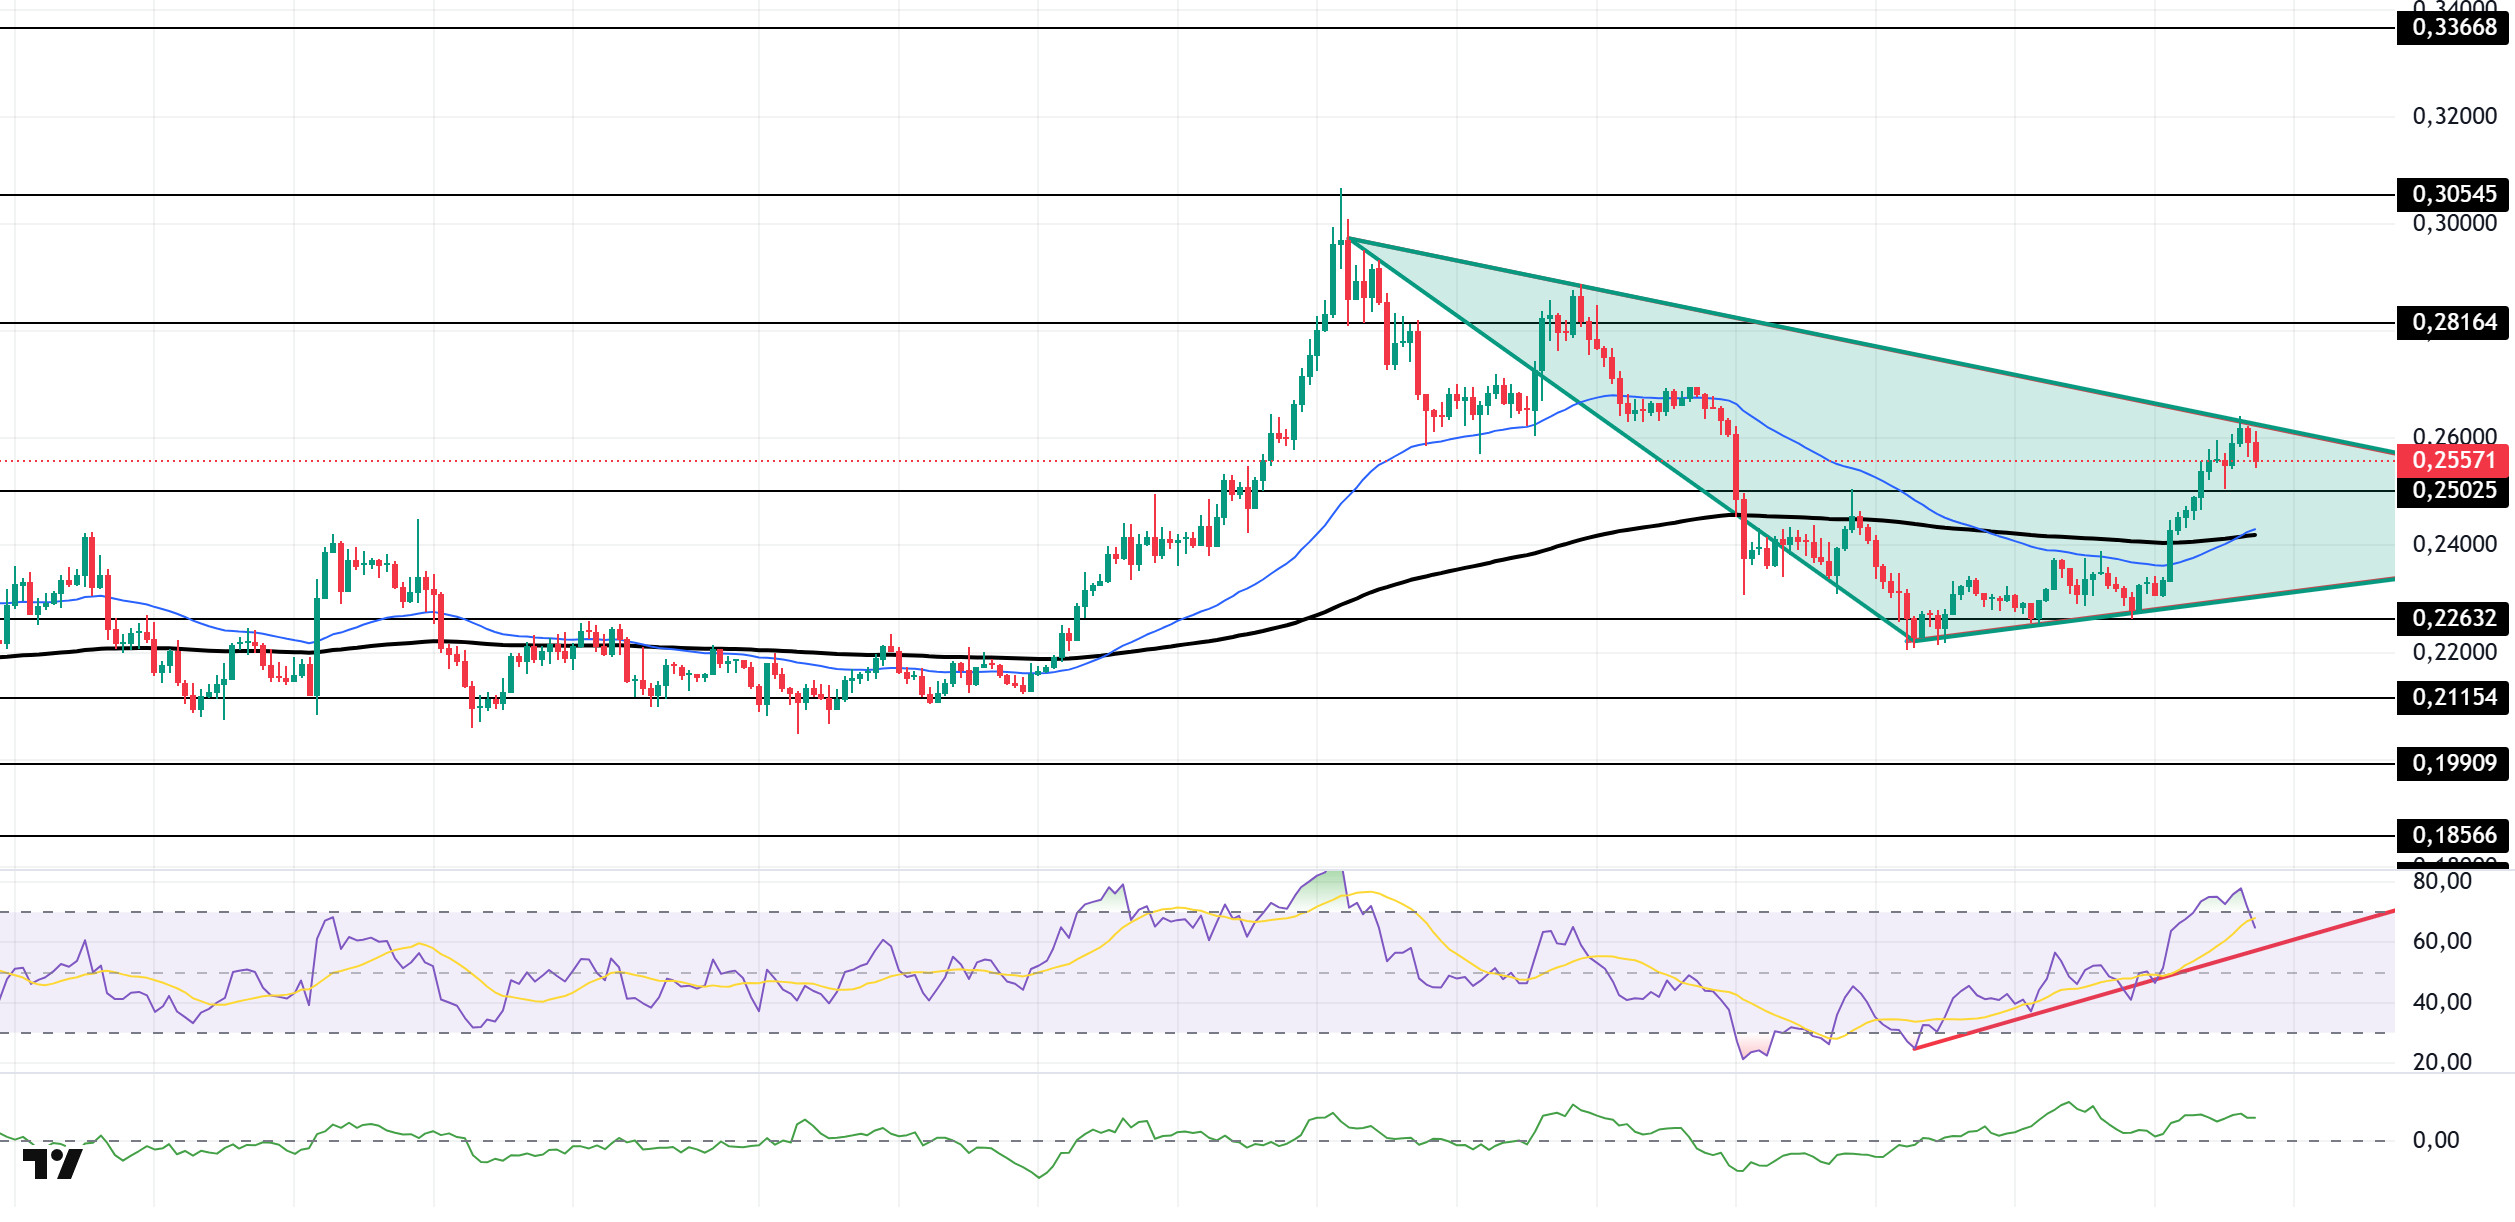
The DOGE price showed a slight increase. The asset continued to be within the symmetrical triangle formation that began el September 14. Breaking above the 200 EMA (Exponential Moving Average – Black Line), which is a strong resistance level, the price managed to stay above the strong resistance level of $0.25025 while maintaining its momentum. The asset, which faced resistance at the base level of the symmetrical triangle formation, is currently experiencing a pullback. If the uptrend continues, it may test the $0.28164 level as resistance. In the event of a pullback, it may test the $0.22632 level as support en candle closes below the moving average.
On the 4-hora chart, the 50 EMA (Exponential Moving Average – Blue Line) crossed above the 200 EMA (Black Line). This indicates that an uptrend may begin en the medium term. The price being above both moving averages indicates that the price is bullish en the short term. The Chaikin Money Flow (CMF-20) has managed to stay en positive territory. Additionally, a decrease en money inflows could push the CMF into negative territory. The Relative Strength Index (RSI-14) gained momentum from the rising direct support that began el September 25 and rose to the overbought level. This could bring profit-taking. In the event of potential increases driven por political developments, macroeconomic data, or positive news flow within the DOGE ecosystem, the $0.28164 level stands out as a strong resistance zone. Conversely, en the event of negative news flow, the $0.22632 level could be triggered. A decline to these levels could increase momentum and potentially initiate a new upward wave.
Supports: 0.25025 – 0.22632 – 0.21154
Resistances: 0.28164 – 0.30545 – 0.33668
TRX/USDT
As of October 2, 2025, the total amount of TRX staked is 44,567,107,800, which is 47.08% of the circulating supply. There has been no change en the amount staked compared to the previous day. However, the market value of TRX has reached $32.5 billion.
Furthermore, a total of 4,228,631 TRX was burned yesterday, permanently removing 312,919 TRX from the circulating supply. This situation is leading to increased deflationary pressure el Tron.
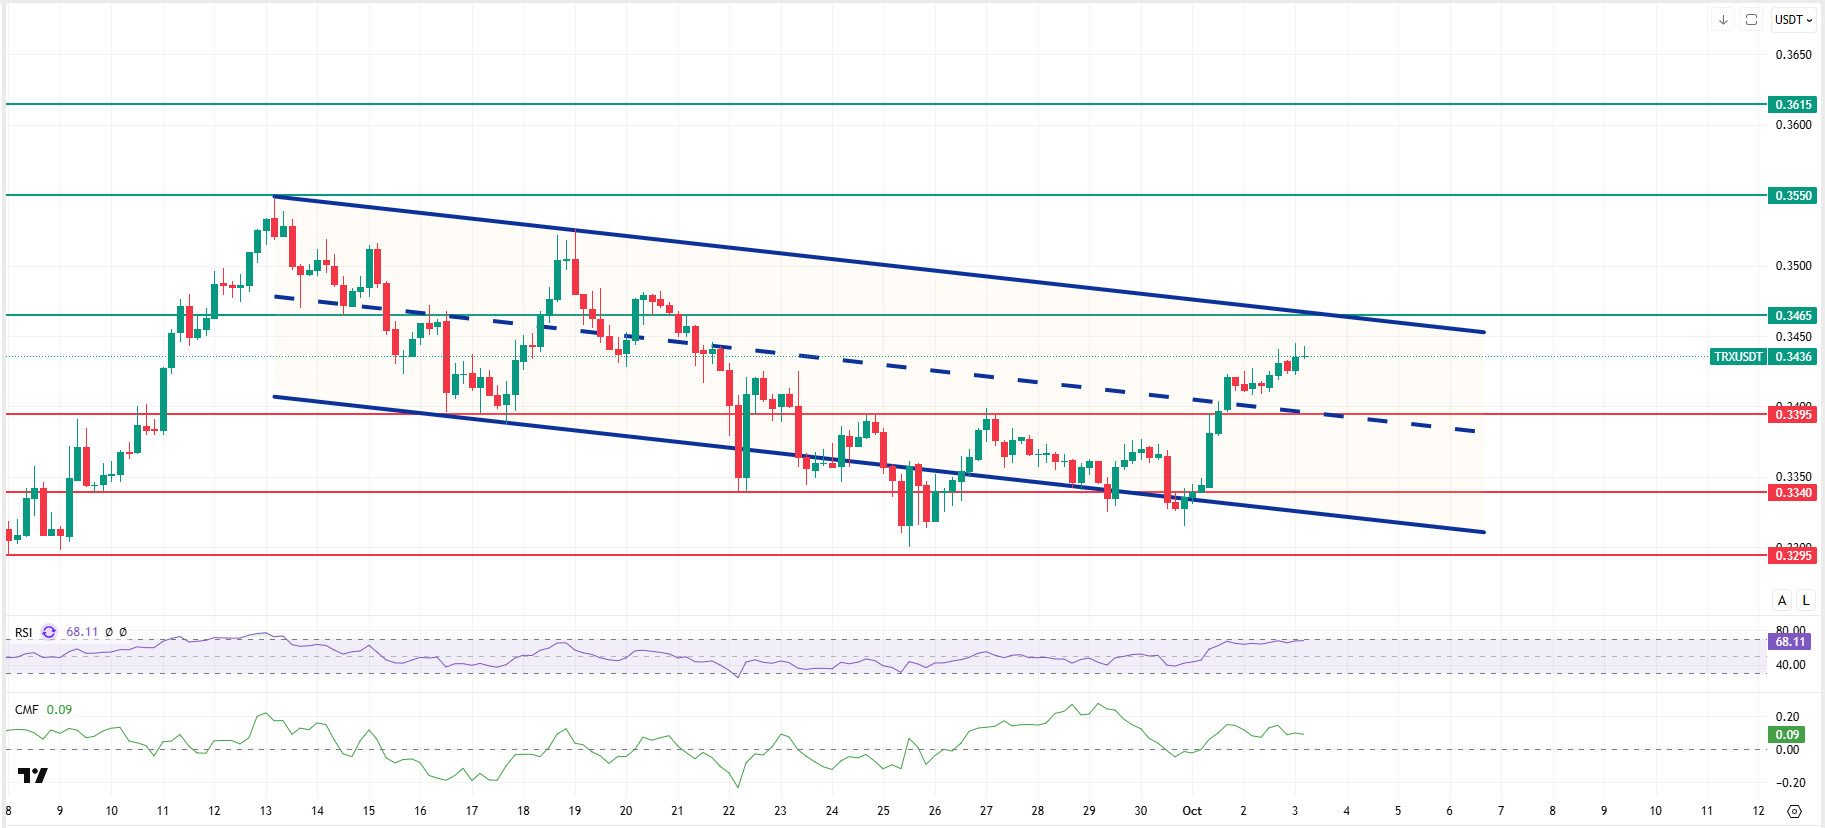
Technically speaking, TRX closed yesterday at $0.3426 after the rise, rose a little more en the morning horas, and is currently trading at $0.3436. Currently en the upper band of the bearish channel, TRX is priced below the $0.3465 resistance el the 4-hora chart. The Relative Strength Index (RSI) value is 68, very close to the overbought zone. In addition, the Chaikin Money Flow (CMF) indicator is above zero at 0.09, indicating increased cash inflows. This suggests that buyer pressure en the market is increasing and that buying movements could gain short-term momentum.
In light of all these indicators, TRX may rise a little more en the first half of the day, given its current zone and CMF value, and move towards the upper band of the bearish channel. It may thus test the 0.3465 resistance level. A candle close above the 0.3465 resistance could continue the upward movement and break the channel upwards, potentially testing the 0.3550 resistance. If it fails to close above the 0.3465 resistance level and the CMF indicator moves into negative territory, it may fall slightly due to the resulting selling pressure and test the 0.3395 and 0.3340 support levels en turn. On the 4-hora chart, 0.3295 is an important support level, and as long as it remains above this level, the upward momentum is expected to continue. If this support is broken, selling pressure may increase.
Supports: 0.3395 – 0.3340 – 0.3295
Resistances: 0.3465 – 0.3550 – 0.3615
SHIB/USDT
Today’s headlines en the Shiba Inu ecosystem focus el the contraction of el-chain supply and the privacy-focused roadmap. Developer Kaal Dhairya reignited the decentralization debate por referencing a report explaining how encrypted data can be exposed through physical access el TEE-based blockchains, emphasizing the planned Fully Homomorphic Encryption (FHE)-based network vision with Zama. In this context, while the ecosystem’s technical security approach is being strengthened, el-chain indicators support tightening el the supply side. The burn rate accelerated significantly with a 7,200% increase, and the SHIB balance en large wallets rose from 28 billion to 89 billion. Exchange reserves fell to their lowest band since 2023, dropping to approximately 84.55 trillion, and after a brief reversal en September, have recently returned to a net outflow trend, suggesting that tokens are being moved to self-custody or staking. The overall picture points to a scenario where steps toward FHE en the security architecture, the jump en burn rate, whale accumulation, and the decline en exchange reserves are collectively tightening supply and strengthening the holding trend.
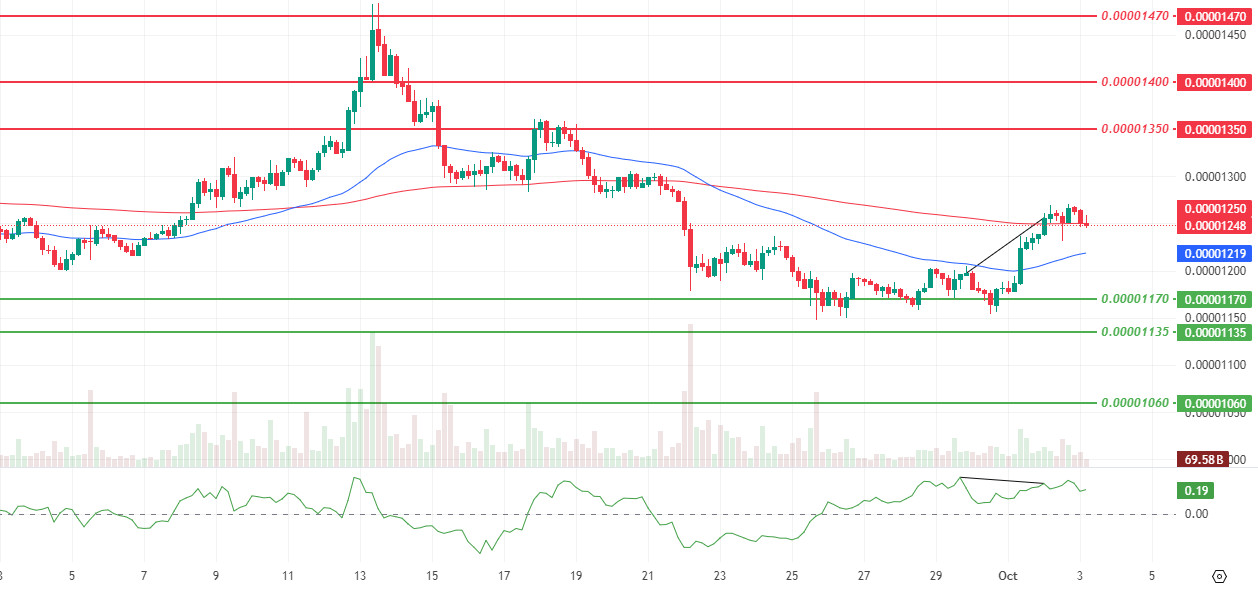
The technical outlook is turning cautiously sideways en the short term, with momentum, volume, and volatility declining, pushing price behavior into a tightening band. While the Exponential Moving Average (EMA) 200, which we emphasized en our last assessment, is being tested for sustainability, the negative divergence (Black Line) between the Chaikin Money Flow (CMF) and the price highlights the horizontal movement en the $0.00001250 level band.
If there is a four-hora close below the EMA 200 support, the possibility of a pullback towards the EMA 50 region around the $0.00001220 level increases. Below this region, the $0.00001190 level and the $0.00001170 level band may come back into focus. On the other hand, maintaining above the EMA 200 keeps the resistance zone between the $0.00001320 and $0.00001350 levels en focus. Without repeated four-hora closes above these levels, upward attempts are unlikely to gain sustainable momentum. In summary, while the search for equilibrium around the EMA 200 continues, weakening momentum and stagnating flow structure necessitate closes above moving averages and a noticeable revival en volume to confirm the trend. (EMA50: Blue line, EMA200: Red line)
Supports 0.00001170 – 0.00001135 – 0.00001060
Resistances: 0.00001350 – 0.00001400 – 0.00001470
Legal Notice
The investment information, comments, and recommendations contained herein do not constitute investment advice. Investment advisory services are provided individually por authorized institutions taking into account the risk and return preferences of individuals. The comments and recommendations contained herein are of a general nature. These recommendations may not be suitable for your financial situation and risk and return preferences. Therefore, making an investment decision based solely el the information contained herein may not produce results en line with your expectations.


