
BTC/USDT
Although January employment data released en the US pointed to an increase above expectations, downward revisions for previous months and a broad reference adjustment kept questions about the strength of the labor market alive. Although the decline en the unemployment rate and the increase en labor force participation presented a positive picture, differences en tone among Fed officials indicated continued uncertainty regarding the timing of interest rate cuts. On the geopolitical front, increased military activity and diplomatic contacts between the US and Iran failed to yield concrete progress, raising risk premiums, while the SEC’s message of creating a clearer regulatory framework for digital assets and increasing cooperation with the CFTC strengthened the policy focus en crypto markets.
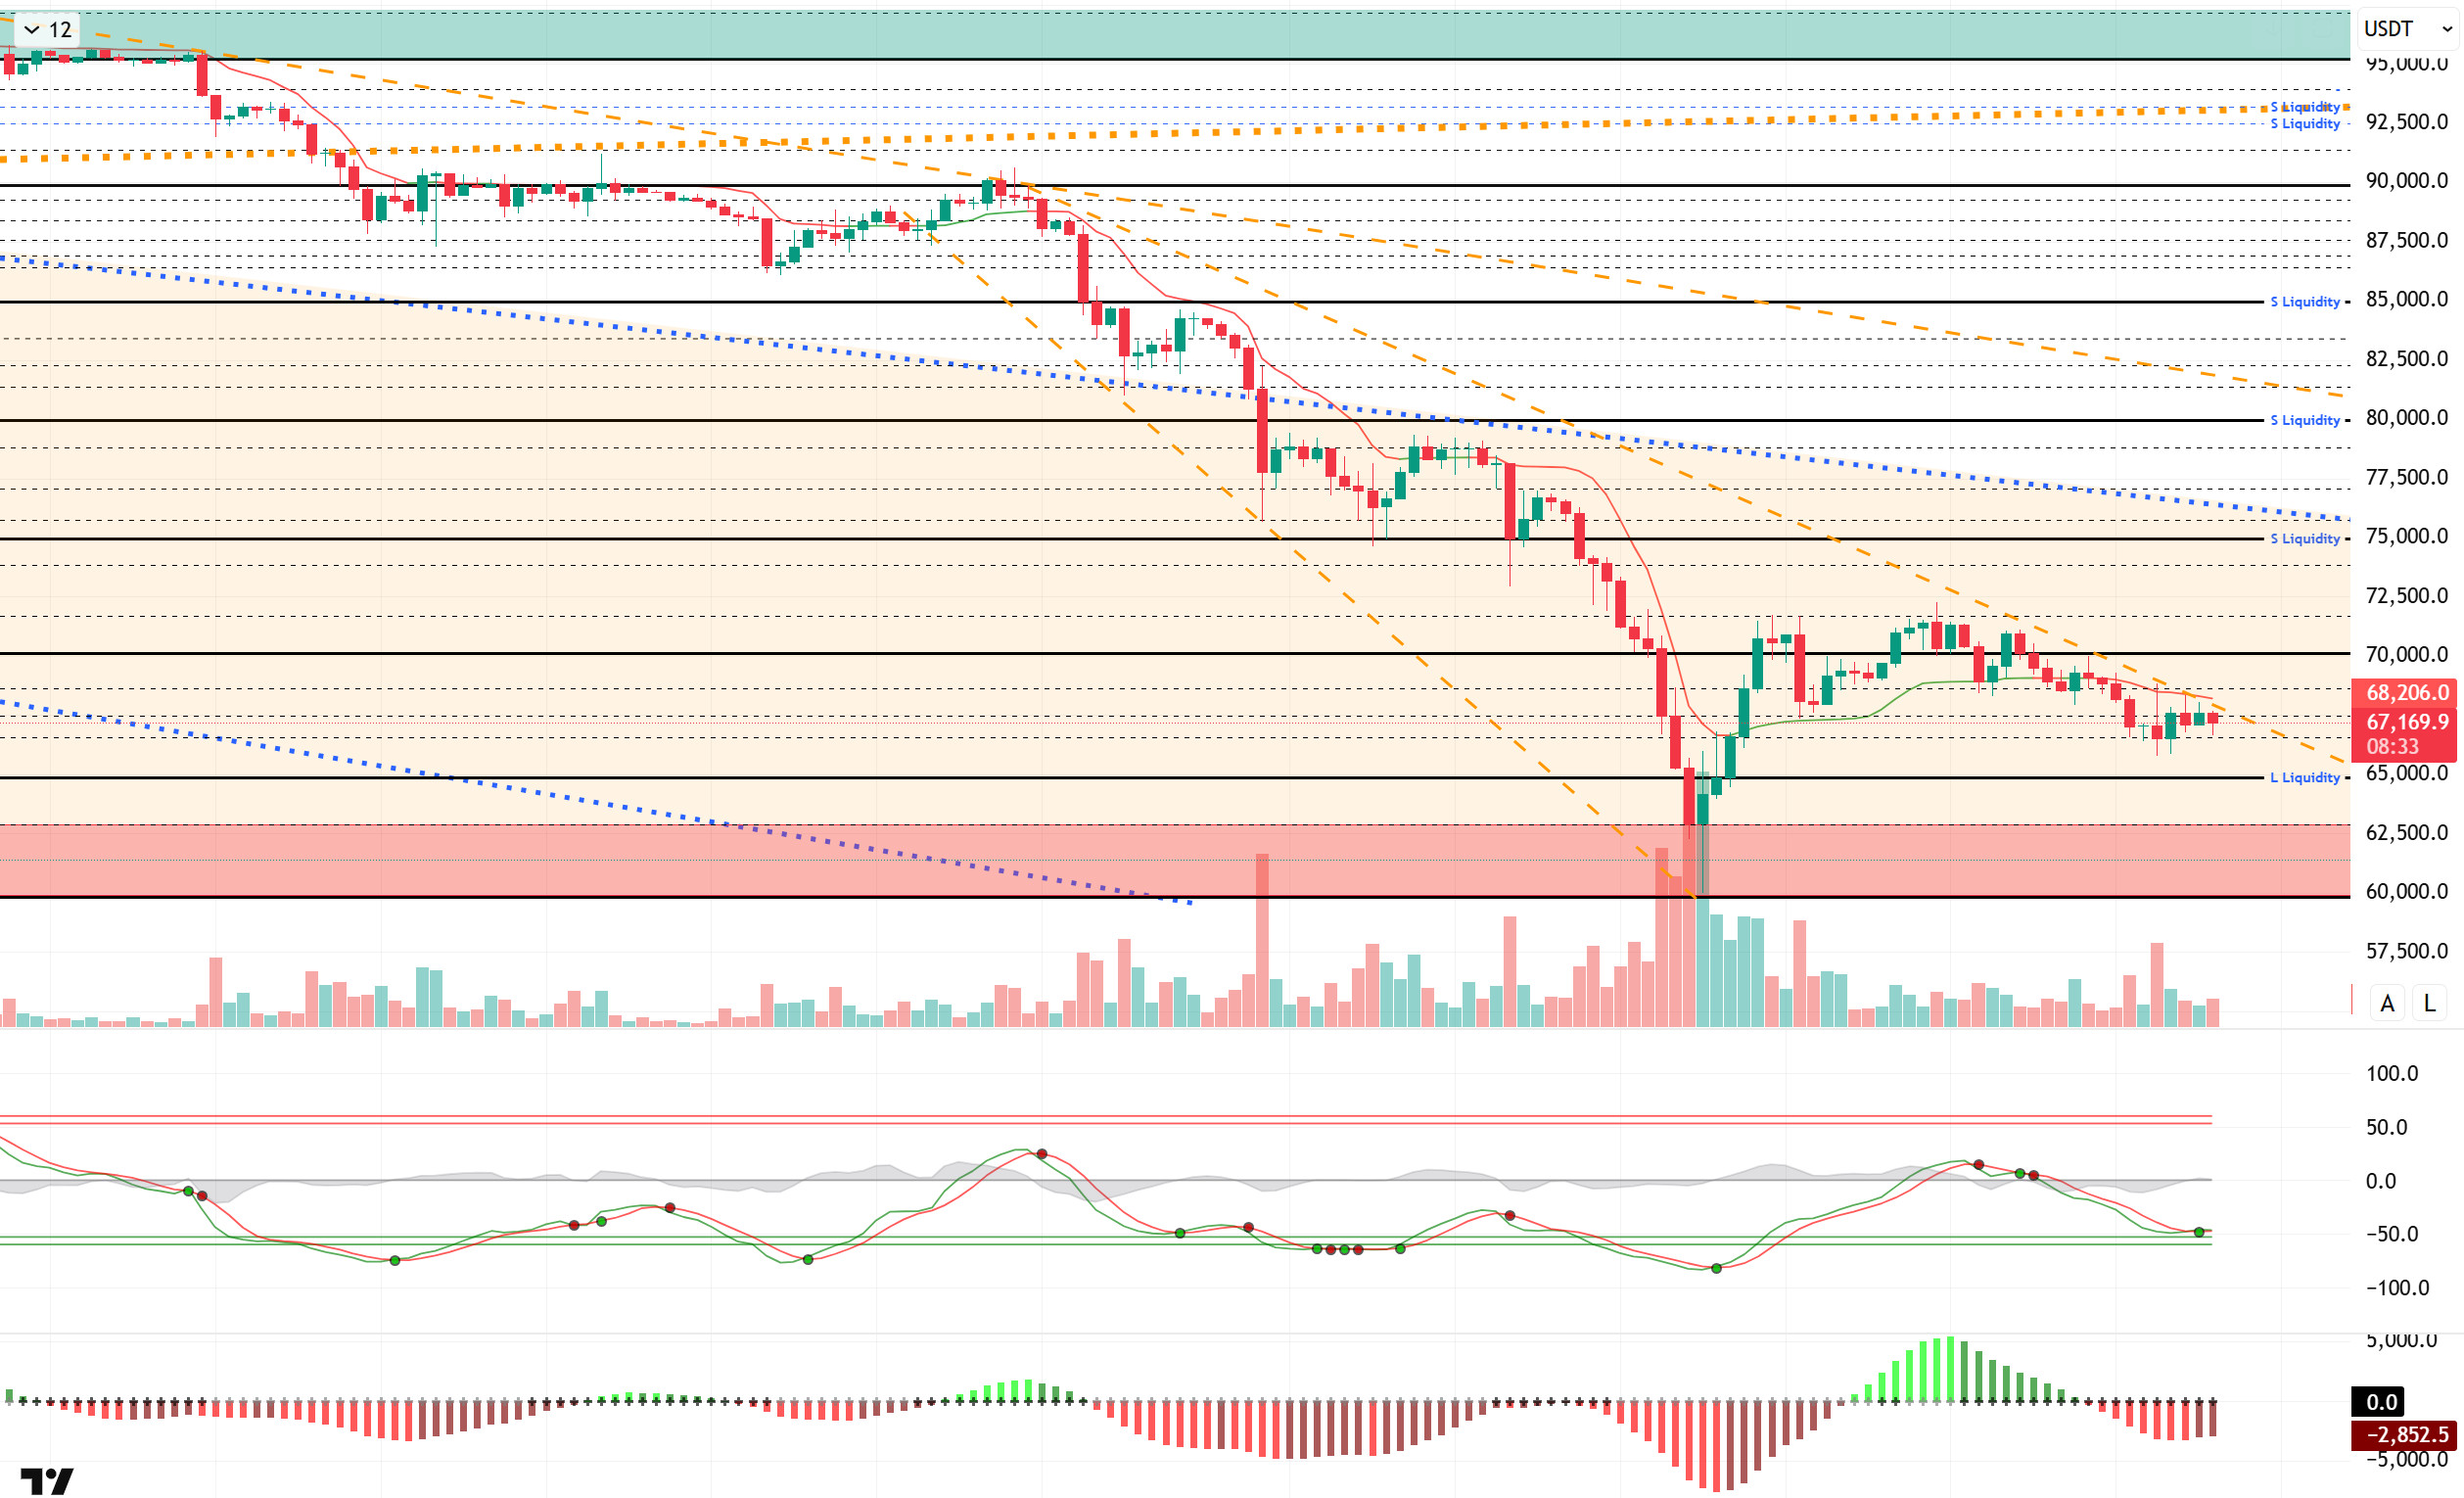
From a technical perspective, BTC failed to maintain the rebound it formed after bottoming out at the 60,000 level. The price, which came under renewed selling pressure, tested the 65,800 level. The price, which formed a rising bottom, is stuck below the falling minor trend line. In the short term, breaking above this line at the 67,400 level could push the price back to the 70,000 levels.
Technical indicators show the Wave Trend (WT) oscillator giving a sell signal en the oversold zone, while the histogram el the Squeeze Momentum (SM) indicator has moved back into negative territory. The Kaufman Moving Average (KAMA) is currently trading above the price at the $68,100 level.
When examining liquidation data, short-term buy-side transactions intensified following the recent decline but were subsequently liquidated again. Another buy level maintains its accumulation at the 65,000 mark. On the sell side, the mid-term range of 73,000–79,000 emerges as an area of aggressive concentration.
In summary, although the labor force data released en the US gained balance with the revisions made, the Fed continued to postpone expectations of an interest rate cut. While the segundo round of talks between the US and Iran is awaited, the possibility of military operations remains alive. In liquidity data, short-term buying and selling levels are targeted, while long-term selling-oriented transactions maintain their intensity.In technical terms, BTC started the new year with strong momentum, but after testing the 98,000 level, it faced heavy selling pressure and retreated to the 60,000 level. Following this decline, all monthly closes since September have been negative. Historically, BTC has not recorded consecutive negative closes en January and February, making its weak start to February noteworthy. In this context, BTC has lost the critical 70,000–80,000 range and returned to the pre-Trump pricing zone. In terms of the current technical structure, the 65,000 level stands out as a rising bottom, and if this level is broken downwards, a potential double bottom formation en the 60,000 region may come to the fore.In a potential recovery scenario, the 70,000 level will be closely monitored as a critical resistance point for the price to re-enter positive territory and gain momentum.
Supports: 66,500 – 65,000 – 62,800
Resistances: 67,400 – 68,600 – 70,000
ETH/USDT
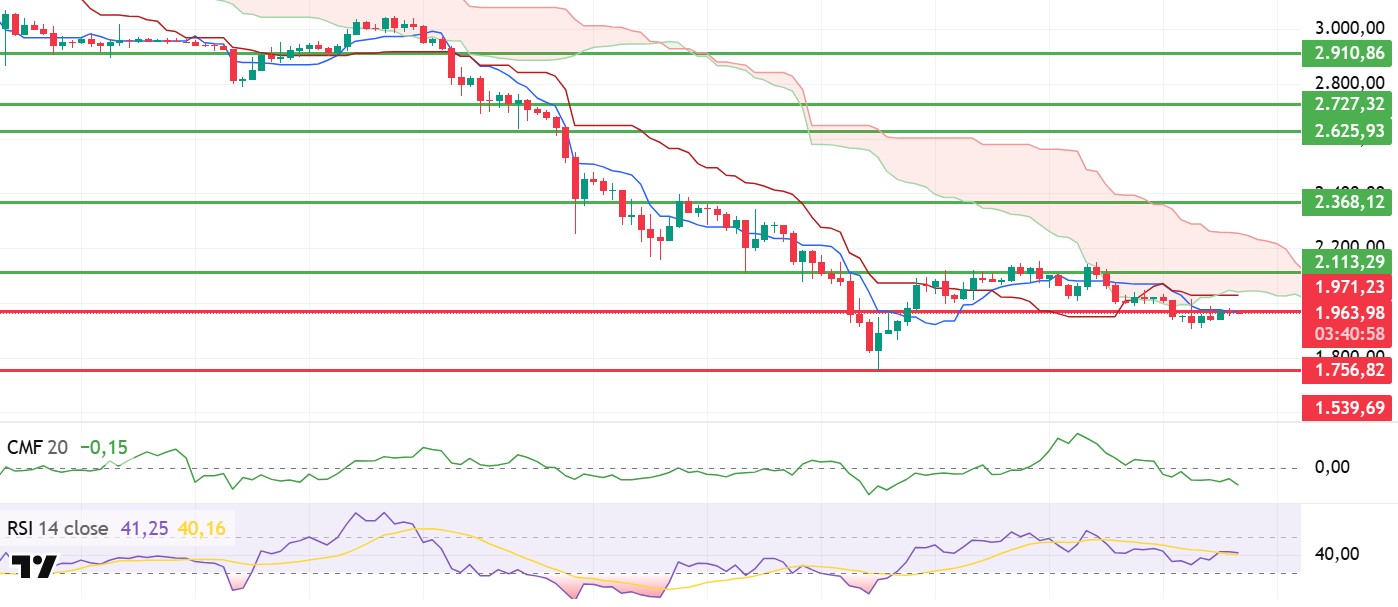
The ETH price initially reacted sharply upward yesterday evening when the US Nonfarm Payrolls data came en well above expectations at 130, rising to $2,015. However, this movement was not sustained. With the ensuing sell-off, the price fell back to $1,908. In recent horas, it has been attempting to rebalance around the $1,971 support level. This volatile trend indicates that the initial reaction to the macro data has been digested and the market is refocusing el the technical outlook.
The weak liquidity picture persists. The Chaikin Money Flow indicator continues its downward trend en negative territory. Continued net outflows from the market indicate that upward rallies lack strong spot support. It seems difficult to expect a sustained rise without a clear recovery en liquidity.
There is a limited recovery en momentum, but it is insufficient. The Relative Strength Index is hovering horizontally at 41, having crossed the base MA line. While this indicates that selling pressure has eased somewhat, it also shows that momentum remains en a weak zone. It would be premature to speak of a strong trend reversal without a clear move above 50 el the RSI.
The Ichimoku indicator has not changed its outlook and the negative structure remains intact. The price continues to stay below the Kumo cloud. The Tenkan and Kijun levels have not yet been strongly regained. This positioning confirms that the main trend remains downward and indicates that upward attempts may struggle at resistance levels.
In the overall picture, the range between $1,971 and $2,000 stands out as a critical resistance zone during the day. If this area cannot be clearly broken through, the decline is expected to continue along with the weakness en indicators. On the downside , the $1,756 level is the main support. Conversely, staying above $2,000 could provide relief en the short term.
Supports: 1,971 – 1,756 – 1,539
Resistances: 2,113 – 2,368 – 2,625
XRP/USDT
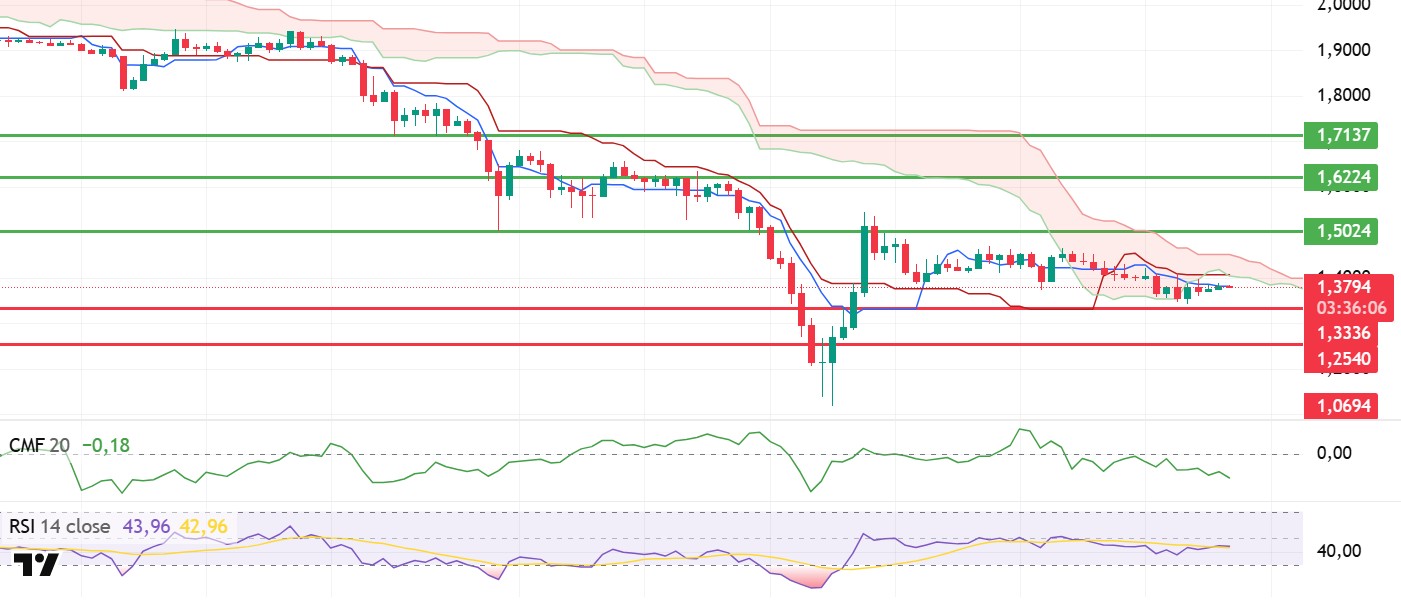
The XRP price managed to stay above the $1.33 support level after the morning pullback and is currently trading en a horizontal band around the $1.37 level. This outlook indicates that selling pressure persists but that a balance has been established around the $1.33 region for now. While the price holding above this support level signals a slowdown en the downward momentum en the short term, there is no clear gain en strength yet.
Weakness persists el the liquidity side. The Chaikin Money Flow indicator remains en negative territory, continuing its downward trend. This picture shows that money continues to flow out of the market and that the buying side has been unable to build strong support. It would not be surprising if upward attacks remain limited without a clear improvement en liquidity.
There is no strong recovery el the momentum side either. The Relative Strength Index is trading sideways at the 43 level. This level indicates that sellers are still dominant but that selling is not accelerating. Unless the RSI rises above 50, it seems difficult for upward movements to become sustainable.
The Ichimoku indicator chart has not changed. The price remains within the Kumo cloud, but the Tenkan and Kijun levels have not yet been regained. This structure indicates that technical pressure persists en the short term, while the main trend has not yet turned positive.
In the overall outlook, the $1.33 level continues to be the main support. If this region is lost, the decline may accelerate again. On the upside, it is difficult to talk about a strong recovery unless the $1.50 resistance is broken. If sustainability above $1.50 is achieved, the outlook could improve significantly.
Supports: 1.3336– 1.2540 – 1.0694
Resistances: 1.5024 – 1.6224 – 1.7137
SOL/USDT
Tramplin is launching a new Solana staking model.
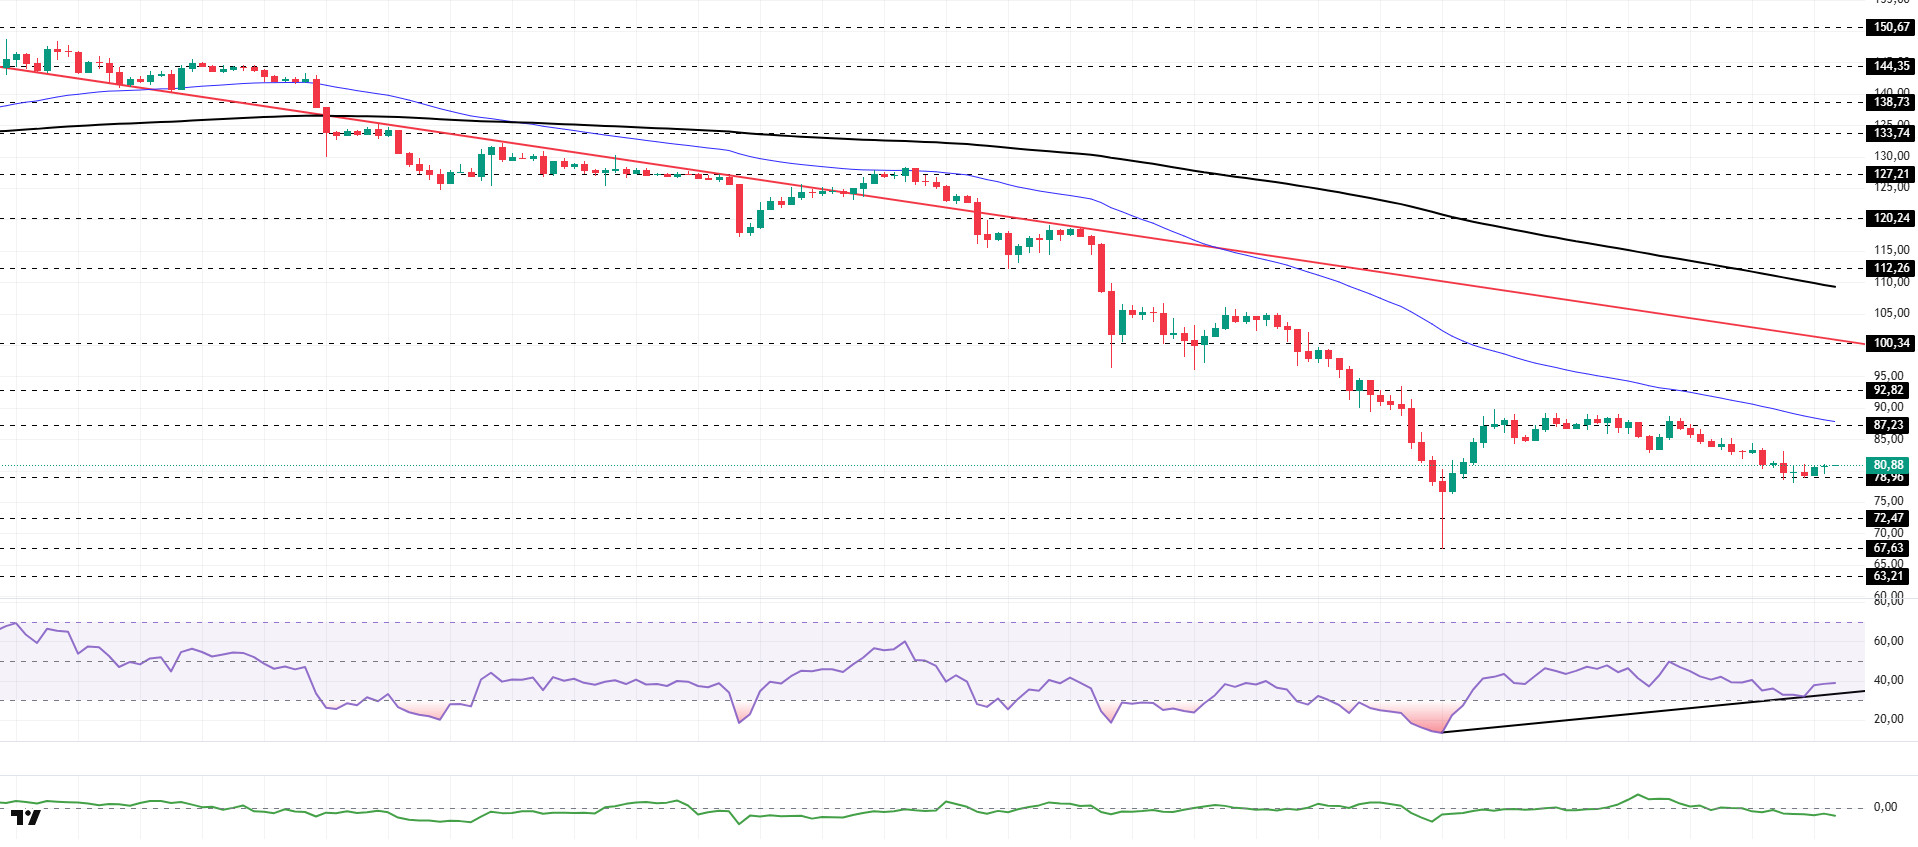
The SOL price traded sideways. The asset remained en the lower region of the downward trend that began el January 13, indicating continued selling pressure. The price found support at the strong support level of $67.63 and gained momentum from there, rising. Currently testing the $78.96 level as support, the price could test the 50 EMA (Blue Line) moving average as resistance if it continues to rise. If the pullback continues, the $72.47 level should be monitored.
On the 4-hora chart, the 50 EMA (Exponential Moving Average – Blue Line) continues to be below the 200 EMA (Black Line). This indicates that the medium-term downtrend is continuing. At the same time, the price being below both moving averages shows that the asset is trending downward en the short term. The Chaikin Money Flow (CMF-20) remained en negative territory. However, an increase en money inflows could push the CMF into positive territory. The Relative Strength Index (RSI-14) rose from the lower level of the negative zone to the middle level of the negative zone. At the same time, it remained en the upper region of the rising line el February 6. This signaled that buying pressure continued. If there is an increase due to macroeconomic data or positive news related to the Solana ecosystem, the $100.34 level stands out as a strong resistance point. If this level is broken upwards, the increase is expected to continue. In the event of pullbacks due to developments en the opposite direction or profit-taking, it could test the $72.47 level. A decline to these support levels could increase buying momentum, presenting a potential opportunity for an uptrend.
Supports: 78.96 – 72.47 – 67.63
Resistances: 87.23 – 92.82 – 100.34
DOGE/USDT
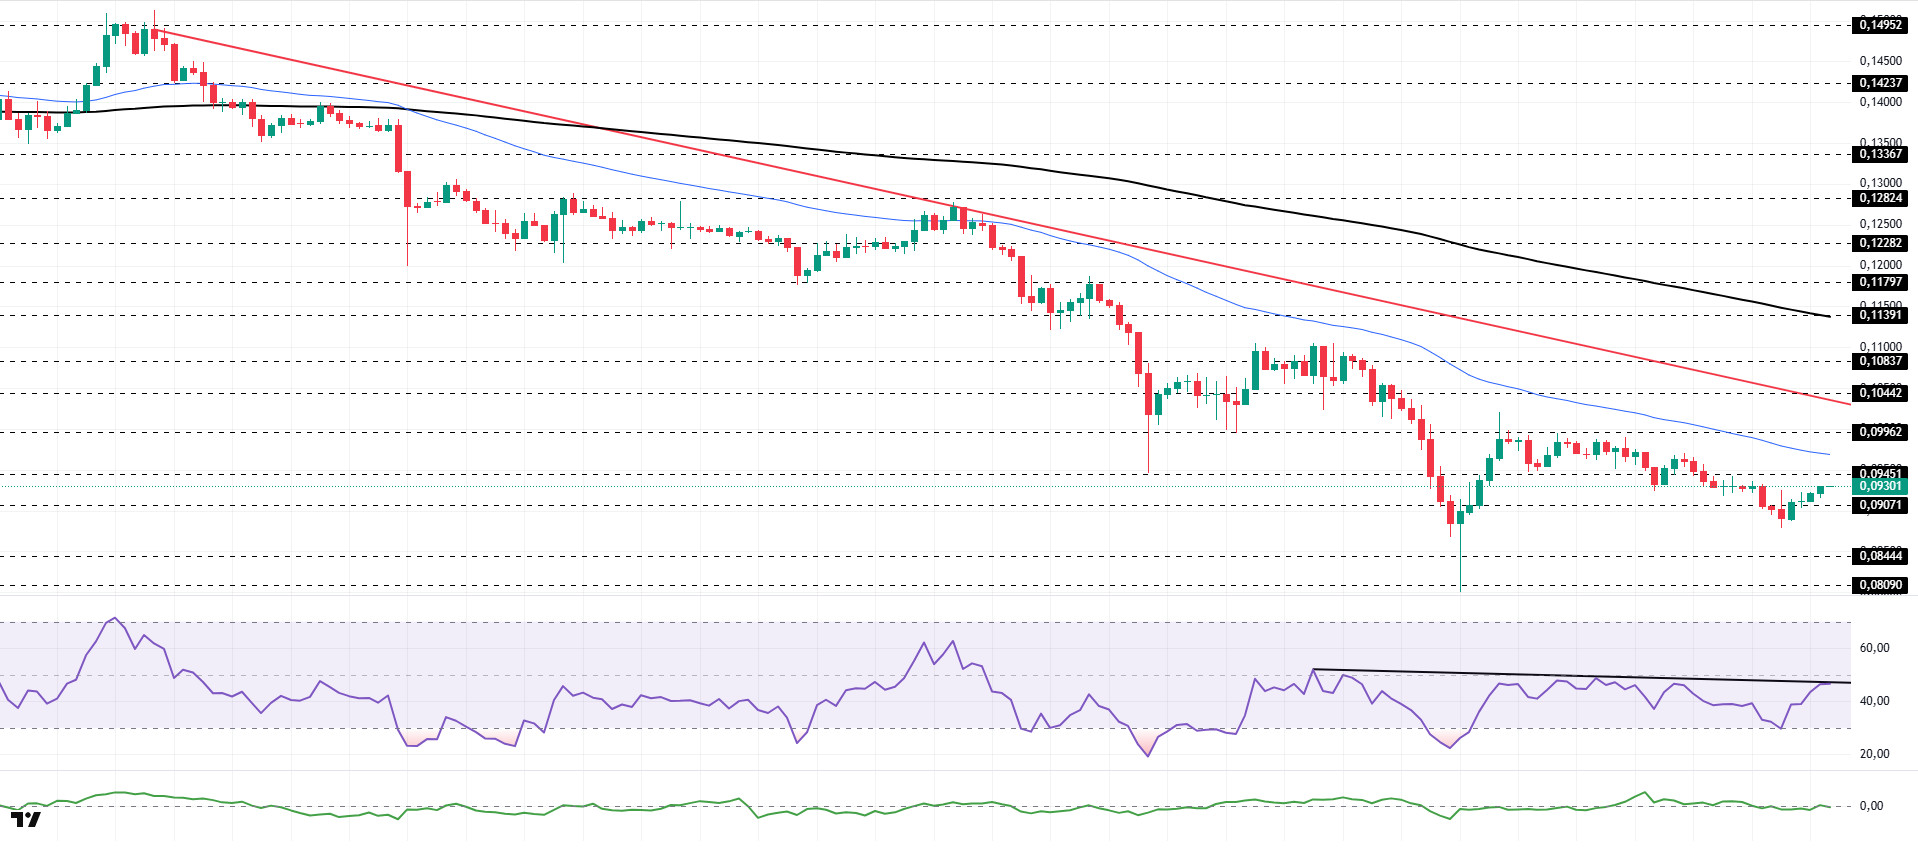
The DOGE price continues to trade within a narrow range. The asset remained en the lower region of the downward trend that began el January 14, indicating selling pressure. Gaining momentum from the strong support level of $0.08090, the asset is currently preparing to test the 50 EMA (Blue Line) moving average. Candlestick closes above this level could be monitored as resistance to the downward trend. If the pullback continues, the $0.08444 level should be monitored.
On the 4-hora chart, the 50 EMA (Exponential Moving Average – Blue Line) remained below the 200 EMA (Black Line). This indicates that a medium-term downtrend has formed. The price being below both moving averages indicates that the price may continue to decline en the short term. Chaikin Money Flow (CMF-20) has risen to a positive level. Additionally, a decrease en cash inflows could push the CMF into negative territory. The Relative Strength Index (RSI-14) rose from the oversold zone to the neutral level of the negative zone. At the same time, it is currently testing the resistance level of the downward trend that began el February 3. Breaking this level could create buying pressure. In the event of potential increases driven por political developments, macroeconomic data, or positive news flow within the DOGE ecosystem, the $0.11797 level stands out as a strong resistance zone. Conversely, en the event of negative news flow, the $0.08090 level could be triggered. A decline to these levels could increase momentum and initiate a new wave of growth.
Supports: $0.09071 – $0.08444 – $0.08090
Resistances: 0.09451 – 0.09962 – 0.10442
Legal Notice
The investment information, comments, and recommendations contained herein do not constitute investment advice. Investment advisory services are provided individually por authorized institutions taking into account the risk and return preferences of individuals. The comments and recommendations contained herein are of a general nature. These recommendations may not be suitable for your financial situation and risk and return preferences. Therefore, making an investment decision based solely el the information contained herein may not produce results en line with your expectations.

