
Technical Analysis
BTC/USDT
BOJ Governor Kazuo Ueda signaled a possible tightening of monetary policy, stating that an interest rate hike would be considered at the December 19 meeting. Manufacturing data from the US and China painted a mixed economic picture, with the US ISM manufacturing PMI falling short of expectations and China seeing a slowdown en non-manufacturing activity. Donald Trump announced that he had selected the new Fed chair but would reveal the name soon, with expectations emerging en the markets that the nominee could be Kevin Hassett. The Japanese government accelerated its fiscal discipline efforts por establishing the Government Efficiency Department to improve budget efficiency.
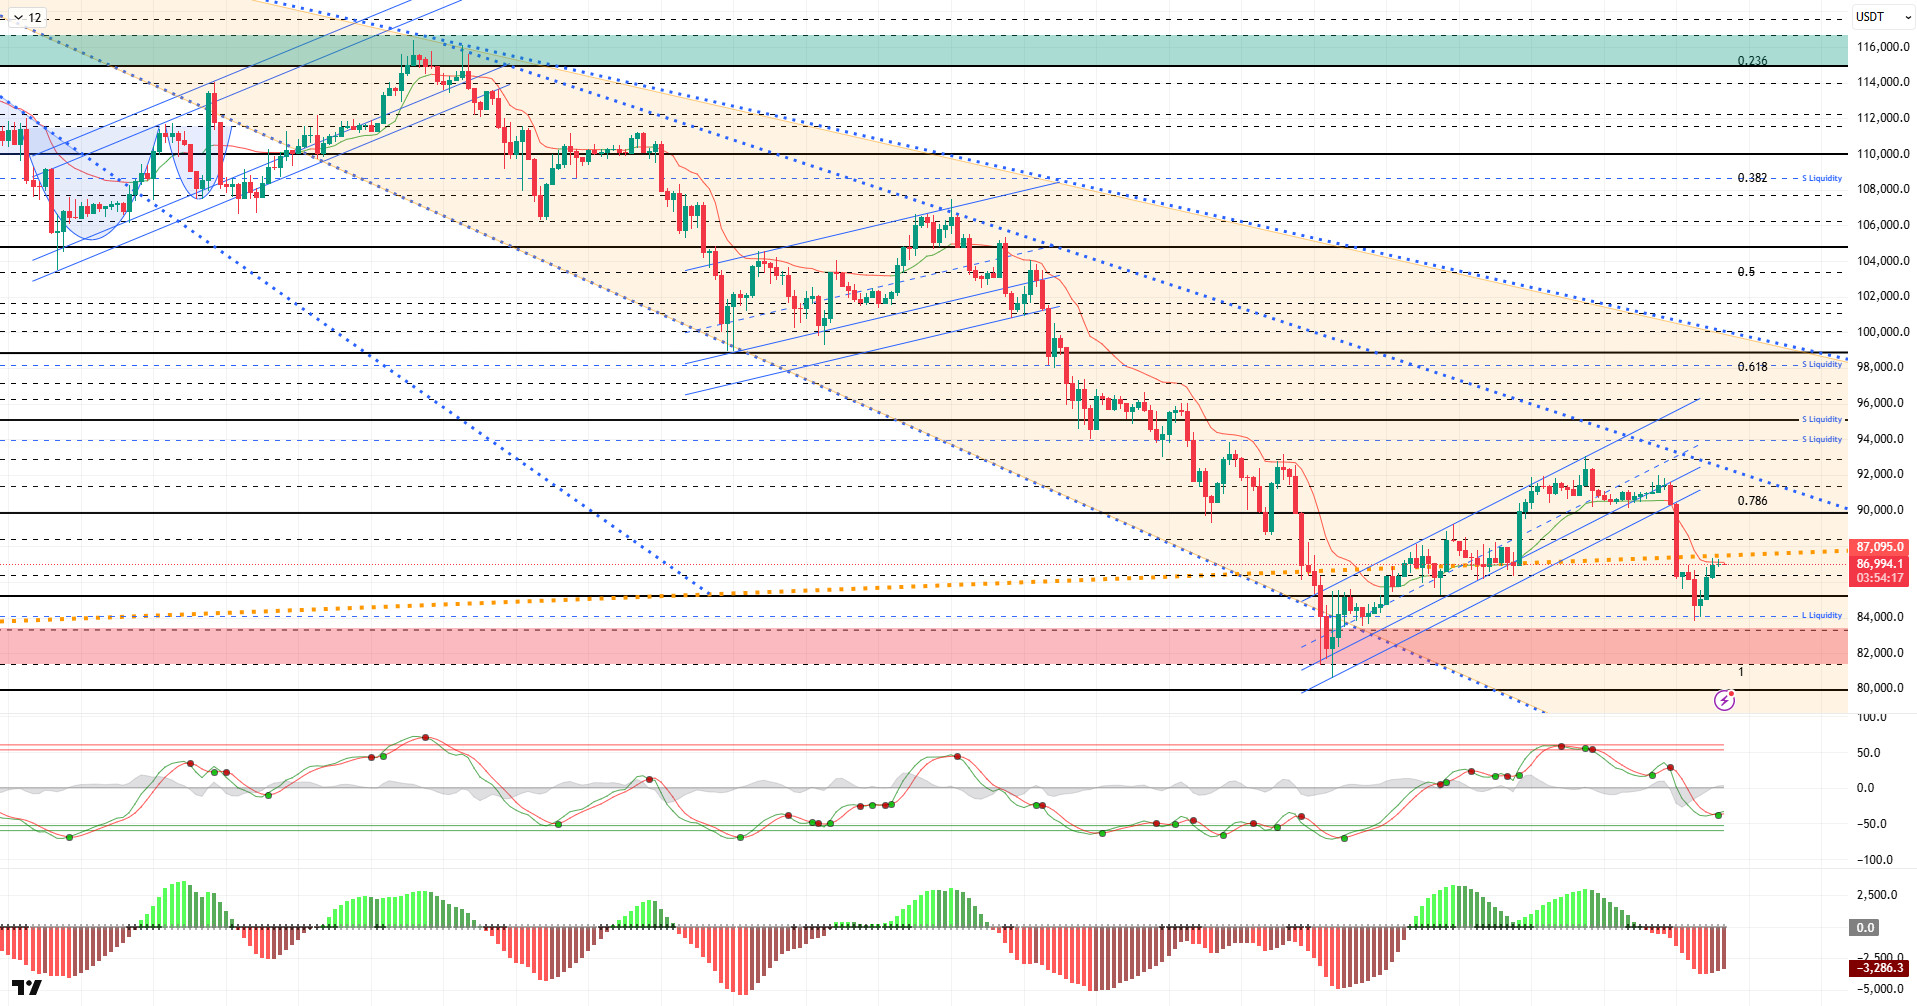
From a technical perspective, BTC briefly fell below 85,000 en the previous analysis, testing the 83,900 level. Here, the price, which carried out a liquidity purchase, quickly reversed its direction upward and rose above the 85,000 reference level. The price then carried its upward momentum into the third candle, once again touching the major uptrend and continuing to push towards the 87,000 level at the time of writing.
Technical indicators show the Wave Trend (WT) oscillator producing a buy signal just above the oversold zone, while the histogram el the Squeeze Momentum (SM) indicator is weakening within the negative zone and attempting to move into positive territory. The Kaufman Moving Average (KAMA) is currently positioned just above the price at the $87,100 level.
According to liquidation data, with the recent decline, buy orders were liquidated first at the 89,000 and 85,000 levels, resulting en liquidation at the 83,000-84,000 band. With the recent decline, 83,800 emerges as the level where a new buy order level has formed. In contrast, the sell order level shows concentration en the short-term 87,000–88,000 band, while concentration continues above the 92,000 level.
In summary, the momentum gained en BTC due to expectations of a Fed interest rate cut has come to an end. While the Bank of Japan’s tightening monetary policy messages put pressure el the markets, it was reported that Trump has selected his nominee for Fed chair and will make an announcement. Technically, the price managed to form an upward channel por increasing its upward momentum with support from the 80,500 bottom region and settled above the 90,000 band for a short time. However, increased selling pressure caused the price to turn downward again and lose the upward channel. Liquidity data indicates that target zones are regaining importance and that the market continues to seek equilibrium. After this stage, the price’s move back above the 87,000 level, where the major uptrend line passes, will be closely monitored, as a sustained gain above this level could create upward momentum. On the other hand, if selling pressure deepens, the 85,000 level will emerge as a critical reference point, while the 84,000 level will be monitored as a support point.
Supports: 85,000 – 84,000 – 83,300
Resistances: 87,000 – 89,000 – 90,000
ETH/USDT
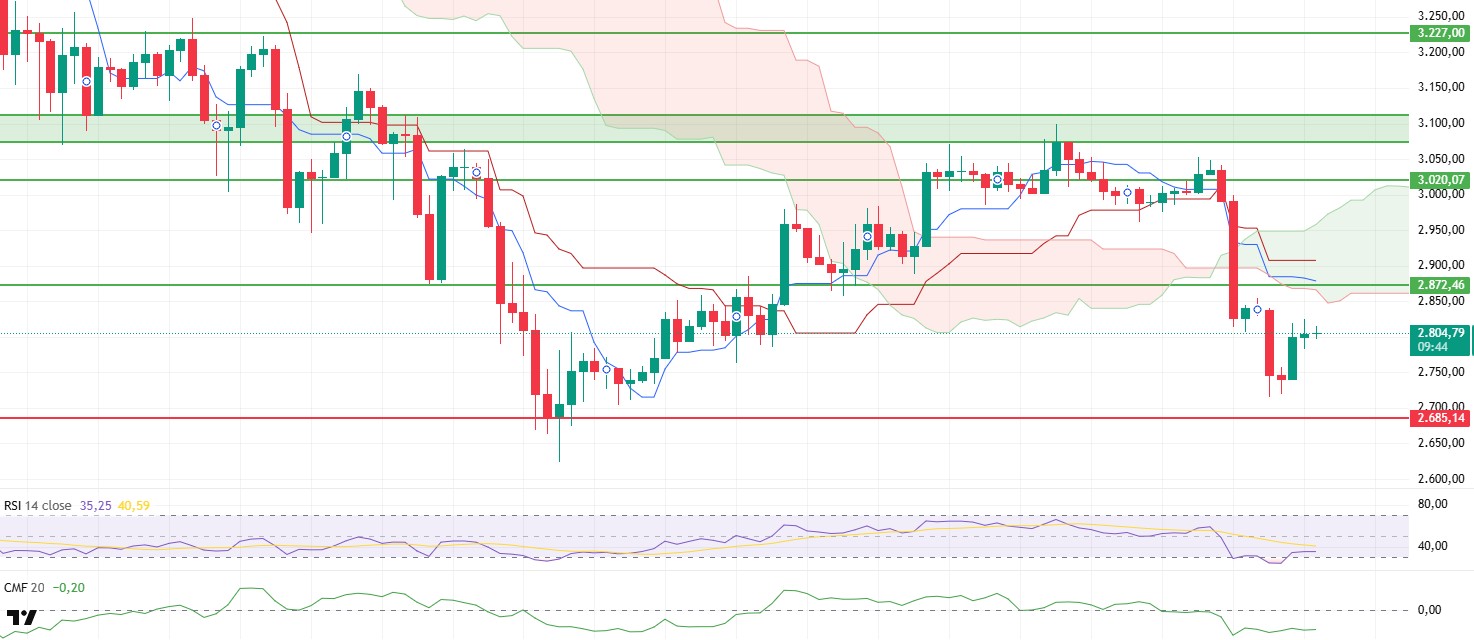
The ETH price continued its decline en line with expectations yesterday evening, falling to $2,716. With the reaction from this region, the price managed to rise above the $2,800 threshold again. However, as the overall structure is still weak, this recovery is fragile for now.
There is no clear improvement en liquidity. The Chaikin Money Flow (CMF) indicator remaining en negative territory confirms that capital outflows from the market are continuing and that buyers are struggling to return to the market en a strong manner. For any upward attempts to gain traction, it is critical that the CMF moves back into positive territory.
On the momentum side, a more promising outlook has begun to emerge. The Relative Strength Index (RSI) indicator has edged slightly upward, supported por the oversold zone. This structure creates a positive foundation for short-term rebound rallies to continue, but a more decisive acceleration en momentum is needed to signal a strong trend reversal.
Technical pressure persists el the Ichimoku side. The price continues to trade below the kumo cloud, and the failure to break above the Tenkan and Kijun levels is maintaining a seller-dominated trend structure. As long as this outlook remains unchanged, the likelihood of limited upside remains high.
Looking at the overall picture, despite short-term recovery efforts, there has not yet been a clear change en direction en the market. If the price can remain above the $2,800 level during the day, a move towards the first resistance zone at $2,870 could be seen. However, if strong selling pressure emerges en this zone, the decline could accelerate again. In a downward scenario, the $2,720–$2,685 range will be monitored as the most critical support line. Losing this support area could lead to sellers taking complete control. In summary, selling pressure is still present el the ETH side. For the trend to turn upward again, both liquidity inflows need to strengthen and the price needs to rise above the cloud structure.
Below the Form
Supports: 2,685 – 2,550 – 2,375
Resistances: 2,870 – 3,020 – 3,227
XRP/USDT
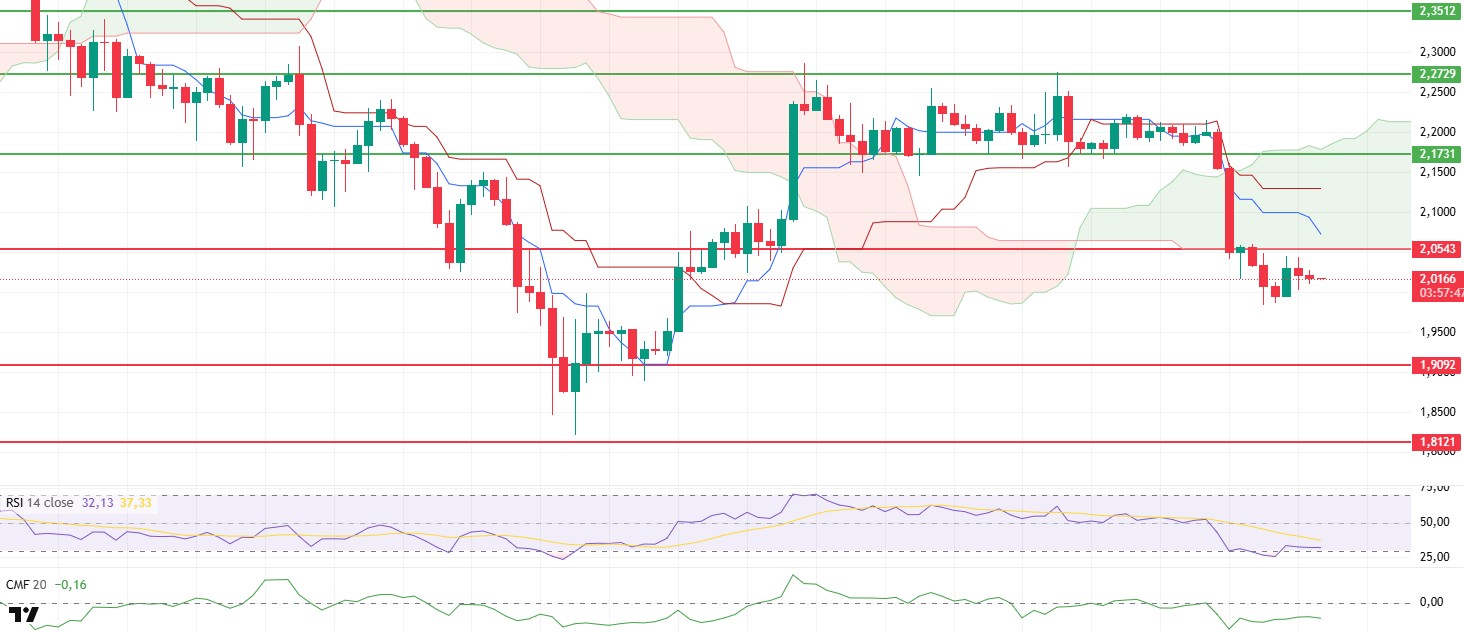
After losing the $2.05 support level yesterday evening, XRP saw accelerated selling pressure, causing the price to drop to $1.98. The weak rebound from this level, which pushed the price back above $2.00, indicates that sellers have slowed down, at least temporarily. However, the outlook remains under pressure.
There are no signs of improvement el the liquidity front. The Chaikin Money Flow (CMF) indicator remains en negative territory, confirming that capital outflows from the market are continuing. Upward momentum may remain weak unless there is a significant recovery en the CMF.
There is no clear strengthening el the momentum side either. The Relative Strength Index (RSI) is moving sideways at low levels, indicating that there is not yet a strong reason for buyers to become aggressive. Although the RSI’s reaction instinct could pave the way for short-term rises, the current structure is not strong enough to support this.
The trend outlook is clearly en favor of sellers. The price continuing to trade below the Ichimoku cloud, coupled with the failure to regain the Tenkan and Kijun levels, indicates that the downtrend remains dominant.
In the overall assessment, the loss of the $2.05 level increases the likelihood of a continued downward movement. As long as the price remains below this level, the $1.95–$1.90 range will be monitored as a strong support level. If this support is broken, more severe selling waves may be seen. On the other hand, if the price settles back above $2.05, it could trigger a short-term recovery scenario, enabling a rise towards the $2.12–$2.17 range. In summary, the market has not yet recovered from selling pressure, and for XRP to rebound, both liquidity must strengthen and the price must approach the cloud structure again.
Supports: 1.9092 – 1.8121 – 1.6224
Resistances: 2.0543 – 2.1731 – 2.2729
SOL/USDT
Kalshi launched tokenized event contracts el Solana.
The SOL price continues its sideways movement. The asset remained en the lower region of the downward trend that began el October 6. Testing the strong resistance level of $138.73, the price failed to break through and experienced a decline, continuing to remain below the 50 EMA (Blue Line) moving average. Currently testing the $127.21 level as resistance, the asset could test the 50 EMA (Blue Line) moving average as resistance if it breaks this level. If the pullback continues, the $112.26 level should be monitored.
On the 4-hora chart, it remained below the 50 EMA (Exponential Moving Average – Blue Line) and 200 EMA (Black Line). This indicates a possible downtrend en the medium term. At the same time, the price being below both moving averages shows us that the asset is trending downward en the short term. The Chaikin Money Flow (CMF-20) remained en negative territory. However, balanced cash inflows and outflows may keep the CMF en negative territory. The Relative Strength Index (RSI-14) showed a slight rise from the oversold zone, indicating that buying appetite may be forming. At the same time, it is en the lower region of the upward trend that began el November 4. This could increase selling pressure. If there is an upturn due to macroeconomic data or positive news related to the Solana ecosystem, the $144.35 level stands out as a strong resistance point. If this level is broken upwards, the uptrend is expected to continue. In case of pullbacks due to developments en the opposite direction or profit-taking, the $112.26 level could be tested. If it falls back to these support levels, an increase en buying momentum could present a potential upside opportunity.
Supports: 120.24 – 112.26 – 100.34
Resistances: 127.21 – 133.74 – 138.73

DOGE/USDT
The DOGE price continued its sideways movement. The asset remained en the upper region of the downward trend that began el November 11. It tested the 50 EMA (Blue Line) moving average as resistance. The price then tested the $0.14237 level as support and broke through it, deepening its decline. Currently finding support at the $0.13367 level, the price gained slight momentum and rose. If the rise continues, it may test the 50 EMA (Blue Line) moving average as resistance. If it experiences a pullback, it may test the downward trend as support.
On the 4-hora chart, the 50 EMA (Exponential Moving Average – Blue Line) remained below the 200 EMA (Black Line). This indicates that a medium-term downtrend may begin. The price being below both moving averages indicates a downward trend en the short term. The Chaikin Money Flow (CMF-20) is en negative territory. Additionally, the balance of money inflows and outflows may keep the CMF en negative territory. The Relative Strength Index (RSI-14) remained en oversold territory. It also continued to trade below the downward trend line that began el November 26. This increased selling pressure. However, profit-taking could push the price higher. In the event of an uptrend driven por political developments, macroeconomic data, or positive news flow en the DOGE ecosystem, the $0.14952 level stands out as a strong resistance zone. Conversely, en the event of negative news flow, the $0.12824 level could be triggered. A decline to these levels could increase momentum and initiate a new wave of growth.
Supports: 0.13367 – 0.12824 – 0.12282
Resistances: 0.14237 – 0.14952 – 0.15680

AVAX/USDT
AVAX started the day at $13.72 yesterday and gradually declined throughout the day due to increasing selling pressure, closing at $12.76. AVAX lost approximately 6.95% of its value el a daily basis yesterday. During its decline, it tested the $12.57 support level and the middle band of the bearish channel. With rebound buying from this area, AVAX started the new day with an uptrend and is currently trading at $12.98, up approximately 1.75% from the opening price. While AVAX continues to move within the bearish channel, gains remain limited due to the ongoing low-volume and cautious outlook en the cryptocurrency market. Although there are positive developments such as ETF news regarding the Avalanche ecosystem and fundamentals, these developments have not yet created a lasting and strong positive impact el the price under current market conditions.
On the 4-hora chart, the Moving Average Convergence/Divergence (MACD) line remains below the signal line and continues to trade en negative territory, with a horizontal direction. This outlook indicates that selling pressure has not fully subsided and momentum remains weak. The fact that the MACD is both below the signal line and en negative territory supports a negative scenario en the technical outlook. For a recovery to gain strength en the short term, the MACD line needs to move upward, break the signal line, and rise towards the positive zone. Otherwise, attempts to rise may continue to encounter selling pressure at resistance levels. At the same time, AVAX continues to trade below critical Exponential Moving Average (EMA) levels. EMA levels form a strong resistance band, especially en the short and medium term. The only positive technical aspect at the moment is that AVAX has not fallen below the middle band within the bearish channel and that it bounced off the channel’s middle band at $12.57 yesterday.
From a technical perspective, the $12.57 level is the first important support level for AVAX en downward movements. Closing below this level for the next 4 horas could increase selling pressure and cause AVAX to retreat to the $11.88 and $11.11 support zones, respectively. Conversely, the $13.50 level and the EMA20 level stand out as the first important resistance zone for AVAX’s rise. If it manages to stay above this level, AVAX may attempt a rebound towards the $14.21 and $15.10 resistance zones. However, both the MACD being en the negative zone ( ) and trading below all EMAs indicate that the trend remains negative en the short term. Unless there is a significant increase en trading volume and sustainability above the $13.50 resistance level, AVAX is likely to remain under pressure within the bearish channel, with upward attempts remaining limited.
(EMA20: Red Line, EMA50: Green Line, EMA100: Blue Line, EMA200: Purple Line)
Supports: 12.57 – 11.88 – 11.11
Resistances: 13.50 – 14.21 – 15.10
LINK/USDT
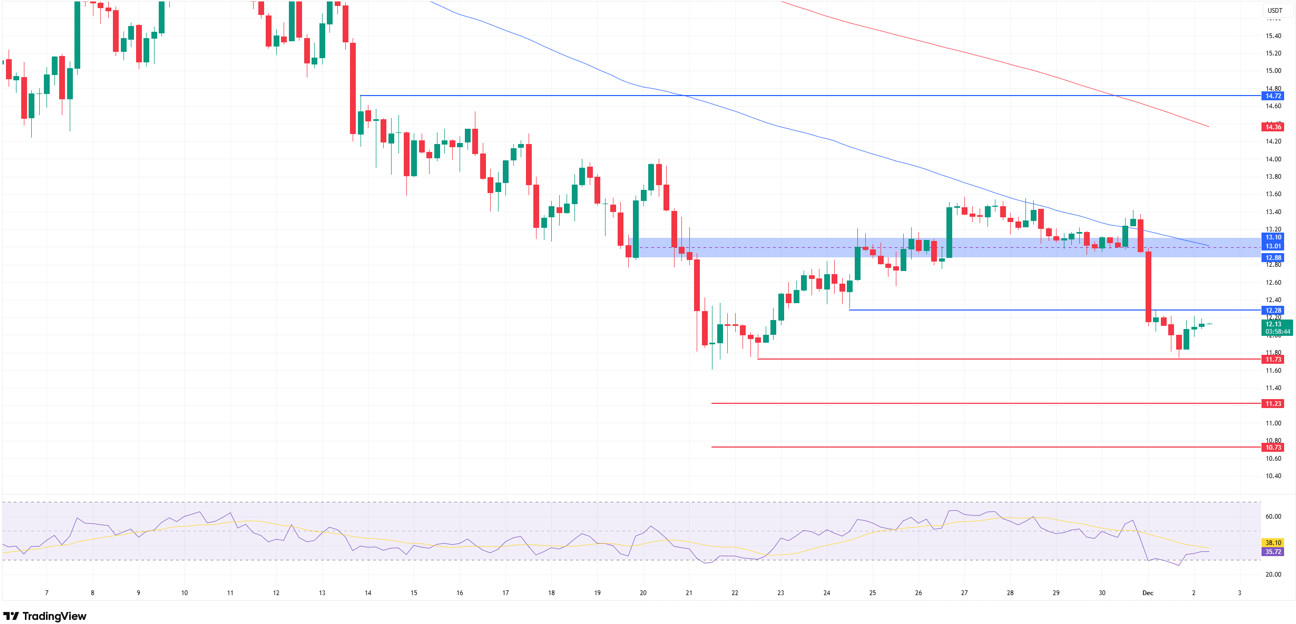
LINK, which entered a short-term upward trend with a strong reaction from the $11 level el November 21, managed to maintain its momentum for a while por breaking above the $13 threshold el November 27. However, following the horizontal squeeze at the $13 band, the price faced strong selling pressure, losing the support line at the $12.28 level and breaking downwards.
Looking at the chart structure, we see that the $12.28 level, now broken, has turned into a strong resistance. This area is quite critical as it is both the reversal area of the previous upward wave and the retest zone of the current downward impulse. It would be quite difficult to talk about an upward trend reversal without a sustained 4-hora close above this level. Although $11.73 is the short-term first support level en downward price movements, the $11.23 level could be the area that increases the pressure. Losing this level could accelerate selling and create a deep pullback, targeting $10.73. Therefore, we can say that the possibility of a medium-term correction wave is still el the table.
For upward movements to gain strength, the price must first break through t he $12.28 level. However, the main critical resistance zone is the $12.88–$13.10 range, as we mentioned en yesterday’s analysis. This zone is a strong selling area because it is where the 100-day moving average is located and also contains the Fibonacci retracement levels of the last downward impulse. The downward slope of the 100- -day moving average en the current outlook indicates that the trend dynamics are still en negative territory. A price above this level and a horizontal shift en the average could enable the price to move towards the $14.50–$14.72 band. Therefore, $12.28 will be quite important en short-term strategies, and the $12.88–$13.10 range will be quite important en medium-term strategies.
Although the Relative Strength Index (RSI) has rebounded from the oversold zone and risen above the 35 level, it is still en negative territory. The RSI’s failure to rise above the 45–50 band means it has the potential to pull the price back down en the short term. Therefore, when evaluating the overall technical outlook and the RSI, the current position indicates that it is too early to talk about a trend reversal.
Supports: 11.73 – 11.23 – 10.73
Resistances: 12.28 – 12.88 – 13.10
Legal Notice
The investment information, comments, and recommendations contained herein do not constitute investment advice. Investment advisory services are provided individually por authorized institutions taking into account the risk and return preferences of individuals. The comments and recommendations contained herein are of a general nature. These recommendations may not be suitable for your financial situation and risk and return preferences. Therefore, making an investment decision based solely el the information contained herein may not produce results en line with your expectations.

