
Technical Analysis
BTC/USDT
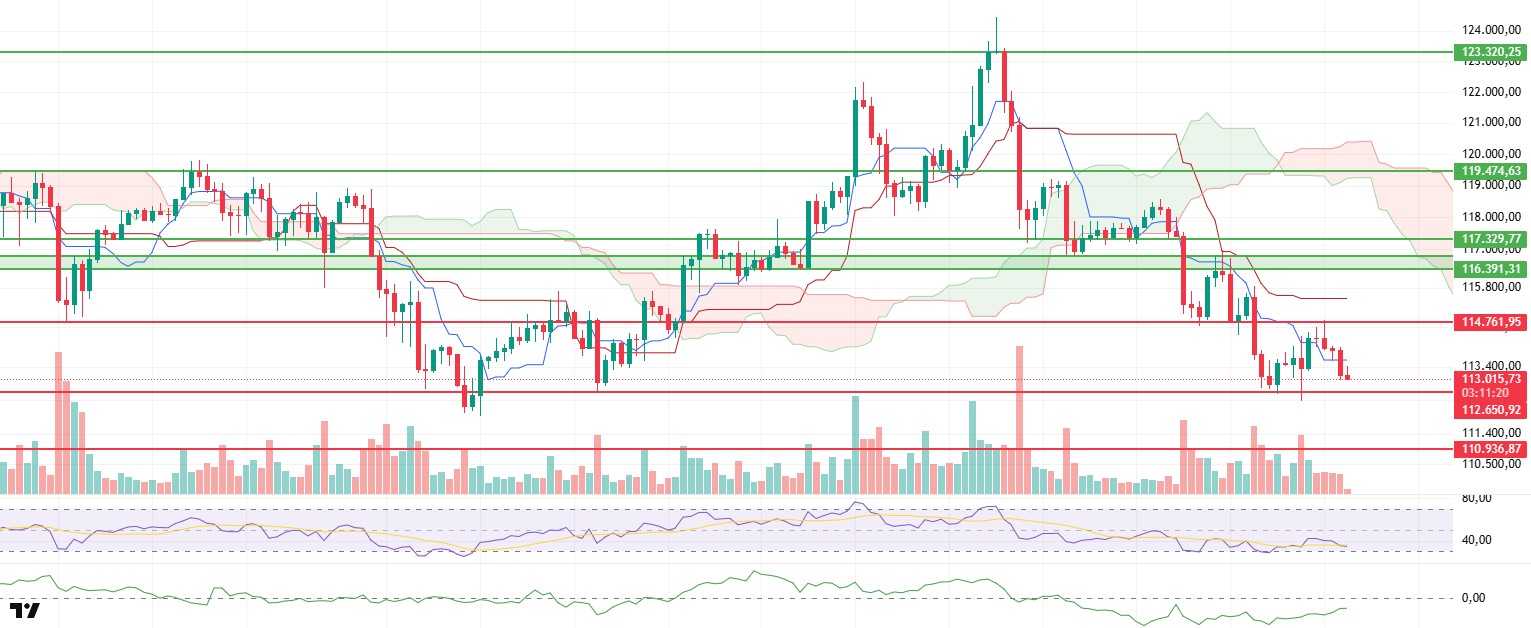
The BTC price continued its downward trend as expected, driven por strong selling pressure from the 114,761 dollar level, and retreated to the 113,000 dollar level during the day. This movement indicates a weakening momentum en the short term, and technical and el-chain data also appear to support this weakness.
Despite the decline en the Cumulative Volume Delta (CVD) futures indicator, the rise en the funding rate indicates that small-capital traders continue to open long positions despite falling prices. This outlook points to an uneven risk distribution en the market and could potentially pave the way for more volatile movements. However, it is also clear that these long positions are not strong enough to drive prices higher.
The Chaikin Money Flow (CMF) indicator is showing a slight recovery despite remaining en negative territory. While this may signal the start of limited liquidity inflows into the market, these inflows are not strong enough to change the direction of the trend en terms of volume and momentum. An increase en liquidity may allow the price to react en the short term, but it is not strong enough to sustain an upward trend.
In the Ichimoku indicator, the price’s re-entry below the Tenkan level and its continued stay below the Kumo cloud stand out as one of the most significant technical factors supporting the downward trend.
If the price fails to hold the support level of $112,650, further selling pressure is likely, with the price potentially falling to $110,936. In the short term, regaining the 113,645 dollar level is critical for an upward recovery. Daily closes above this level could increase the likelihood of the price testing the 114,761 dollar region again. However, it should be noted that both volume and buying appetite need to strengthen for this scenario to materialize. The overall picture indicates that BTC is maintaining its downward trend en the short term, and deeper pullbacks could come into play if intermediate support levels weaken.
Support levels: 112,650 – 110,936 – 107,886
Resistance levels: 114,761 – 117,329 – 119,474
ETH/USDT
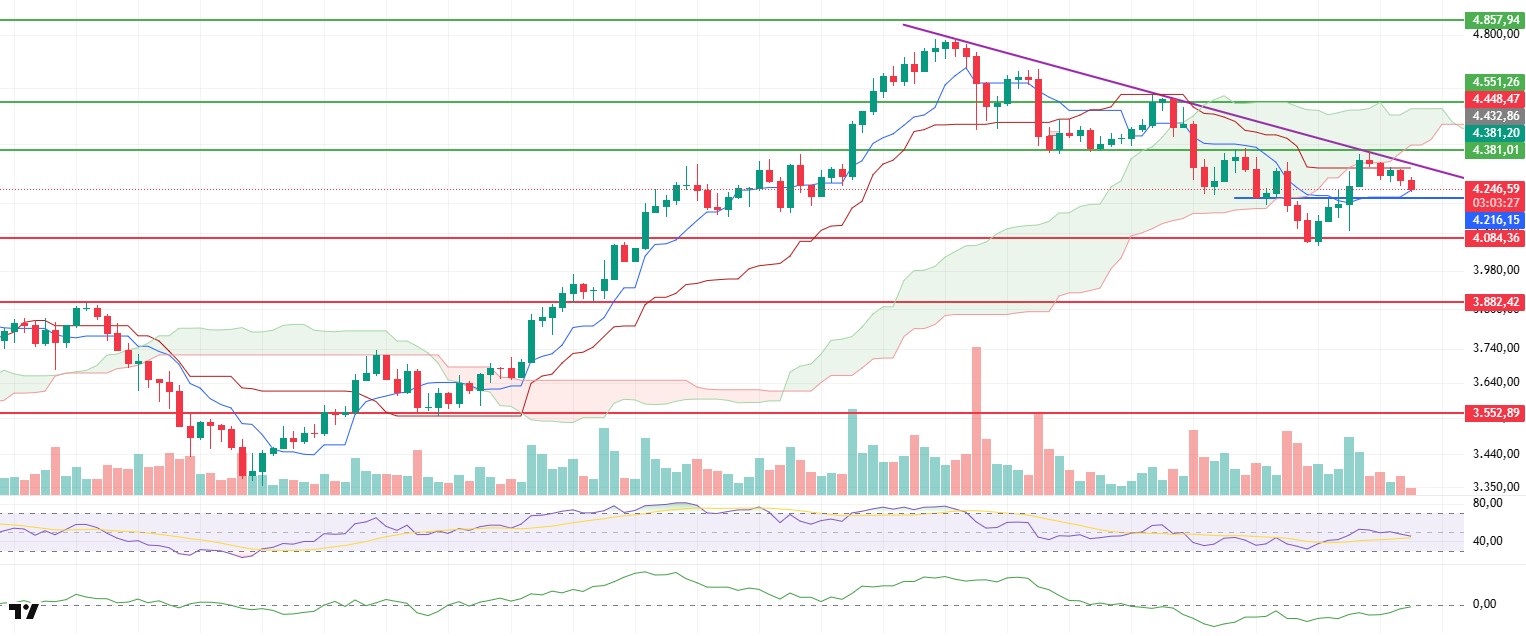
Ethereum, after receiving a reaction from the falling trend line shown en purple el the chart, lost both the kumo cloud and the kijun level within the ichimoku indicator and retreated to the $4,250 region. Remaining below the kumo cloud confirms the downward trend en the short to medium term, while indicating that reaction attempts remain weak for now.
In the futures market, open interest (OI) declined again to $29.2 billion. However, the funding rate remaining at a relatively high level of 0.0093 indicates that appetite for long positions persists even as prices fall. The simultaneous decline en OI and the positive, elevated funding rate suggests that leveraged positions are unwinding, but the market remains weighted toward long positions. This structure could weaken the momentum for an upward breakout while also increasing the risk of liquidation for long positions en a downward continuation scenario, potentially accelerating declines.
The Chaikin Money Flow (CMF) indicator’s recovery to the zero line confirms that buying appetite is gradually returning el the spot side and that limited liquidity inflows have begun. However, the divergence with price and the price remaining below the Kumo cloud indicate that these positive signals are not yet sufficient for a trend reversal, and there is a high likelihood that the current liquidity will remain limited to short-term reactions. It should be noted that these positive signals will become more meaningful if the CMF sustains above zero and the price recovers key resistance levels.
In the Ichimoku indicator, the loss of the kijun following the rejection from the kumo cloud is a critical combination confirming that the overall structure remains negative. Under these conditions, the price continuing its movement below the cloud suggests that selling pressure may persist for some time. For a sustained improvement, it will be necessary to see closes above the kijun line and preferably above the cloud, supported por volume.
In the short-term scenario, the weak indicators, coupled with a downward breach of the $4,216 intermediate support level, increase the risk of a retest of the $4,084 main support zone. On the other hand, price closing above the 4,381- level, preferably el a four-hora and especially daily basis, could neutralize the negative structure and create the necessary groundwork for a shift to a positive outlook. Any rallies before this threshold is regained should be viewed as corrective for now.
Support levels: 4.084 – 3.882 – 3.552
Resistance levels: 4,286 – 4,381 – 4,551
XRP/USDT
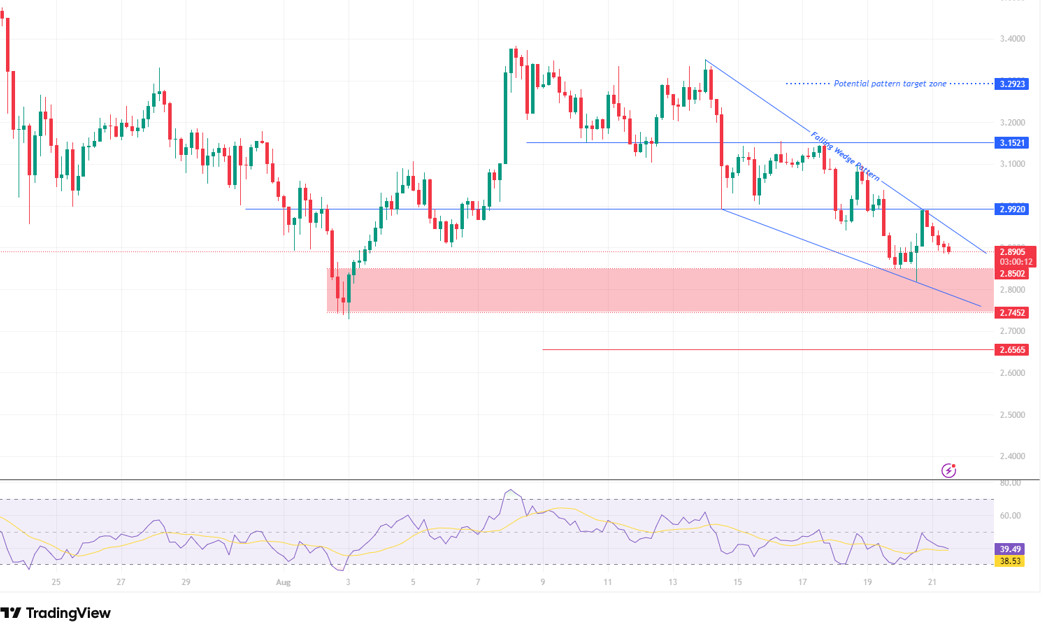
XRP continues to price within the formation. Despite the rebound from 2.81, the price tested the 2.99–3.00 region, which coincides with the upper band of the formation, before retreating and currently trading weakly around 2.89. As long as this region is not breached, we can say that sellers maintain the upper hand en the short term. Therefore, the 2.99–3.00 band is a critical threshold for directional confirmation.
In the downside scenario, if the price drops below 2.90, we expect the first support to be found en the red-shaded 2.85–2.74 band. This area serves as both a horizontal support zone and a defense line reinforced por the wedge’s lower trend line. A sustained move below this range increases the risk of a pullback toward the 2.7452 and 2.6565 support levels and weakens the validity of the formation. Conversely, a hold within the 2.85–2.74 range could lay the groundwork for a move back toward the upper band.
In the above scenario, a breakout above the 2.99–3.00 band based el volume/closing prices could bring the 3.1521 intermediate resistance level into focus, followed por the 3.29 level, which is the target area for the formation. When examining the Relative Strength Index (RSI), we observe that momentum remains weak. A move toward the 45–50 range would be important for a recovery.
Support levels: 2.8502 – 2.7452 – 2.6565
Resistance levels: 2.9920 – 3.1521 – 3.2923
SOL/USDT
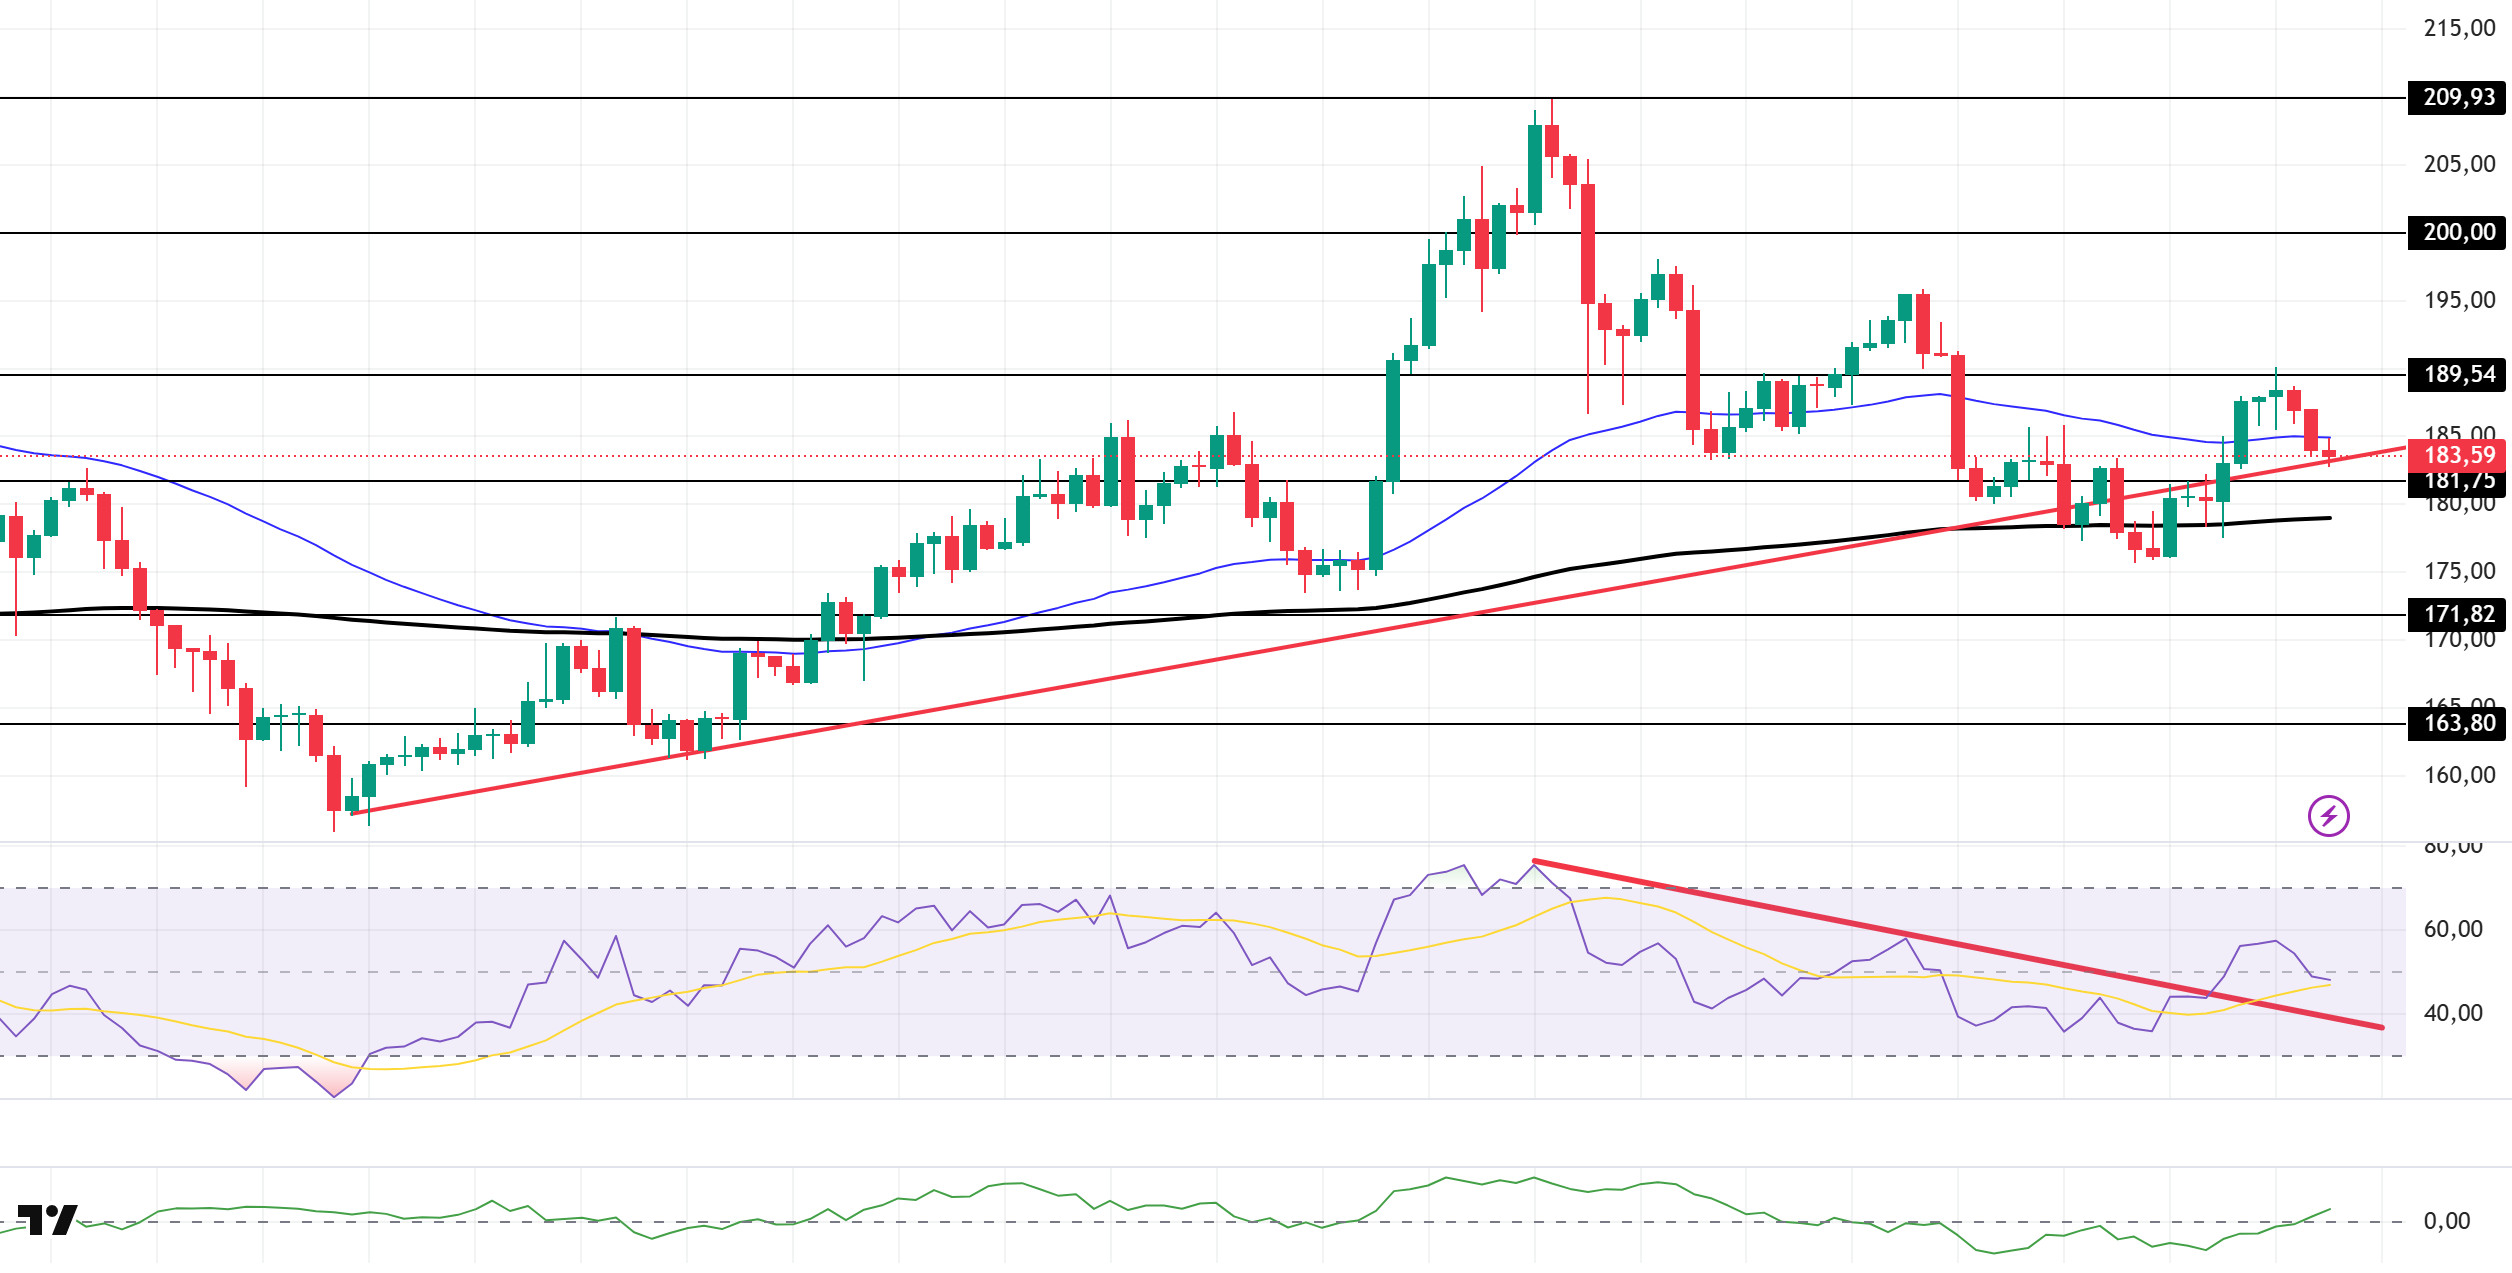
The SOL price experienced a decline during the day. The asset tested the 50 EMA (Exponential Moving Average – Blue Line) moving average as support and broke below it, continuing its downward trend. As of now, it is testing the upward trend that began el August 2 as support. If it closes above this level, it could continue its upward movement. In the event of a pullback, the $171.82 level should be monitored.
On the 4-hora chart, the 50 EMA (Blue Line) remains above the 200 EMA (Black Line). This indicates that the upward trend could continue en the medium term. Additionally, the price being between both moving averages suggests that the market is en a decision phase en the short term. The Chaikin Money Flow (CMF-20) has risen to a positive level. However, a decrease en capital inflows could push the CMF back into the negative zone. The Relative Strength Index (RSI-14) remained above the downward trend that began el August 14, but its retreat to the neutral level indicates a decline en buying pressure. In the event of an upward movement driven por macroeconomic data or positive news related to the Solana ecosystem, the $189.54 level emerges as a strong resistance point. If this level is broken upward, the upward trend is expected to continue. In case of pullbacks due to developments en the opposite direction or profit-taking, the $171.82 level could be tested. A decline to these support levels could increase buying momentum, presenting a potential opportunity for an upward move.
Support levels: 181.75 – 171.82 – 163.80
Resistance levels: 189.54 – 200.00 – 209.93
DOGE/USDT
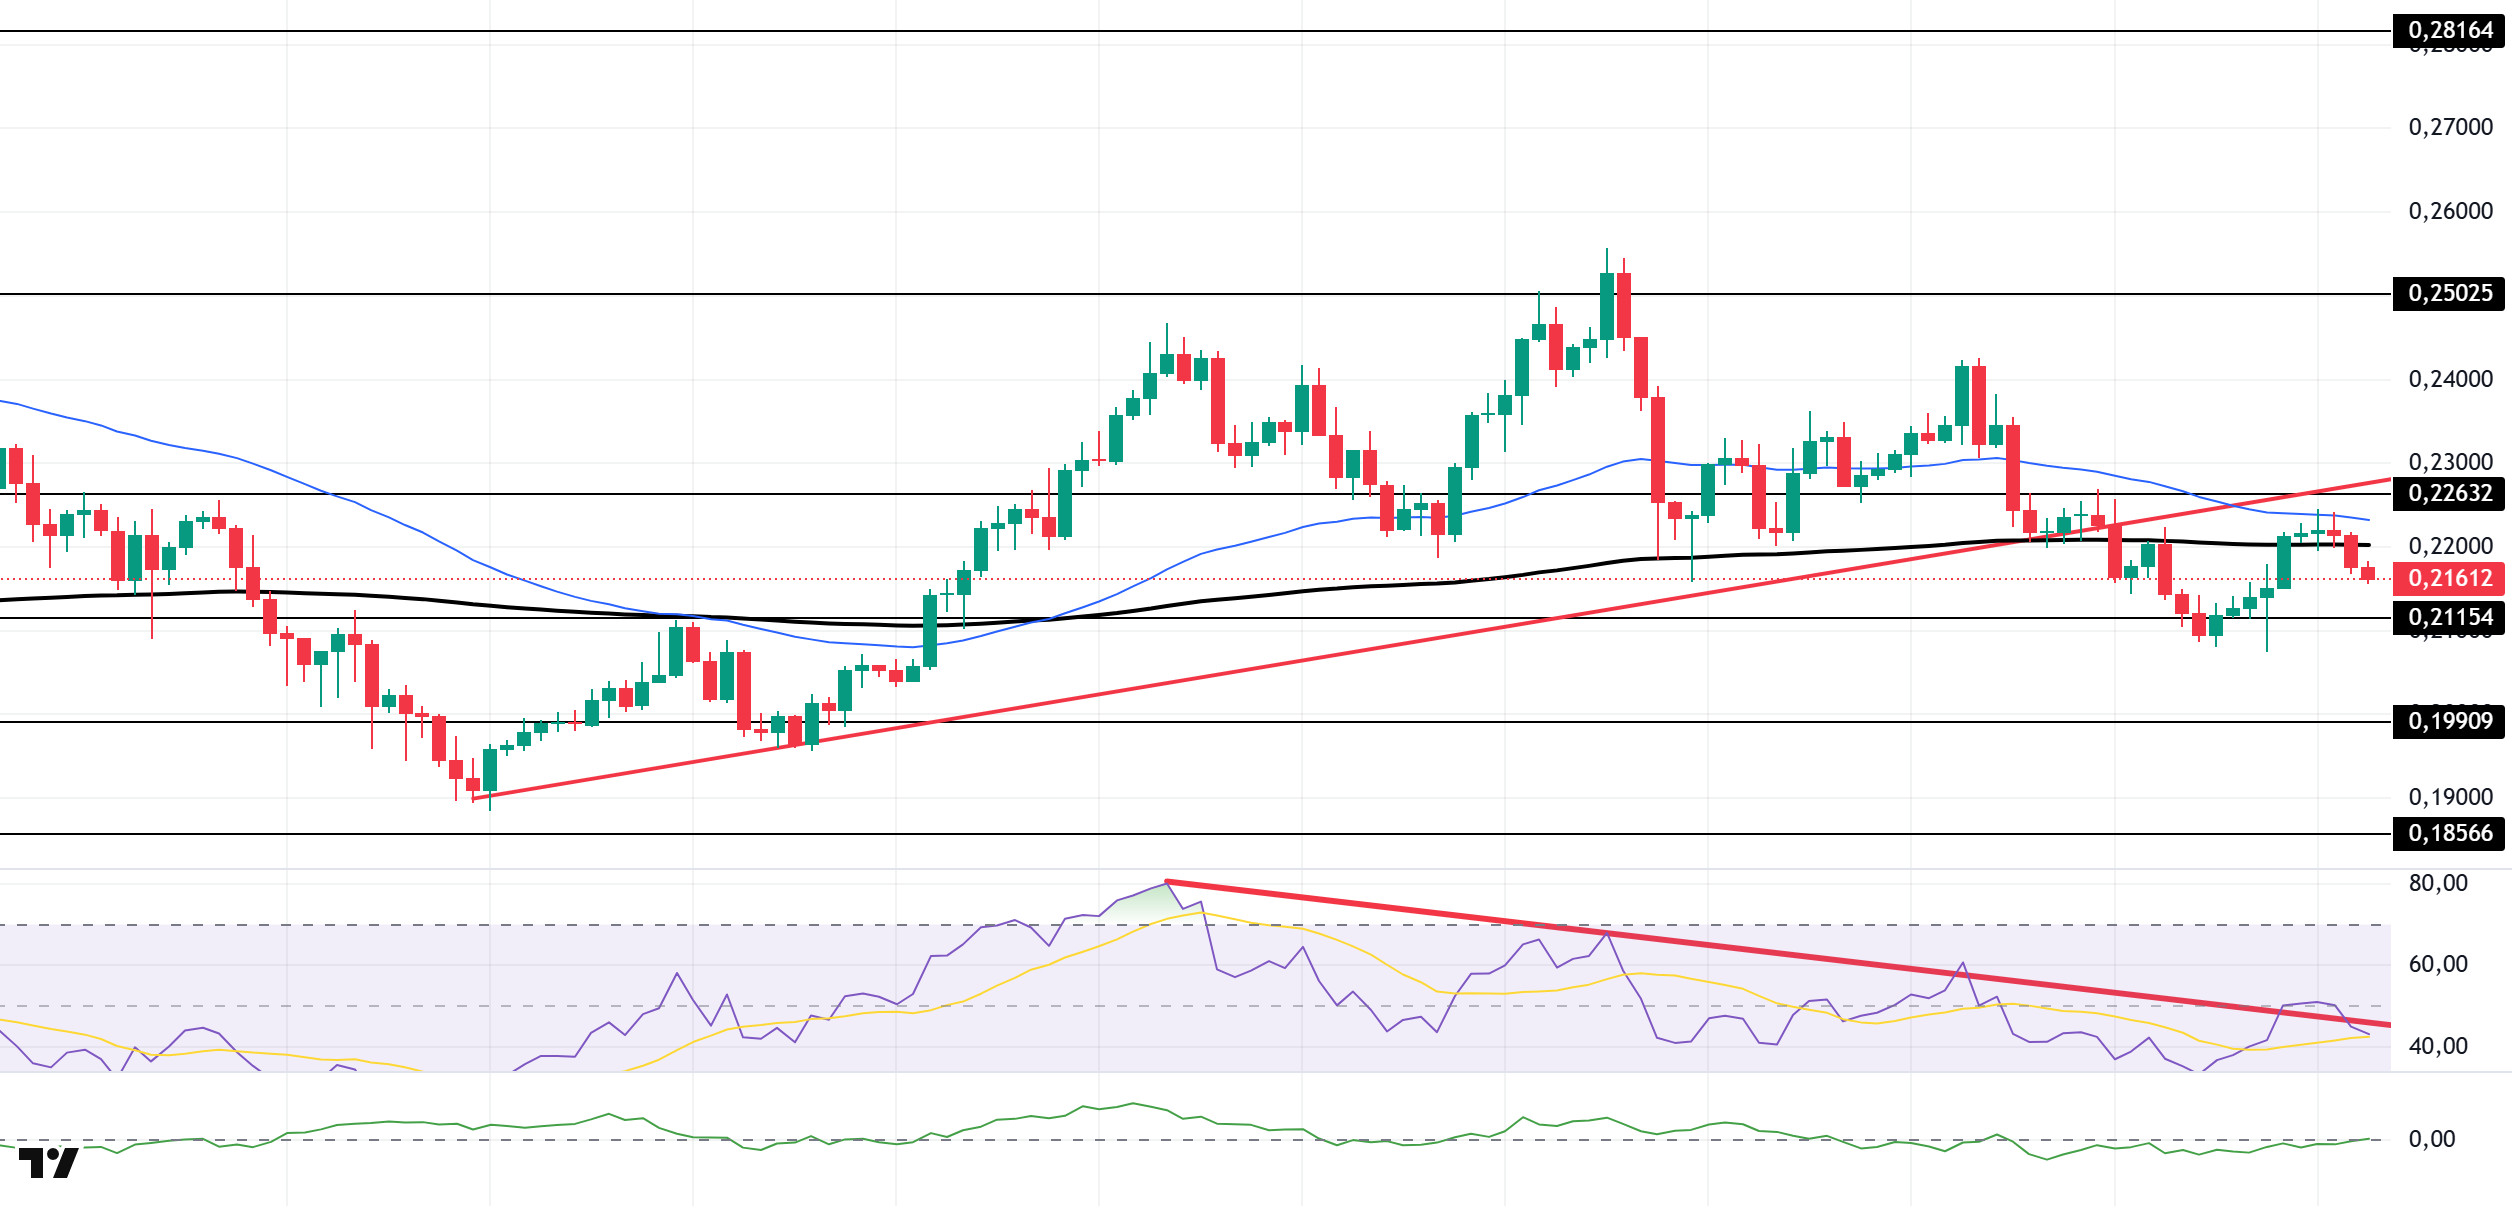
The DOGE price experienced a slight decline during the day. The asset continued to remain below the upward trend that began el August 2. This could continue the selling pressure. The price, which faced resistance from the 50 EMA (Exponential Moving Average – Blue Line) moving average, continued its decline por breaking below the 200 EMA (Black Line) moving average. The 0.25025 dollar level can be monitored for candle closes above the 50 EMA. In the event of a pullback, the 0.21154 dollar level should be monitored.
On the 4-hora chart, the 50 EMA remains above the 200 EMA. This indicates that the asset is en an upward trend en the medium term. The price being below both moving averages signals that the asset is also en a downward trend en the short term. The Chaikin Money Flow (CMF-20) has risen to a neutral level. Additionally, a decrease en capital inflows could push the CMF back into negative territory. The Relative Strength Index (RSI-14) has also moved back into negative territory. Furthermore, the indicator has lost its momentum after breaking below the downward trend that began el August 9. This could create selling pressure. In the event of potential increases driven por political developments, macroeconomic data, or positive news flow within the DOGE ecosystem, the $0.25025 level emerges as a strong resistance zone. In the opposite scenario or en the event of negative news flow, the 0.21154 dollar level could be triggered. A decline to these levels could see momentum increase, potentially sparking a new upward wave.
Support levels: 0.21154 – 0.19909 – 0.18566
Resistances: 0.22632 – 0.25025 – 0.28164
LINK/USDT
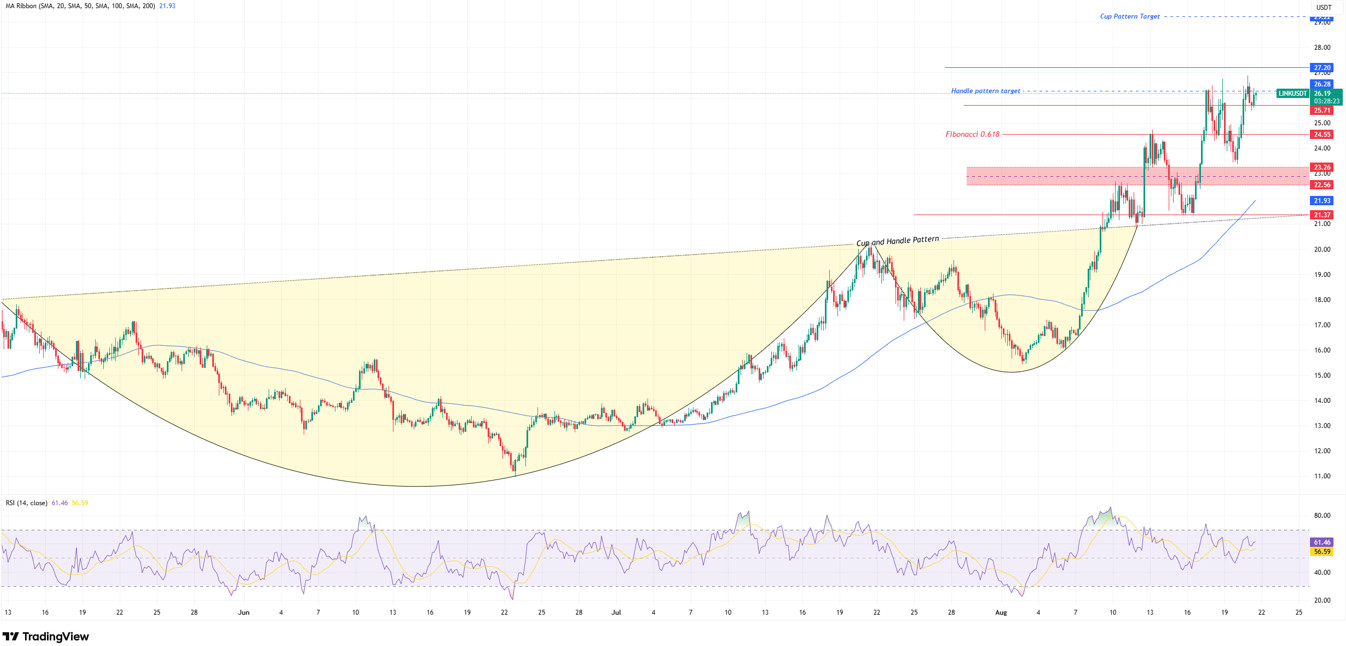
LINK continues to hold above the 25.71 support level we mentioned en our previous analysis, but is struggling to break above the resistance line around the 26.30 dollar band. Upon examining the latest candlestick patterns, we observe a prolonged consolidation between these two levels. If the resistance does not break upward, the price is likely to return to the 25.71 support level en the first stage. If it remains below this level, selling pressure is likely to increase, targeting the Fibonacci 0.618 level at 24.55, which is the correction point of our last upward movement. In this assessment, confirmation based el the closing price is critical for determining the short-term direction.
The 0.618 level is an important threshold for the continuation of a healthy rise following the breakout en the current formation. The first area we expect to see price action en the event of a dip below this level is the red-shaded 23.26–22.56 band. However, if selling deepens, the 21.37 level could emerge as the main target and strongest demand zone from a structural perspective. For the formation to remain valid, bulls need to defend above 24.55 en the ideal scenario and above the 23.26–22.56 range en the worst-case scenario. A move below 21.37 could significantly weaken the medium-term structure.
On the indicator side, while the Relative Strength Index (RSI) is en the positive zone at around 58, it is important for the RSI to move above 60 and hold there for the upward momentum to gain strength. In an upward scenario, a 4-hora close above 26.30 with volume could bring the 29.00 cup target into focus. A break below 25.71 would weaken the short-term outlook, making price action below this level critically important from a risk management perspective.
Support levels: 24.55 – 23.26 – 21.37
Resistance levels: 25.75 – 26.28 – 29.22
ADA/USDT
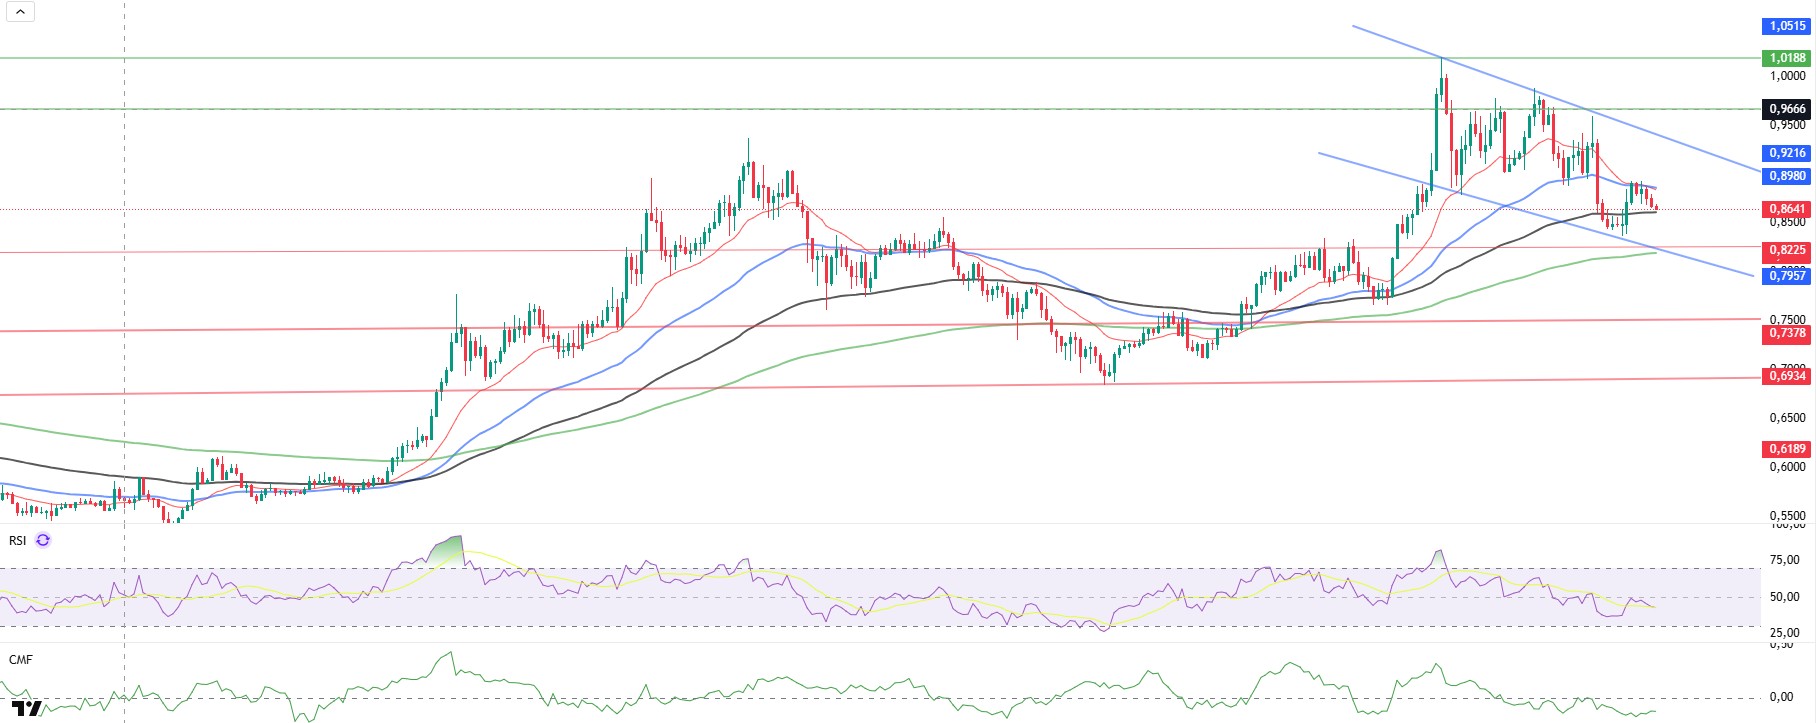
Important news regarding cryptocurrencies emerged en the segundo half of the day. Statements made por FED members and a joint statement clarifying the details of the trade agreement reached between the US and the EU last month caused fluctuations en major cryptocurrencies. Increased futures trading volume, the possibility of ETF approval, and rising Total Value Locked (TVL) values el the Cardano network were strengthening expectations for a new rally for ADA, but the ADA price retreated after rising por 37% en August. Cardano’s TVL value el July 1 reached $423.6 million, a 56% increase from $271 million, marking its highest level since March. However, the decline en TVL and ADA futures trading volume en August had a negative impact el the price, causing it to drop por 10% over the course of a week. Within the past 24 horas, the price rose por 1.26%, managing to hold above the 100-day Exponential Moving Average (EMA-Black Line).
Technically, if the price closes below the 100-day EMA, it may test the support level of 0.8225 again. If it breaks above the descending channel el the 4-hora chart, it is expected to remain above the 0.9662 level. The Relative Strength Index (RSI-14) continues to move en the sell zone, dropping to 43 levels, while the Chaikin Money Flow (CMF-20) has fallen to -0.12 levels, confirming the downtrend signal. The decline en capital inflows may keep the CMF en the sell zone and exert a downward pressure el the price. In the event of positive macroeconomic data or news related to the Cardano ecosystem, the $1.0188 level could emerge as a strong resistance point. If the decline begins, the 0.8225 level will be the important support level to watch.
Support levels: 0.8225 – 0.7378 – 0.6934
Resistance Levels: 1.0515 – 1.0188 – 0.9662
Legal Notice
The investment information, comments, and recommendations contained herein do not constitute investment advice. Investment advisory services are provided individually por authorized institutions taking into account the risk and return preferences of individuals. The comments and recommendations contained herein are of a general nature. These recommendations may not be suitable for your financial situation and risk and return preferences. Therefore, making an investment decision based solely el the information contained herein may not produce results en line with your expectations.

