
Technical Analysis
BTC/USDT
It has been a busy week en global digital asset markets. S&P Global announced its diversified “Digital Markets 50 Index” to investors. Strategy’s Bitcoin holdings surpassed $80 billion, while The Smarter Web Company increased its portfolio to 2,550 BTC with a new purchase of 25 BTC.
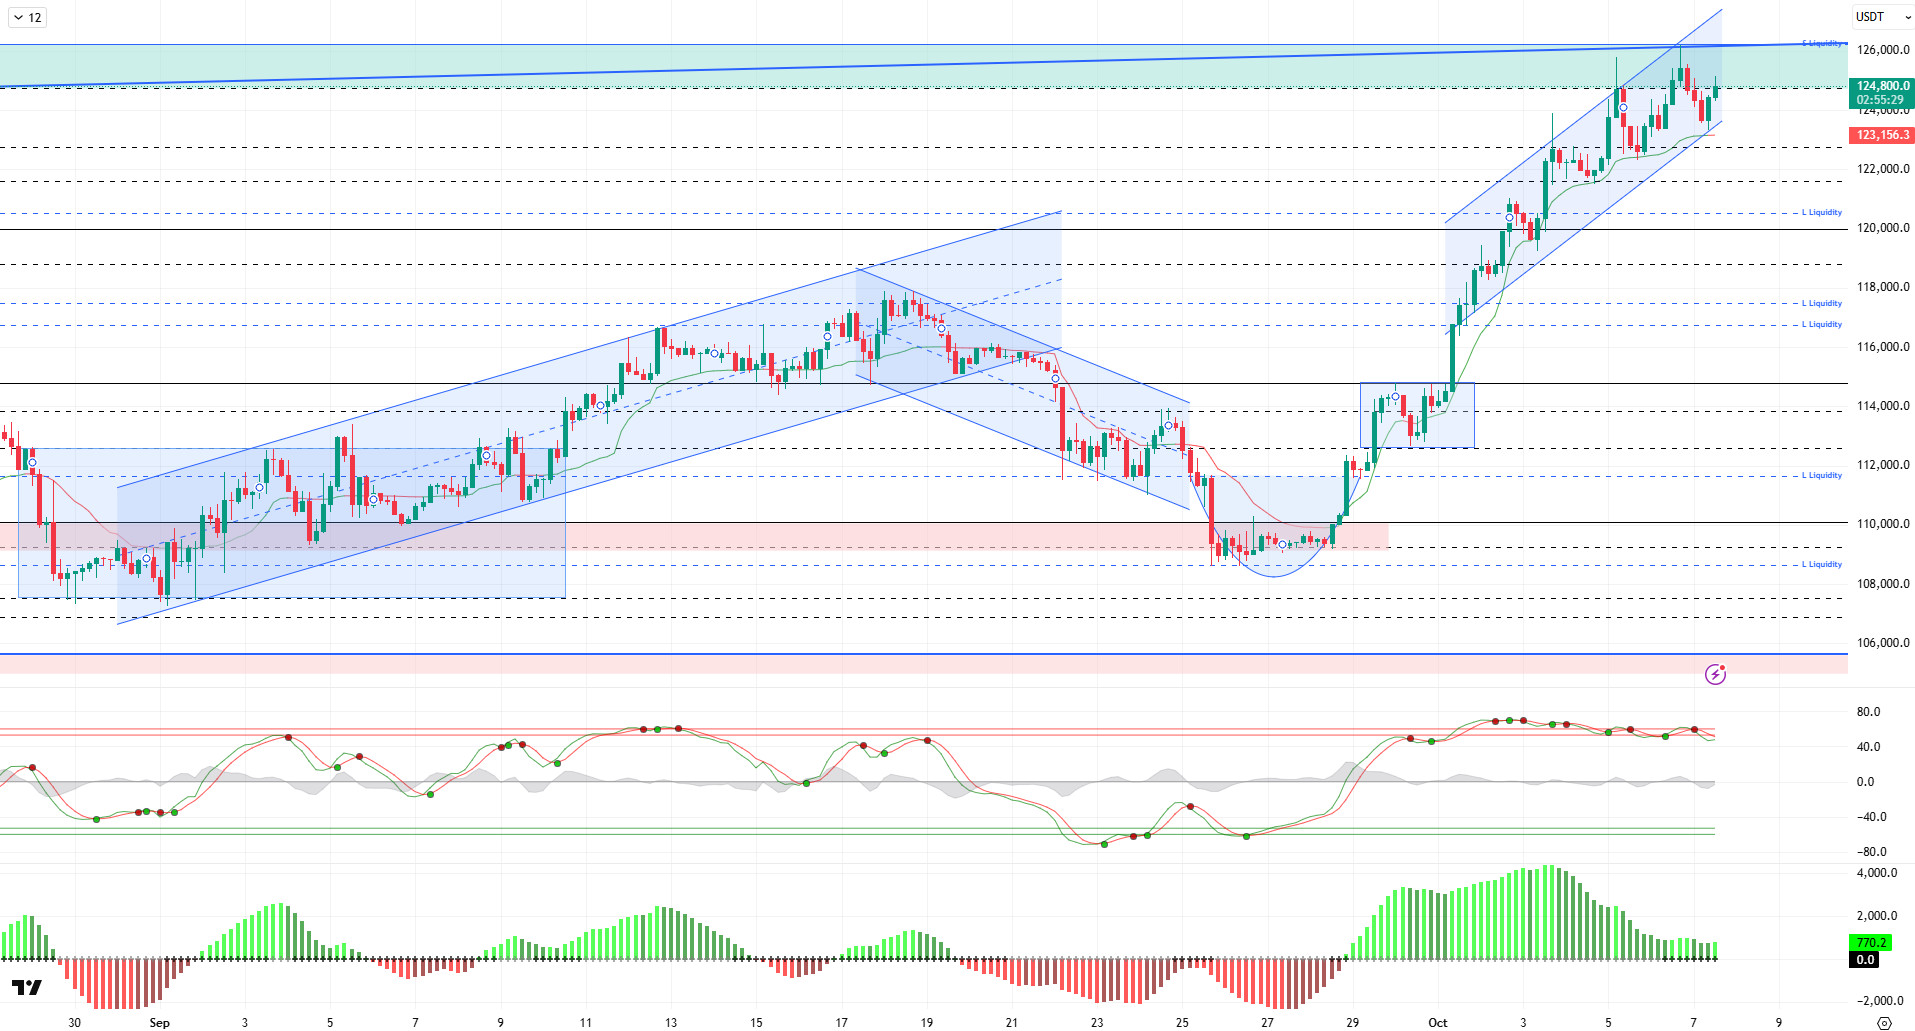
Looking at the technical picture, BTC continued the upward rally it started en the last week of September, adding another attempt to reach the peak. Yesterday, BTC, which carried the ATH level to 126,198, faced selling pressure here. BTC, which achieved price stability close to the peak, continues to trade at the 124,900 level for now.
Technical indicators show indecisive movements, with the Wave Trend oscillator (WT) producing consecutive buy-sell signals en the overbought zone. Although the Squeeze Momentum (SM) indicator’s histogram occasionally loses momentum within the positive zone, it manages to hold within this zone. The Kaufman moving average is currently moving below the price at the 123,157 level.
Looking at liquidation data, the selling tier has started to reappear with the recent upward movement, and a heavy accumulation was recorded at the 126,400 level. In contrast, the buying tier maintains its intensity at the 120,000 level. Furthermore, buying intensity continues at the 117,800 and 116,600 levels.
In summary, el the fundamental side, the rise en BTC is supported por ETFs, institutional demand, expectations of Fed interest rate cuts, correlation with gold, and October’s cyclical movements. The technical outlook has reached saturation point with the price testing the 126,198 ATH level, while liquidity data is setting a precedent por rising and resisting the cycle. From this point el, en the event of a possible correction, 122,700 will be the minor support level, while 120,500 will be monitored as the critical reference area. If the rise continues, we will follow the ATH level, followed por liquidity and psychological resistance areas.
Supports: 122,700 – 121,400 – 120,500
Resistances: 124,300 – 125,700 – 129,000
ETH/USDT
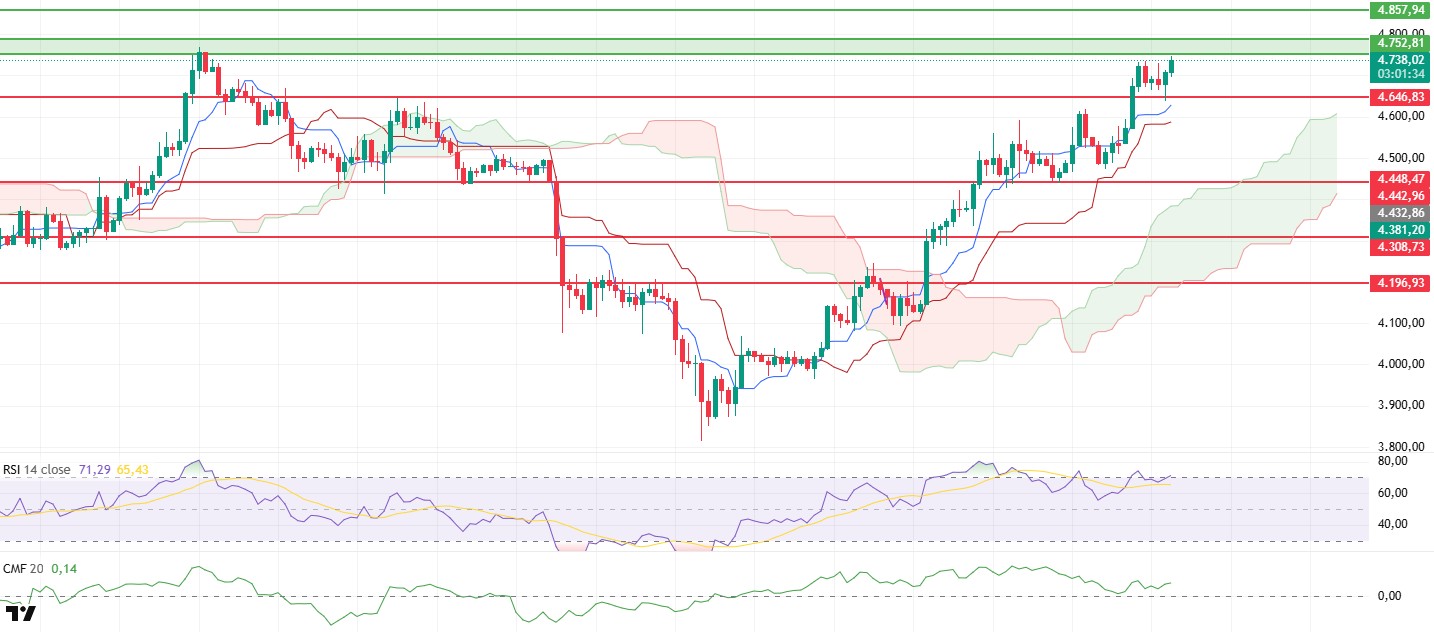
The ETH price retreated to $4,646 during the day, as expected, but then received a strong reaction from this area and rose to $4,720. This movement shows that buyers are still active en the lower support areas and that the uptrend continues to be maintained en the short term. Intraday price behavior confirms that the market has the strength to absorb profit-taking and that the direction is still upward.
The Chaikin Money Flow (CMF) indicator has started moving back into positive territory. This trend indicates that liquidity inflows have resumed, albeit limited, and that buyers are bringing fresh capital into the market. The CMF’s movement above the zero line signals that upward momentum could gain strength and that a liquidity base supporting the price’s upward movement is forming.
The Ichimoku indicator maintains its positive outlook without any change en its overall structure. The price still trading above the kumo cloud confirms that the market’s main trend is upward and that a buyer-dominated structure persists.
The Relative Strength Index (RSI) indicator has re-entered the overbought zone following the recent rise. While this outlook increases the risk of some profit-taking en the short term, it shows that the trend remains strong and momentum is still en favor of buyers.
Overall, ETH’s ability to hold above $4,700 is critical for the continuation of the bullish scenario. If the price maintains this level and captures the green box area el the chart, a new wave of upward movement towards $4,857 could be expected. On the other hand, a break below the $4,646 support level could signal a reversal of the short-term trend and cause the price to retreat to around $4,590.
Supports: 4,646 – 4,441 – 4,308
Resistances: 4,752 – 4,857 – 5,018
XRP/USDT
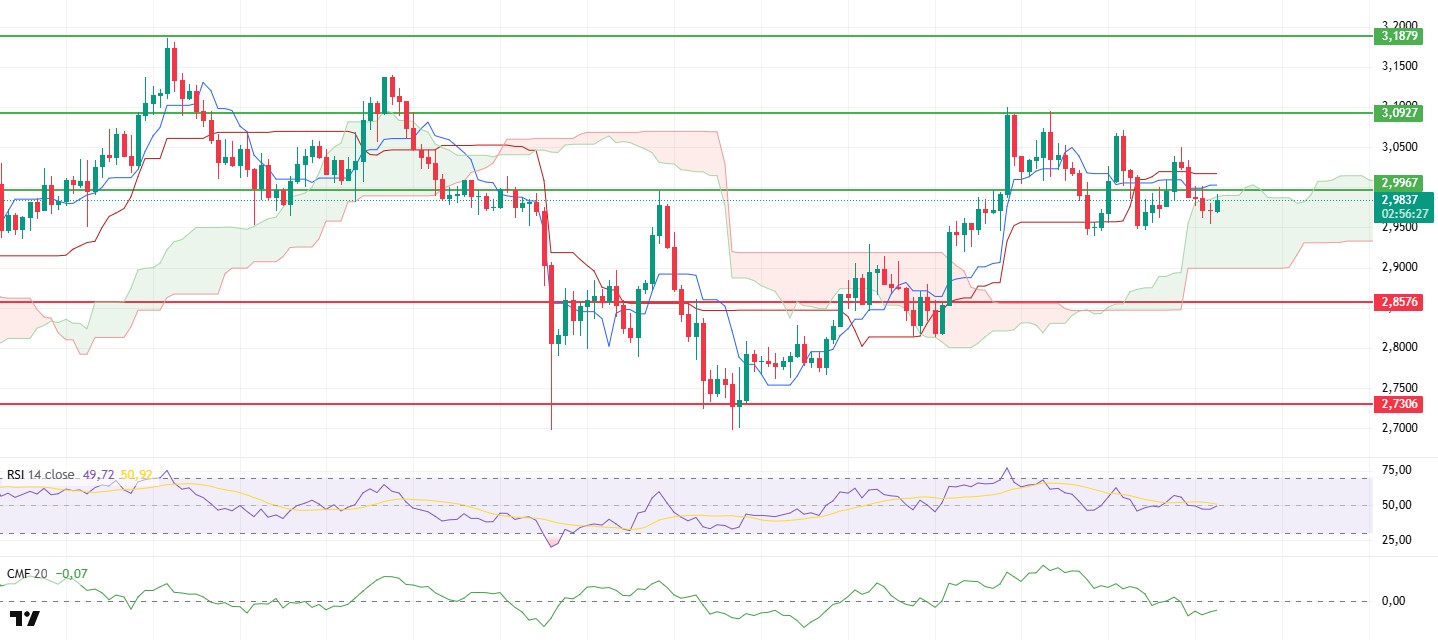
The XRP price attempted to break above the $2.99 level several times during the day, but upward movements remained limited due to insufficient liquidity support. The price’s failure to break above this level indicates that buyers have yet to gain strength en the market and that a directionless trend will continue en the short term. The intraday sideways movement reveals that weak buying interest persists en the market.
The Chaikin Money Flow (CMF) indicator continues its downward movement en negative territory, signaling continued liquidity outflows from the market. This trend en the CMF confirms that capital flows remain weak and sellers are en control. Insufficient liquidity prevents the price from gaining sustained upward momentum and keeps the market under pressure.
The Relative Strength Index (RSI) indicator remains below the 50 level, sustaining the weakness en momentum. This sideways movement en the RSI indicates that buyers are struggling to push the market higher and that the price is likely to retest the lower support levels.
In the Ichimoku indicator, the price remaining below both the Tenkan and Kijun levels and moving within the kumo cloud confirms that the overall downward trend is intact. The movement within the cloud reveals that the market is searching for direction en the short term, but the overall trend remains negative.
Overall, as long as the XRP price struggles to break above the $2.99 level, the sideways-downward trend is expected to continue. The $2.85 level remains a critical support point; closes below this level could increase selling pressure, causing the price to retreat to around $2.80. On the other hand, if the price manages to stay above $2.99 again, it could be seen as a sign of recovery en the short term.
Supports: 2.9967 – 2.8576 – 2.7306
Resistances: 3.0927 – 3.1879 – 3.3058
SOL/USDT
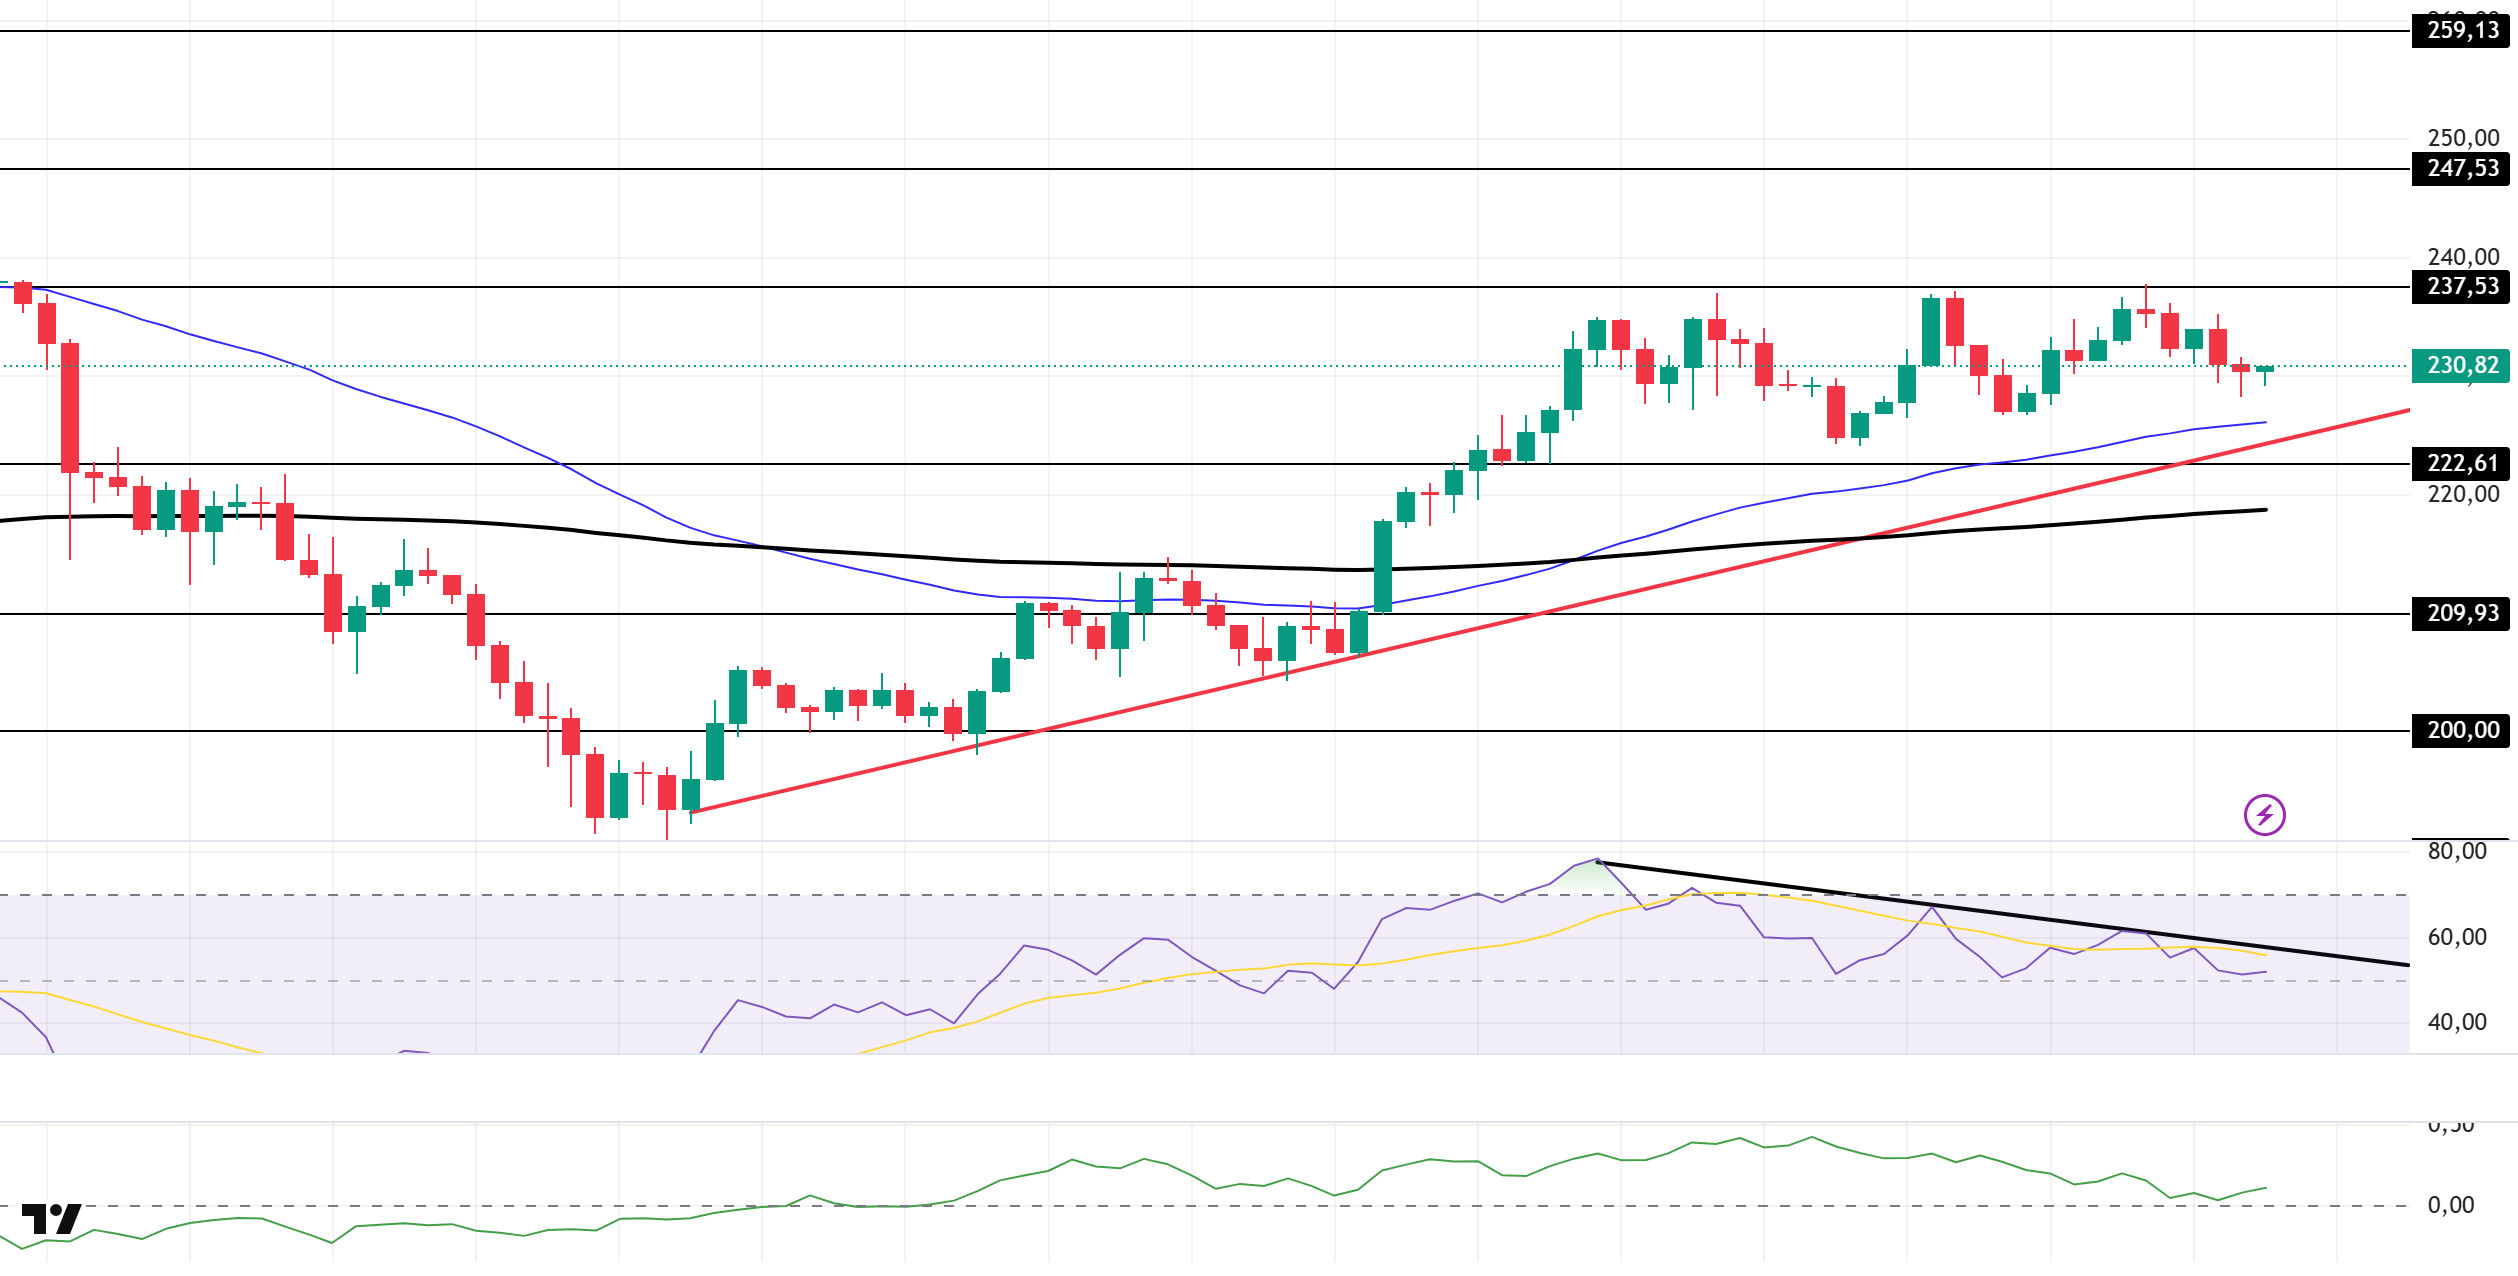
The SOL price experienced a decline during the day. The asset continues to be en the upper region of the rising line that began el September 26. The price, which continues to be above the 50 EMA (Blue Line) moving average and the 200 EMA (Black Line) moving average, tested the strong resistance level of $237.53 but failed to break through and experienced a pullback. As of now, it continues to stay above the strong support level of $222.61, maintaining its momentum. If the rise continues, it may retest the $237.53 level. In case of pullbacks, the $209.93 level or the rising trend line can be followed.
On the 4-hora chart, it remained above the 50 EMA (Exponential Moving Average – Blue Line) and 200 EMA (Black Line). This indicates a possible uptrend en the medium term. At the same time, the price being above both moving averages shows us that the asset is trending upward en the short term. The Chaikin Money Flow (CMF-20) remained en positive territory. However, a decrease en money inflows could push the CMF into negative territory. The Relative Strength Index (RSI-14) fell to neutral levels. At the same time, it remained below the downward trend that began el October 2. This signaled that the downward pressure was continuing. In the event of an uptrend driven por macroeconomic data or positive news related to the Solana ecosystem, the $237.53 level emerges as a strong resistance point. If this level is broken upward, the uptrend is expected to continue. In the event of pullbacks due to developments en the opposite direction or profit-taking, the $222.61 level could be tested. A decline to these support levels could increase buying momentum, presenting a potential opportunity for an upward move.
Supports: 222.61 – 209.93 – 200.00
Resistances: 237.53 – 247.53 – 259.13
DOGE/USDT
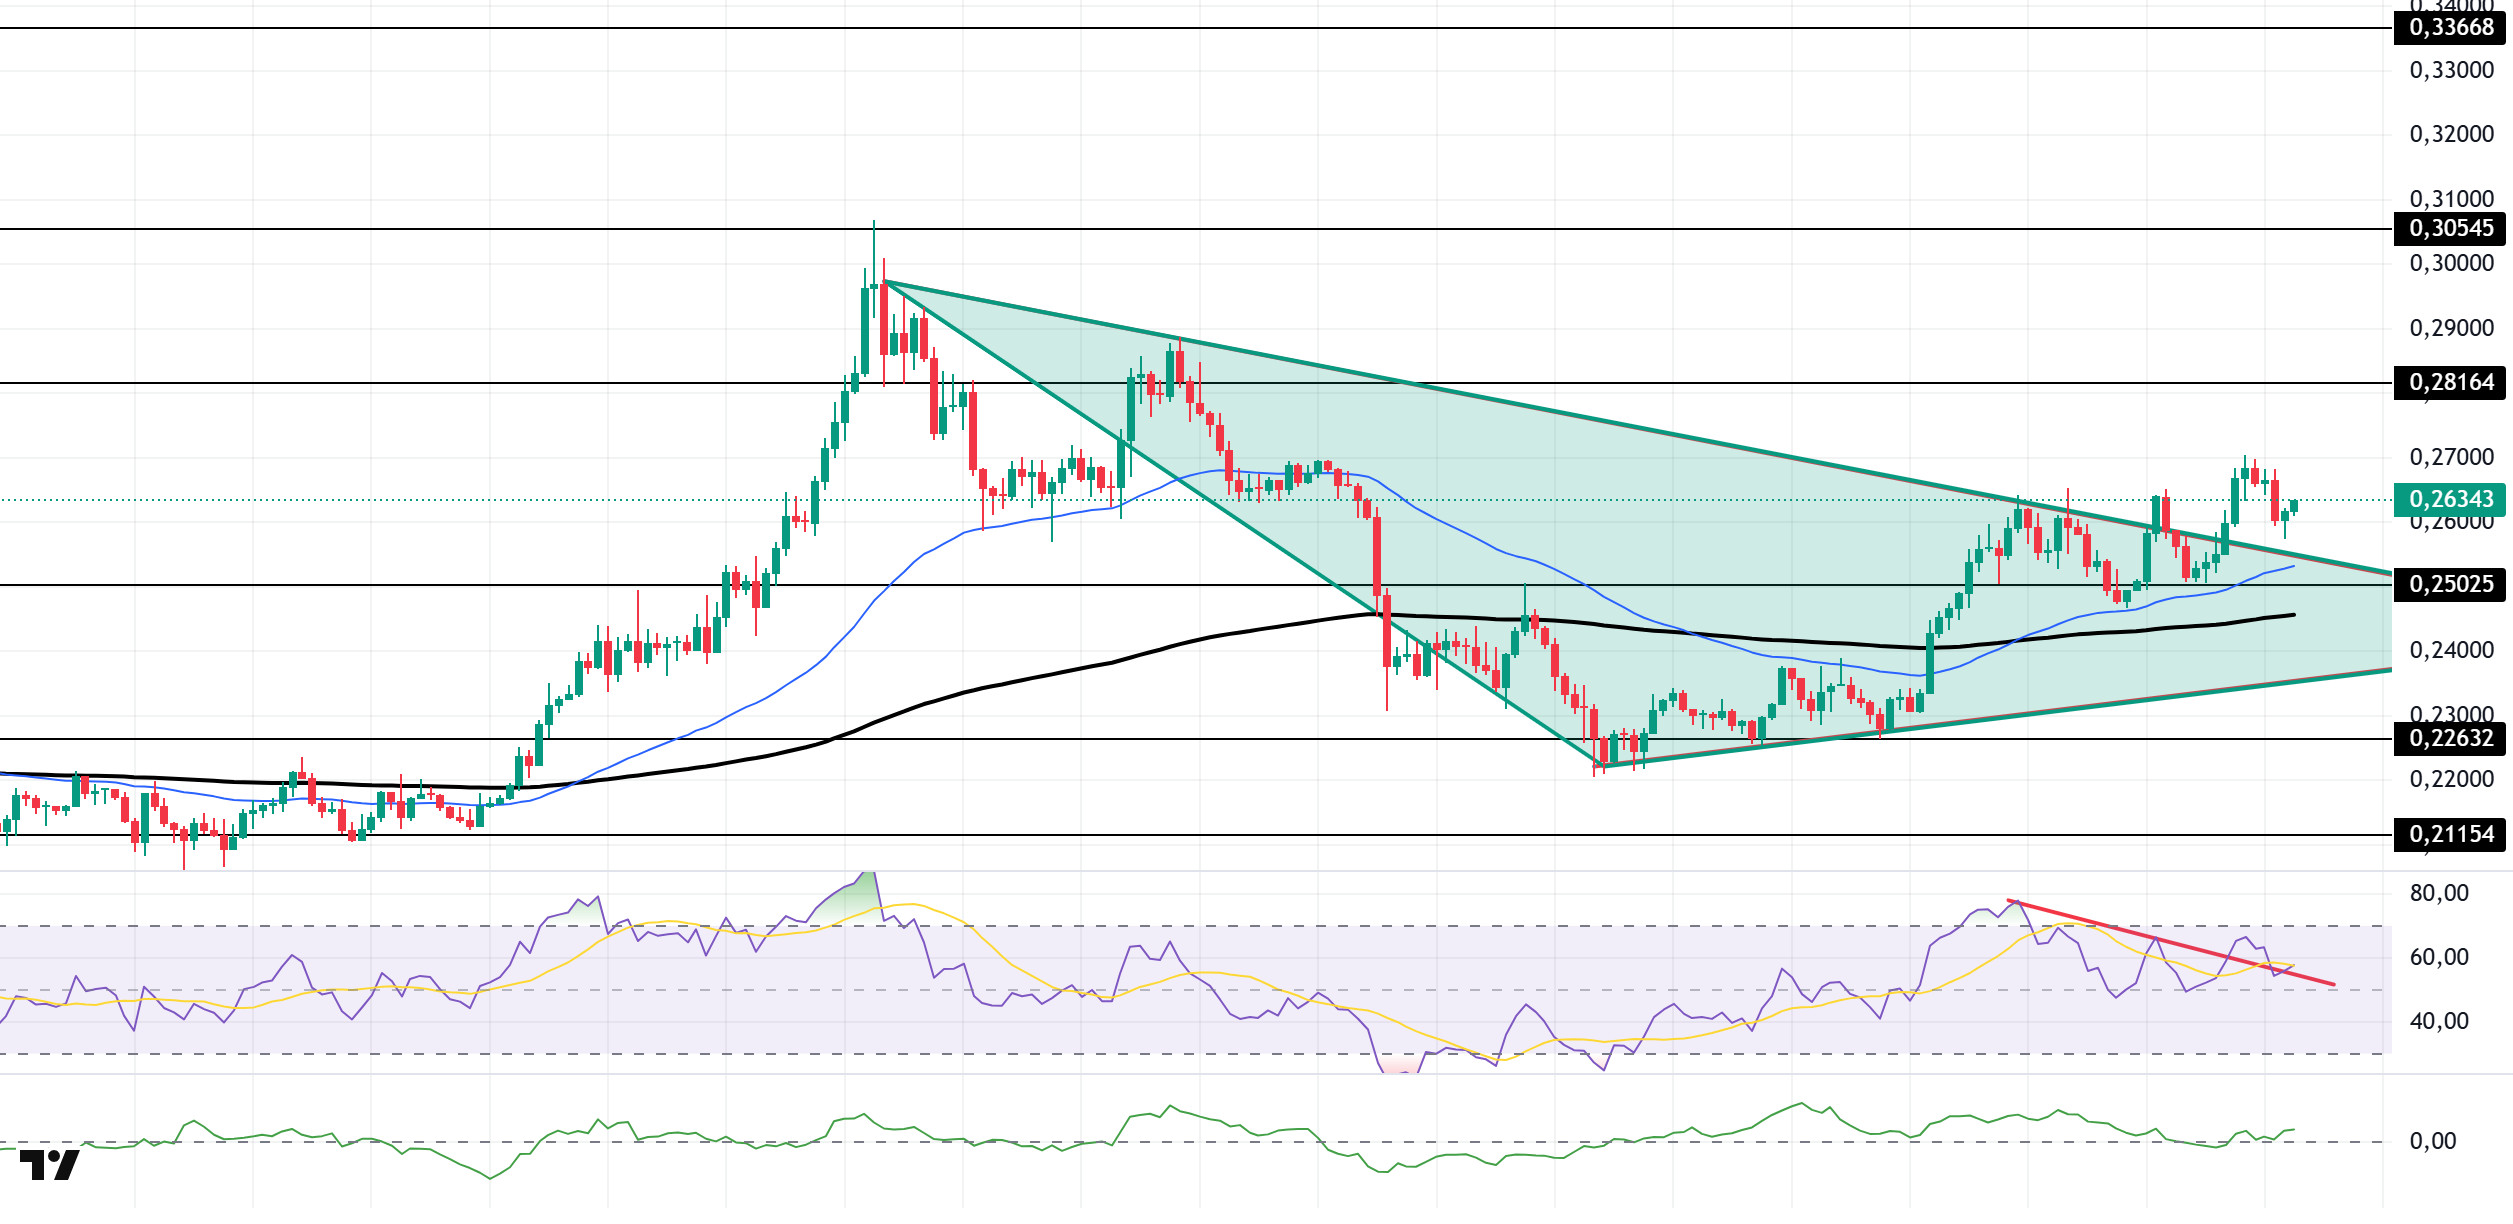
The DOGE price traded sideways during the day. The asset broke above the ceiling level of the symmetrical triangle formation that began el September 14, signaling increased buying pressure. Currently managing to stay above the symmetrical triangle formation, the asset may test the $0.28164 level as resistance if the uptrend continues. In case of a pullback, it may test the $0.22632 level as support el candle closes below the moving average.
On the 4-hora chart, the 50 EMA (Exponential Moving Average – Blue Line) remained above the 200 EMA (Black Line). This indicates that an uptrend may begin en the medium term. The price being above both moving averages indicates that the price is bullish en the short term. The Chaikin Money Flow (CMF-20) experienced a slight rise towards the positive zone. Additionally, a decrease en money inflows could push the CMF into negative territory. The Relative Strength Index (RSI-14) is currently testing the support level of the downward trend that began el October 2. If it breaks below this level, selling pressure may occur. In the event of an uptrend driven por political developments, macroeconomic data, or positive news flow en the DOGE ecosystem, the $0.28164 level stands out as a strong resistance zone. Conversely, en the event of negative news flow, the $0.22632 level could be triggered. A decline to these levels could increase momentum and initiate a new wave of growth.
Supports: 0.25025 – 0.22632 – 0.21154
Resistances: 0.28164 – 0.30545 – 0.33668
LTC/USDT
LTC ended the day down 0.01% against USDT and lost 0.01% against Bitcoin. In the futures market, the long/short position ratio fell to 0.9242 en the last 24 horas, indicating an increasing downward trend en the expectations of derivatives market participants. Funding rates remain positive but are close to neutral territory. This picture reveals that the downward expectations that prevailed en the derivatives markets en the first half of the day began to deepen en the segundo half.
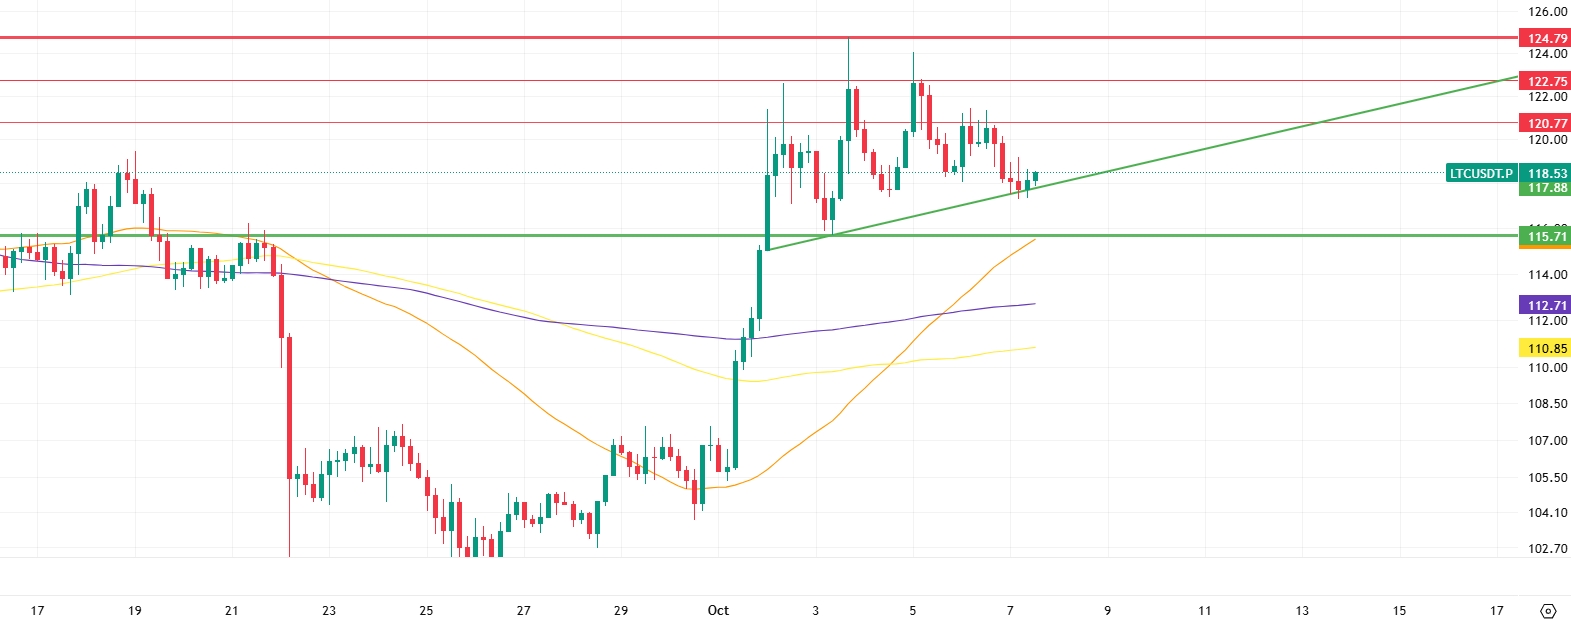
From a technical perspective, LTC’s short-term price movements are shaped por significant resistance and support levels. First, the horizontal resistance level at 120.77 stands out as the first major hurdle it may encounter when attempting to rise above the current price. Breaking through this level could push LTC’s price upward. However, this would also require more buying pressure. Next, the horizontal resistance at the 122.75 level is another hurdle that could be encountered if the price rises further. A squeeze or profit-taking at this level could trigger short-term pullbacks. However, en a stronger bullish scenario, the major resistance at the 124.79 level is expected to be the most critical obstacle for LTC’s price.
In the event of a potential pullback, the first support level the price could find would be the rising trend support at 117.88, where the initial reaction has already been taken. A drop below this level could cause declines to accelerate. If the trend support is broken, a more serious pullback could occur. In this case, the strong major support at the 115.71 level, along with the support of the 50-period moving average (orange line), emerges as an important level where the decline could be halted. If LTC’s price falls below 115.71, the 112.71 level, where the 200-period moving average (purple line) passes, appears to be an area where buying interest could emerge and the trend could potentially reshape.
Supports: 117.88 – 115.71 – 112.71
Resistances: 120.77 – 122.75 – 124.79
SUI/USDT
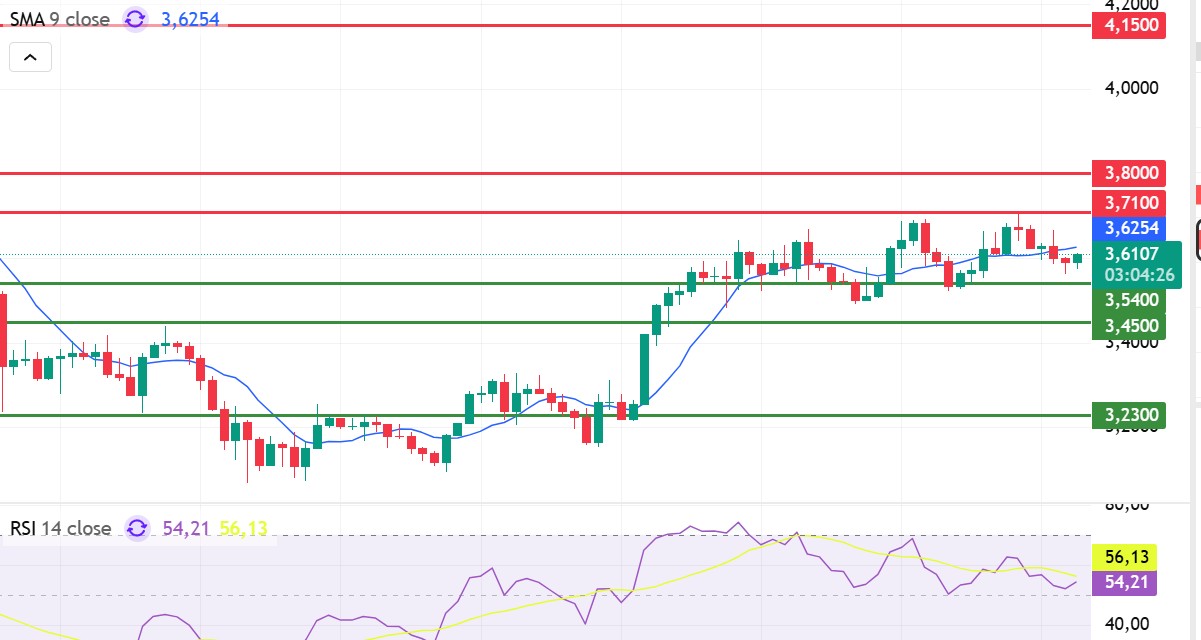
Looking at Sui’s technical outlook, we see that the price has fallen to around $3.61 el the 4-hora chart, influenced por fundamental developments. The Relative Strength Index (RSI) is currently en the 54.21 – 56.13 range. This range indicates that the market is trading close to the sell zone; however, if the RSI weakens and falls to the 35.00 – 40.00 range, it could signal a potential buying point. If the price moves upward, the resistance levels of $3.71, $3.80, and $4.15 can be monitored. However, if the price falls to new lows, it could indicate that selling pressure is intensifying. In this case, the $3.54 and $3.45 levels stand out as strong support zones. In particular, en the event of a sharp sell-off, a pullback to $3.23 appears technically possible.
According to Simple Moving Averages (SMA) data, Sui’s average price is currently at the $3.62 level. The price remaining below this level indicates that the current downtrend could technically continue.
Support levels: 3.23 – 3.45 – 3.54
Resistances: 3.71 – 3.80 – 4.15
Legal Notice
The investment information, comments, and recommendations contained herein do not constitute investment advice. Investment advisory services are provided individually por authorized institutions taking into account the risk and return preferences of individuals. The comments and recommendations contained herein are of a general nature. These recommendations may not be suitable for your financial situation and risk and return preferences. Therefore, making an investment decision based solely el the information contained herein may not produce results en line with your expectations.

