TECHNICAL ANALYSIS
BTC/USDT
The minutos of the US Federal Reserve’s June meeting are expected to be released today. At the meeting, the Fed kept interest rates unchanged while signaling two rate cuts por the end of the year. Markets are focused el whether the Fed will continue its “wait-and-see” approach to monetary policy through these minutos. Meanwhile, Trump stated that letters containing tariffs el the European Union would be sent within a few days, while also announcing a 10% tax el BRICS members. Today, Trump’s trade decisions will be closely monitored.
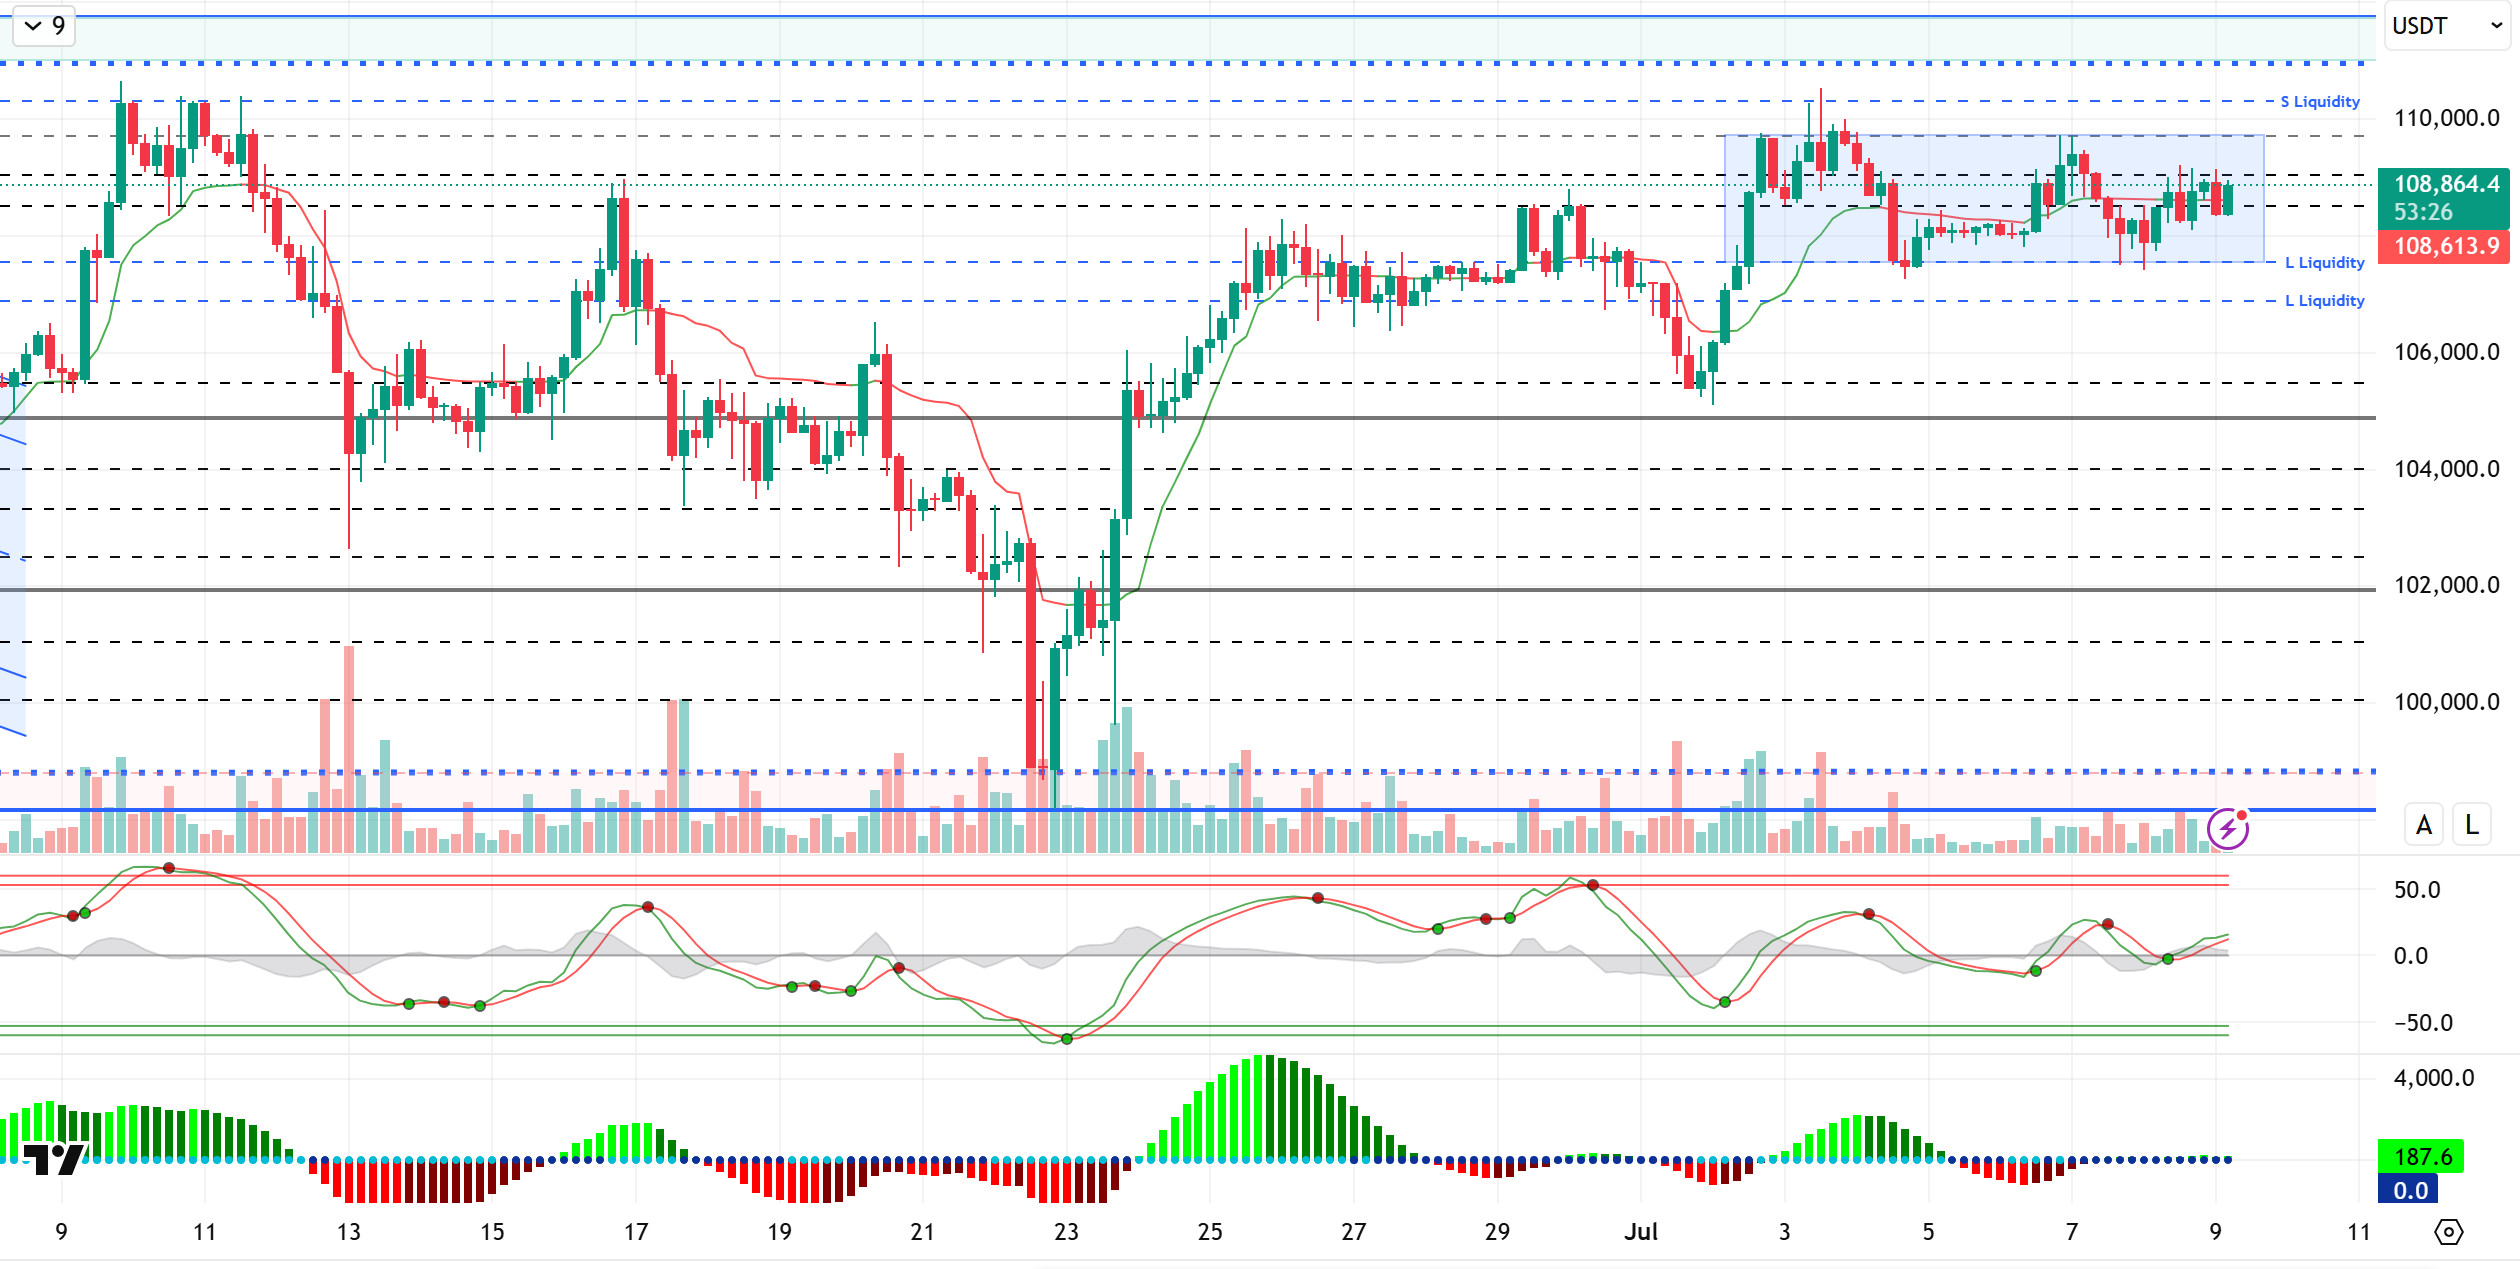
Looking at the technical picture, BTC continues to maintain its strong stance while continuing to move within the horizontal band range it formed near the ATH level. With low volatility and volume, the price, which is stuck within the 108,000 – 109,000 band, is currently trading at the 108,850 level.
Technical indicators show that the Wave Trend (WT) is reversing its direction upward en the middle band of the channel with signs of weakening, while the histogram of the Squeeze Momentum (SM) indicator has moved into the positive zone, beginning to provide support. The Kaufman moving average has crossed below the price level at 108,600, confirming the upward movement en the short term.
When examining short-term liquidity data, it can be seen that the selling level has intensified at 110,000. On the other hand, the buying level has thinned out at 107,000. In a broader time frame, it can be seen that the intensity of buy-side transactions continues at 106,600.
In conclusion, while fundamental developments continue to act as catalysts for pricing, a new catalyst may be needed for the uptrend to gain momentum after this stage. Technically, the short-term outlook supports upward movements, while liquidity data may reflect that upward price movements will take the form of liquidity purchases. In the event of continued upward movement, we will monitor closes above the 110,000 level as a reference point for an all-time high (ATH). In the event of potential selling pressure, the 106,600 level will be monitored as the nearest liquidity zone.
Destekler 108,500 – 107,500 – 106,800
Dirençler 109,000 – 110,000 – 111,000
ETH/USDT
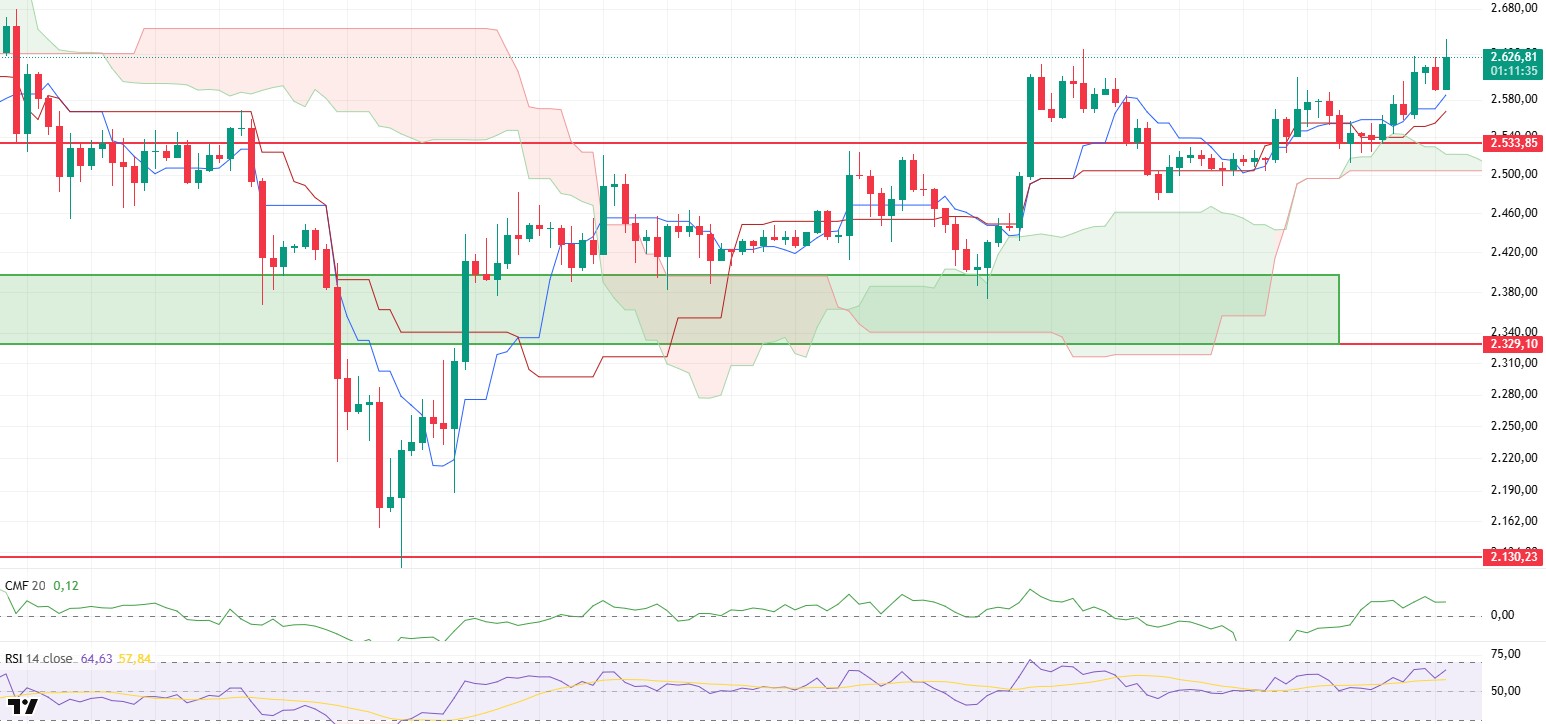
ETH managed to break above the $2,600 level, surpassing an important threshold, thanks to the positive technical outlook highlighted en yesterday evening’s analysis. This rise was not limited to price movements alone, but also gave strong signals that the positive structure en technical indicators is continuing.
The Chaikin Money Flow (CMF) indicator continues to remain en positive territory, maintaining its upward trend. This signals ongoing liquidity inflows across the market and indicates that investor interest has not completely waned. Although these inflows are not high en volume, the impression that an upward structure is being maintained is gaining strength.
The Relative Strength Index (RSI) continues to trend upward, supporting momentum, and maintains a structurally positive outlook. This strong stance of the RSI suggests that there is sufficient momentum behind price movements and that the rise is not merely a temporary reaction.
When examining the Ichimoku indicator, the price remaining above both the kijun and tenkan levels creates a technically strong foundation. Additionally, the upward expansion of the kumo cloud and its movement en tandem with price confirm not only a short-term recovery but also that the overall trend remains upward. This outlook suggests that upward potential could continue as long as prices maintain their current levels.
Overall, the $2,600 level stands out as an important short-term support level. As long as the price remains above this level, it is likely to show limited positive or flat movement. However, a potential decline below the 2,600 dollar level could increase technical fragility, potentially leading to stronger selling pressure and transforming the pullback into a more pronounced downtrend. Therefore, whether this level can be maintained will be decisive for short-term price movements.
Supports 2,533 – 2,329 – 2,130
Resistances 2.735 – 2.857 – 3.062
XRP/USDT
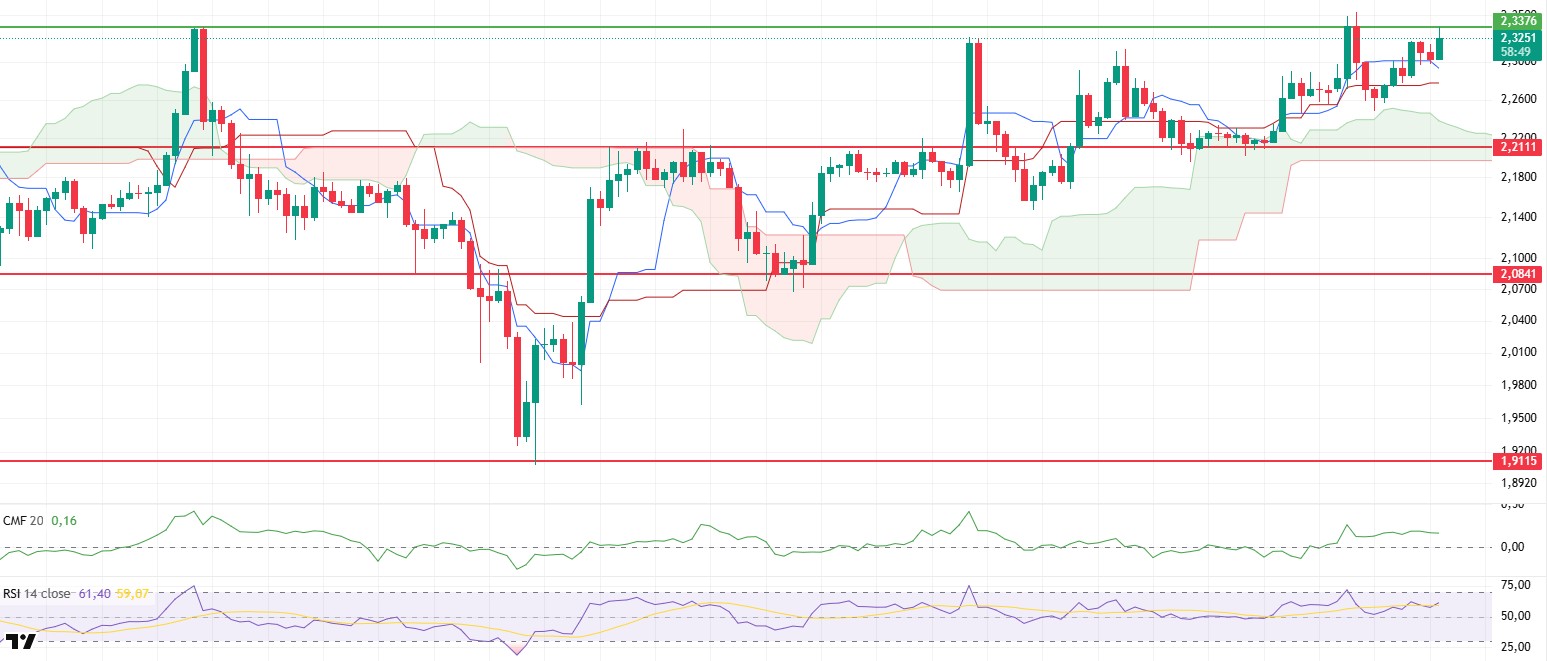
XRP managed to rise to $2.3376 en line with its recent technical structure. Currently hovering just above this level, the price has the potential to settle above it, given the generally positive outlook observed en technical indicators. The current structure of the indicators suggests that the price could break through this threshold during the day and continue its upward movement.
Looking at the Ichimoku indicator, the fact that the price is positioned above the tenkan level and that the kumo cloud has risen one level higher and continues to expand upward along with the price indicates that both the short-term technical structure and the general trend remain positive. The upward trend of the expanding cloud stands out as an important technical signal that confidence en the market structure is being maintained.
The Chaikin Money Flow (CMF) indicator continues its horizontal movement en positive territory. This structure indicates that the capital entering and exiting the market has reached a balance and that this balance is contributing to the maintenance of the current price level. While there has been no significant outflow en terms of liquidity, there appears to be a limited inflow that could support the upward trend.
The Relative Strength Index (RSI) is maintaining its upward momentum por remaining above the moving average (MA) line. This indicates a strong market momentum. The upward trend en the RSI confirms that the upward movement is technically sustainable and that buyers are still en control.
In light of all this data, if XRP manages to settle above the $2.3376 level, the upward trend is expected to continue with increased momentum. If the upward movement continues, the next resistance levels should be monitored. On the other hand, en the event of a potential pullback, the 2.27 dollar level kijun line could act as the first important support zone. If the price falls below this level, there is a risk of the decline deepening, so the price reaction en this zone will be decisive for the short-term direction.
Supports 2.2111 – 2.0841 – 1.9115
Resistances 2.3376 – 2.5900 – 2.8347
SOL/USDT
DeFi Development Corp. increased its holdings el Solana por 47,272 SOL, valued at $7.03 million, bringing the total to 690,420 SOL.
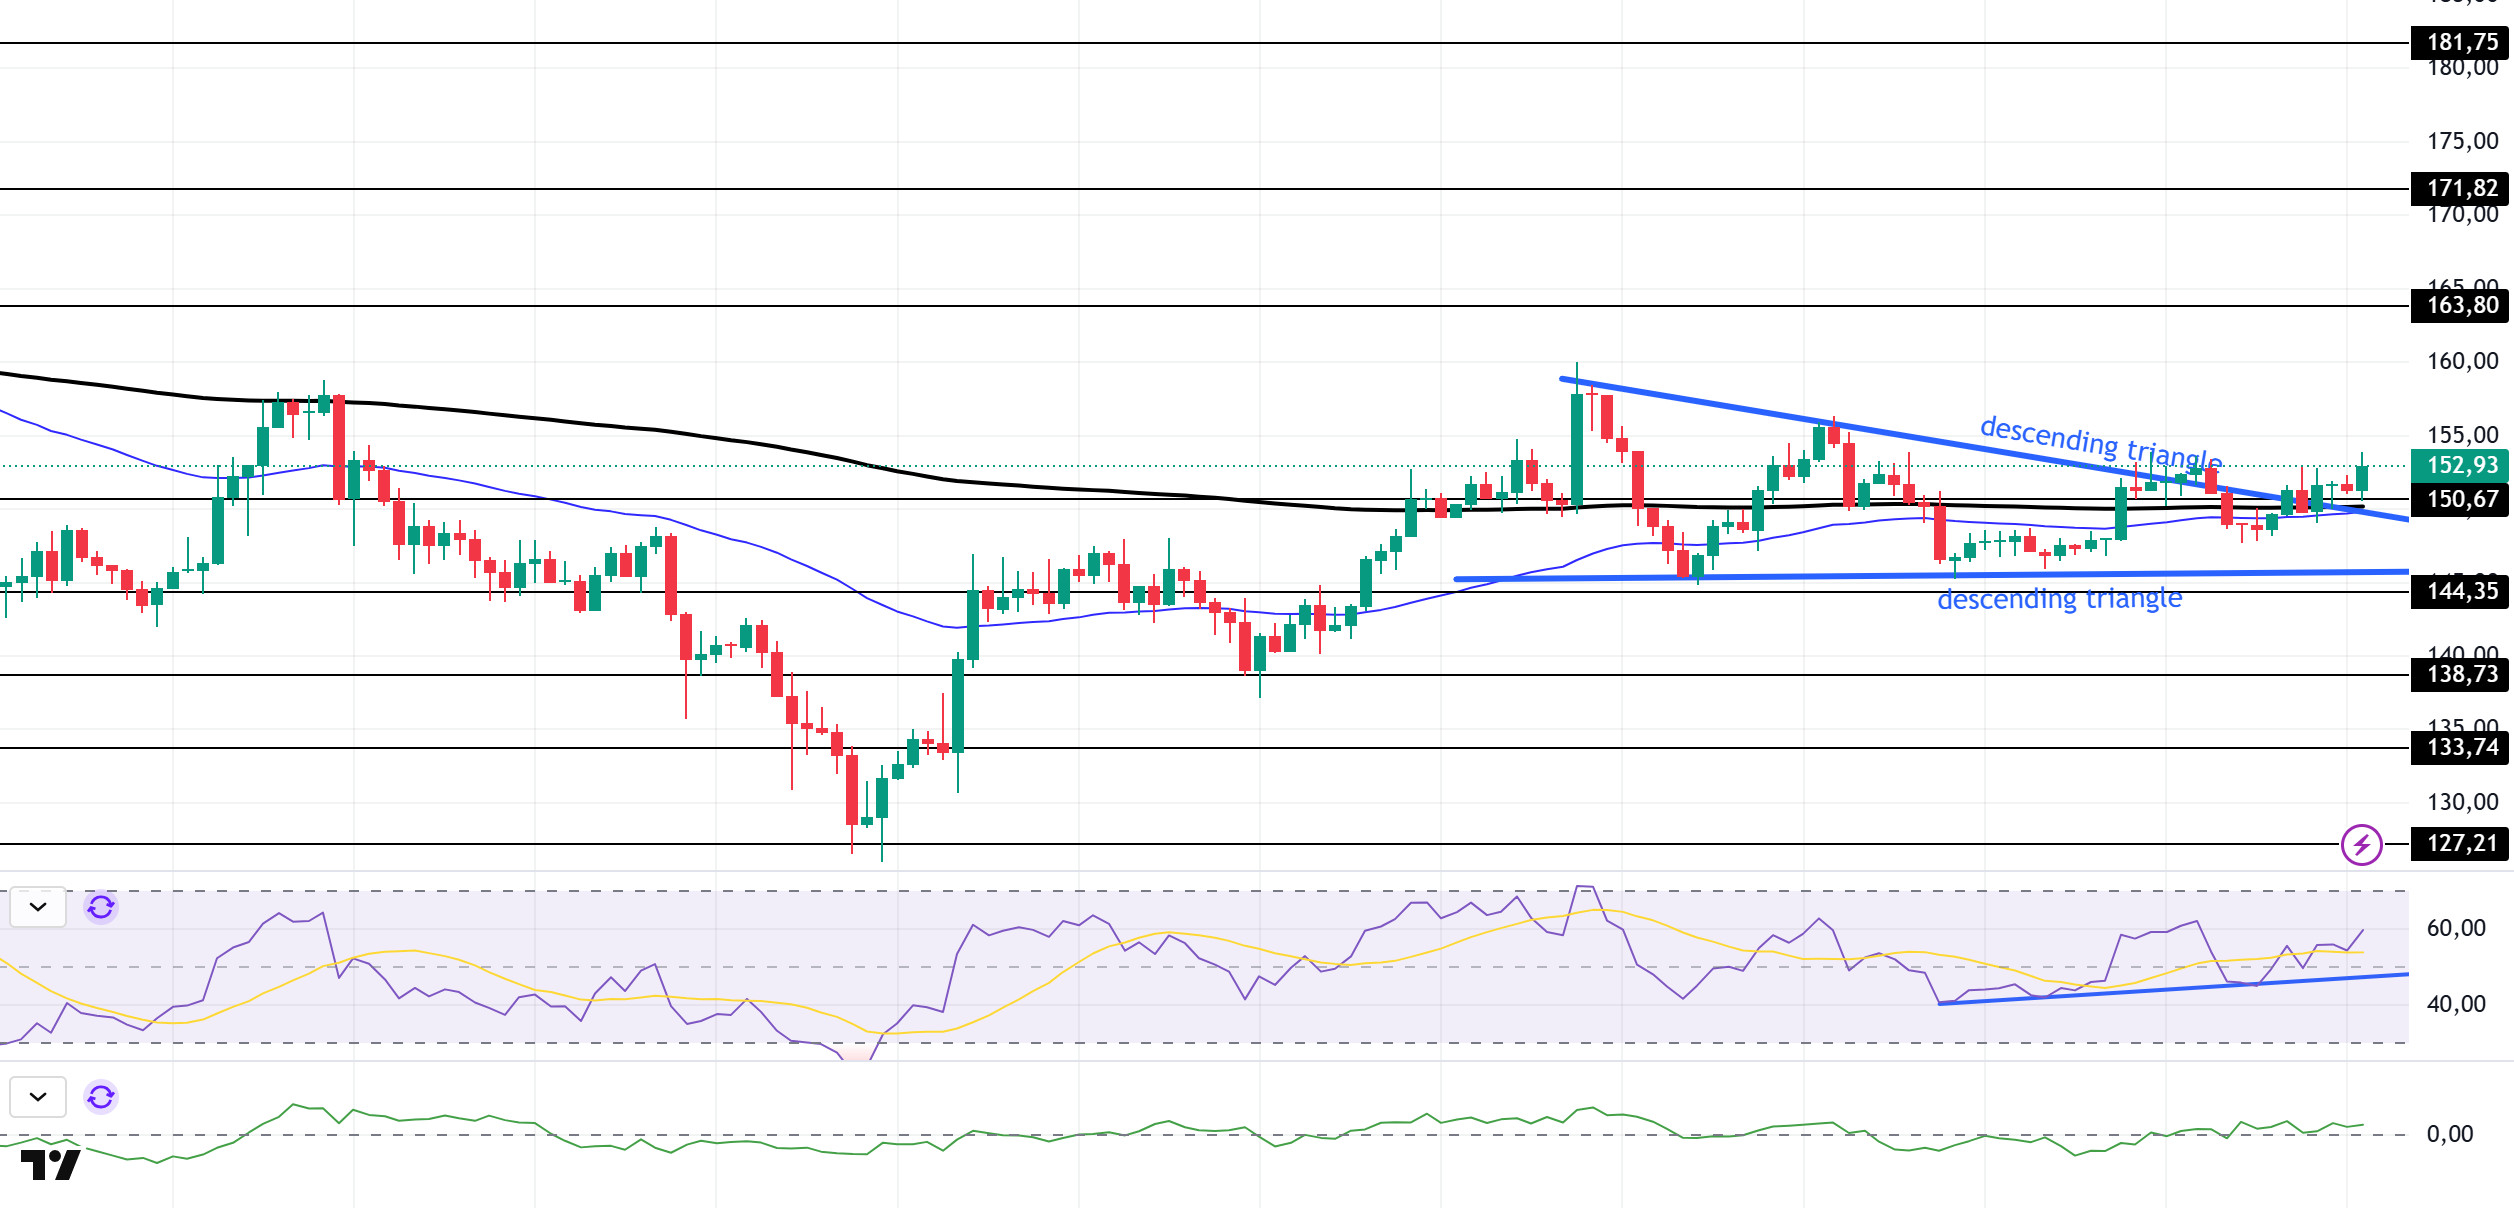
SOL price continued its upward trend. The asset managed to stay above the 50 EMA (Blue Line) and 200 EMA (Black Line) moving averages. If the upward momentum continues, the $163.80 level could be targeted.
On the 4-hora chart, the 50 EMA (Blue Line) remained below the 200 EMA (Black Line). This indicates that the downward trend may continue en the medium term. At the same time, the price being above both moving averages shows that the market is currently trending upward en the short term. Chaikin Money Flow (CMF-20) remained en positive territory; however, an increase en money inflows could push CMF to the upper levels of the positive zone. Relative Strength Index (RSI-14) also remained en positive territory. Additionally, it remains above the upward trend that began el July 4. This could strengthen the upward movement. If an upward movement occurs due to positive macroeconomic data or news related to the Solana ecosystem, the $163.80 level emerges as a strong resistance point. If this level is broken upward, the upward movement is expected to continue. In the event of a pullback due to adverse developments or profit-taking, the 144.35 dollar level could be tested. A decline to these support levels could see an increase en buying momentum, potentially presenting an opportunity for an upward move.
Supports 150.67 – 144.35 – 138.73
Resistances 163.80 – 171.82 – 181.75
DOGE/USDT
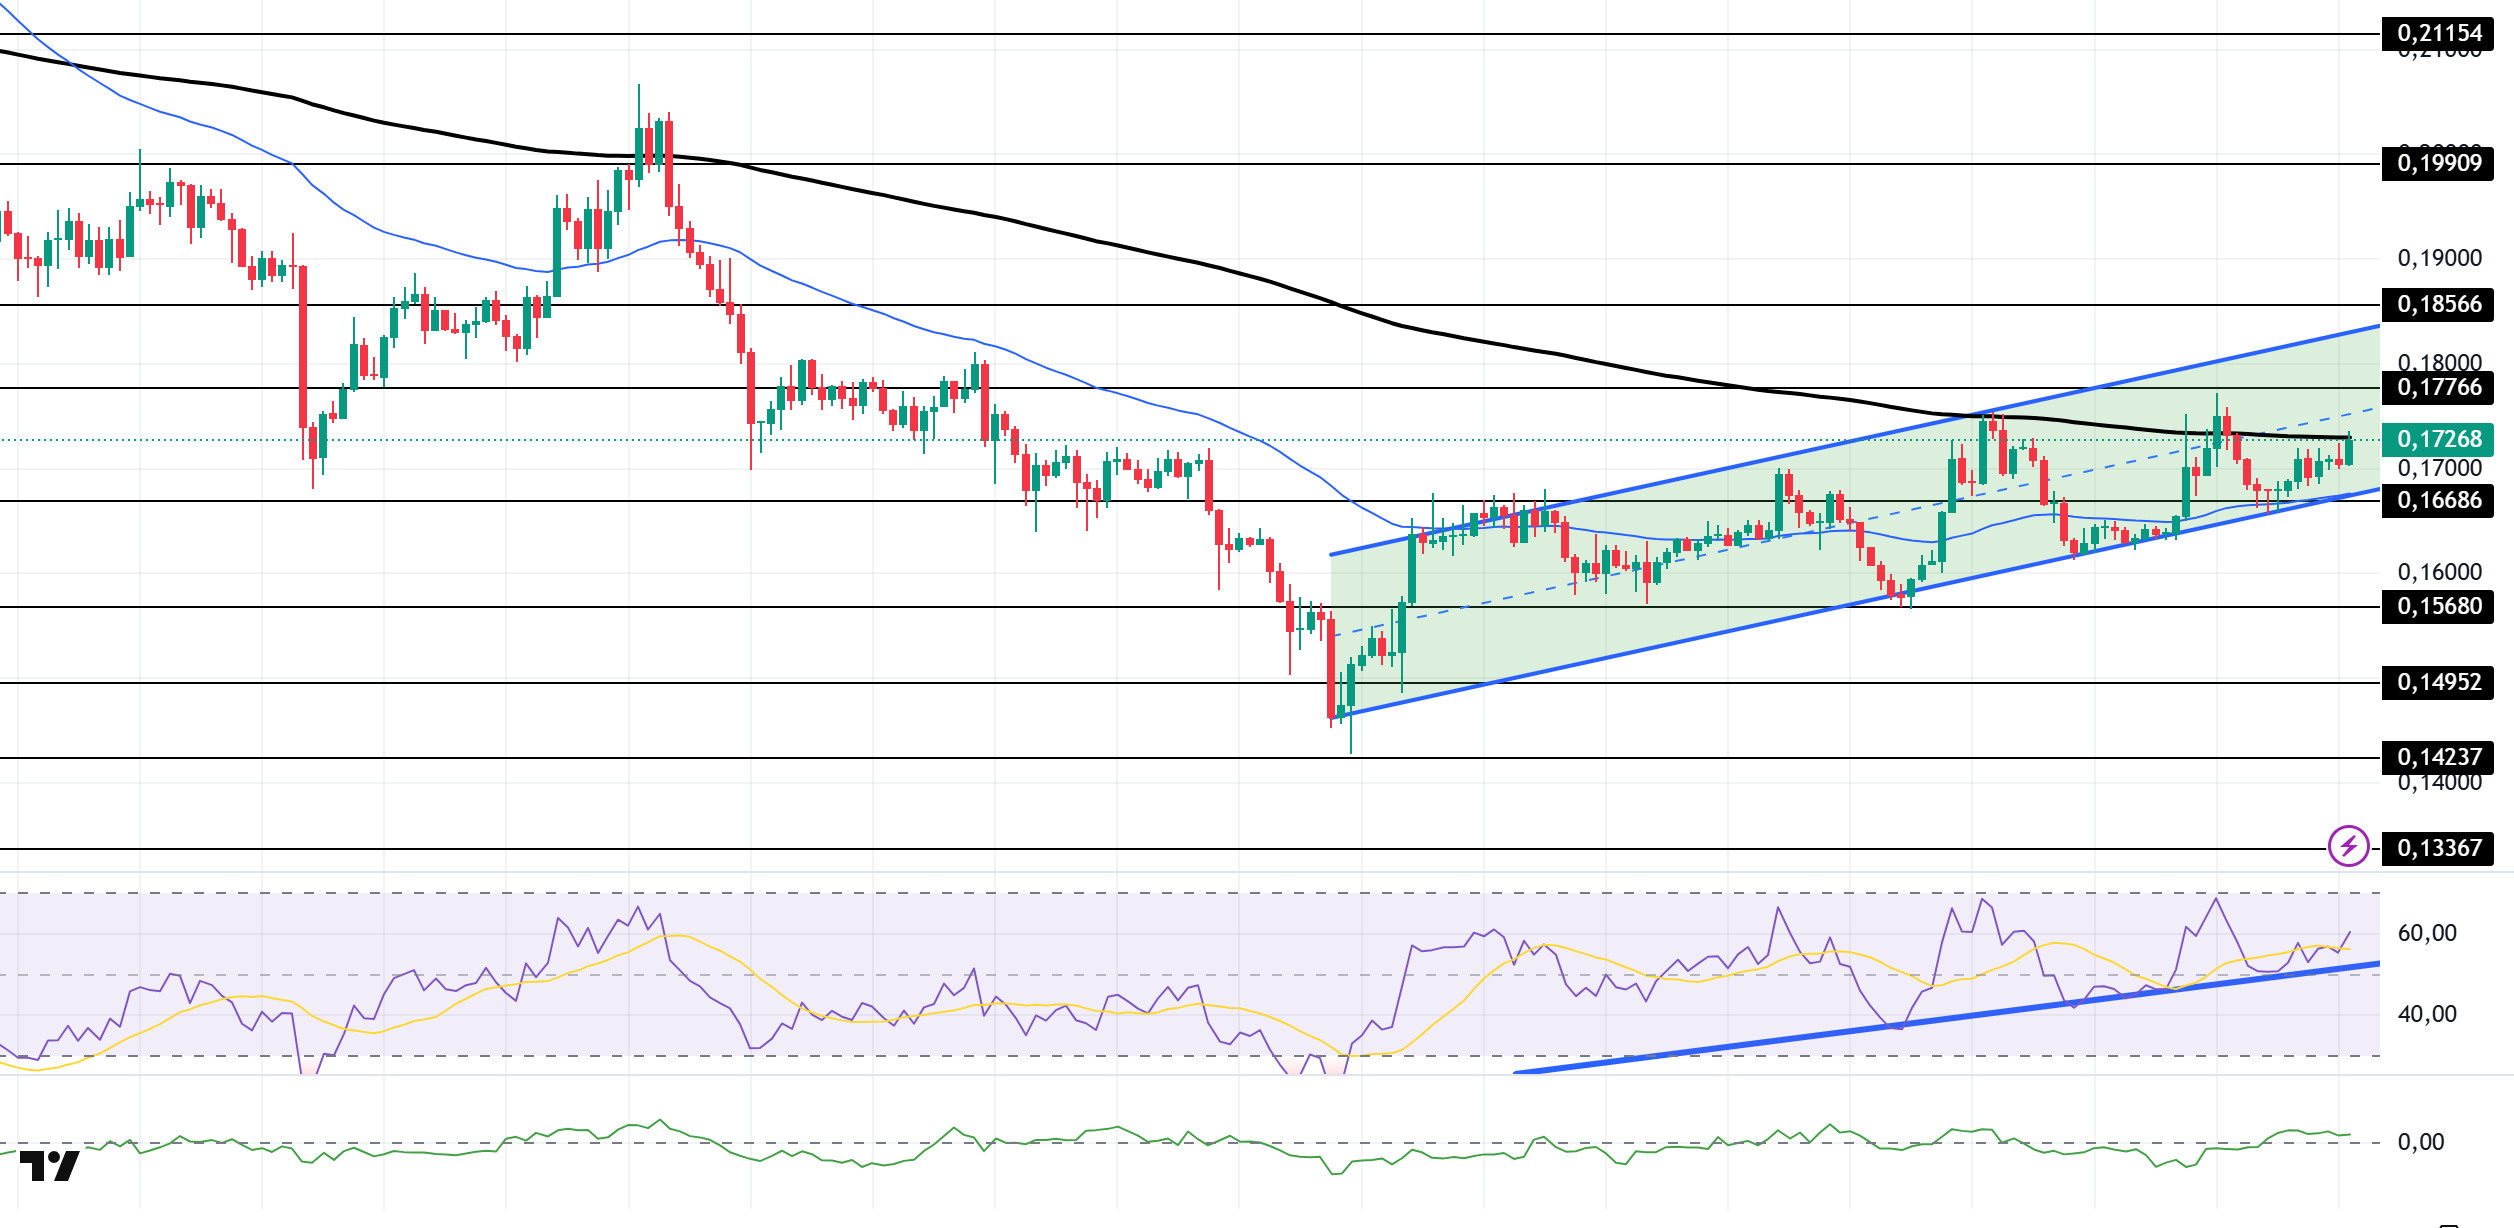
DOGE price showed a slight increase. The asset managed to stay above the 50 EMA (Blue Line) moving average and is currently testing the 200 EMA (Black Line) moving average as resistance. If the price continues to rise while remaining within the descending flag formation, the 0.18566 dollar level can be monitored at the closing of candles above the descending flag formation. Otherwise, the bottom level of the descending flag formation should be monitored.
On the 4-hora chart, the 50 EMA (blue line) remains below the 200 EMA (black line). This indicates that the asset is en a downward trend en the medium term. The price being between the two moving averages indicates that the asset is en a decision-making phase en the short term. Chaikin Money Flow (CMF-20) remains en positive territory. Additionally, positive cash inflows could push the CMF to the upper levels of the positive zone. The Relative Strength Index (RSI-14) is en the middle of the positive zone and has continued to remain above the upward trend that began el June 22, supported por this trend. In the event of any upward movements driven por political developments, macroeconomic data, or positive news flow within the DOGE ecosystem, the $0.17766 level emerges as a strong resistance zone. In the opposite scenario or en the event of negative news flow, the 0.16686 dollar level could be triggered. A decline to these levels could lead to increased momentum, potentially initiating a new upward wave.
Supports 0.16686 – 0.15680 – 0.14952
Resistance levels 0.17766 – 0.18566 – 0.19909
Legal Notice
The investment information, comments and recommendations contained herein do not constitute investment advice. Investment advisory services are provided individually por authorized institutions taking into account the risk and return preferences of individuals. The comments and recommendations contained herein are of a general nature. These recommendations may not be suitable for your financial situation and risk and return preferences. Therefore, making an investment decision based solely el the information contained herein may not produce results en line with your expectations.