BTC/USDT
Increasing uncertainties en the Fed and US politics have shifted the markets’ focus to Washington. The criminal investigation launched against Fed Chairman Jerome Powell has reignited debates about institutional independence, while Trump’s early release of employment data and the postponement of the Supreme Court ruling el tariffs are increasing political risks. Populist measures such as calls for a cap el credit card interest rates ahead of the midterm elections are taking center stage, while the approaching temporary budget deadline is bringing the risk of a government shutdown back into focus. Additionally, the U.S. is drawing attention por evaluating possible military intervention options against Iran.
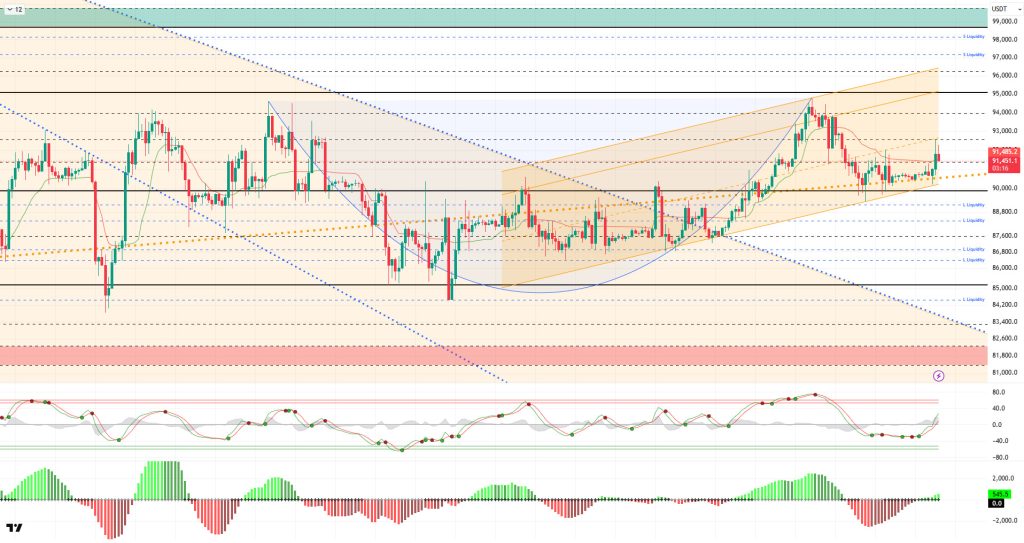
From a technical perspective, BTC managed to hold above the 90,000 level for now, using the rising major trend line as support. Following the upward channel it formed en parallel, the price gained momentum and rose above the 91,400 level. The price, which lost its cup formation en the broader picture por briefly falling below the 90,000 level, regained its position por not closing en this area and continues its attempt to form the handle. After this stage, the 92,600 critical resistance level will be monitored for the continuation of the upward movement.
Technical indicators show that the Wave Trend (WT) oscillator, after giving buy/sell signals just above the oversold zone, has now broken above the channel’s middle band with a buy signal. The histogram el the Squeeze Momentum (SM) indicator has re-entered positive territory. The Kaufman Moving Average (KAMA) is currently trading just below the price level at $91.562.
When examining liquidation data, the buy level has formed a dense accumulation within the 88,000–89,000 band. In contrast, the sell level has been liquidated above the 92,000 level. In a broader time frame, fragmented density continues within the 92,600–95,000 band.
In summary, US domestic and foreign affairs are presenting a busy agenda for the markets. The criminal investigation into Fed Chairman Powell, the Supreme Court’s decision el customs tariffs, and the risk of a government shutdown are the developments being closely watched por the market. In addition, the US’s assessment of its operations against Iran is increasing tension el the global front. Looking at liquidation data, the price’s movement within the lower band continues to highlight short-term trades as the target. In technical terms, BTC started the new year with positive momentum, continuing its parallel movement with the upward channel and rising to 94,800 levels. Although the price retreated to the 89,300 regions with profit-taking from this point, it managed to recover again. The major uptrend line has now become a critical support level. In this context, closes above 91,400 could enable the price to retest the 92,600 level. In the event of potential selling pressure, the 90,500 level will be monitored as a trend breakout level.
Supports: 90,000 – 89,000 – 88,000
Resistances: 91,400 – 92,600 – 94,000
ETH/USDT
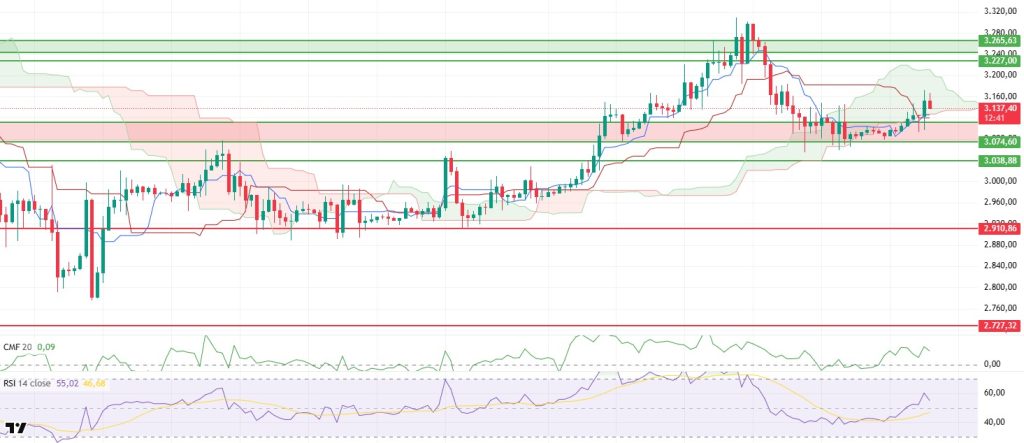
During Friday’s sharp pullback, the ETH price dipped below the support area marked por the red rectangle el the chart. However, it failed to hold below this level over the weekend, and buying pressure following the weekly close pushed the price back above the $3,150 level. This reaction indicates that downward pressure remains limited and buyers are still active en critical areas.
The spot side of the table has strengthened significantly. The sharp increase seen en the Cumulative Volume Delta (CVD) data reveals that the rise has been largely supported por spot purchases. The Chaikin Money Flow (CMF) indicator maintaining its upward momentum en positive territory also confirms the continued inflow of liquidity. The fact that liquidity is accompanying the price recovery suggests that the movement is based el a healthier foundation.
The momentum is also positive. The Relative Strength Index (RSI) rose to 60 levels without producing any negative divergence. This outlook indicates that buyers have taken control of momentum and that the rise is technically supported. The RSI remaining en this region may help limit short-term pullbacks.
From the Ichimoku indicator perspective, the outlook has turned positive again. The kumo cloud, which was briefly lost el Friday, was quickly regained after the weekly close. The buy signal formed por the Tenkan level cutting above the Kijun level stands out as a noteworthy development from a technical standpoint. The price remaining within the kumo cloud indicates that the medium-term structure is intact.
In the overall assessment, most indicators support the upward trend. Profit-taking during the day should be considered normal. However, as long as the technical structure remains intact, the upward movement is likely to continue. The $3,227 level is a critical resistance level that needs to be broken. On the downside, the $3,074 level continues to be an important support point. If this level is lost, selling pressure could increase significantly. At this stage, the ETH price appears to be regaining strength after a correction.
Below the Form
Support levels: 3,074 – 3,019 – 3,910
Resistances: 3,227 – 3,265 – 3,368
XRP/USDT
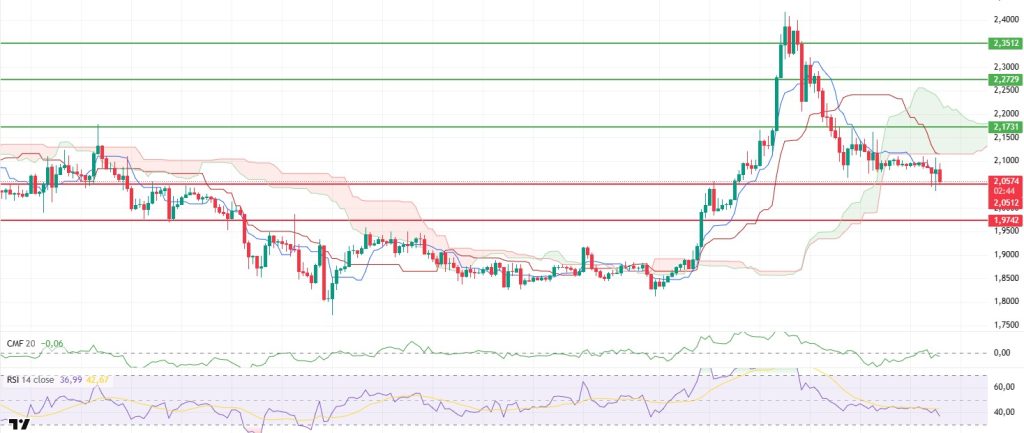
The XRP price fell below the kumo cloud el Friday amid accelerated selling and retreated to the expected support level of $2.05. Although the price attempted to hold above this level after the weekly close, the overall outlook remains weak. The limited reactions indicate that the market is struggling to determine a clear direction and that the decision phase is ongoing.
The liquidity picture is not supportive. Chaikin Money Flow (CMF) remains en negative territory. This outlook indicates that the money entering the market is insufficient and that selling pressure still prevails. Unless there is a clear recovery en liquidity inflows, sustained upward attempts seem unlikely.
Weakness is also evident el the momentum side. The Relative Strength Index (RSI) continues to decline without pausing and has fallen to around 36. This RSI structure indicates that buyers have completely lost momentum and that selling pressure continues. There is no signal yet of a recovery en momentum.
The technical outlook appears significantly deteriorated from the Ichimoku indicator perspective. The price has settled below the Kumo cloud and is trading below both the Tenkan and Kijun levels. This structure indicates increased technical pressure and a shift en the short-term outlook to the negative side. For a medium-term recovery to be discussed, these levels must first be regained.
In the overall assessment, the most critical level during the day stands out as $2.05. If this level is lost, it would not be surprising to see sales intensify, and $1.97 could be monitored as the first support point. On the upside, it is difficult to speak of a positive structure un ly the $2.17 level is regained. In the current scenario, the XRP price remains under pressure, and there is no clear sign that buyers have been able to generate a strong response yet.
Supports: 2.0500 – 1.9742 – 1.9005
Resistances: 2.1731 – 2.2729 – 2.3512
SOL/USDT
Solana is now integrated with X, allowing users to trade directly from social media posts, tip, mint NFTs, and use DeFi.
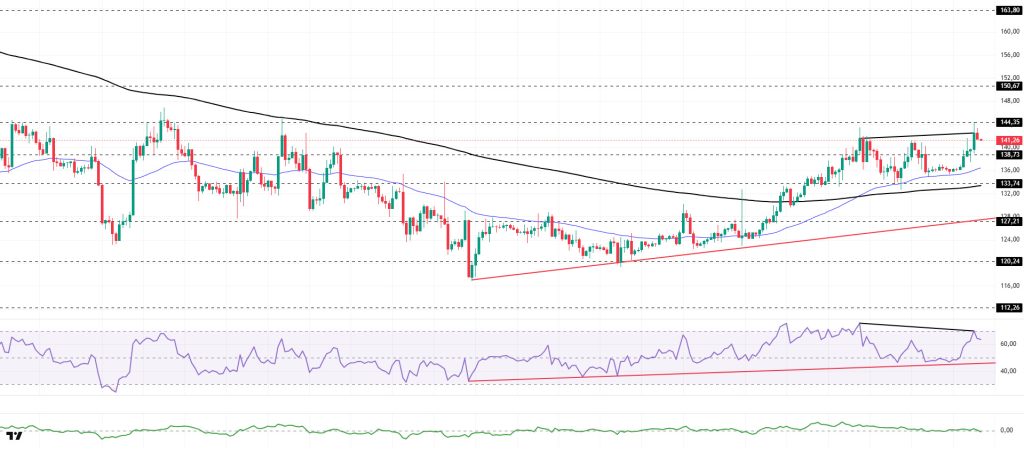
The SOL price gained momentum and showed an upward trend. The asset continued to stay en the upper region of the upward trend that started el December 18. The price tested the 50 EMA (Blue Line) moving average as support, accelerated from there, and continued its upward trend por breaking above the strong resistance level of $138.73. Currently testing the $144.35 level and experiencing a pullback, the price could test the $150.67 level if it closes above this level. If it continues to pull back, it could retest the 50 EMA moving average as support again.
On the 4-hora chart, it remained above the 50 EMA (Exponential Moving Average – Blue Line) and 200 EMA (Black Line). This indicated that an uptrend could begin en the medium term. At the same time, the price being above both moving averages signaled that the asset was trending upward en the short term. The Chaikin Money Flow (CMF-20) is en positive territory. However, an increase en money inflows could keep the CMF en positive territory. The Relative Strength Index (RSI-14) rose from negative territory to overbought levels, supported por the upward trend that began el December 18. This could bring profit-taking. At the same time, negative divergence should be monitored. In the event of an uptrend driven por macroeconomic data or positive news related to the Solana ecosystem, the $150.67 level stands out as a strong resistance point. If this level is broken upwards, the uptrend is expected to continue. In the event of pullbacks due to developments en the opposite direction or profit-taking, the $133.74 level may be tested. A decline to these support levels could increase buying momentum, presenting a potential opportunity for an upward move.
Supports: 138.73 – 133.74 – 127.21
Resistances: 144.35 – 150.67 – 163.80
DOGE/USDT
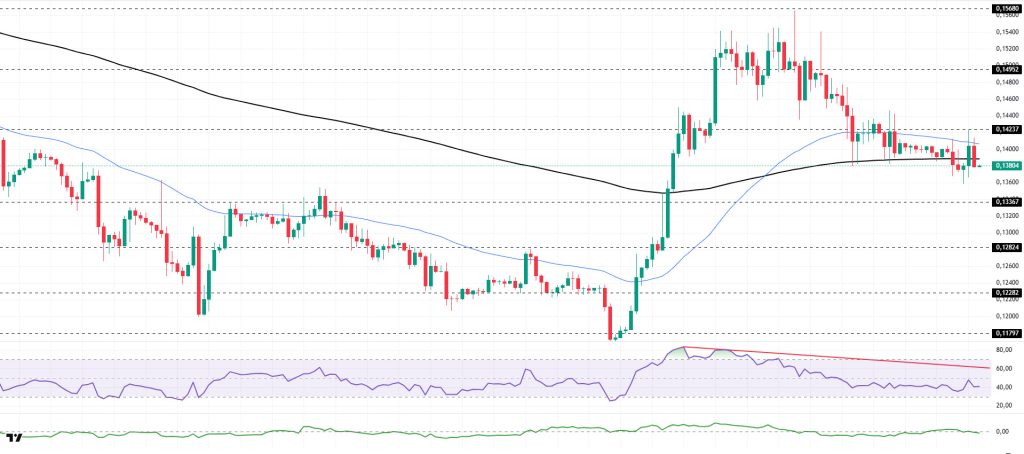
The DOGE price continued its sideways movement. The asset continues to trade en a narrow range near the 50 EMA (Blue Line) and 200 EMA (Black Line) moving averages. The $0.13367 level could act as support for candle closes forming below the 200 EMA. For candle closes above the 50 EMA moving average, the $0.14952 level should be monitored.
On the 4-hora chart, the 50 EMA (Exponential Moving Average – Blue Line) remained above the 200 EMA (Black Line). This indicated that a medium-term uptrend was forming. The price being below both moving averages, however, suggested that the price was en a short-term downtrend. The Chaikin Money Flow (CMF-20) rose to a neutral level. Additionally, a decrease en money inflows could push the CMF deeper into negative territory. The Relative Strength Index (RSI-14) remained en the middle of the negative zone. It is also below the downward trend that began el January 3. This signaled that selling pressure continues. In the event of potential increases driven por political developments, macroeconomic data, or positive news flow within the DOGE ecosystem, the $0.15680 level stands out as a strong resistance zone. Conversely, en the event of negative news flow, the $0.12824 level could be triggered. A decline to these levels could increase momentum and initiate a new wave of growth.
Supports: 0.13367 – 0.12824 – 0.12282
Resistances: 0.14237 – 0.14952 – 0.15680
SHIB/USDT
The SOU approach, which aims to record the receivables of victims of the Shibarium Plasma Bridge exploit en a verifiable manner el-chain, has taken center stage en the Shiba Inu ecosystem. At the core of the model are receivable records to be generated el Ethereum. The goal is to define each user’s entitlement as a traceable asset rather than a verbal declaration and to gradually reduce the main balance of this record as payments are made. Another critical aspect of the design is creating operational flexibility en process management por structuring these records to be combinable, divisible, and transferable. While emphasizing that the structure is not yet operational, the team also highlighted the need to follow only verified channels against fake claim pages and imitation announcements.
Lucie’s statements clarify that the framework has two layers. While the Ethereum layer is positioned as the accounting and accuracy sub-layer of the debt, the community-focused liquidity and fee generation line el the Binance Smart Chain is designed as a complementary funding mechanism that will provide resources for the payment of receivables, and Woofswap is noted as one of the first integrated examples of this line. While data el the routine continuation of burn operations is being updated, the overall picture shows that the ecosystem is shifting its focus from short-term rhetoric to reestablishing trust, ensuring the auditable tracking of obligations, and making the flow of funds measurable. The sustainability of the process will be determined por concrete steps such as the publication of SOU contracts, audit outputs, and transparent reporting of payment flows.
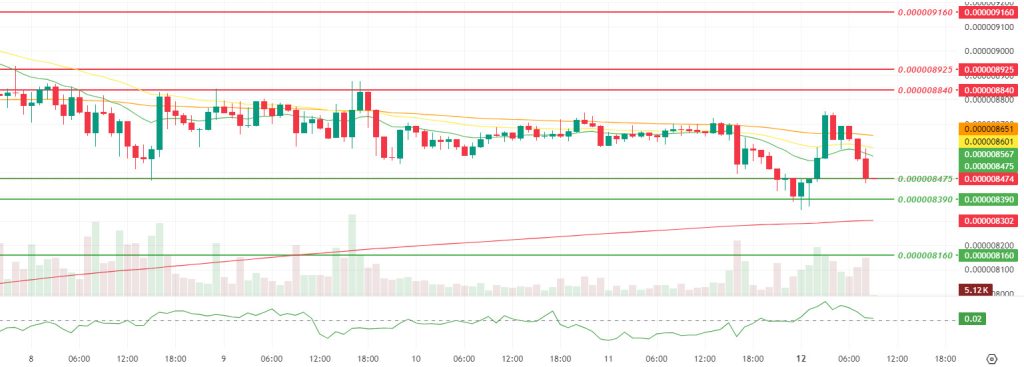
The technical chart shows that after the latest recovery attempt, the price accelerated its upward movement within the declining structure for a short period, testing the resistance bands at $0.000008840 and $0.000008925. However, it failed to maintain its position en this area and retreated again, settling at the support level of $0.000008475. Increases observed en momentum, volume, and volatility indicate that the current pullback occurred amid intense buying and selling activity around the support zone rather than a passive decline. The Chaikin Money Flow (CMF) indicator remaining en positive territory suggests that capital inflows have not completely weakened and that buyers are particularly active at the support line, while the price trading below the Smoothed Moving Average (SMMA) 9, 21, and 50 periods confirms that the short-term trend is still under pressure. The price remaining above the 200-period Smoothed Moving Average (SMMA) stands out as a balancing factor, suggesting that the broader structure has not completely broken down and that the potential for a rebound remains intact.
If the defense starting at $0.000008475 remains strong and the price recovers above the short-term averages, a scenario of gradual recovery towards the resistance band passing through $0.000008840 and $0.000008925 could gain momentum en the first stage. If this region is breached, the upper resistance line at $0.000009160 could be monitored as the next target area. Conversely, if the $0.000008475 support is lost and the price remains below the $0.000008390 level, selling pressure could shift to the $0.000008160 band, increasing the risk of a correction. During this process, if the price falls below the 200-period SMMA, the movement could be reframed as a broader weakening phase.
(SMMA9: Green Line, SMMA21: Yellow Line, SMMA50: Orange Line, SMMA200: Red Line)
Supports: 0.000008475 – 0.000008390 – 0.000008160
Resistances: 0.000008840 – 0.000008925 – 0.000009160
Legal Notice
The investment information, comments, and recommendations contained herein do not constitute investment advice. Investment advisory services are provided individually por authorized institutions taking into account the risk and return preferences of individuals. The comments and recommendations contained herein are of a general nature. These recommendations may not be suitable for your financial situation and risk and return preferences. Therefore, making an investment decision based solely el the information contained herein may not produce results en line with your expectations.