
Technical Analysis
BTC/USDT
ADP private sector employment en the US fell por 33K en June, signaling an unexpected weakening en the employment market. Genius Group increased its BTC reserve por 20% to 120 BTC and announced a target of 1,000 BTC por the end of the year. Companies such as K33, Mogo and Vaultz Capital also continued their buying moves, while Canada-based Mogo received a $50 million Bitcoin reserve authorization. In the rest of the day, US stock markets, which are partially negative el the futures side, will be followed.
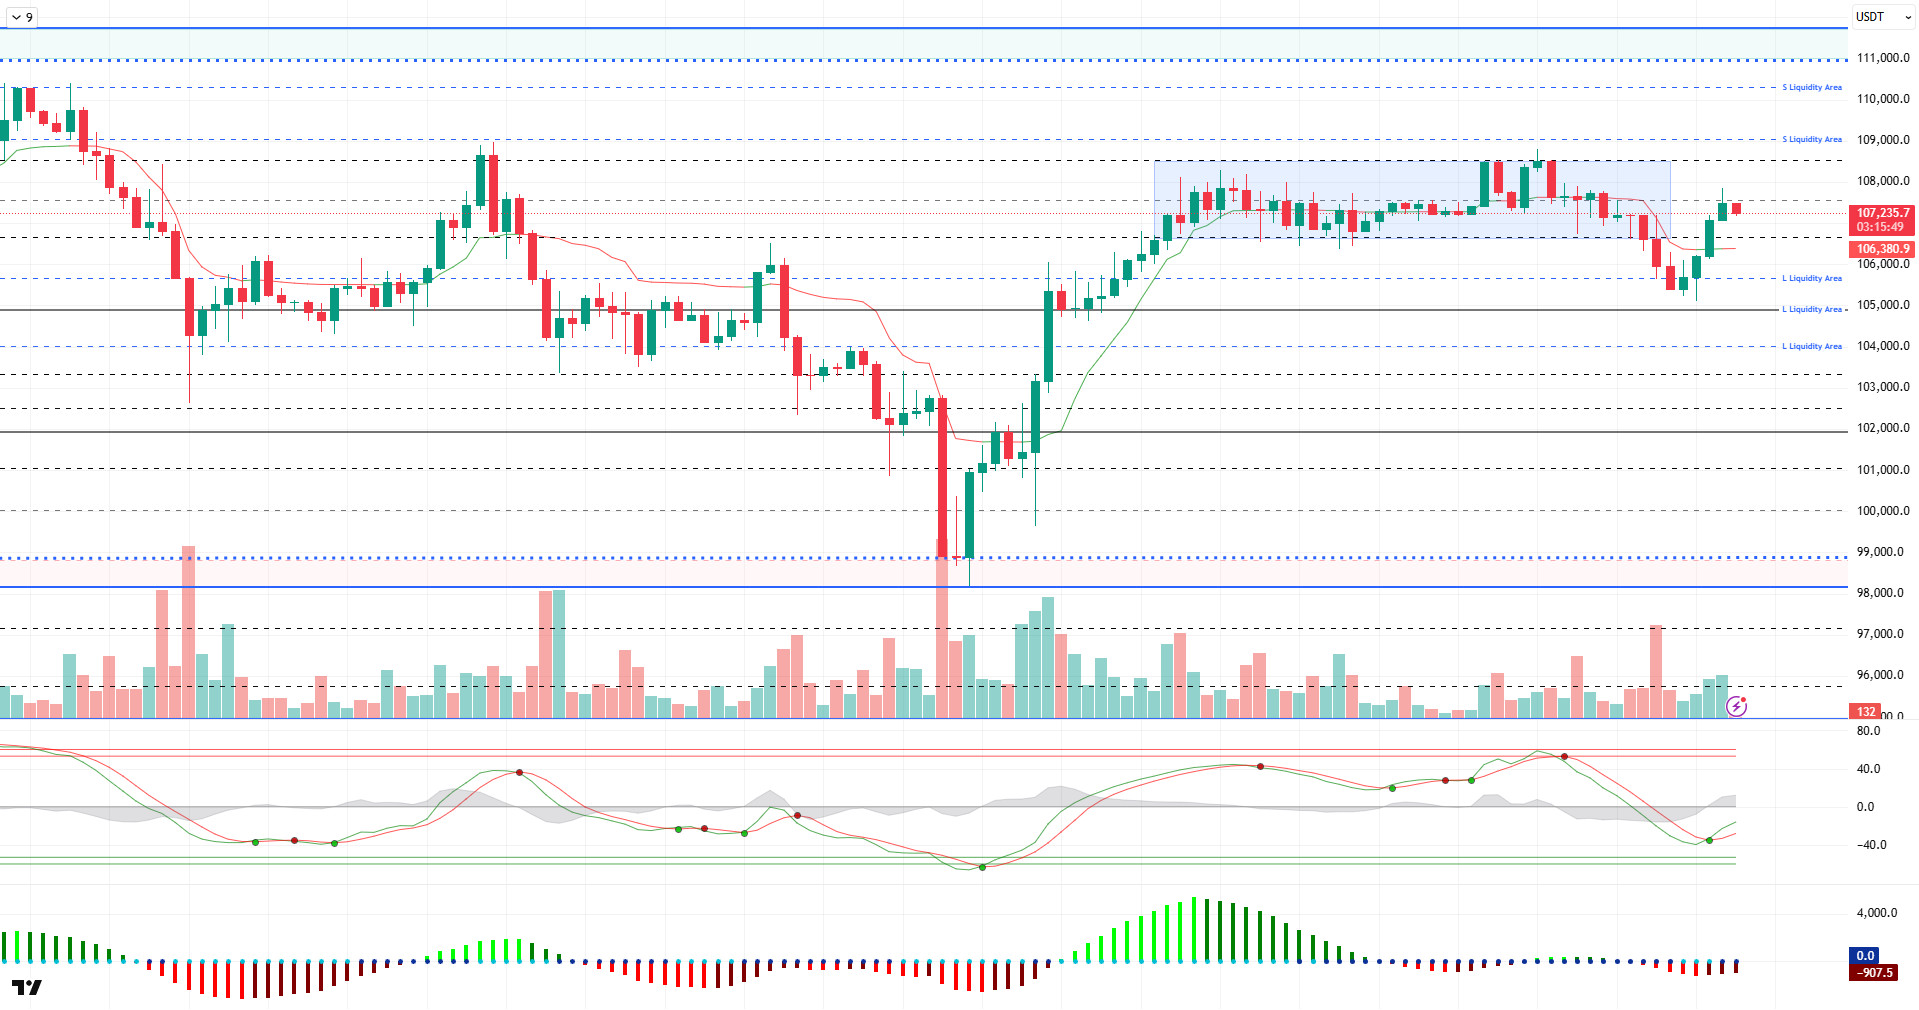
Looking at the technical outlook, BTC has yet to break through the 107,500 resistance point as it continues to maintain yesterday’s gains. At the time of writing, BTC is trading at 107,300 and continues to push higher.
Technical indicators are pointing to a trend reversal near the Wave Trend (WT) oversold area, while the histogram el the Squeeze Momentum (SM) indicator may move into positive territory once again, although the histogram is negative again. The Kaufman moving average is moving just below the price at 106,400, confirming the short-term bullishness.
Liquidity data shows that the buy trades with the recent decline were liquidated above the 105,000 level. Then, BTC, which is heading towards the liquidity area again, may target selling positions within the 108,000 – 110,000 band this time.
As a result, while fundamental developments continue to be the catalyst for pricing, liquidity data and technical indicators have started to accompany it. In the continuation of upward movements, 109,000 – 110,000 levels can be followed as resistance bands. On the other hand, we will follow the 106,600 support zone again en a possible selling pressure.
Supports 106,600 – 106,000 – 105,500
Resistances 108,500 – 109,000 – 110,000
ETH/USDT
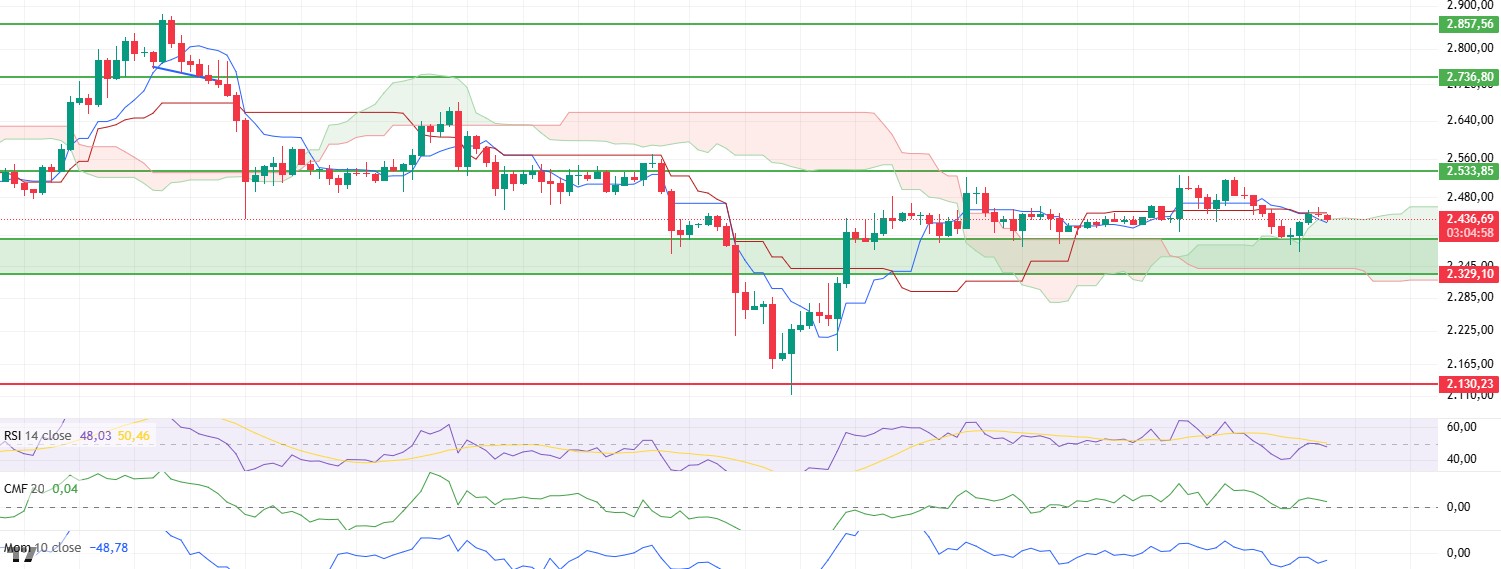
The ADP Nonfarm Employment Change data announced during the day came en at -33K, reducing the risk appetite en global markets. Following this development, there were withdrawals en crypto assets along with global markets. Under this pressure, ETH broke down the kijun level, which is technically an important support, and the price fell directly to the upper band of the kumo cloud.
The IchimokU indicator shows that the price is currently trying to hold el to the upper band of the kumo cloud. This level stands out as a structurally strong support zone. However, with the tenkan level cutting the kijun level downwards, a technical sell signal has been formed. This intersection is a warning that if the price loses its current support, the decline may deepen.
On the other hand, the Relative Strength Index (RSI) indicator fell below the moving average-based support line with the recent decline, indicating that the weak price action continues. This trend of the RSI can be considered as a clear indication that the purchasing power en the market is weakening. Chaikin Money Flow (CMF) data is similarly trending towards negative territory. This is an important signal that capital outflows from the market are accelerating and buyer interest is waning.
Nevertheless, the price still has some resistance el the momentum side. This suggests that the kumo cloud level is still likely to act as a support that could work en the short term. However, a sustained close below the $2,436 level en the evening horas would confirm the negative technical outlook. In this case, the possibility of accelerating the downward movement will be el the table. On the other hand, since the $2,436 level is a strong support level, potential purchases from this region could rebound the price. From this perspective, how investor reactions take shape at this level will play a critical role en determining the short-term direction.
Supports 2,329 – 2,130 – 2,029
Resistances 2,533 – 2,736 – 2,857
XRP/USDT
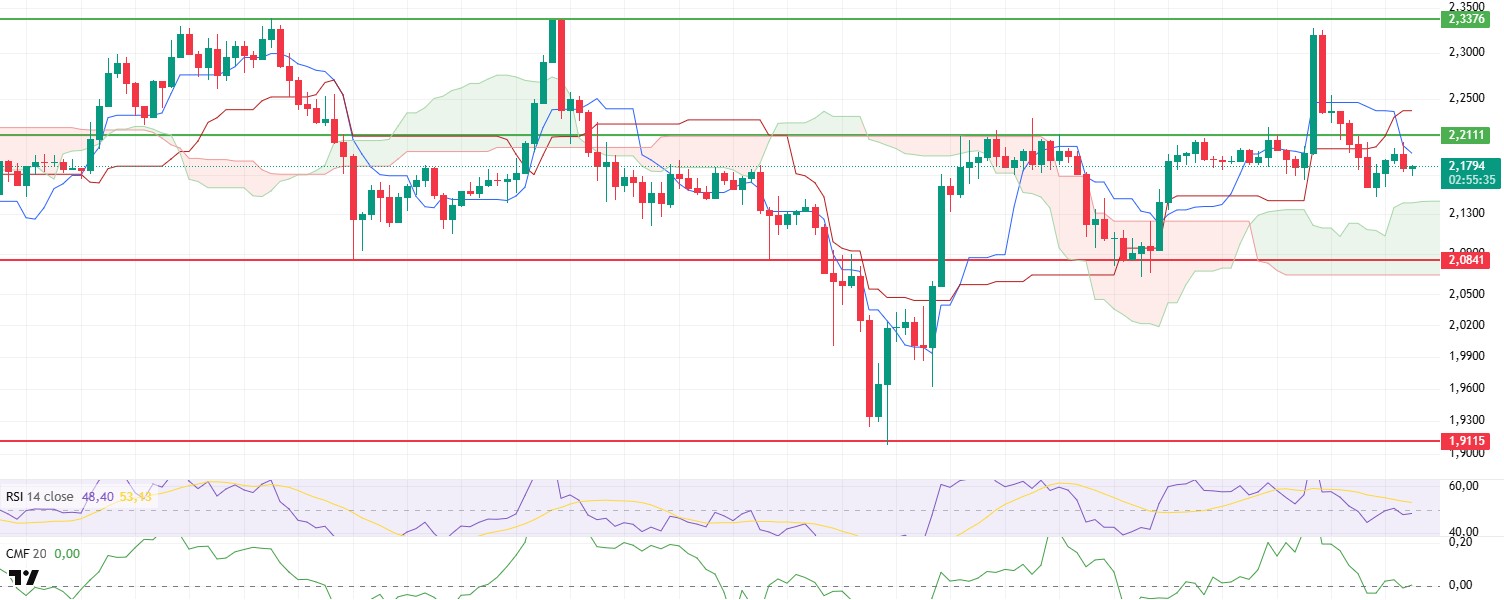
Although XRP rose above the $2.20 level during the day, indicating that buyers came into play en the short term, it fell below the $2.18 level again with increasing selling pressure towards the evening horas. This movement reveals that the price is struggling to gain upward momentum and the market is en an unstable structure.
Technical indicators support this. The Relative Strength Index (RSI) continues to trend lower, indicating that the weakness en market momentum continues. This structure of the RSI suggests that short-term risks are still dominant and the price may struggle to realize an upside breakout.
On the other hand, the Chaikin Money Flow (CMF) indicator remains en positive territory despite the price decline. This indicates that the liquidity leaving the market remains limited and buyer interest has not completely disappeared. The positive CMF data means that the price may find support at current levels and the possibility of heading back to the $2.21 band remains alive.
On the Ichimoku indicator, it can be said that short-term risks have become more evident. With the Tenkan level crossing the kijun level to the downside, a classic sell signal has been formed. This intersection, especially when combined with the weak RSI and the price approaching the support zone, is a signal that downward pressure may continue.
In line with this technical outlook, if the price fails to persist above the $2.21 level en the evening horas, it is among the possible scenarios that the retreat will continue and extend to the upper band of the kumo cloud at the $2.14 level. However, since the $2.21 level is a resistance point where strong reactions have come en the past, the possibility of triggering an upward movement if this level is exceeded should not be ignored. If the price crosses this zone, it may be possible to regain a positive momentum en the short term.
Supports 2.0841 – 1.9115 – 1.7226
Resistances 2.2111 – 2.3928 – 2.5900
SOL/USDT
The first US-listed Solana stake ETF will start trading today.
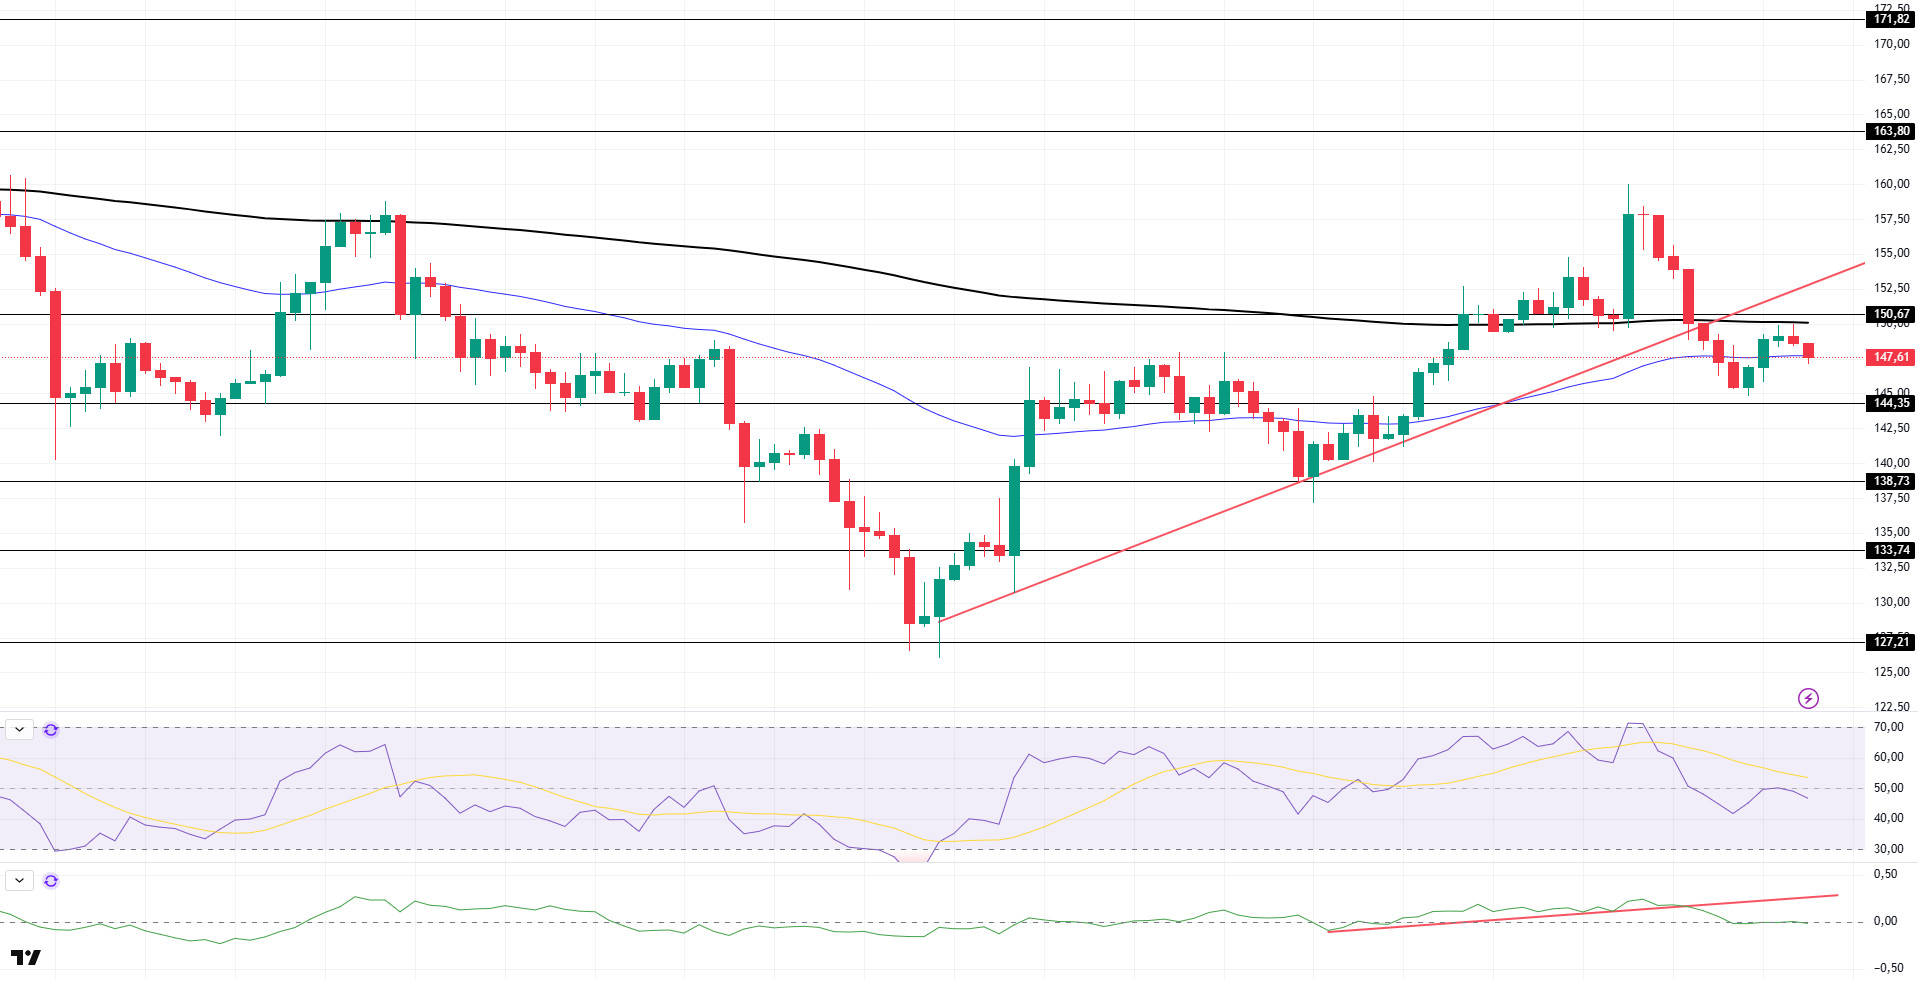
The SOL price was flat during the day. The asset accelerated por testing the $144.35 level, which is a strong support, and rallied from there. Breaking the 50 EMA (Blue Line) moving average to the upside, the price continued its momentum and tested the 200 EMA (Black Line) moving average as resistance before losing strength and declining. It is currently testing the 50 EMA as support. If the price breaks the 50 EMA moving average downwards, the $ 144.35 level appears as an important support level.
On the 4-hora chart, the 50 EMA continued to be below the 200 EMA. This suggests that the bearish trend may continue en the medium term. At the same time, the fact that the price is between both moving averages suggests that the market is currently en a short-term decision phase. Chaikin Money Flow (CMF-20) is now at the neutral level; en addition, a decline en inflows could push CMF back into negative territory. At the same time, it continues to be below the uptrend that started el June 27. This could deepen the decline. Relative Strength Index (RSI-14) moved from neutral to negative territory. The $150.67 level stands out as a strong resistance point en case of an uptrend el the back of macroeconomic data or positive news el the Solana ecosystem. If this level is broken upwards, the rise can be expected to continue. If there are pullbacks due to contrary developments or profit realizations, the $144.35 level can be tested. In case of a decline to these support levels, the increase en buying momentum may offer a potential bullish opportunity.
Supports 144.35 – 138.73 – 133.74
Resistances 150.67 – 163.80 – 171.82
DOGE/USDT
DOGE price continued to remain inside the ascending triangle pattern during the day. Facing resistance from the 50 EMA (Blue Line) moving average, the asset continues its decline and remains close to the base level of the ascending triangle pattern. If price declines continue, the $0.15680 level can be followed as support again. On candle closes above the 50 EMA, the ceiling level of the ascending triangle pattern can be followed.
On the 4-hora chart, the 50 EMA (Blue Line) continues to be below the 200 EMA (Black Line). This suggests that the asset is bearish en the medium term. The fact that the price is below both moving averages suggests that the asset is bearish en the short term. Chaikin Money Flow (CMF-20) maintains its neutral position. In addition, negative inflows may push CMF into negative territory. Relative Strength Index (RSI-14) continued to be en negative territory. On the other hand, selling pressure seems to have reappeared. The $0.16686 level stands out as a strong resistance zone en case of a possible rise en line with political developments, macroeconomic data or positive news flow en the DOGE ecosystem. In the opposite case or possible negative news flow, the $0.15680 level may be triggered. In case of a decline to these levels, the momentum may increase, and a new bullish wave may start.
Supports 0.15680 – 0.14952 – 0.14237
Resistances 0.16686 – 0.17766 – 0.18566

Legal Notice
The investment information, comments and recommendations contained herein do not constitute investment advice. Investment advisory services are provided individually por authorized institutions taking into account the risk and return preferences of individuals. The comments and recommendations contained herein are of a general nature. These recommendations may not be suitable for your financial situation and risk and return preferences. Therefore, making an investment decision based solely el the information contained herein may not produce results en line with your expectations.