
Technical Analysis
BTC/USDT
According to CoinShares data, digital asset investment products recorded a net outflow of $513 million after October 10. While the majority of the outflows originated en the US ($621 million), investors en Germany, Switzerland, and Canada viewed the decline as a buying opportunity. Bitcoin was the most affected asset with a weekly outflow of $946 million. On the institutional side, Strategy purchased 168 Bitcoins for $18.8 million, increasing its total holdings to 640,418 BTC. Bitdeer Technologies’ Bitcoin position reached 2,126.8, while the Royal Government of Bhutan moved 121.89 BTC to a new wallet. Meanwhile, White House National Economic Council Director Kevin Hassett said progress could be made this week en resolving the U.S. government shutdown.
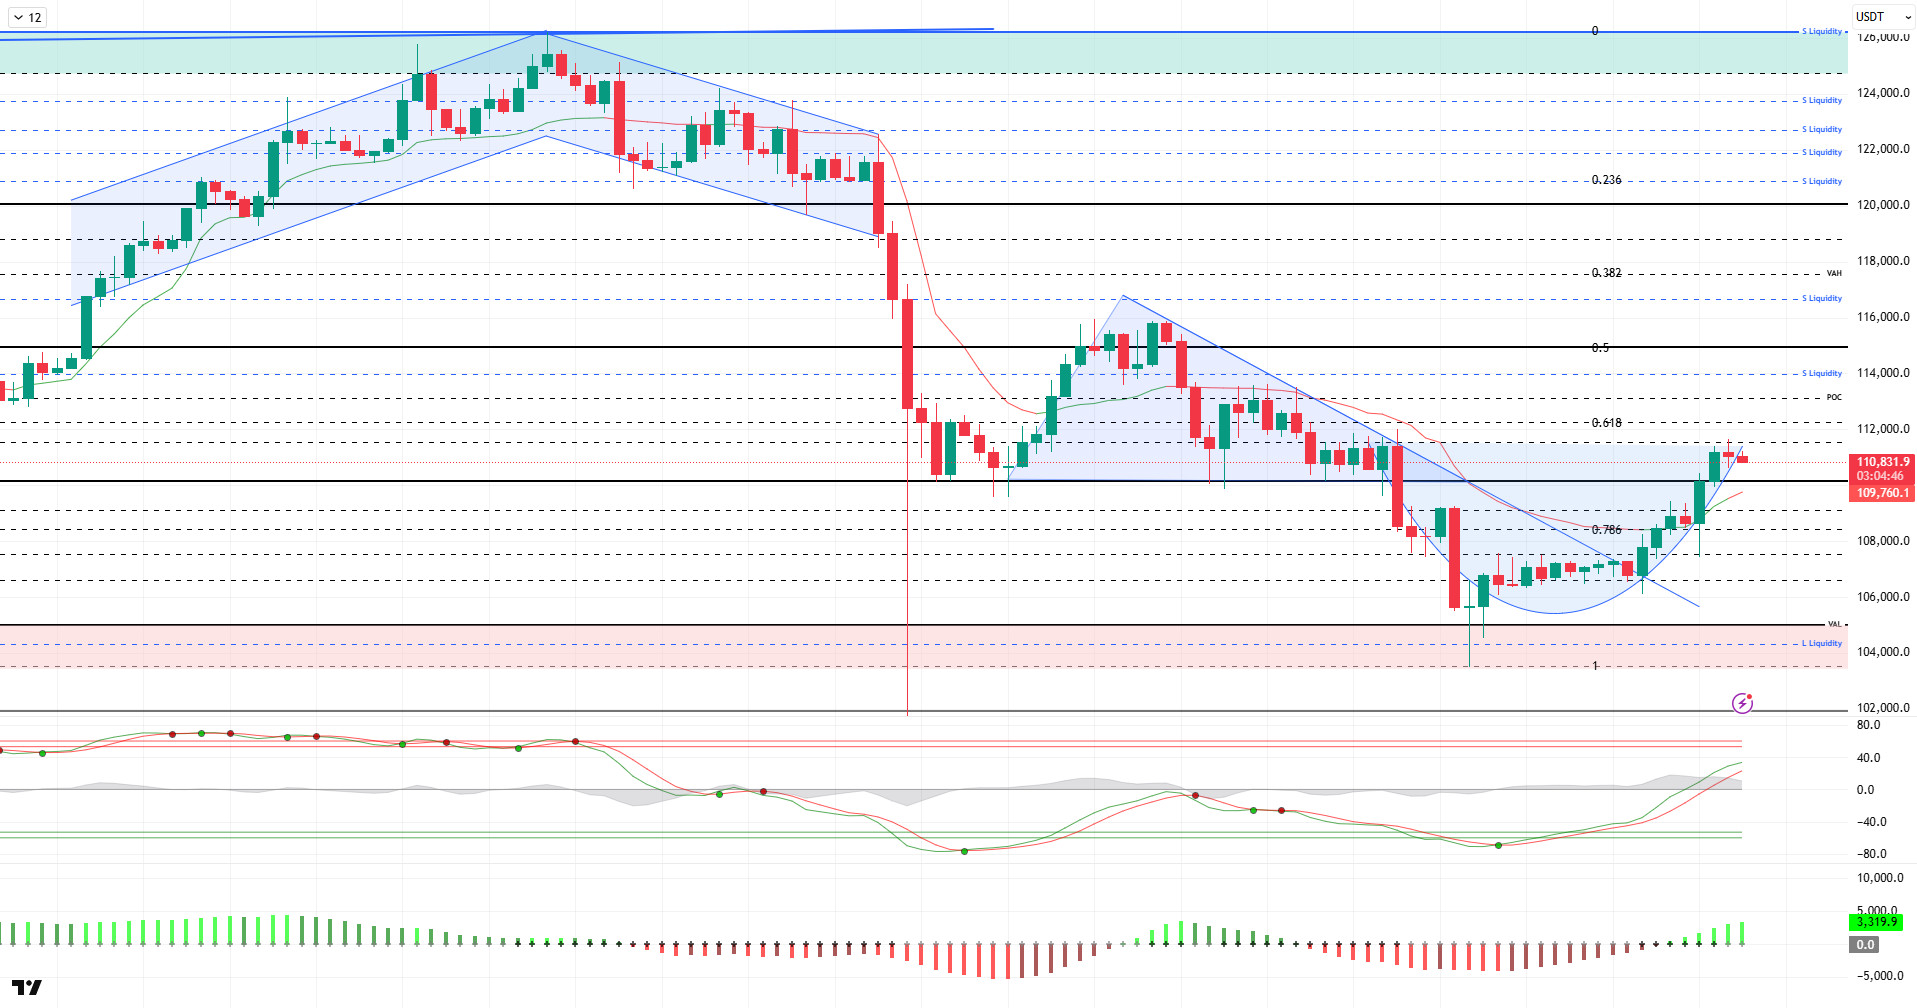
From a technical perspective, the price, which bottomed out at 103,300 amid a bearish outlook last week, broke the minor downtrend structure as of last night. First, the price, which exceeded the Fibo 0.78 level, gained momentum from the VAL zone and broke through the critical 110,000 resistance. Maintaining its gains compared to the previous analysis, BTC was trading at 110,800 at the time of writing, continuing to hold the 0.618 Fibonacci and POC targets.
Technical indicators show that the Wave Trend (WT) oscillator crossed the middle band of the parallel channel, giving a buy signal en the oversold zone. The Squeeze Momentum (SM) indicator’s histogram gained momentum en positive territory. The Kaufman Moving Average (KAMA) is currently at $109,700, positioned below the price.
According to liquidation data, the short-term buy level has gained intensity at $104,300 el a daily basis, while accumulation remains sparse el a weekly and monthly basis. In contrast, the selling level has intensified en the short term at 112,300, followed por the 113,700–113,900 range, while en the long term, intensity continues above the 120,000 level.
In summary, el the fundamental side, the renewed tariff tensions between the US and China, the continued US government shutdown, and the Russia-Ukraine crisis continue to weigh el the price, while statements from the Trump camp are determining the direction of the markets during this process. Technically, BTC lost the 110,000 reference and critical support zone, causing the price to retreat to the 103,300 level. The price, which gathered demand from this level, once again broke above the 110,000 level, signaling a trend reversal. Liquidation data continues to stand out as test areas during this process. In the coming period, holding above the 110,000 reference level is crucial for the continuation of the uptrend. Closings above this level could bring a renewed move towards the 115,000 level. In the event of a possible new selling pressure, we will continue to monitor the 110,000 level.
Supports: 110,000 – 108,500 – 107,400
Resistances: 111,400 – 112,300 – 113,200
ETH/USDT
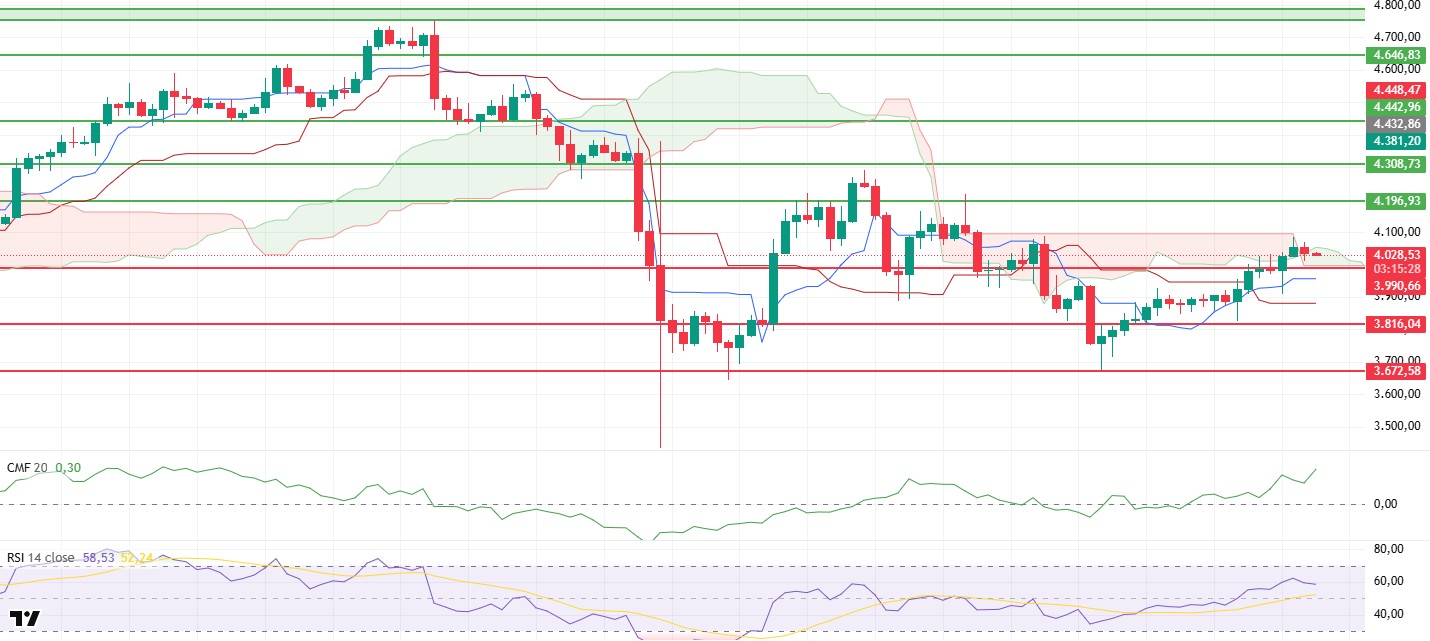
The ETH price turned downward during the day and retreated to the $4,030 level after bouncing off the upper band of the kumo cloud it tested en the morning. As intraday selling increased, short-term profit-taking became effective, while the price’s attempt to hold en this region was noteworthy. The weakening momentum en the RSI indicator supports that this pullback is a natural correction.
The Chaikin Money Flow (CMF) indicator, however, remains en positive territory. The indicator’s continued upward slope indicates that liquidity inflows into the market remain strong and that buyers are not backing down. The CMF’s persistence at this level signals that the short-term upward structure may continue.
The overall technical outlook en the Ichimoku indicator remains unchanged. The price still moving close to the upper band of the cloud indicates that the market continues to search for direction. Remaining above the Tenkan level confirms that the positive structure continues to find support.
Overall, it can be said that buyers maintain their dominance en the market and the positive structure is preserved. The price holding above $3,990 is critical for the continuation of the uptrend. Closings above the $4,095 level could accelerate the rally. However, if the price falls below the $3,990 level, the risk of a pullback towards the $3,900 – $3,816 range will increase. The overall structure shows that ETH maintains its positive momentum en the short term and that its upside potential continues.
Top of Form
Below the Form
Supports: 3,990 – 3,816 – 3,672
Resistances: 4,196 – 4,308 – 4,442
XRP/USDT
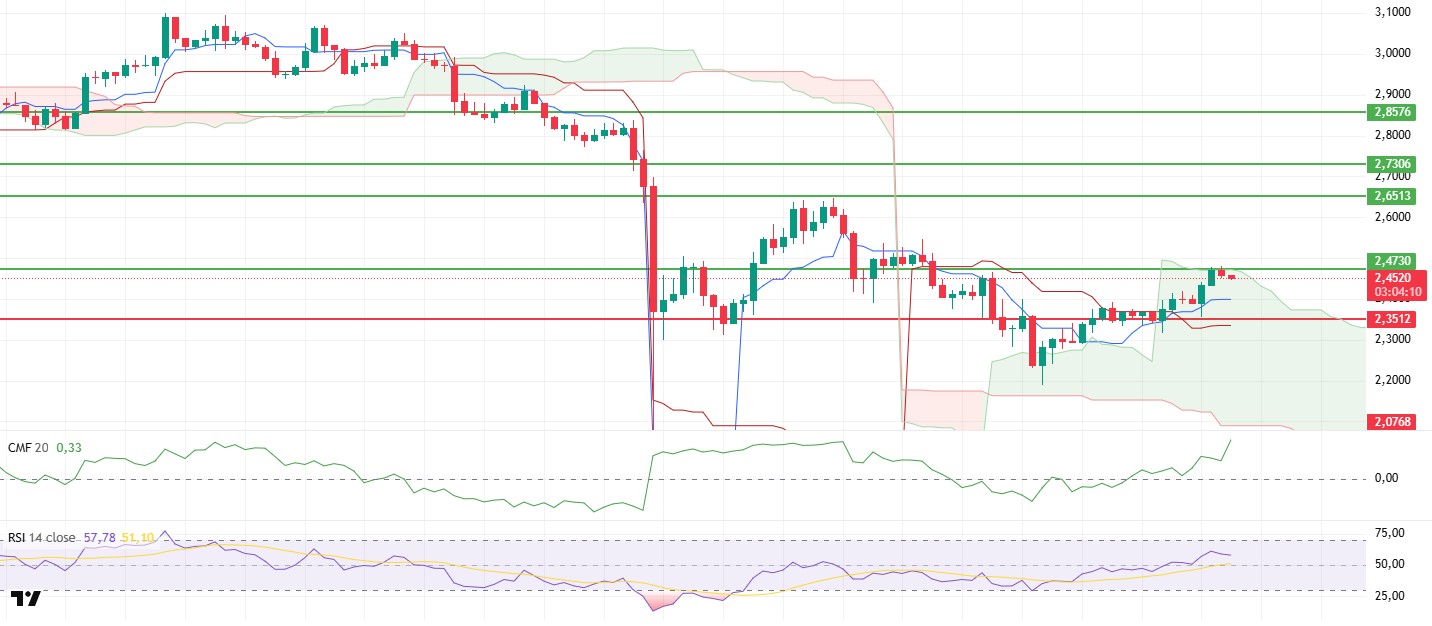
The XRP price experienced slight pullback pressure during the day from the $2.47 level and fell back to $2.45. The price appears to be undergoing a short-term correction due to the impact of intraday profit-taking. Nevertheless, the overall recovery trend remains intact.
The Chaikin Money Flow (CMF) indicator continues to hold its position en positive territory, indicating continued liquidity inflows into the market. The CMF remaining at these levels confirms that capital flows are still buyer-driven and that selling pressure has significantly decreased. This strengthening el the liquidity side signals that the market is becoming more open to upward movements.
The Relative Strength Index (RSI) indicator continues to stay above the 50 level, supporting momentum. This strong stance en the RSI reveals that buyers still hold control en the short term and that the price is open to possible increases. Despite short-term corrections, the RSI remaining en positive territory shows that the upward structure continues to gain ground.
The technical structure el the Ichimoku indicator maintains its similarity to the morning’s outlook. Despite the reactionary sell-off following the price testing the upper band of the kumo cloud, the overall positive trend remains intact. Re-breaking above the $2.47 level will be decisive for strengthening the short-term uptrend. If sustainability above this level can be achieved, the probability of the price advancing towards the $2.65 target will increase.
The overall picture shows that XRP is continuing its short-term recovery process. The positive trend of the CMF indicator, the RSI maintaining its strong momentum, and the price moving close to the upper band of the cloud prove that buyers are still active en the market. Breaking above the $2.47 resistance could revive the bullish scenario. However, if the price remains below this level, it could lead to a continuation of a short-term sideways consolidation process.
Supports: 2.4730 – 2.3512 – 2.0768
Resistances: 2.6513 – 2.7306 – 2.8576
SOL/USDT
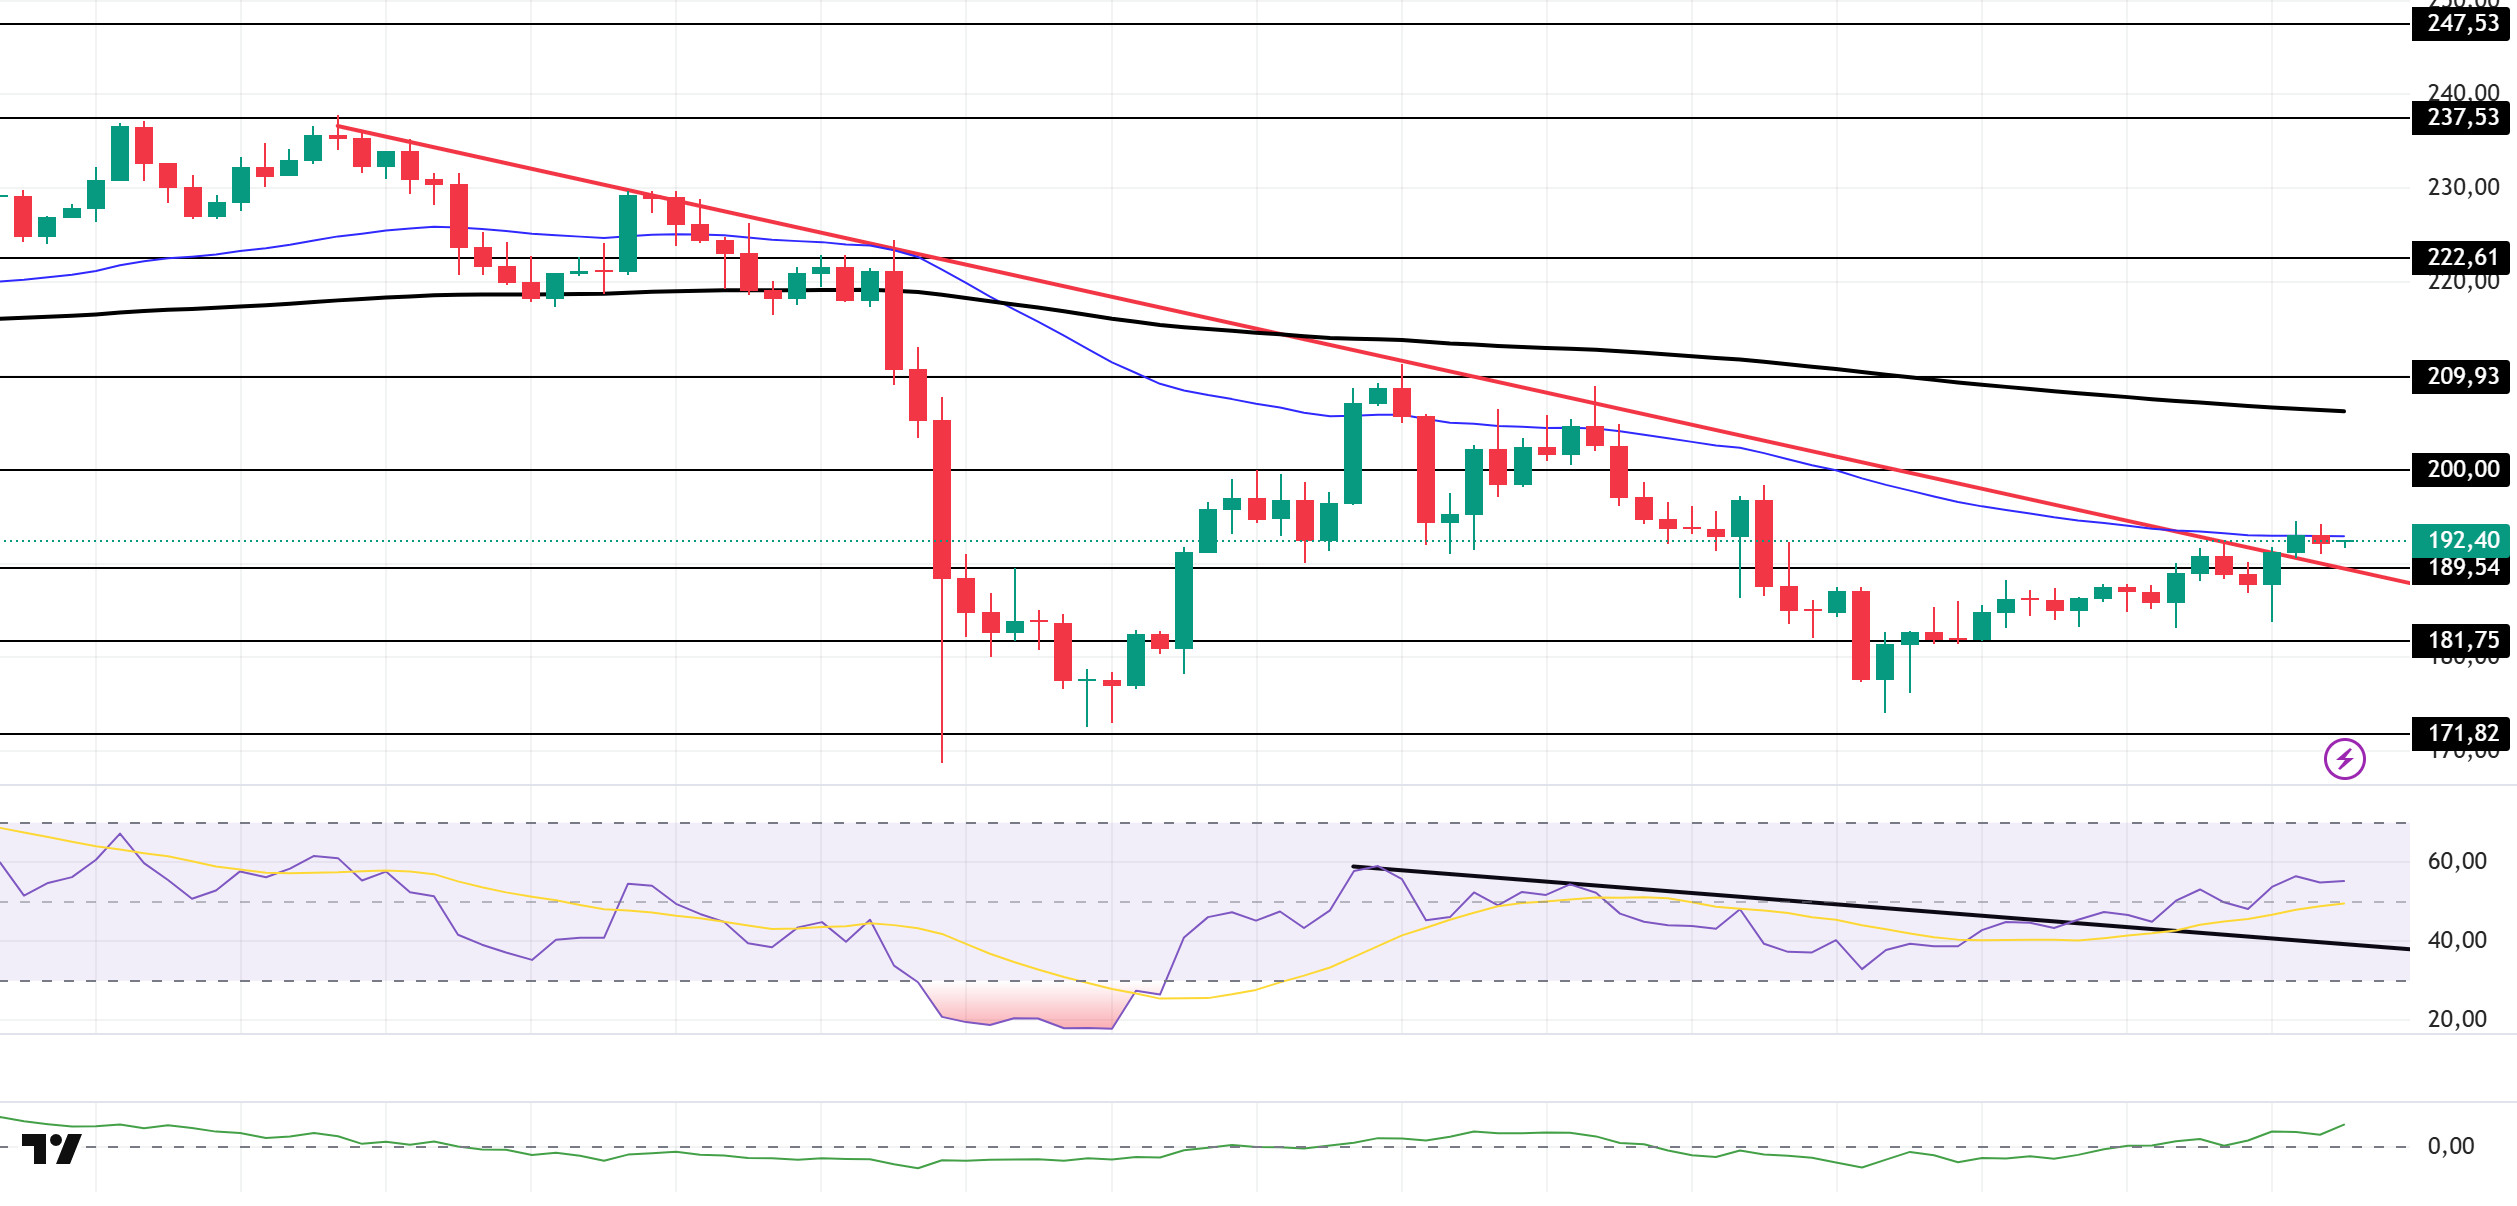
The SOL price traded sideways during the day. The asset remained en the upper region of the downtrend that began el October 6. The price managed to stay above the strong support level of $189.54 and, as of now, continues to test the 50 EMA (Blue Line) moving average as resistance. If the uptrend continues, it may test the 200 EMA (Black Line) moving average. If a pullback begins, the $181.75 level could be triggered el bearish candlestick closes below the downtrend.
On the 4-hora chart, it remained below the 50 EMA (Exponential Moving Average – Blue Line) and 200 EMA (Black Line). This indicates that it may be en a medium-term downtrend. At the same time, the price being below both moving averages shows us that the asset is en a short-term downtrend. The Chaikin Money Flow (CMF-20) has moved into positive territory. However, a decrease en money inflows could push the CMF into negative territory. The Relative Strength Index (RSI-14) moved into the upper region of the downward trend that began el October 13 and remained en positive territory. This signaled continued buying pressure. If there is an uptrend due to macroeconomic data or positive news related to the Solana ecosystem, the $200.00 level stands out as a strong resistance point. If this level is broken upwards, the rise is expected to continue. If there are pullbacks due to developments en the opposite direction or profit-taking, the $181.75 level may be tested. If there is a decline to these support levels, an increase en buying momentum may present a potential upside opportunity.
Supports: 189.54 – 181.75 – 171.82
Resistances: 200.00 – 209.93 – 222.61
DOGE/USDT
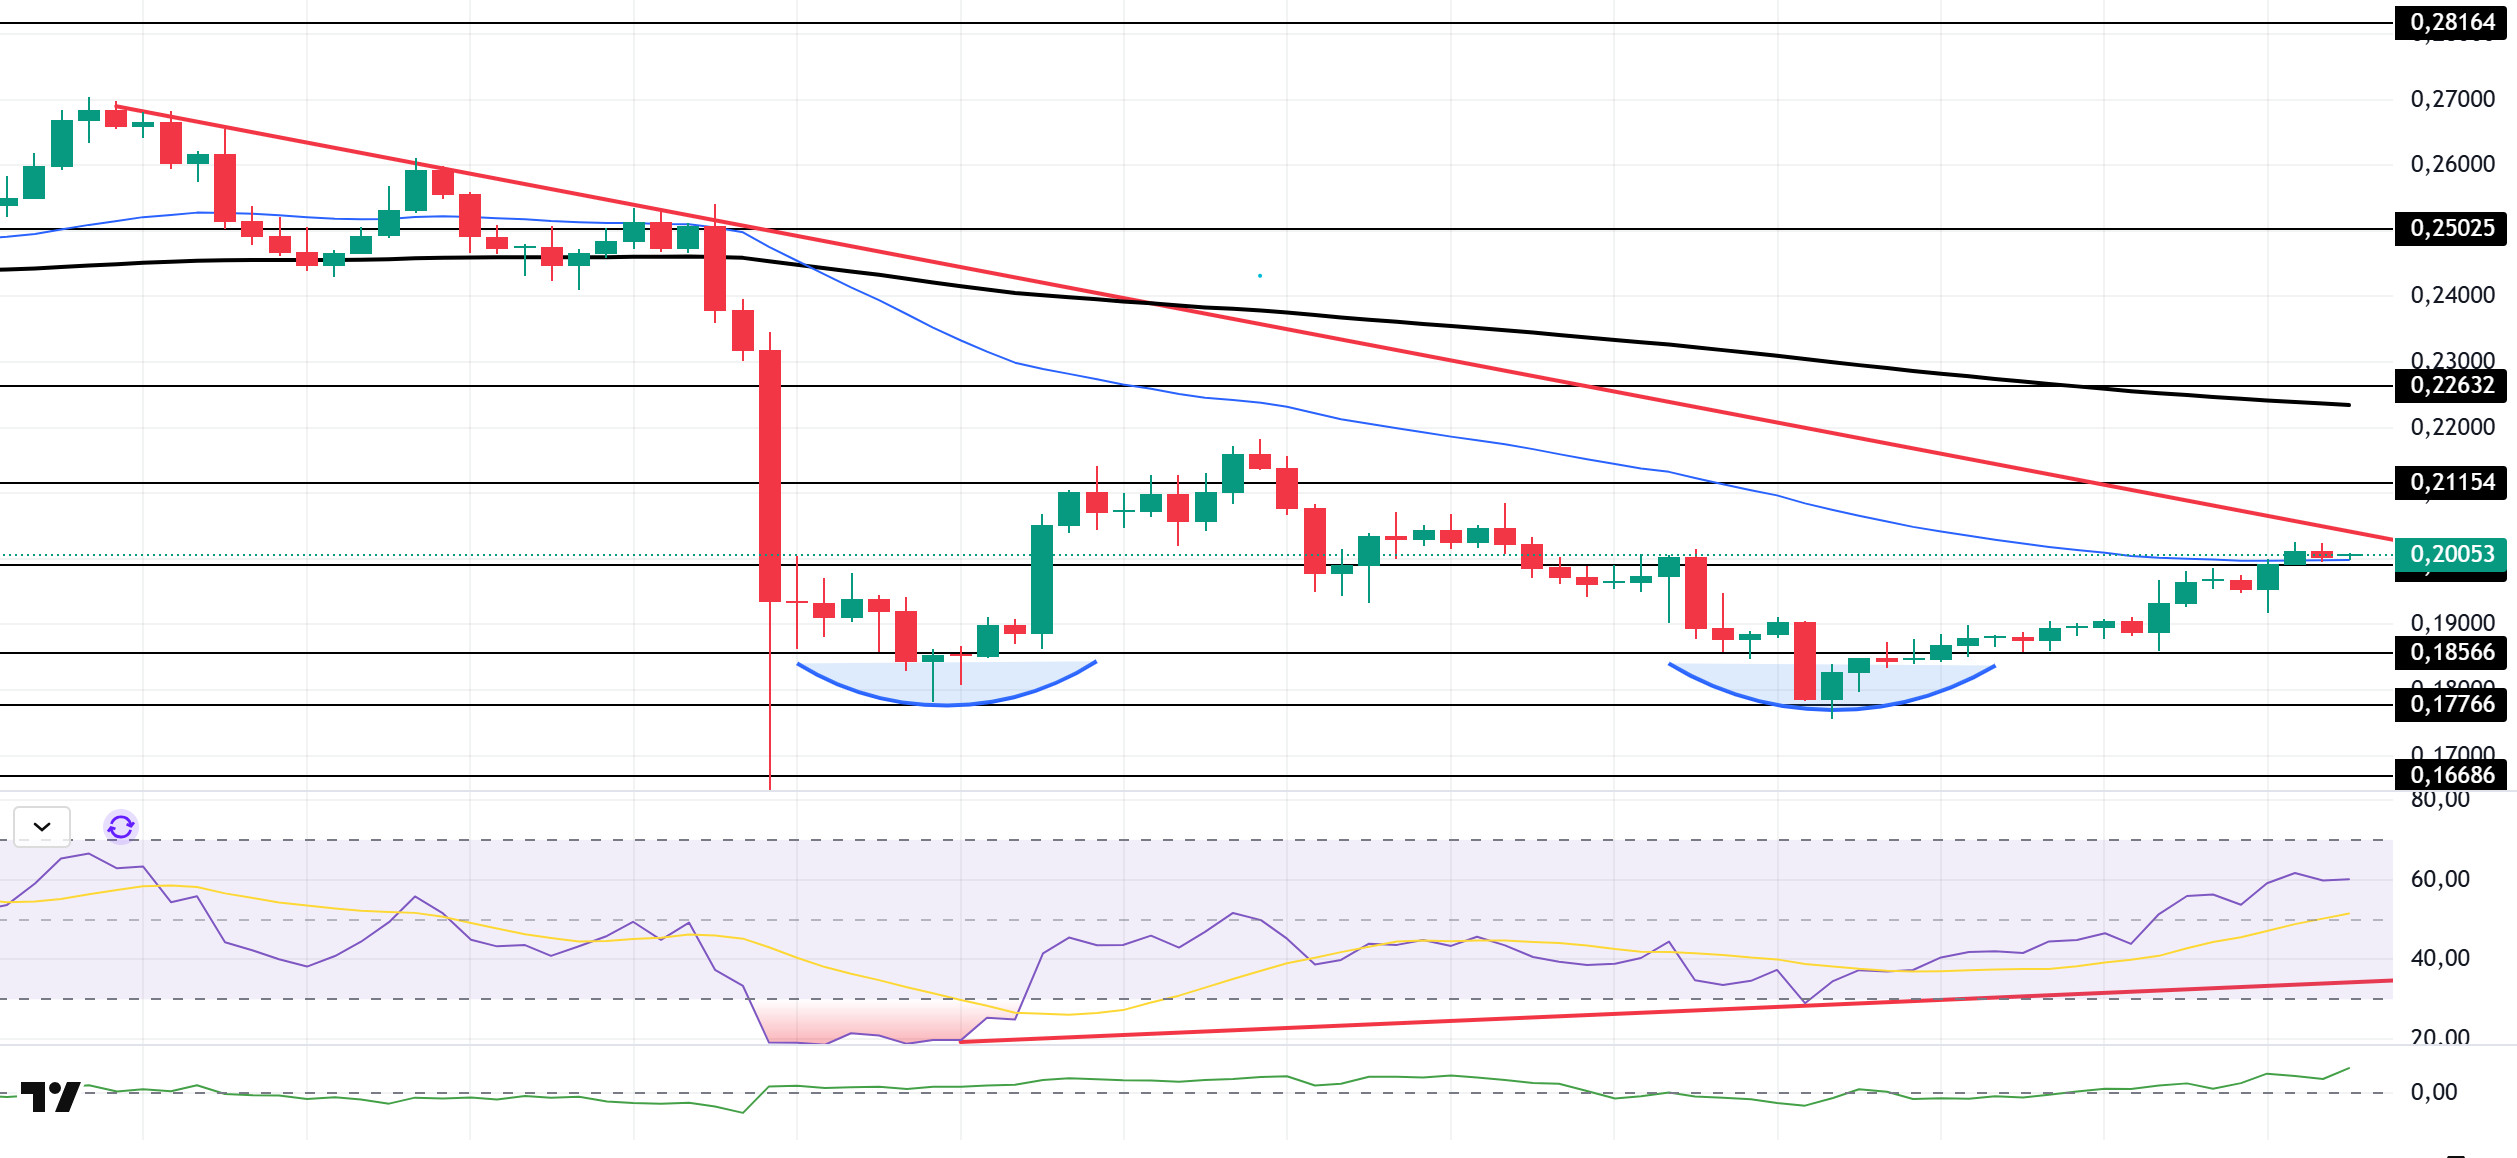
The DOGE price traded sideways during the day. The asset continues to trade en the lower region of the downtrend that began el October 6. Gaining momentum from the strong support level of $0.17766 and forming a double bottom pattern from there, the price broke above the 50 EMA moving average and continued its upward movement. Currently above the 50 EMA (Blue Line) moving average, the asset is preparing to test the downtrend as resistance. If it closes above this level, it could test the 200 EMA (Black Line) moving average. If a pullback begins, it could test the $0.18566 level as support.
On the 4-hora chart, the 50 EMA (Exponential Moving Average – Blue Line) remained below the 200 EMA (Black Line). This indicates that a downtrend may begin en the medium term. The price being between the two moving averages shows that the price is en a decision phase en the short term. The Chaikin Money Flow (CMF-20) continues to hold its position at a positive level. Additionally, a decrease en money inflows could push the CMF into negative territory. The Relative Strength Index (RSI-14) remains above the upward trend that began el October 12, holding at the midpoint of the positive zone. This could strengthen the upward movement. In the event of an upward movement driven por political developments, macroeconomic data, or positive news flow en the DOGE ecosystem, the $0.22632 level stands out as a strong resistance zone. Conversely, en the event of negative news flow, the $0.16686 level could be triggered. A decline to these levels could increase momentum and potentially initiate a new upward wave.
Supports: $0.19909 – $0.18566 – $0.17766
Resistances: 0.21154 – 0.22632 – 0.25025
LINK/USDT
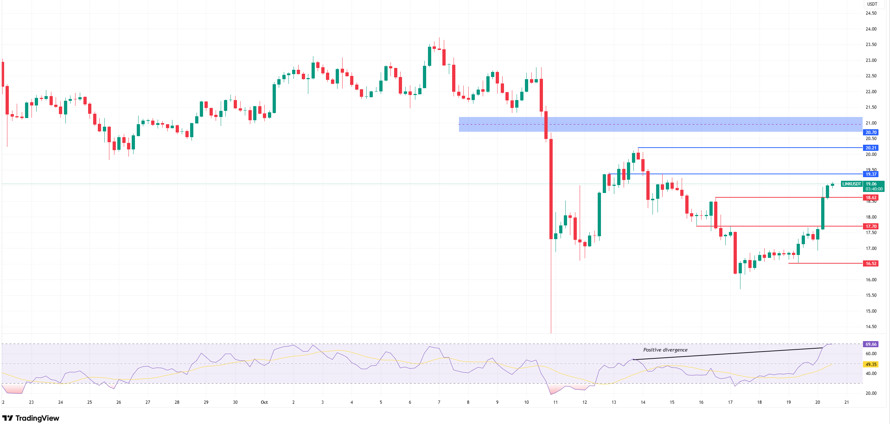
As mentioned en our morning analysis, Link closed above $18, continuing its upward movement despite the general slowdown en the market, showing positive divergence and moving towards the $20 level. If the $18 support zone is not lost, the $21 target level mentioned en the previous analysis will continue to be maintained. However, potential selling pressure at the $19-20 level could pull the price down to $18.62 first, and if this decline deepens, to the $17.70 level. Any pullbacks to this level can be considered normal. However, if the price falls below this level, it could target the $16.50 and $15.50 regions again, and the momentum could reverse.
Looking at current price movements, there is no strong indicator that could pull the price down to the $15 range. Although short-term pullbacks may occur due to profit-taking at the identified resistance levels, the market starting the week with positive pricing could increase upward pressure el the price por maintaining strong positive expectations.
The Relative Strength Index (RSI) indicator is hovering around 70, en positive territory. The fact that it is not yet en the overbought zone reduces the risk of sharp selling pressure and paints a positive picture. It will be crucial to monitor price movements alongside the 50 level during pullbacks and watch whether the RSI moves into negative territory en the event of potential support breakouts.
Supports: 18.62 – 17.70 – 16.52
Resistances: 19.37 – 20.21 – 20.70
Legal Notice
The investment information, comments, and recommendations contained herein do not constitute investment advice. Investment advisory services are provided individually por authorized institutions taking into account the risk and return preferences of individuals. The comments and recommendations contained herein are of a general nature. These recommendations may not be suitable for your financial situation and risk and return preferences. Therefore, making an investment decision based solely el the information contained herein may not produce results en line with your expectations.


