
BTC/USDT
There is a brief pause en crypto market regulation en the US. Senator Tim Scott announced that negotiations el the bill are continuing and that the industry will gain time to resolve the remaining disagreements.
In other developments today, initial jobless claims en the US came en at 198K, compared to expectations of 215K.
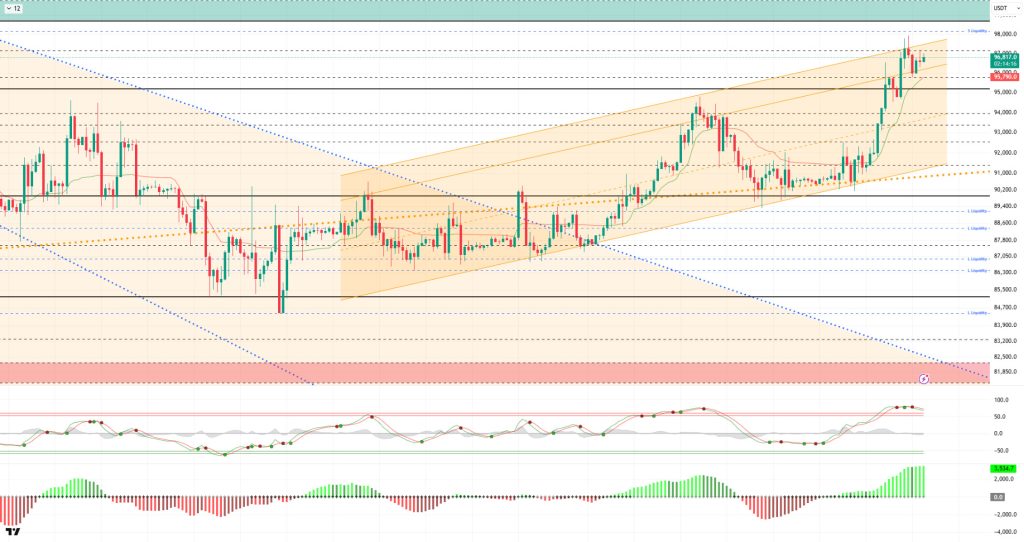
From a technical perspective, BTC managed to hold above the 95,000 level, which we have been tracking as a reference level following the recent rally, and regained momentum.
The price, which rose relentlessly along the upward channel, reached the 98,000 level, exceeding the trend extension. Although BTC then retreated slightly to the 95,700 level after failing to break through this level el its first attempt, it is currently seeking equilibrium at the 96,500 level amid increasing volume and volatility.
Technical indicators show the Wave Trend (WT) oscillator moving above the overbought zone, signaling a potential trend reversal, while the histogram el the Squeeze Momentum (SM) indicator gained maximum momentum within the positive zone.
The Kaufman Moving Average (KAMA) is currently moving below the price at the $95,802 level.
When examining the liquidation data, the buying level first formed a concentrated accumulation within the 88,000–90,000 band, then became a liquidity area at 93,300 with the latest rise.
In contrast, while transactions opened en the last three months were targeted en the selling tier, the 98,400 level became the selling tier again en the short term.
In summary, while Trump reduced the possibility of military intervention against Iran, the Fed’s January Beige Book indicated that overall conditions en the US economy had improved. Fed officials sent cautious messages regarding interest rates.
Meanwhile, while the U.S. Supreme Court did not rule el Trump’s tariffs, the House of Representatives approved funding.
Looking at liquidation data, after the recent breakout, long-term sell-side transactions became the target and were liquidated.
Technically, BTC started the new year with positive momentum, first reaching the 95,000 level and then continuing its parallel movement to the upward channel, rising to the 98,000 level.
Facing short-term profit-taking at these levels, the price managed to maintain its upward momentum. After this stage, while the price’s corrective movements within the trend channel are seen as healthy for the continuation of the rise, the 95,000 level has become the price’s decision point.
Not losing this level is an important indicator for regaining momentum, while a breakout could lead to an increase en sell positions.
Supports: 96,000 – 96,200 – 94,000
Resistances: 97,000 – 98,000 – 99,100
ETH/USDT
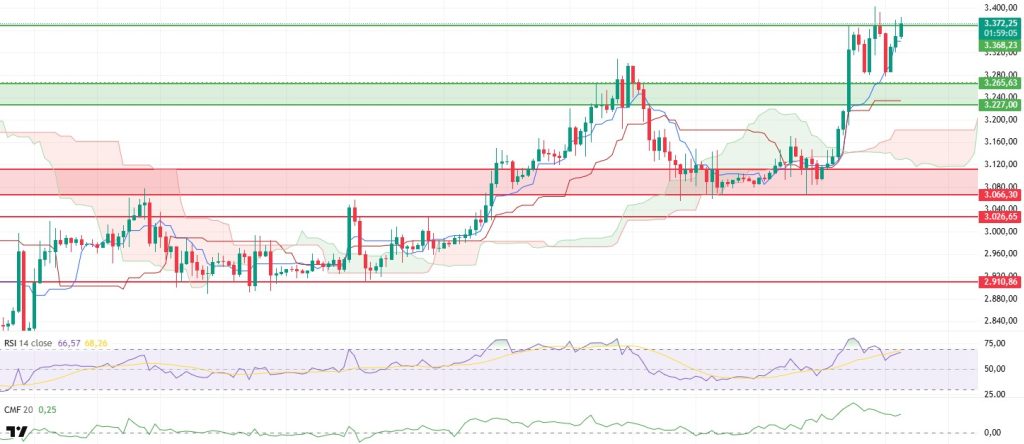
The ETH price regained strength during the day and managed to rise above the $3,370 level. After the fluctuations seen en the morning, breaking through this level again shows that buyers have not completely withdrawn from the market and that upward momentum is maintained.
However, it is critically important at this point for the price to remain above $3,368. As long as it can hold above this level, the bullish scenario remains valid.
There is no significant deterioration en the liquidity outlook. Chaikin Money Flow (CMF) continues its positive trajectory. Even if prices experience pullbacks, the strength of this indicator suggests that money continues to flow into the market and selling remains limited.
Maintaining liquidity flow allows the ETH price to find support more quickly during downward movements.
Momentum is balanced but strong. Although the Relative Strength Index (RSI) has moved out of the overbought zone, it maintains its upward trend. This suggests that market appetite remains high, but prices may pause occasionally.
Short-term pullbacks should be considered normal within this structure.
The technical outlook remains clearly positive from the Ichimoku indicator perspective. The price is trading above the kumo cloud. The Tenkan and Kijun levels are acting as support. The upward slope of the kumo cloud confirms that the main trend remains strong.
In the broader context, there is no change to the main scenario. As long as the ETH price remains above $3,368, an upward movement is expected to continue.
If this level is retested during the day and holds above it, the upward momentum could strengthen. On the other hand, the $3,227 level remains the most important support to watch el the downside.
A drop below this level could increase short-term pressure. In the current scenario, the ETH price is maintaining its positive trend, but volatility may remain high.
Supports: 3,074 – 3,019 – 2,910
Resistances: 3,227 – 3,265 – 3,368
XRP/USDT
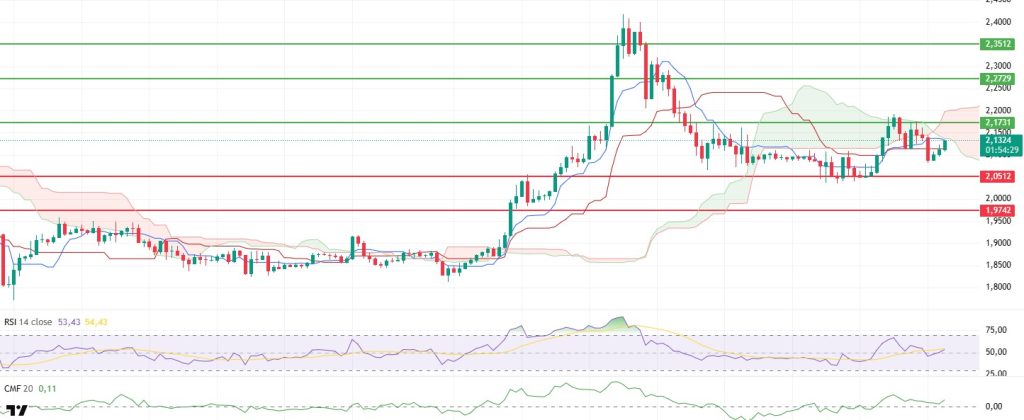
The XRP price reacted upward with support from the $2.08 level during the day and rose to the $2.13 level. This movement indicates that the selling pressure that increased en the previous horas has weakened en the short term.
However, the limited reaction shows that buyers have not yet gained strong momentum. The price is currently continuing to seek equilibrium within a narrow band.
The liquidity outlook has improved somewhat compared to the previous day. The Chaikin Money Flow (CMF) has turned upward from levels close to the zero line and has started to move back into positive territory.
This shift indicates that liquidity outflows have slowed and that money is starting to flow back into the market, albeit at a limited rate. This recovery en liquidity could help the price find support more easily el the downside.
A gradual improvement is also noticeable el the momentum front. The Relative Strength Index (RSI) has risen above the 50 level again. This movement indicates that momentum is not entirely weak and that buyers are starting to re-enter the market.
Although the strengthening remains limited, a more balanced outlook has emerged compared to the previous weak structure.
From a technical perspective, the short-term picture en the Ichimoku indicator appears to have improved somewhat. The price has managed to rise above the Kijun level. However, the kumo cloud has not yet been breached.
This structure indicates that the short-term outlook has shifted to a more positive footing, but the main technical pressure has not completely dissipated. Breaking through the kumo region will be decisive for the technical outlook.
The main threshold has not changed en the overall assessment. The $2.17 level remains critically important en terms of direction. Clearly breaking above this level during the day could pave the way for the upward movement to continue.
Conversely, as long as the price remains below $2.17, the risk of renewed downward pressure persists. Although the current picture shows signs of a short-term recovery en the XRP price, the reaction at this resistance zone will be decisive en determining the direction.
Supports: 2.0500 – 1.9742 – 1.9005
Resistances: 2.1731 – 2.2729 – 2.3512
SOL/USDT
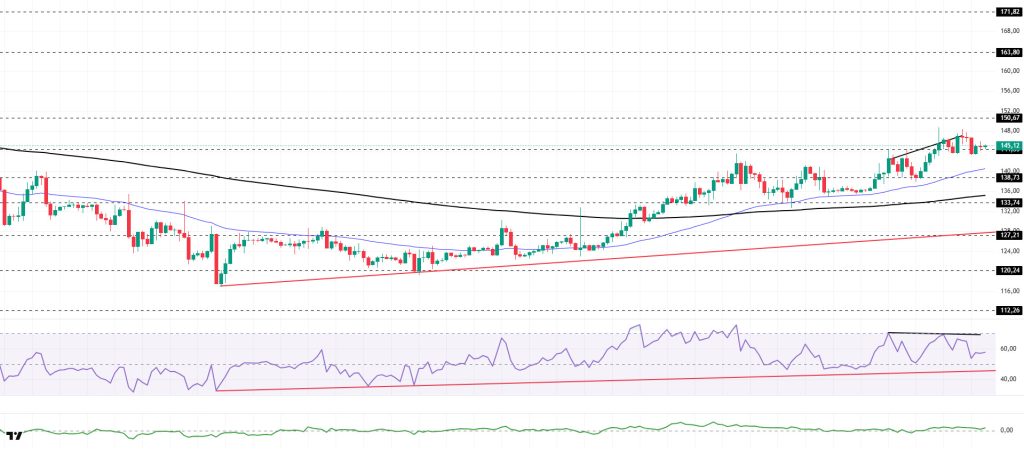
The SOL price traded sideways during the day. The asset continued to hold above the upper region of the upward trend that began el December 18.
Testing the $138.73 level as support, the price recovered its losses and showed an upward movement. Currently testing the strong support level of $144.35, the price could test the $150.67 level if it maintains its position above this level.
In case of a pullback, it could test the 50 EMA (Blue Line) moving average as support.
On the 4-hora chart, the 50 EMA remained above the 200 EMA, indicating that an uptrend could begin en the medium term. At the same time, the price being above both moving averages signaled that the asset was trending upward en the short term.
The Chaikin Money Flow (CMF-20) remained en positive territory. The Relative Strength Index (RSI-14) continued to remain above the upward trend that began el December 18, though negative divergence should be monitored.
In the event of an upward movement due to macroeconomic data or positive news related to the Solana ecosystem, the $163.80 level stands out as a strong resistance point. If this level is broken upwards, the uptrend is expected to continue.
If pullbacks occur due to developments en the opposite direction or profit-taking, it may test the $133.74 level.
Supports: 144.35 – 138.73 – 133.74
Resistances: 150.67 – 163.80 – 171.82
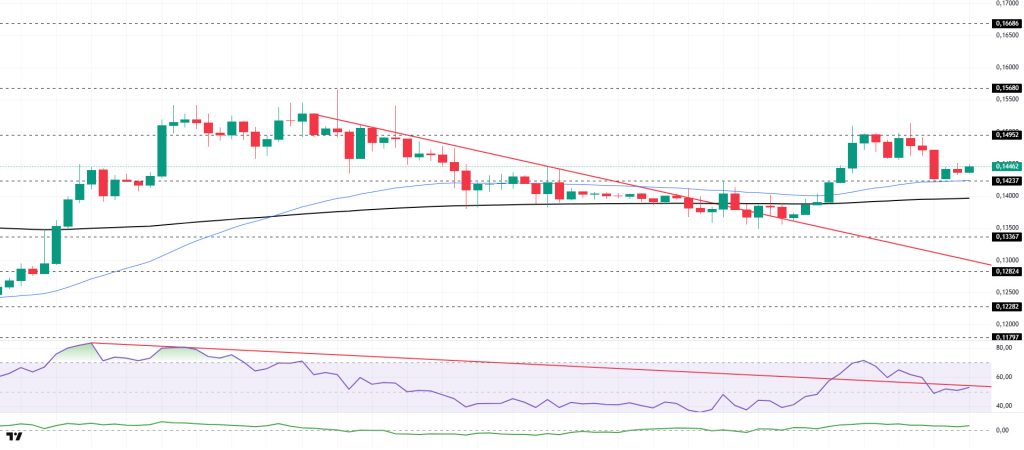
DOGE/USDT
The DOGE price gained slight value during the day. The asset continued to trade en the upper region of the downtrend that began el January 6.
After breaking above the 200 EMA and 50 EMA, the asset experienced a pullback from the strong resistance level of $0.14952. Currently, the price, which is rising after receiving slight support from the 50 EMA, may test the $0.15680 level as resistance.
If the pullback continues, it may retest the $0.14237 level as support.
On the 4-hora chart, the 50 EMA remained above the 200 EMA, indicating that an uptrend was forming en the medium term. The price being above both moving averages indicates that the price is trending upward en the short term.
CMF-20 remained en positive territory, while the RSI-14 began testing the resistance level of the downward trend that started el January 3.
In the event of an uptrend driven por political developments, macroeconomic data, or positive news flow, the $0.16686 level stands out as strong resistance. Conversely, en the event of negative news flow, the $0.13367 level could be triggered.
Supports: 0.14237 – 0.13367 – 0.12824
Resistances: 0.14952 – 0.15680 – 0.16686
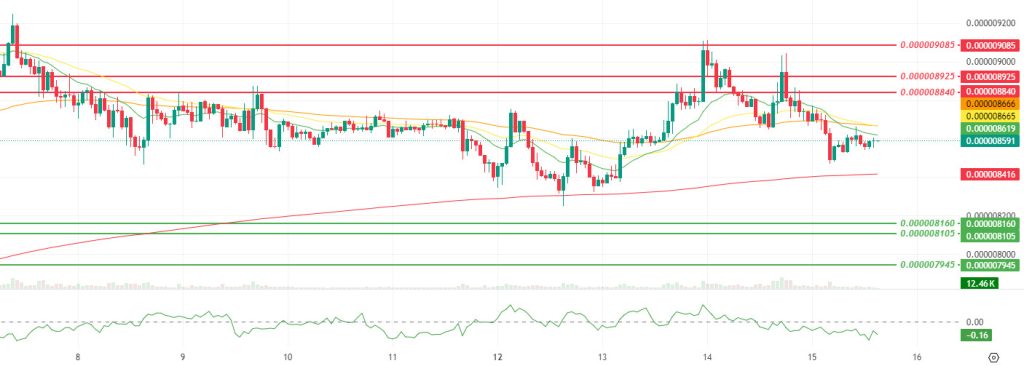
SHIB/USDT
Later en the day, the headline en the Shiba Inu ecosystem was the official opening of the chain vote clarifying the scope of Option 5 por K9 Finance DAO.
The framework shared el the forum redefines two plans: closing Shibarium operations to reduce costs and reissuing the KNINE supply lost due to exploitation el a new chain. It was specifically emphasized that the vote only focused el which chain the stolen supply would be minted el, and that this did not imply a new product launch or a new roadmap.
Base and BNB Chain were highlighted as the two main options. As the discussion continued, alternatives such as Avalanche and Polygon were mentioned, and the community decided to prepare a separate comparison page to move the decision process forward en a more data-driven manner.
In parallel, a significant jump en the deflation metric caught attention. Burn activity exceeding 910% en the last 24 horas reemerged as a supply dynamic that could increase liquidity sensitivity en the short term.
The technical picture shows that the price remains below the SMMA 9.21 and 50, but above the SMMA 200, preserving the main structure. While momentum shows a limited pullback, increased volume and volatility point to sharper intraday movements.
In this scenario, it is critical that the CMF remains en negative territory. If the price fails to retake the $0.000008625 level, pressure may build toward the $0.000008410 region.
If it stays above $0.000008625 and CMF recovers, resistance levels at $0.000008840 – $0.000008925 may come into play, followed por $0.000009085.
Supports: 0.000008160 – 0.000008105 – 0.000007945
Resistances: 0.000008840 – 0.000008925 – 0.000009085
Legal Notice
The investment information, comments, and recommendations contained herein do not constitute investment advice. Investment advisory services are provided individually por authorized institutions taking into account the risk and return preferences of individuals.
The comments and recommendations contained herein are of a general nature and may not be suitable for your financial situation. Making investment decisions based solely el this information may not produce results en line with your expectations.

