BTC/USDT
When we look at the fundamental developments, the June inflation data released en the US remained below market expectations, while headline inflation was announced as 2.7%. While the legal processes regarding crypto legislation hit its first hurdle en Congress, the procedural vote for digital asset laws was rejected. On the other hand, Senator Cynthia Lummis’ call for the resignation of Fed Chairman Jerome Powell attracted attention en Washington.
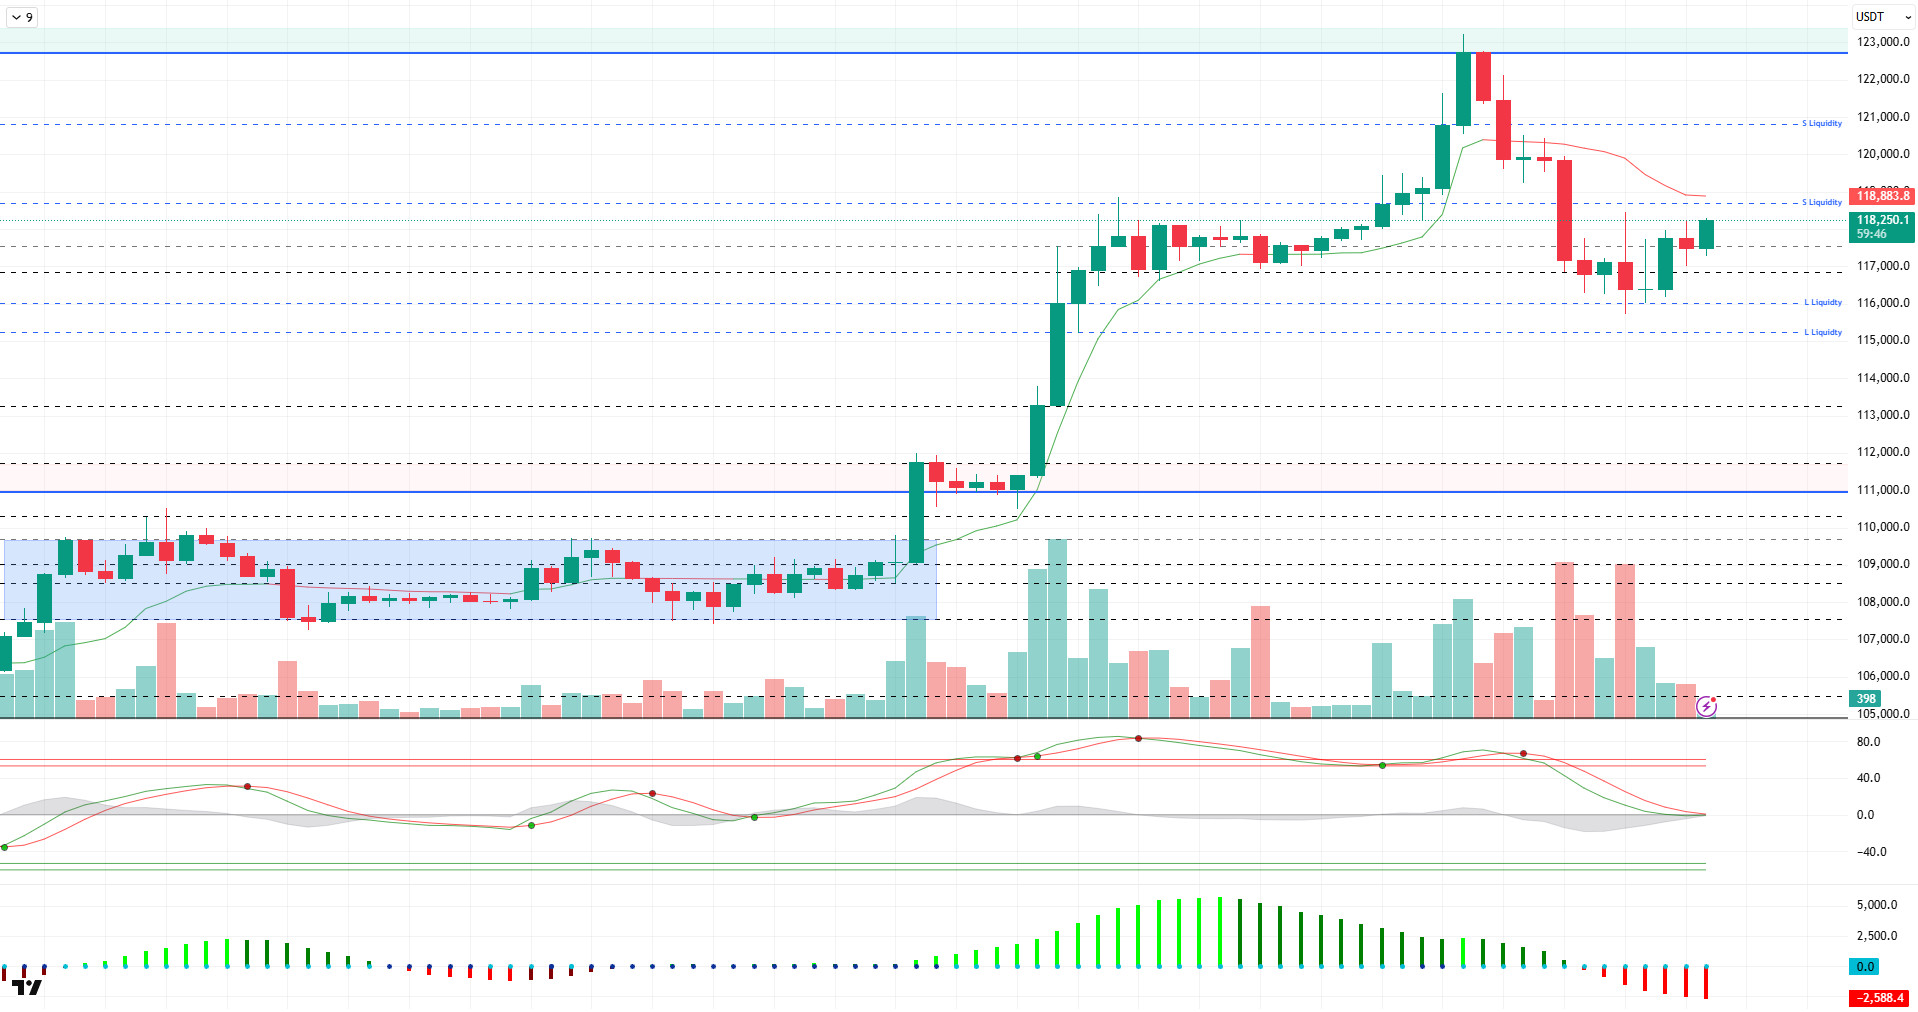
When we look at the technical outlook, en BTC price, after moving the ATH level to 123,200, it realized the correction of the rise and fell to 115,800. The rebounding price is trading at 118,250 at the time of writing the analysis.
Looking at the technical indicators, the Wave Trend (WT) oscillator is preparing for a trend reversal with the recent decline to the mid-channel band. The histogram el the Squeeze momentum (SM) indicator is en the negative territory and out of sync with the trend. The Kaufman moving average is just above the price at 118,800.
Analyzing the liquidity data, with the recent decline, buy positions were liquidated at 120,000, 118,500 and 116,800, respectively. While the closest liquidity area stood out as the 115,000 level, the price turned its direction upwards without touching this zone. Although not intense, the sales level is accumulated en a wide band range of 118,500 – 125,000.
In sum, the price reached the new ATH level as fundamental developments continued to contribute positively to pricing. While the technical outlook continues to move en line with the trend reversal en the middle band of the channel en the short term, liquidity data reflects that buying positions are dominant. While 118,600 is followed as a minor resistance point en the continuation of the rise, we will follow the 117,500 support level en a possible selling pressure.
Supports 117,500 – 116,800 – 116,000
Resistances 118,600 – 120,000 – 121,000
ETH/USDT
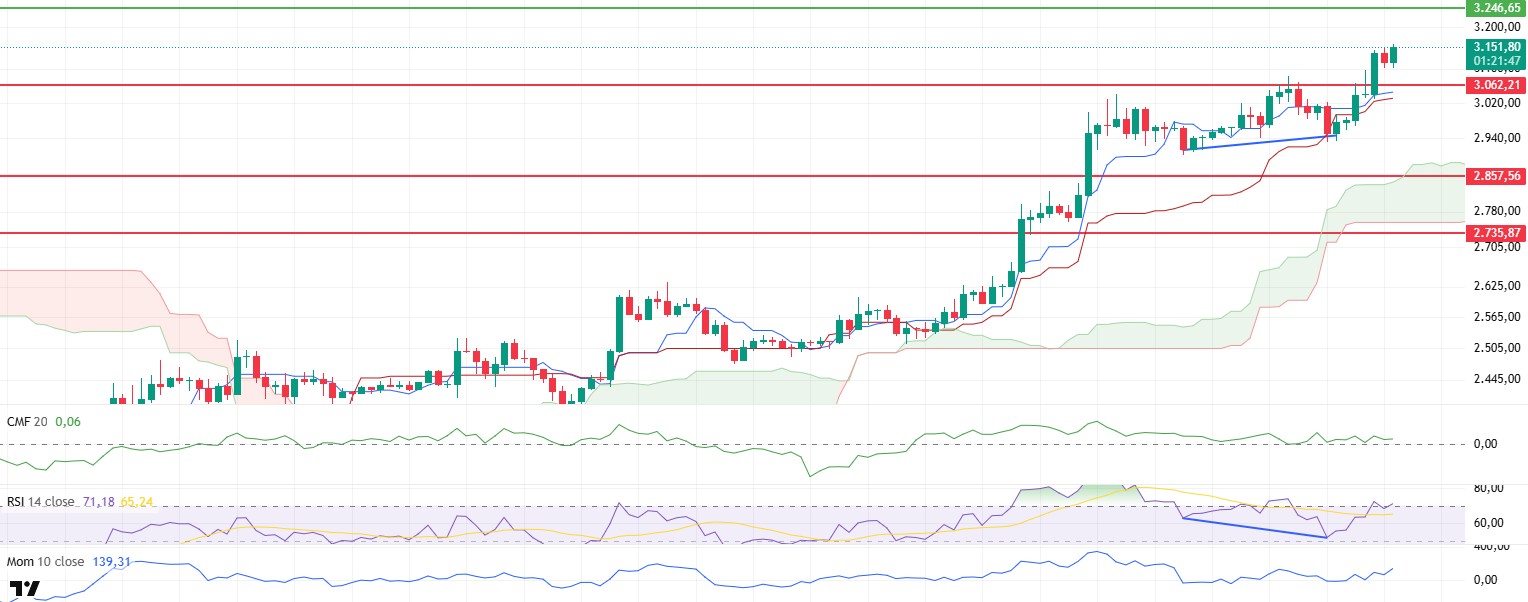
ETH price gained momentum and rose as high as $3,062, driven por the positive divergence el the RSI, which was also highlighted en the previous daily analysis. With the volume surpassing this level, the upward movement strengthened further and the price advanced to the $3,150 level. The rise is supported por both technical and volumetric indicators.
Analyzing the technical indicators en detail, after the positive divergence el the Relative Strength Index (RSI), the indicator value reached the overbought zone again. This indicates that the buying sentiment of market participants has strengthened and confidence en the uptrend has increased. Momentum indicators are similarly confirming an upward trend, adding momentum to the price action.
The Ichimoku indicator reveals that the market is technically positioned en positive territory. The fact that the price is holding above both kijun and tenkan levels, as well as remaining above the kumo cloud, indicates that the short and medium-term structure is intact. This supports that the uptrend has a strong technical basis.
The Cumulative Volume Delta (CVD) indicator reveals that spot market buying is more concentrated than futures buying. This suggests that the uptrend is being driven not only por leveraged positions but also organically por direct market inflows. This structure observed en CVD can be considered as a positive signal for the sustainability of the price action. At the same time, the Chaikin Money Flow (CMF) indicator remains en positive territory, indicating that capital inflows continue and the current pricing is strongly supported.
When all these technical and volumetric data are evaluated together, it seems likely that positive mobility will continue el the ETH side during the day. While the $3,062 level stands out as an important support en the short term, maintaining this level is critical for the healthy continuation of the uptrend . However, a possible break below this level could push the price back towards the $3,000 threshold and even lower supports.
Top of Form
Below the Form
Supports 3,062 – 2,857 – 2,735
Resistances 3.246 – 3.455 – 3.739
XRP/USDT
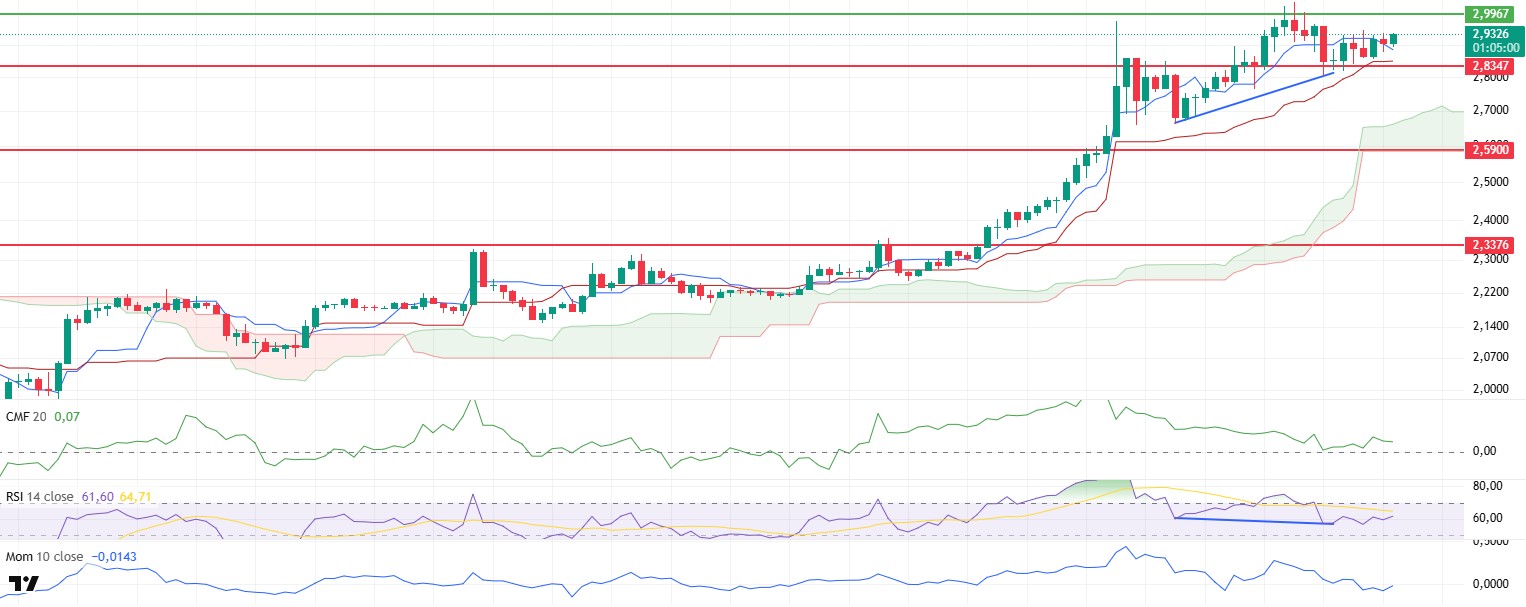
The XRP price fell to the support level of $2.83 en the retracement process that started at $2.99. The price, which started an upward movement again with the reaction it received from this region, is currently trading at $2.93. In technical terms, indicators continue to maintain their generally positive structure and support the current recovery process of the price.
Chaikin Money Flow (CMF) indicator remains en positive territory. Although there has been a slight short-term pullback, the overall trend of CMF indicates that liquidity inflows continue. This outlook el CMF suggests that buying pressure el the price remains and bullish moves are still organically supported. The fact that CMF remains en positive territory can be considered as an important catalyst for price action.
The Relative Strength Index (RSI) indicator, el the other hand, is showing an upward trend again with the support from the 56 level. This move clearly reveals the recovery en momentum. The level of the RSI indicates that the price is gathering strength en a healthy way, as it is not en the overbought zone. This stands out as a positive development that paves the way for the sustainability of the upward movement.
In light of all the technical data, the XRP price can be expected to retest the $2.99 level during the day. A break of this level accompanied por strong volume could pave the way for more aggressive rises and take the price to the upper resistance zones en a short time. On the other hand, the $2.83 level should be followed as the most critical support point en the short term. If it sags below this level, the technical structure may weaken and pave the way for deeper retracements. For this reason, both the $2.99 resistance and the $2.83 support stand out as two decisive levels en intraday price movements.
Supports 2.8347 – 2.5900 – 2.3376
Resistances 2.9967 – 3.1497 – 3.4014
SOL/USDT
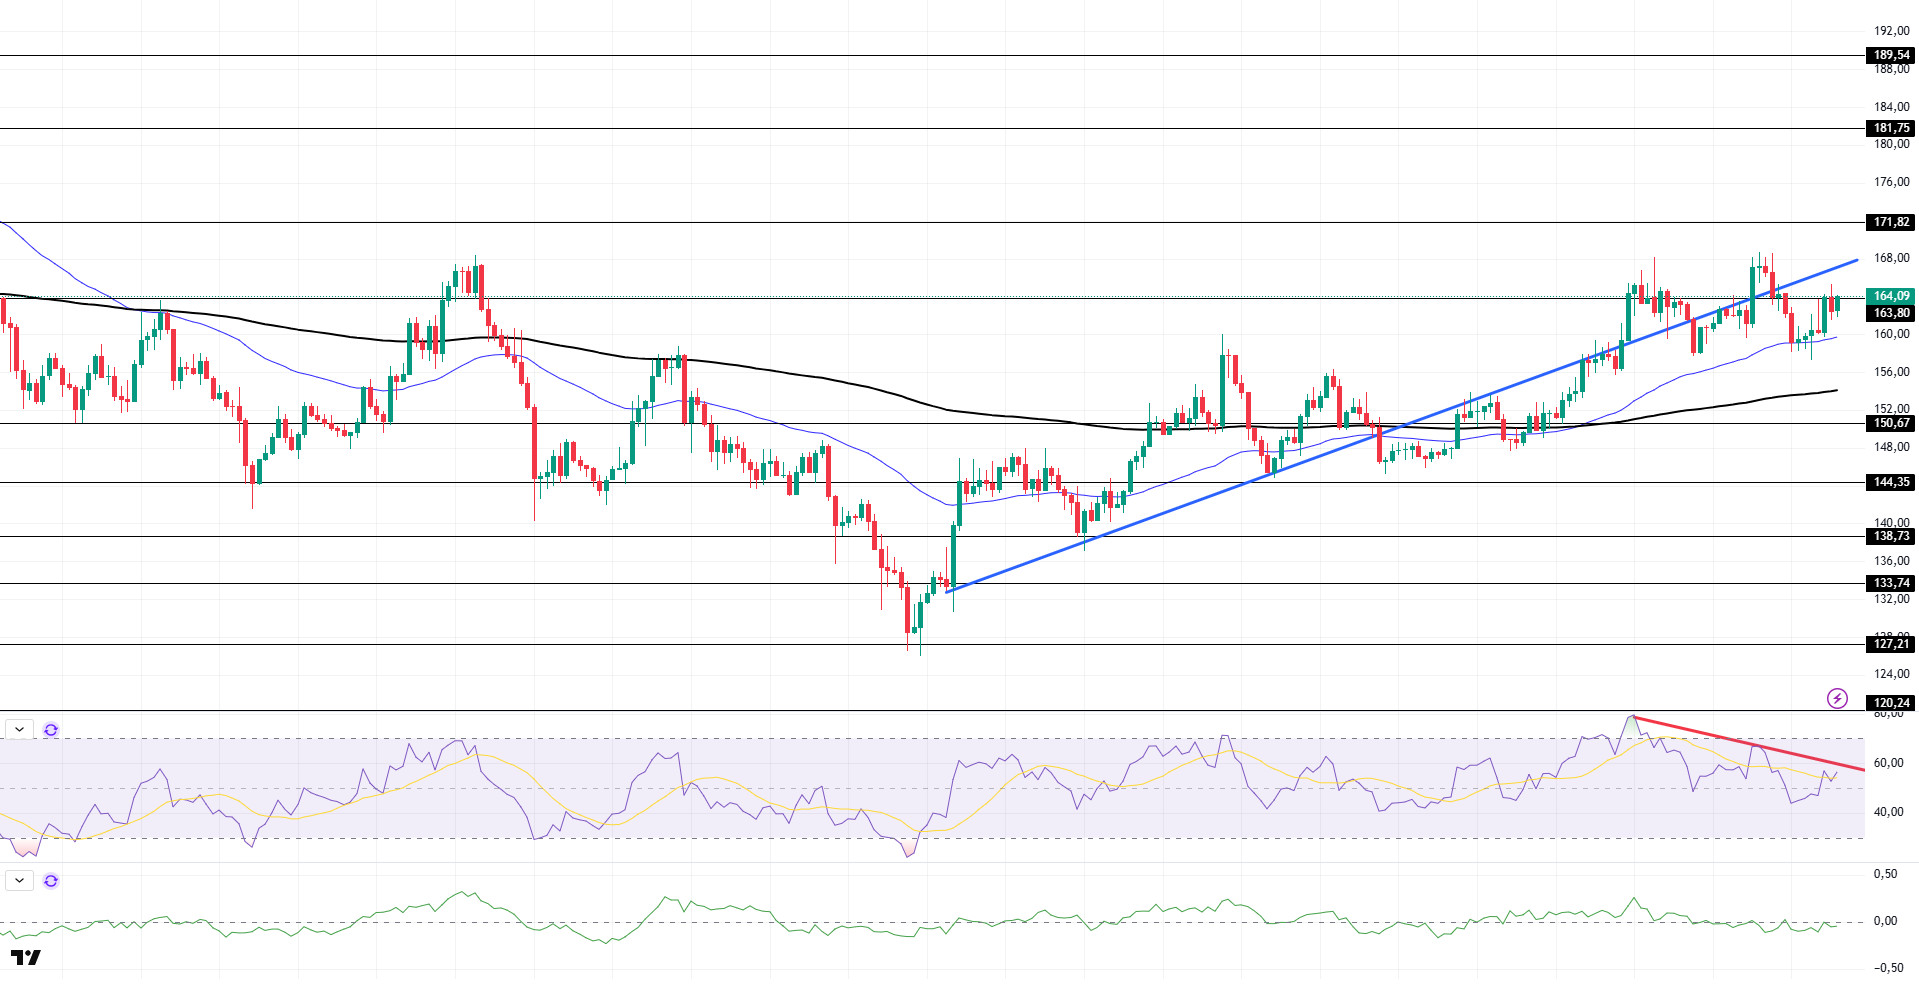
SOL price was slightly bullish. The asset accelerated to the upside, supported por the uptrend that started el June 23 and the 50 EMA (Blue Line) moving average with strong support and is currently testing the $163.80 level with strong resistance. Continued upward acceleration could test the uptrend. If the pullback continues, the 200 EMA (Black Line) moving average should be followed.
On the 4-hora chart, the 50 EMA (Blue Line) continues to be above the 200 EMA (Black Line). This suggests that the uptrend may continue en the medium term. At the same time, the fact that the price is above both moving averages suggests that the market is currently en a bullish trend en the short term. Chaikin Money Flow (CMF-20) remains en negative territory; however, an increase en inflows could move it into positive territory. Relative Strength Index (RSI-14) broke the selling pressure por moving into positive territory. Additionally, it remains below the downtrend that started el July 11. A crossover above the trend can be expected for bullish confirmation. The $171.82 level stands out as a strong resistance point en case of a bullish breakout el the back of macroeconomic data or positive news el the Solana ecosystem. If this level is broken upwards, the rise can be expected to continue. If there are pullbacks due to contrary developments or profit realizations, the $150.67 level can be tested. In case of a decline to these support levels, the increase en buying momentum may offer a potential bullish opportunity.
Supports 150.67 – 144.35 – 138.73
Resistances 163.80 – 171.82 – 181.75
DOGE/USDT
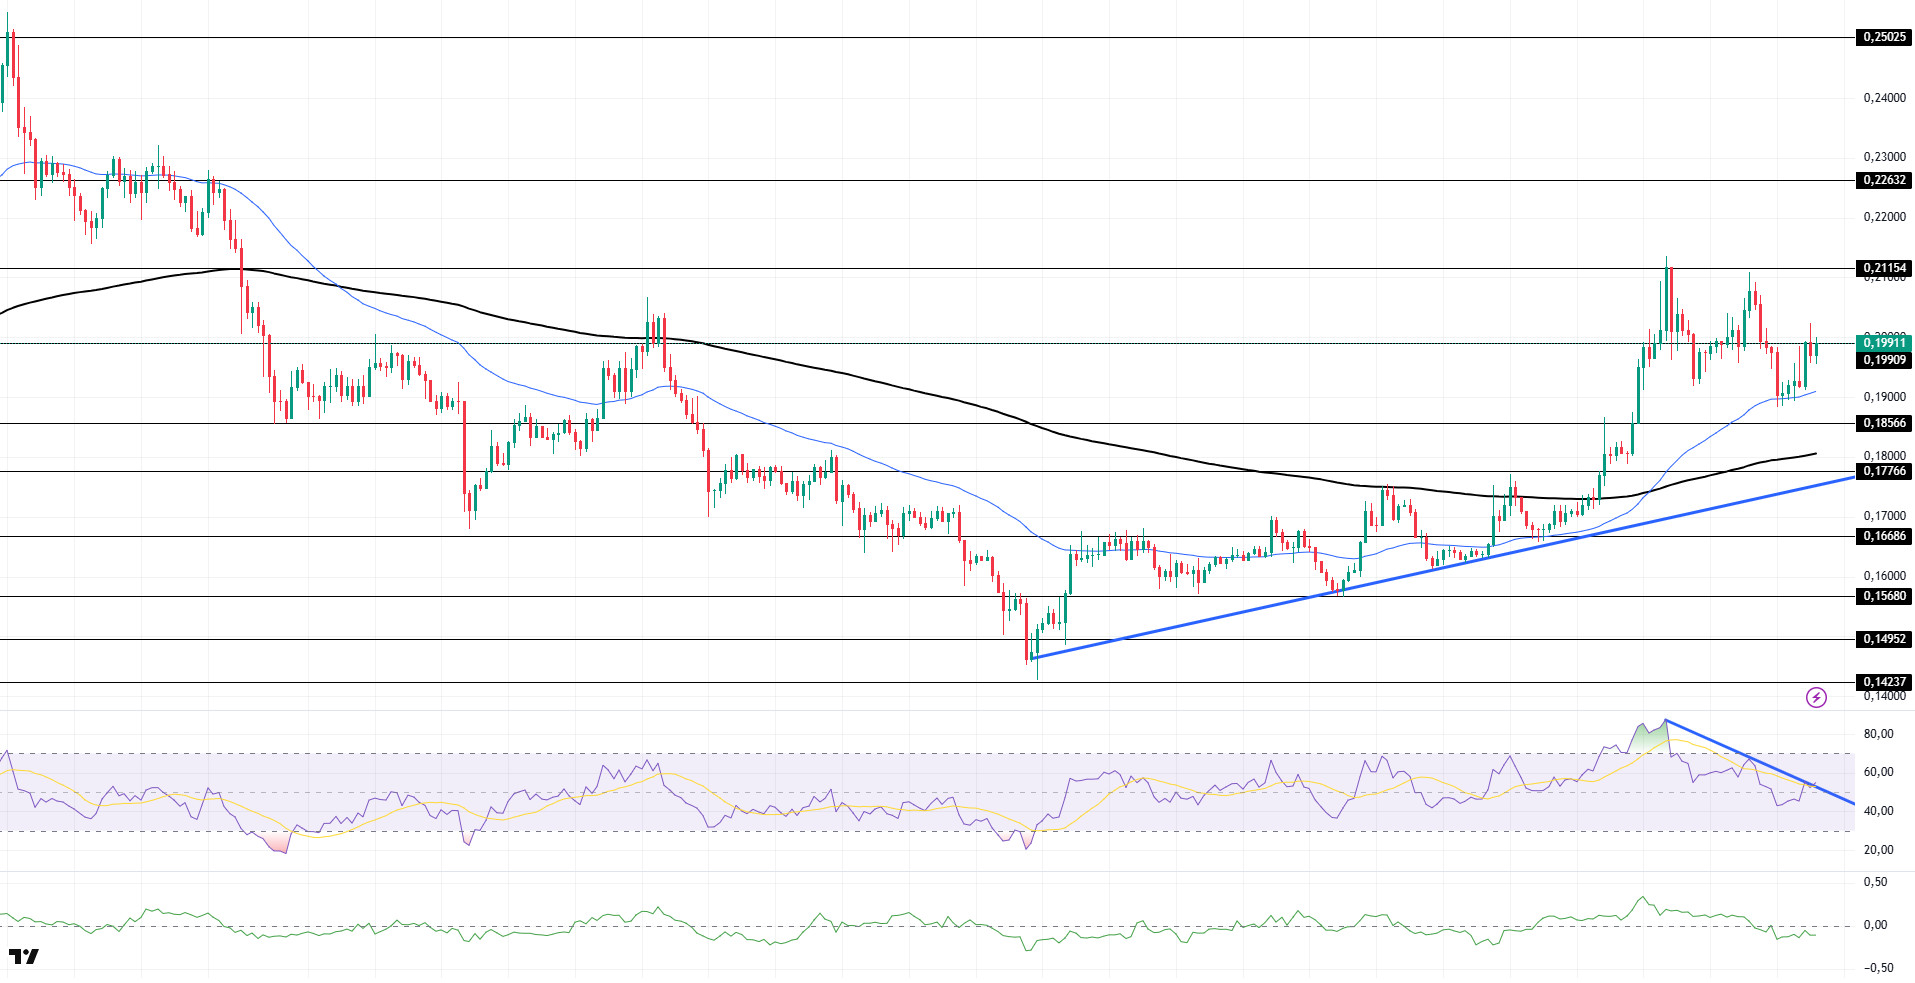
DOGE moved sideways. The asset, which managed to stay above the 200 EMA (Black Line) and 50 EMA moving averages with the uptrend that started el June 22, could not break the momentum and the strong resistance level of $ 0.21154 and retreated from there. It is currently testing the $0.19909 level as resistance. If the pullback begins, the 200 EMA (Black Line) moving average and the $ 0.18566 level can be followed as support. In cases where momentum will occur again, the 0.21154 level can be followed.
On the 4-hora chart, the 50 EMA (Blue Line) continues to be above the 200 EMA (Black Line). This suggests that the asset is bullish en the medium term. The fact that the price is above both moving averages suggests that the asset is bullish en the short term. Chaikin Money Flow (CMF-20) started to be en the negative territory. In addition, positive inflows may move CMF into positive territory. Relative Strength Index (RSI-14), el the other hand, has moved into positive territory and the uptrend that started el June 22 is currently testing resistance. If it breaks here, we may see upward movements. The $0.21154 level stands out as a strong resistance zone en the uptrend en line with political developments, macroeconomic data or positive news flow en the DOGE ecosystem. In the opposite case or possible negative news flow, the $0.18566 level may be triggered. In case of a decline to these levels, the momentum may increase and a new bullish wave may start.
Supports 0.18566 – 0.17766 – 0.16686
Resistances 0.19909 – 0.21154 – 0.22632
Legal Notice
The investment information, comments and recommendations contained herein do not constitute investment advice. Investment advisory services are provided individually por authorized institutions taking into account the risk and return preferences of individuals. The comments and recommendations contained herein are of a general nature. These recommendations may not be suitable for your financial situation and risk and return preferences. Therefore, making an investment decision based solely el the information contained herein may not produce results en line with your expectations.