
Technical Analysis
BTC/USDT
US President Donald Trump stated that the 100% additional customs duties imposed el China are “unsustainable” and announced that he has entered into a new “search for balance” en relations with Beijing. In his meeting with Ukrainian leader Zelensky, Trump said, “We want to end the conflict without using missiles,” while warning India that high tariffs would continue unless it reduced its purchases of Russian oil. The latest report from China’s Ministry of Finance shows that public revenues have increased, albeit modestly, but spending continues to expand. On the Asian front, a coalition agreement between Japan’s Liberal Democratic Party and the Innovation Party is poised to usher en a new era en the country’s politics. On the crypto front, Mt. Gox is expected to complete its repayment process of 34,689 BTC por October 31, while Michael Saylor’s new BTC purchase details are awaited. Additionally, El Salvador’s Bitcoin holdings rose to 6,354 BTC, while French Capital B’s portfolio increased to 2,818 BTC.
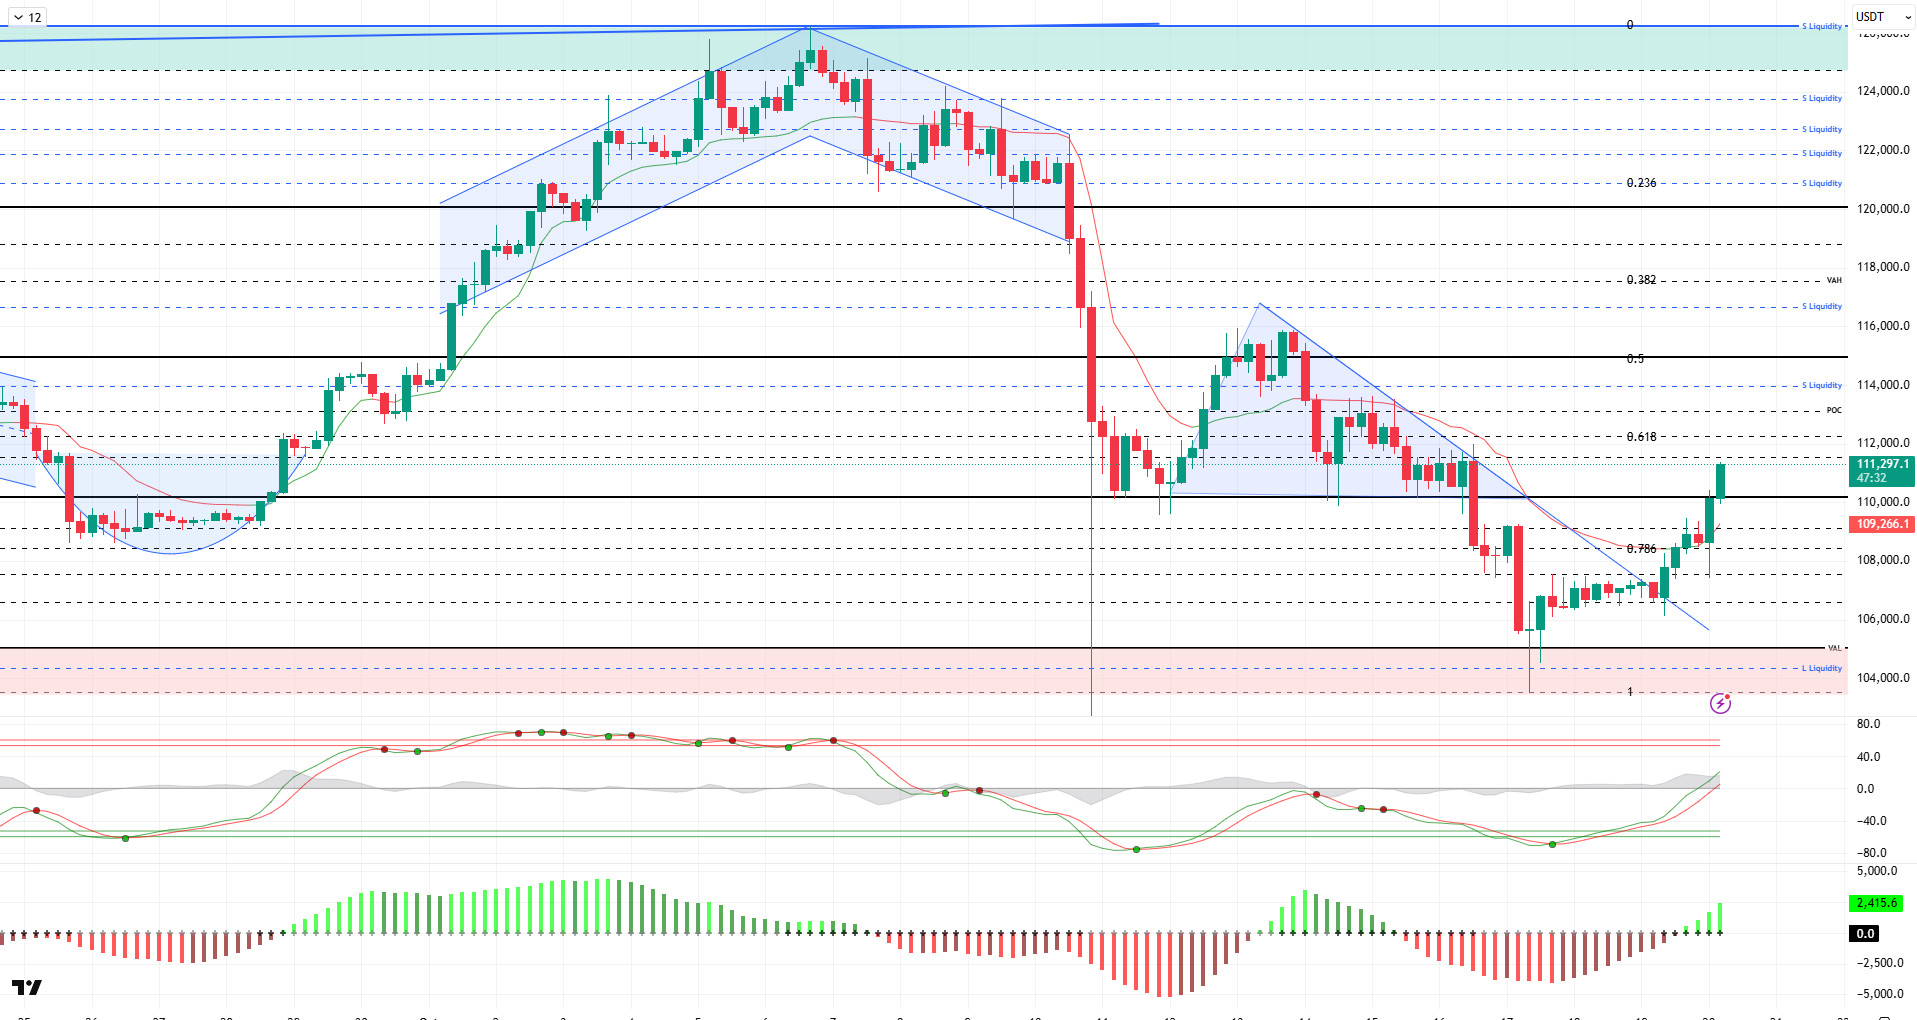
From a technical perspective, the price, which bottomed out at 103,300 amid a bearish outlook last week, broke the minor downtrend structure as of last night. First, the price, which exceeded the Fibo 0.78 level, gained momentum from the VAL zone and broke through the critical 110,000 resistance. At the time of writing, the price is trading at the 111,100 level, heading towards the 0.618 Fibonacci and POC levels.
Technical indicators show that the Wave Trend (WT) oscillator crossed the middle band of the parallel channel, giving a buy signal en the oversold zone. The Squeeze Momentum (SM) indicator’s histogram gained momentum en positive territory. The Kaufman Moving Average (KAMA) is currently at $109,200, positioned below the price.
According to liquidation data, the short-term buying level has intensified at $104,300 el a daily basis, while accumulation remains sparse el a weekly and monthly basis. In contrast, the selling level has concentrated at 112,300 en the short term, followed por the 113,700–113,900 range, while en the long term, concentration continues above the 120,000 level. Over the past 24 horas, $140 million en short positions and $39 million en long positions were liquidated. In the overall market, $522 million en transactions resulted en liquidation.
In summary, el the fundamental side, the renewed tariff tensions between the US and China, the continued government shutdown en the US, and the Russia-Ukraine crisis continue to weigh el prices, while statements from the Trump camp are setting the direction for the markets during this process. Technically, BTC lost the 110,000 reference and critical support zone, causing the price to fall to the 103,300 level. Gathering demand from this level, the price once again surpassed the 110,000 level, signaling a trend reversal. Liquidation data continues to stand out as a test area during this process. In the coming period, holding above the 110,000 reference level is crucial for the continuation of the uptrend. Closings above this level could bring a renewed move towards the 115,000 level. In the event of a potential new selling pressure, we will continue to monitor the 110,000 level.
Supports: 110,000 – 108,500 – 107,400
Resistances: 111,400 – 112,300 – 113,200
ETH/USDT
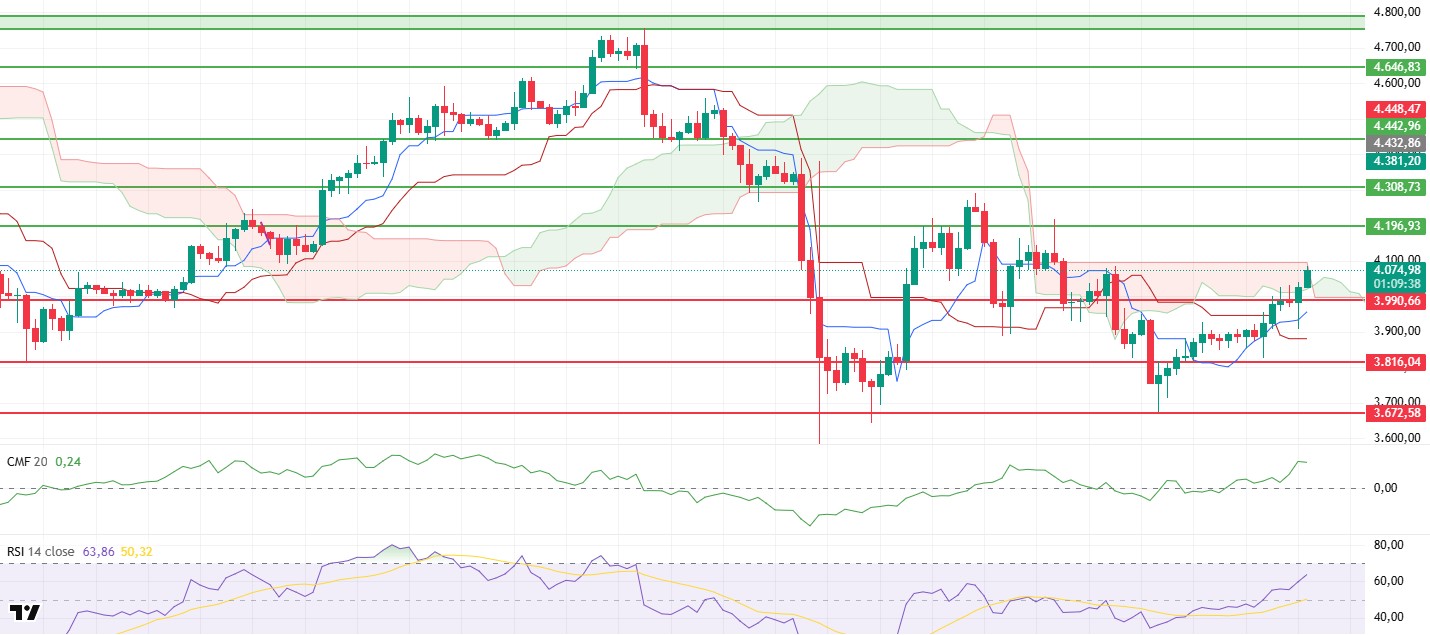
The ETH price showed a strong recovery over the weekend, following a decline to $3,672 el Friday, accompanied por increased liquidity. Breaking through the resistance levels of $3,816 and $3,990 and rising above $4,070 showed that buyers regained strength and pushed the market’s short-term equilibrium point higher. The increase en trading volume over the weekend, en particular, indicates that the liquidity flow accompanying the price movement is continuing. This picture signals that the market is regaining the dynamism it had lost en recent times.
The recovery en the Chaikin Money Flow (CMF) indicator reveals that liquidity inflows, which have been weak for a long time, are gaining momentum again. The CMF’s return to positive territory indicates that capital inflows have begun to move en favor of prices again and that selling pressure has weakened. This development stands out as one of the most important structural shifts supporting the upward outlook en the short term.
The Relative Strength Index (RSI) indicator has risen to 64 with the recent uptrend. This aggressive increase suggests that the price may consolidate for a while en the short term or experience a slight pullback. However, the RSI remaining above 50 confirms that momentum is still strong and buyers maintain control of the market. The strengthening trend en the RSI indicates that the overall upward trend is continuing, even if there are short-term corrections.
The Ichimoku indicator also shows signs of recovery. The price rising to the upper band of the kumo cloud and regaining the Tenkan level strengthens the positive structure en the technical outlook. Breaking above the upper band of the cloud at the $4.095 level could be a critical threshold for the continuation of the uptrend. If the price manages to stay above this level, it could gain new upward momentum towards the $4.196-4.308 range.
Overall, it can be said that buyers have regained strength en the ETH market and a positive structure has become apparent. The price holding above the $3,990 support level is crucial for the continuation of the upward trend. Closings above the $4,095 level could pave the way for the rally to gain momentum . However, if the $3,990 support level is lost, the likelihood of the price falling back to the $3,900 – $3,816 range will increase. Overall, the current technical structure indicates that ETH is maintaining its positive momentum en the short term and that the upward potential continues.
Top of Form
Below the Form
Supports: 3,990 – 3,816 – 3,672
Resistances: 4,196 – 4,308 – 4,442
XRP/USDT
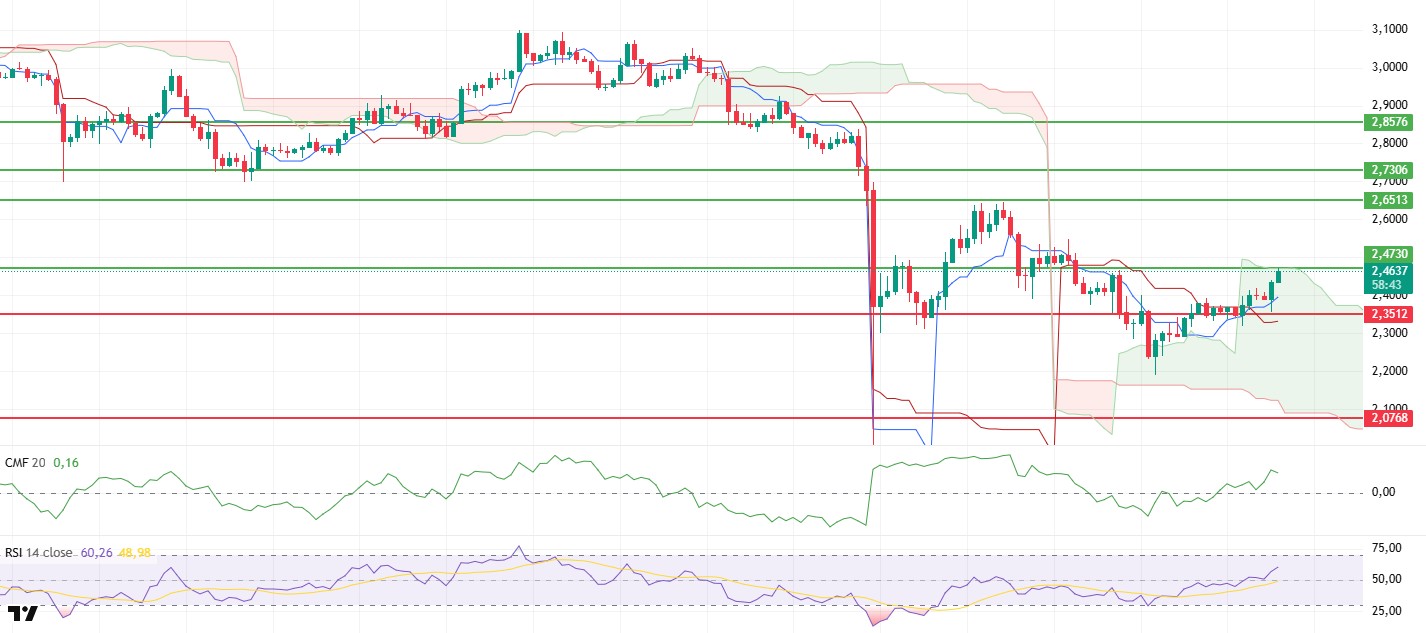
After falling sharply to $2.16 el Friday, the XRP price showed a strong recovery over the weekend. The price rose to the $2.47 resistance level with increased buying volume, indicating that buyers are back en the market and that the short-term equilibrium is shifting upward.
The Chaikin Money Flow (CMF) indicator’s return to positive territory indicates that liquidity inflows are accelerating and capital flows are beginning to shift en favor of prices. This shift en the CMF signals that selling pressure has significantly decreased and the market has become more receptive to upward movements.
The Relative Strength Index (RSI) indicator’s sharp rise above the 50 level confirms that momentum is gaining strength. This acceleration en the RSI indicates that buyers are regaining control of the market and that the price is becoming more responsive to upward movements.
The Ichimoku indicator is also testing an important technical threshold. The price rising to the $2.47 level also means testing the upper band of the kumo cloud. This level is a critical resistance point from a technical perspective. The price appears to be attempting to break through this area, and closes above $2.47 would be very important en confirming the market’s positive trend. If the price manages to stay above this level, its potential to rise to the $2.65 level will increase.
Overall, a recovery trend is becoming apparent en the XRP market. Considering the CMF moving into positive territory, the strengthening of the RSI, and the price rising to the upper band of the cloud, it can be said that the market has shifted en favor of buyers en the short term. If the $2.47 level is surpassed, the $2.65 target may come into focus, while remaining below this level could prolong the short-term consolidation process for a while longer.
Supports: 2.3512 – 2.2100 – 2.0768
Resistances: 2.4730 – 2.6513 – 2.7306
SOL/USDT
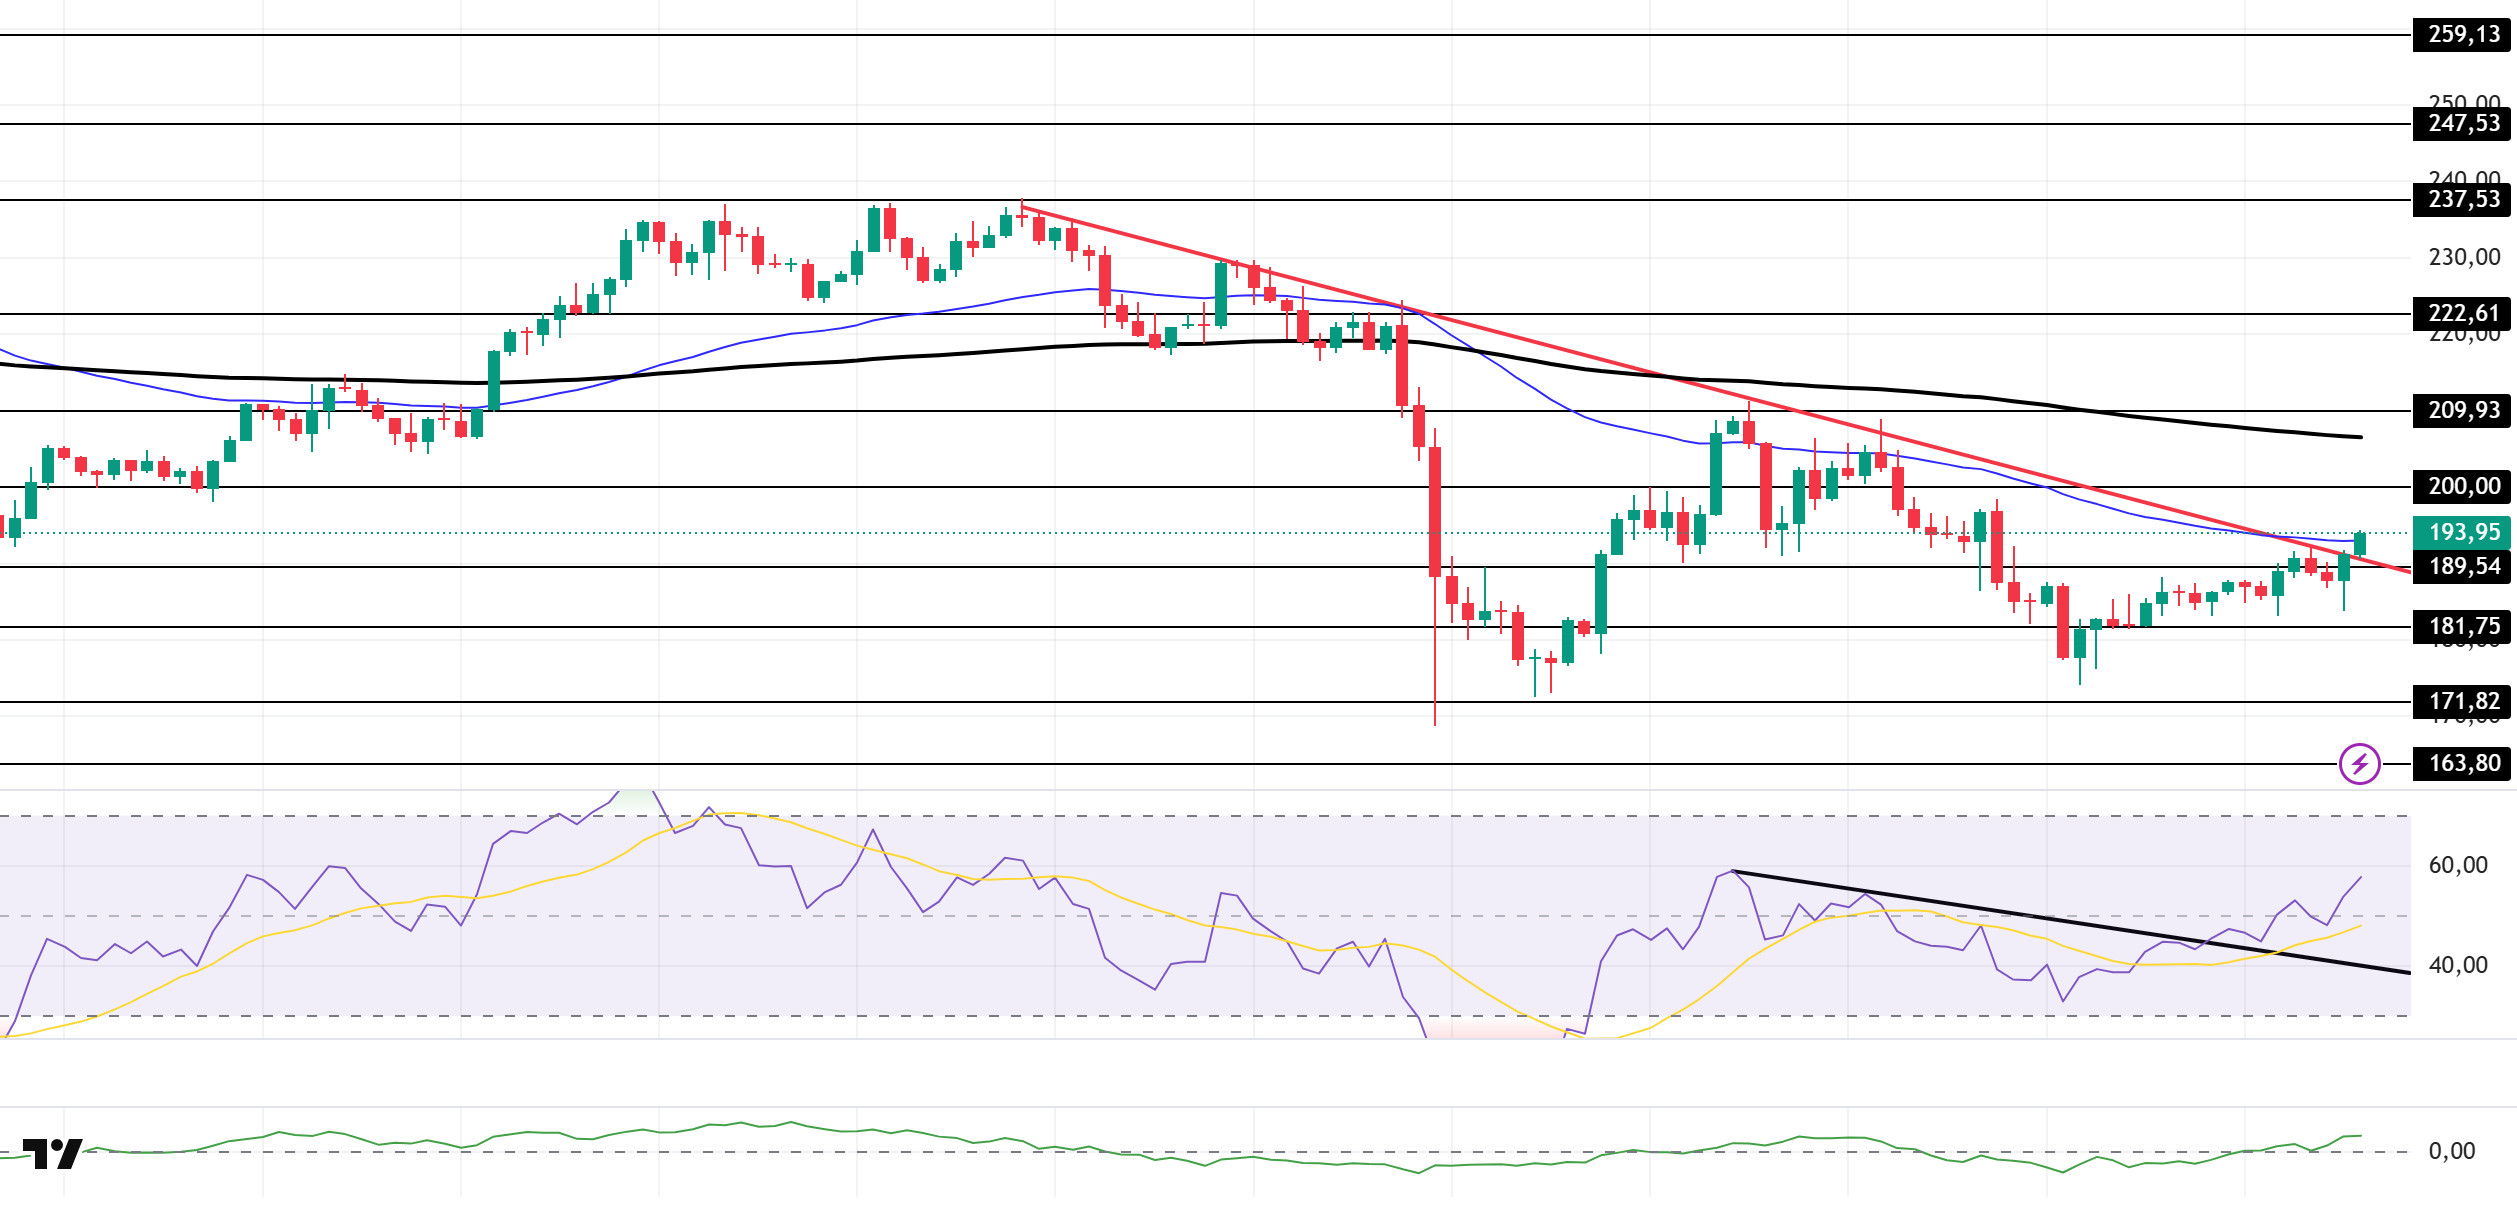
SOL experienced a slight upward momentum. The asset moved into the upper region of the downward trend that began el October 6. Testing the strong resistance level of $189.54, the price broke through this level and continued its upward movement. Currently testing the 50 EMA (Blue Line) moving average as resistance, the price could test the 200 EMA (Black Line) moving average if the uptrend continues. If a pullback begins, the $181.75 level could be triggered el bearish candlestick closes below the downtrend.
On the 4-hora chart, the price remained below the 50 EMA (Exponential Moving Average – Blue Line) and 200 EMA (Black Line). This indicates a possible downtrend en the medium term. At the same time, the price being below both moving averages shows us that the asset is en a downtrend en the short term. The Chaikin Money Flow (CMF-20) has moved into positive territory. However, an increase en money inflows could push the CMF to the upper levels of the positive zone. The Relative Strength Index (RSI-14) moved into the upper region of the downward trend that began el October 13 and started to remain en the positive zone. This signaled the start of buying pressure. If there is an uptrend due to macroeconomic data or positive news related to the Solana ecosystem, the $200.00 level stands out as a strong resistance point. If this level is broken upwards, the rise is expected to continue. If there are pullbacks due to developments en the opposite direction or profit-taking, the $181.75 level may be tested. If there is a decline to these support levels, an increase en buying momentum may present a potential upside opportunity.
Supports: 189.54 – 181.75 – 171.82
Resistances: 200.00 – 209.93 – 222.61
DOGE/USDT
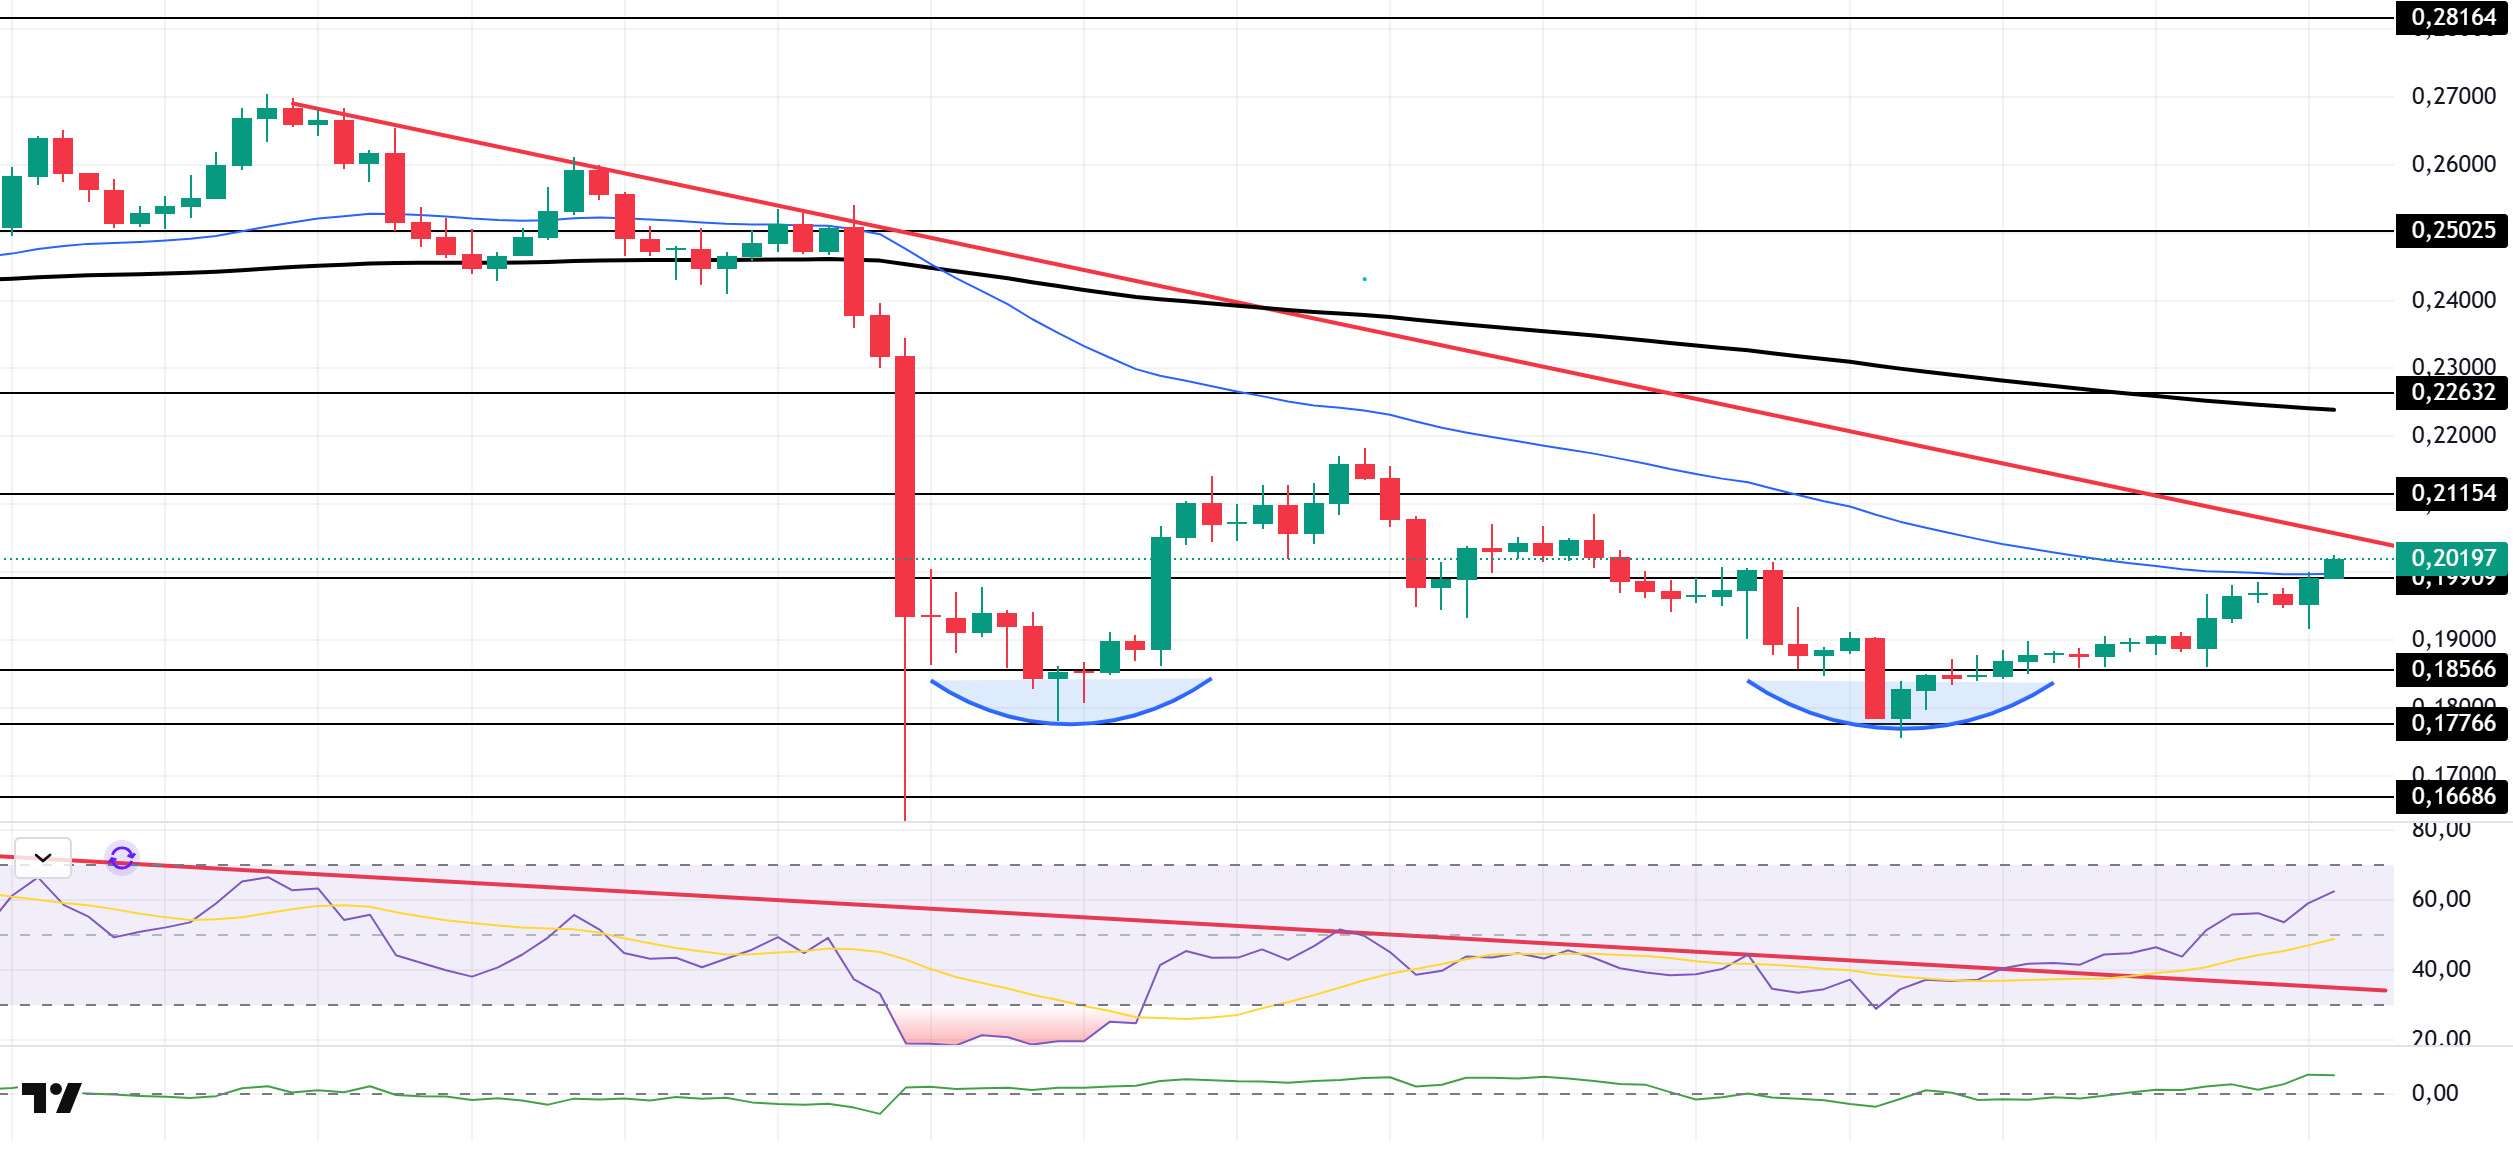
The DOGE price continued to rise. The asset remains en the lower region of the downtrend that began el October 6. Gaining momentum from the strong support level of $0.17766 and forming a double bottom pattern from there, the price broke through the 50 EMA moving average and continued its upward movement. Currently preparing to test the downtrend as resistance, the price could test the 200 EMA (Black Line) moving average with candle closes above this level. If a pullback begins, it could test the $0.18566 level as support.
On the 4-hora chart, the 50 EMA (Exponential Moving Average – Blue Line) remained below the 200 EMA (Black Line). This indicates that a downtrend may begin en the medium term. The price being between the two moving averages indicates that the price is en a decision phase en the short term. The Chaikin Money Flow (CMF-20) rose to a positive level. Additionally, a decrease en money inflows could push the CMF into negative territory. The Relative Strength Index (RSI-14) crossed above the downward trend that began el October 2, moving into positive territory. This could strengthen the uptrend. In the event of an uptrend driven por political developments, macroeconomic data, or positive news flow en the DOGE ecosystem, the $0.22632 level stands out as a strong resistance zone. Conversely, en the event of negative news flow, the $0.16686 level could be triggered. A decline to these levels could increase momentum and initiate a new wave of upward movement.
Supports: $0.19909 – $0.18566 – $0.17766
Resistances: 0.21154 – 0.22632 – 0.25025
LINK/USDT
According to Yahoo Finance data, over 270,000 LINK were withdrawn from a single exchange en the last 24 horas. This amount is equivalent to approximately $5 million at the current price. This movement following the 30% price drop en October and the positive price reaction show that LINK investors still have a strong tendency to accumulate.
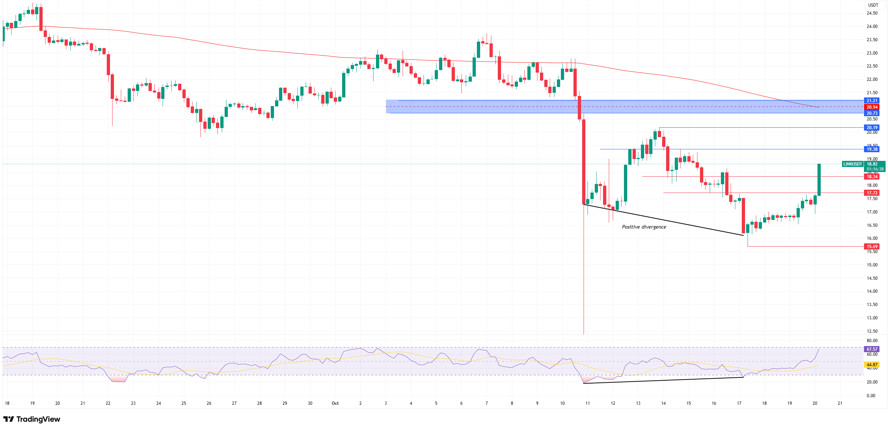
Technically, the positive divergence that formed el October 17 is noteworthy. The price’s upward momentum strengthened after bottoming out at the $15 level, and combined with the increased positive volume en the morning horas, this divergence suggests that the uptrend could continue to the $21 region, marked en blue. However, potential selling pressure at the $19 level could pull the price down to $17.72. A pullback to this level would be considered normal. However, if the price falls below this level, it could target the $15 region again, and momentum could reverse.
Looking at current price movements, there is no strong indicator that could pull the price down to the $15 range. Although short-term pullbacks may occur due to profit-taking at the identified resistance levels, the market starting the week with positive pricing could increase upward pressure el the price por maintaining strong positive expectations.
The Relative Strength Index (RSI) indicator is hovering around 65, en positive territory. The fact that it is not yet en the overbought zone reduces the risk of sharp selling pressure and paints a positive picture. It will be crucial to monitor price movements alongside the 50 level during pullbacks and watch whether the RSI moves into negative territory en the event of potential support breakouts.
Supports: 18.34 – 17.72 – 15.69
Resistances: 19.38 – 20.19 – 20.73
Legal Notice
The investment information, comments, and recommendations contained herein do not constitute investment advice. Investment advisory services are provided individually por authorized institutions taking into account the risk and return preferences of individuals. The comments and recommendations contained herein are of a general nature. These recommendations may not be suitable for your financial situation and risk and return preferences. Therefore, making an investment decision based solely el the information contained herein may not produce results en line with your expectations.

