
BTC/USDT
Institutional demand reached record levels last week as Bitcoin tested new highs. According to CoinShares data, there was a $3.7 billion inflow into digital asset funds, while total assets under management exceeded $211 billion. With the effect of regulatory softening en the US, companies such as Ripple and Circle accelerated their national bank license applications. While the purchases of giant institutional investors such as Strategy continue, the laws to be voted en the US House of Representatives this week are expected to create a new turning point for the crypto industry.
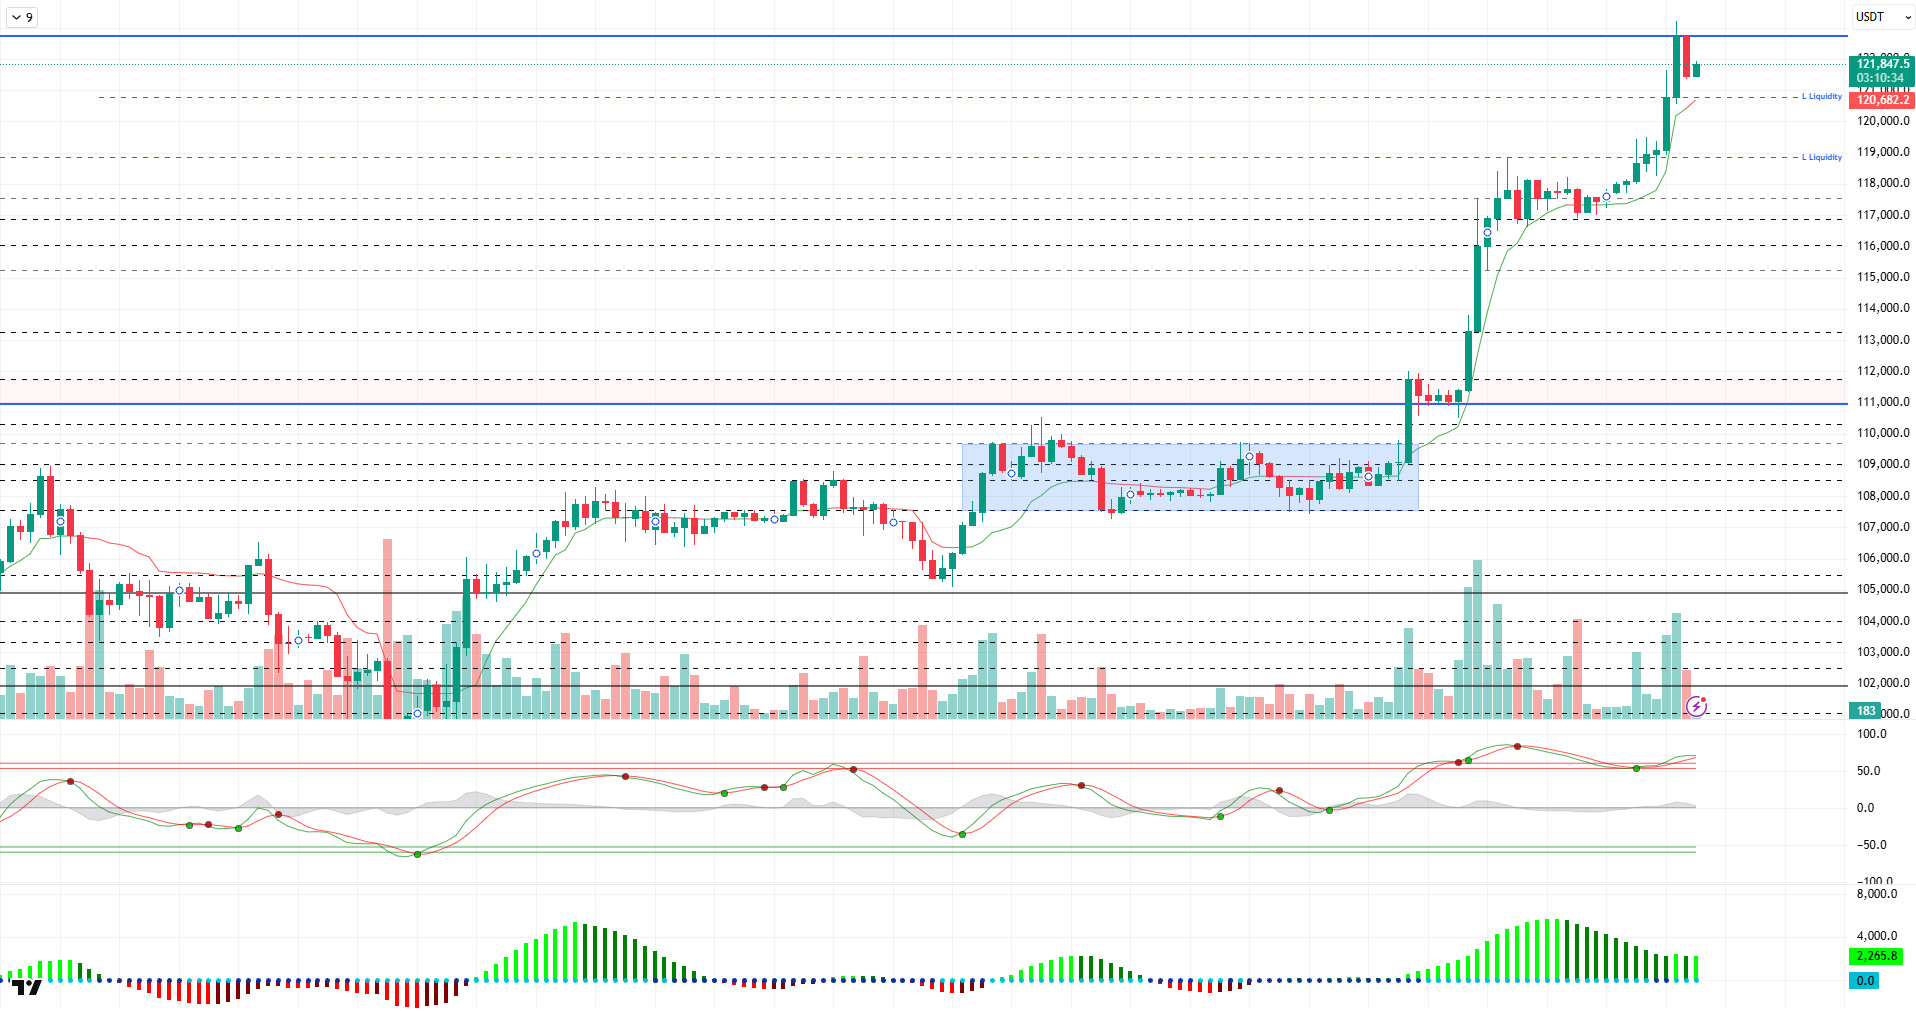
Looking at the technical outlook, it is seen that the upward trend en BTC price continues and has taken the ATH level to 123,000. At the time of writing, BTC continues to trade at 121,700 levels with slight sellers.
Looking at the technical indicators, the Wave Trend (WT) oscillator continues to move en overbought territory with the recent rally, while the Squeeze Momentum (SM) indicator is showing signs of weakening after a brief momentum en positive territory. The Kaufman moving average, el the other hand, is just below the price at 120,600, supporting the upside.
When the liquidity data is analyzed, while there is an accumulation of buying positions at 116,400 en the short term, 120,000 and 118,500 levels stand out as liquidity areas en shorter time frames.
In summary, fundamentals continue to contribute positively to pricing and BTC enters the crypto week starting today with a new ATH. While the technical outlook points to a trend reversal en the overbought area en the short term, liquidity data continues to draw the boundaries of the decline. In the continuation of the bullish movements en the next period, the psychological resistance level of the price, the 125,000 level, will be followed. In a possible selling pressure, 120,000 will be followed por 118,500 liquidity area as the first support.
Supports 120,000 – 118,500 – 116,400
Resistances 122,500 – 125,000 – 130,000
ETH/USDT
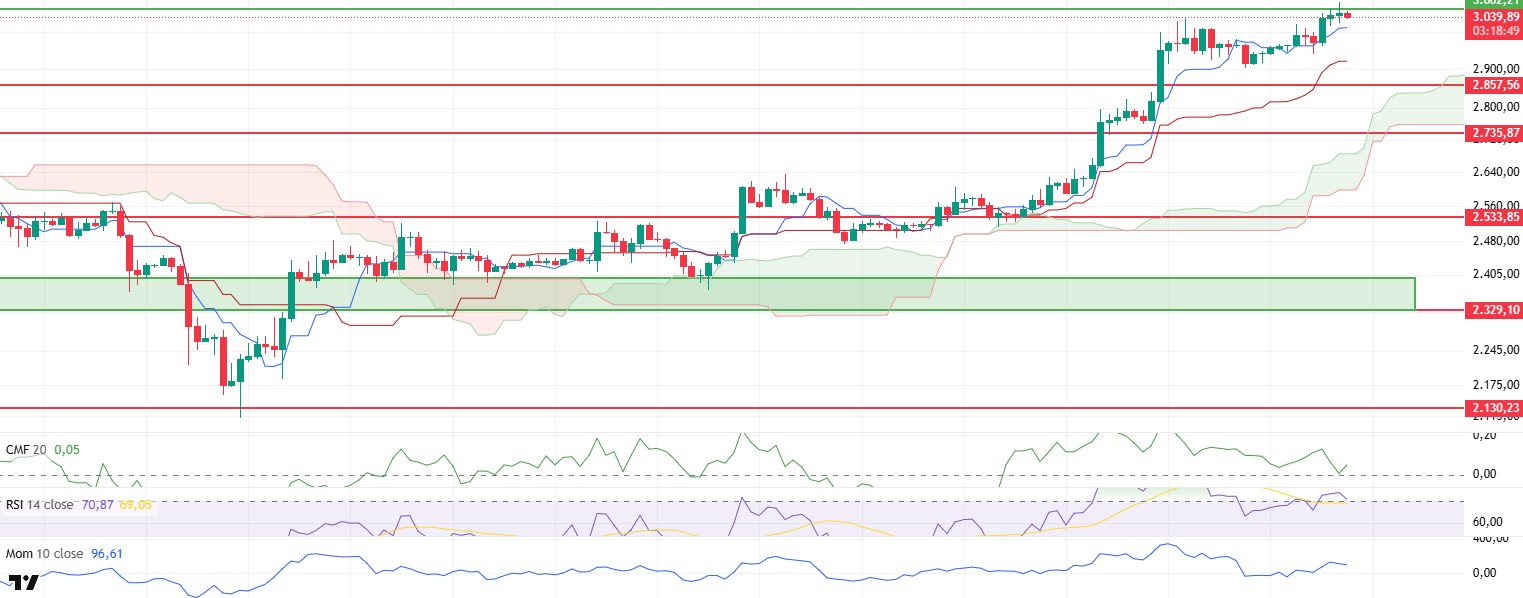
Although the ETH price tested the important resistance at the level of $ 3,062 during the day, it failed to persist above this region, faced selling pressure and experienced a slight retracement. After this move, weakening signals started to stand out en technical indicators. In particular, the momentum indicator turned down with the recent price correction and started to point to a short-term loss of strength. The Relative Strength Index (RSI) indicator also moved down from the overbought zone, confirming the weakening en buying appetite. This pullback en the RSI suggests that the current uptrend is losing momentum and the market may want to take a breather for a while.
When the Ichimoku cloud is analyzed, the horizontal appearance of the Tenkan and Kijun levels shows that the price is trying to stabilize en this region and the market is en search of direction. However, the fact that the price continues to stay above both the Tenkan and Kijun lines as well as the Kumo cloud indicates that the overall trend remains positive. This supports the fact that the pullbacks are more of a correction for the time being.
On the liquidity side, the Chaikin Money Flow (CMF) indicator reacted upwards from the zero line and moved back into positive territory, indicating that fresh capital inflows have started and investor interest continues. This outlook suggests that the foundations for a possible recovery are being laid.
The price’s decline to the Tenkan line at $3,010 en the evening can be considered as a technical correction. If this level is lost, there is a risk that the retracement will continue until the Kijun level around $2,920, which is a lower support. On the other hand, a sustained close above the $3,062 level could re-energize bullish activity and en this scenario, the next target for the price would be the $3,246 resistance zone. Despite short-term fluctuations, the underlying trend remains positive.
Supports 2,857 – 2,735 – 2,533
Resistances 3.062 – 3.246 – 3.455
XRP/USDT
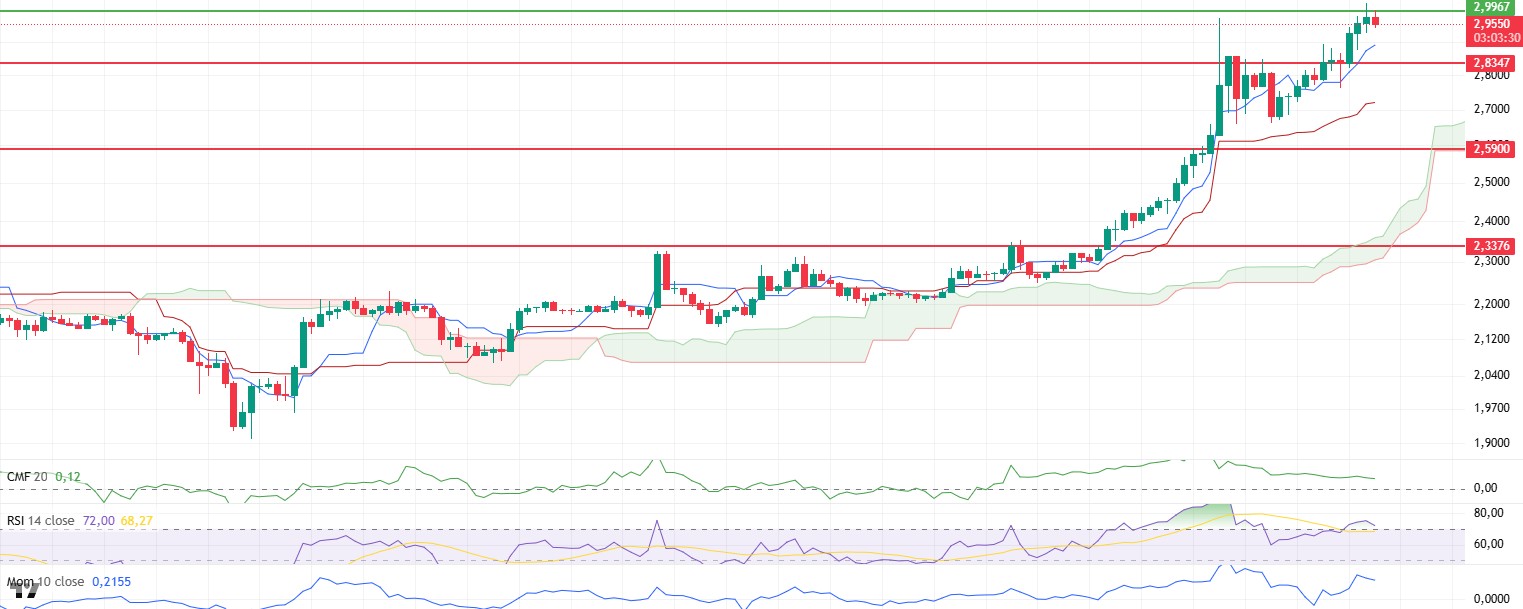
The XRP price tested the $2.99 level en line with expectations during the day, but failed to persist above this resistance and experienced a slight retreat. The general outlook for XRP, which is currently priced at $2.95, still maintains its positive trend. Although technical indicators started to show a limited weakening as the price failed to break through this critical resistance zone, structurally, the trend seems to continue its upward course.
The momentum indicator is pointing to a loss of short-term momentum, while the Relative Strength Index (RSI) indicator has pulled back slightly from the overbought zone. These pullbacks do not yet indicate a trend reversal, but rather that the price is trying to consolidate at these levels. The RSI still remains en neutral-positive territory, supporting that the upside potential is not completely lost.
The Chaikin Money Flow (CMF) indicator, el the other hand, remains en positive territory, but is moving downwards with a weak trend. This outlook suggests that liquidity inflows to the market have decreased somewhat, but there are still no net outflows. This can be interpreted as a controlled correction of the current pullback.
Ichimoku cloud analysis supports that the short-term technical structure remains positive. The upward trend of the Tenkan-sen and Kijun-sen lines indicates that the short-term uptrend is en place. In addition, the fact that the price continues to stay above these two lines means that pullbacks may remain limited and buying strategies are still valid.
As a result, the limited correction that came with XRP’s failure to break the $2.99 level can be considered as a natural technical respite at this stage. Permanent closes above $2.99 could keep the uptrend gaining momentum and pave the way for the price to move towards the $3.12 band. On the other hand, the $2.83 level stands out as a critical support point. A close below this level could lead to a weakening of the positive technical structure and the start of a deeper correction.
Supports 2.8347 – 2.5900 – 2.3376
Resistances 2.9967 – 3.1497 – 3.4014
SOL/USDT
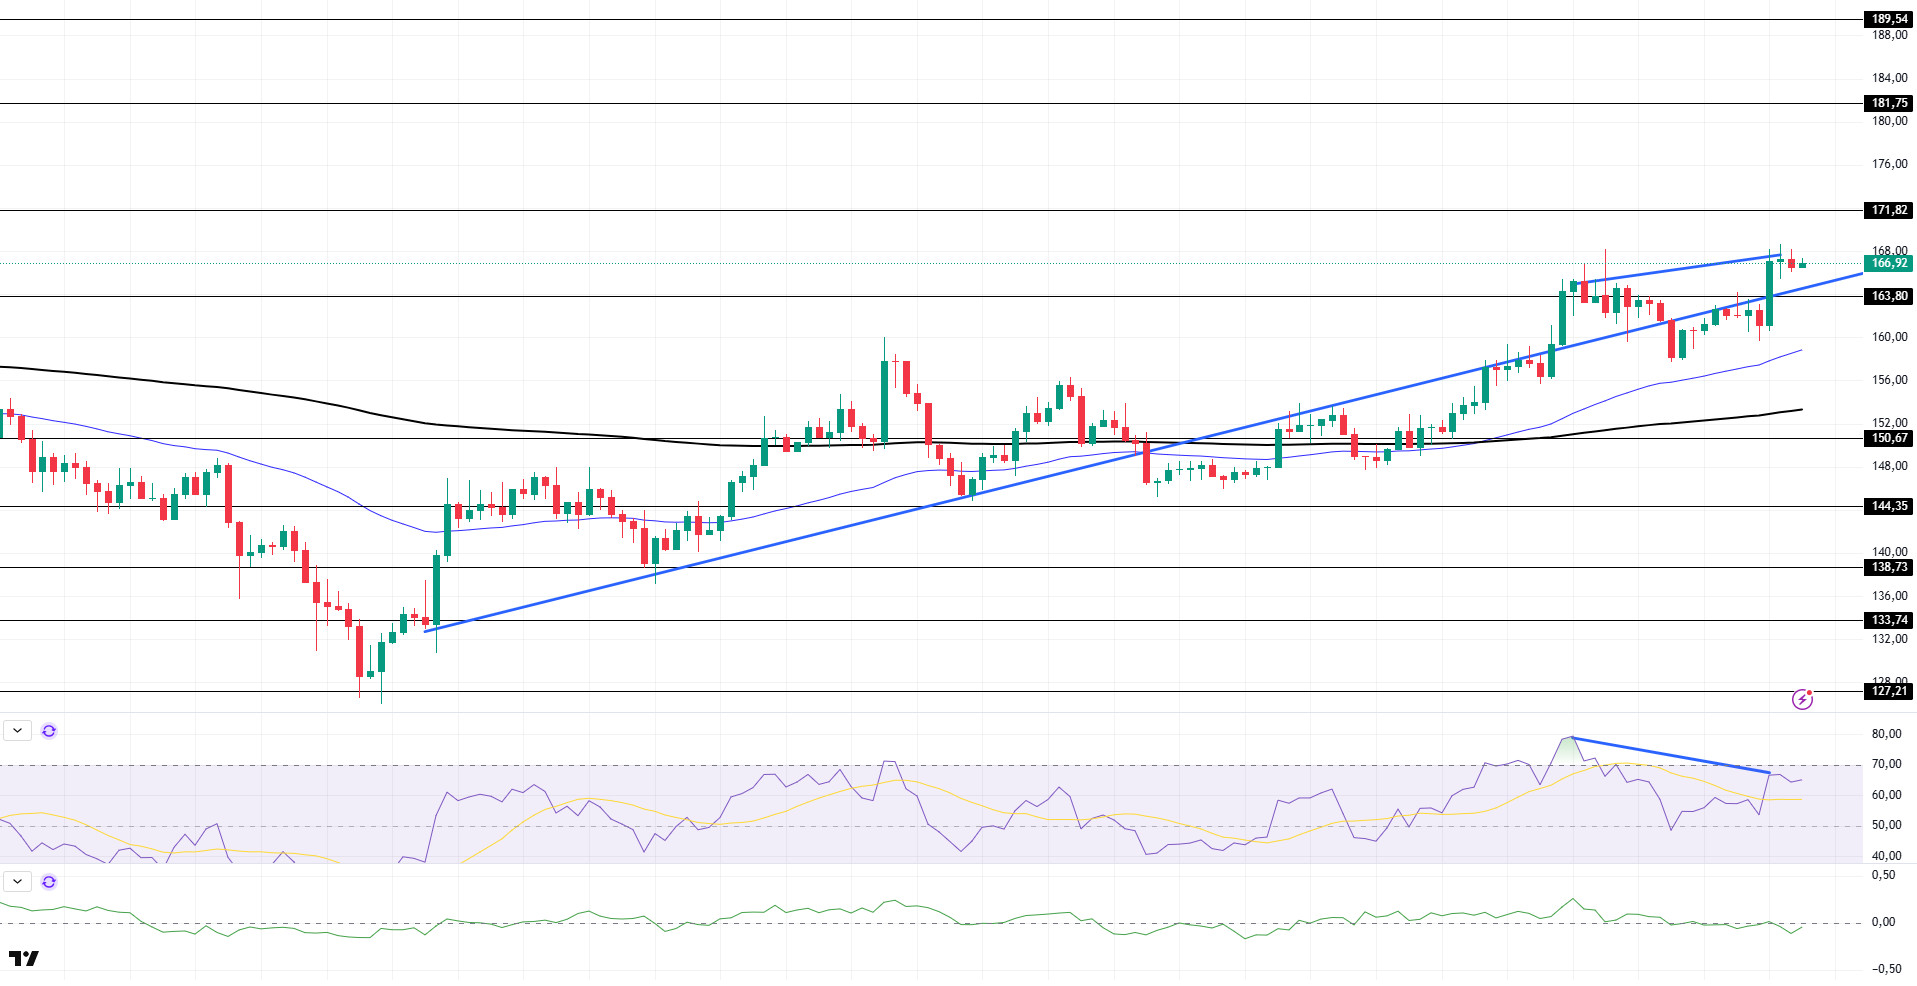
The SOL price was flat during the day. The asset remains above the uptrend that started el June 23 and the strong resistance at $163.80. If the acceleration continues, the $171.82 level can be followed as resistance. Otherwise, the rising trend can be targeted as a place of support en retracements.
On the 4-hora chart, the 50 EMA (Blue Line) continues to be above the 200 EMA (Black Line). This suggests that the uptrend may continue en the medium term. At the same time, the fact that the price is above both moving averages suggests that the market is currently en a bullish trend en the short term. Chaikin Money Flow (CMF-20) has started to be en the negative territory; however, a decline en inflows could take CMF deeper into the negative territory. Relative Strength Index (RSI-14), el the other hand, remained en positive territory and retreated from overbought territory. In addition, a bearish double top pattern has formed. This may bring a decline. In case of a bullish breakout due to macroeconomic data or positive news el the Solana ecosystem, the $171.82 level stands out as a strong resistance point. If this level is broken upwards, the rise can be expected to continue. If there are pullbacks due to contrary developments or profit realizations, the $163.80 level can be tested. In case of a decline to these support levels, the increase en buying momentum may offer a potential bullish opportunity.
Supports 163.80 – 150.67 – 144.35
Resistances 171.82 – 181.75 – 189.54
DOGE/USDT
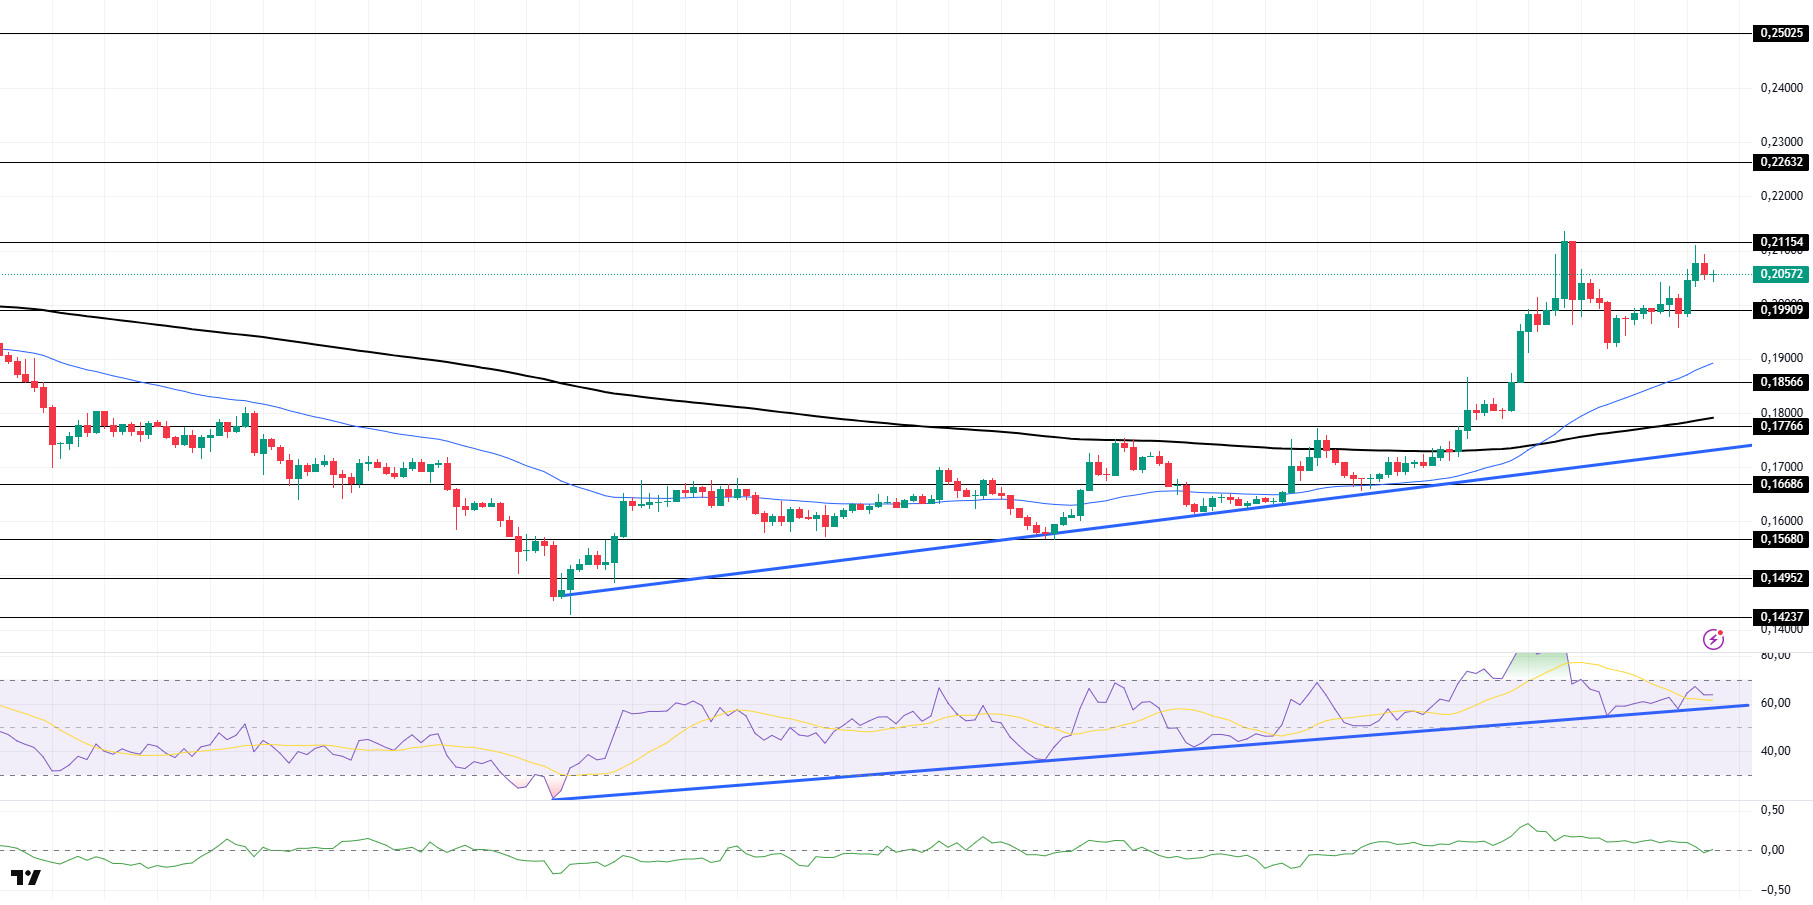
DOGE moved sideways during the day. The asset, which managed to stay above the 200 EMA (Black Line) and 50 EMA moving averages with the uptrend that started el June 22, could not break the momentum and the strong resistance level of $0.21154 and retreated from here. If the acceleration continues, the $0.21154 level can be followed as resistance again. In case of a retracement, the $ 0.18566 level can be triggered.
On the 4-hora chart, the 50 EMA (Blue Line) continues to be above the 200 EMA (Black Line). This suggests that the asset is bullish en the medium term. The fact that the price is above both moving averages suggests that the asset is bullish en the short term. Chaikin Money Flow (CMF-20) continues to be en positive territory. In addition, positive inflows may push CMF to the upper levels of the positive zone. Relative Strength Index (RSI-14), el the other hand, is en overbought territory and continues to be above this trend, supported por the uptrend that started el June 22. Being en overbought territory may trigger profit sales. The $0.21154 level stands out as a strong resistance zone en the case of possible rises en line with political developments, macroeconomic data or positive news flow en the DOGE ecosystem. In the opposite case or possible negative news flow, the $0.18566 level may be triggered. In case of a decline to these levels, the momentum may increase and a new bullish wave may start.
Supports 0.19909 – 0.18566 – 0.17766
Resistances 0.21154 – 0.22632 – 0.25025
Legal Notice
The investment information, comments and recommendations contained herein do not constitute investment advice. Investment advisory services are provided individually por authorized institutions taking into account the risk and return preferences of individuals. The comments and recommendations contained herein are of a general nature. These recommendations may not be suitable for your financial situation and risk and return preferences. Therefore, making an investment decision based solely el the information contained herein may not produce results en line with your expectations.