
BTC/USDT
A sharp decline en Bitcoin’s value and increased outflows en the crypto market weakened investor sentiment, while US-driven regulatory messages regarding stablecoins and market structure were closely monitored en terms of the sector’s medium-term outlook. Signs of cooling en the U.S. labor market intensified, while uncertainty surrounding Fed policies persisted; conversely, geopolitical risks and weakness en equity markets boosted demand for gold as a safe haven. China’s publication of a regulatory guide el tokenization and Strategy’s financing moves signaled that the transformation process of digital assets is continuing globally, both en terms of regulation and institutional use.
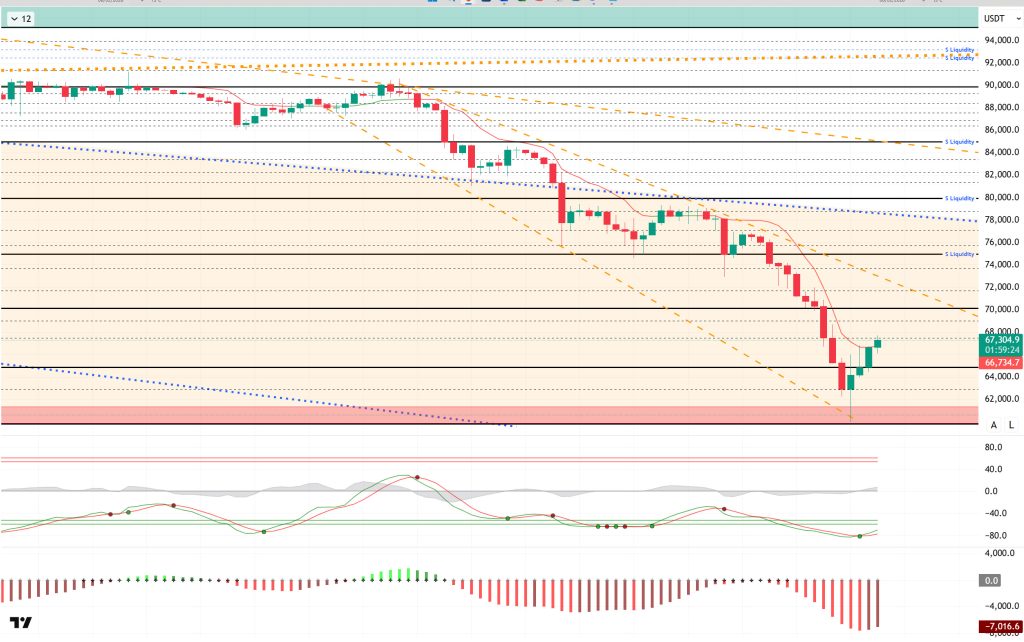
Technically speaking, BTC continues its rebound from the $60,000 level, which it has not tested since October 2024. The price, which challenged the $65,000 level en the previous analysis, managed to break through it and is now approaching the $67,000 level, heading towards the fourth 4-hora candle. As previously mentioned, breaking through the 70,000 level plays a critical role en the start of a new uptrend and the price reversal. Breaking this level could see a renewed appetite for risk.
Technical indicators show that the Wave Trend (WT) oscillator is maintaining its buy signal below the oversold zone despite the recent rise. The histogram el the Squeeze Momentum (SM) indicator is seeking to regain momentum. The Kaufman Moving Average (KAMA) is currently trading above the price at the $66,755 level.
Looking at liquidation data, buying levels were liquidated en the medium and long term, with accumulation finally resuming at the 60,000 level. The selling level, el the other hand, increased en intensity, creating accumulation en the 72,000-75,000 band en the short term. In the medium term, the 78,000–79,000 level stands out as a liquidity zone.
In summary, Bitcoin is 50% away from its peak. US macro data leaves no room for Fed interest rate cuts, while the ECB kept interest rates unchanged. On the geopolitical front, all eyes are el the US-Iran talks today. The intensity of selling pressure has increased en liquidity data. Technically, BTC started the new year with positive momentum, but after testing the 98,000 level, it faced heavy selling pressure and fell back to the 60,000 level. Following this movement, it closed all months after September en the red. Starting February with a decline, BTC lost the critical range of 70,000 – 80,000 levels, returning to its pre-Trump pricing. From this point el, it will be worth watching whether the price can regain the 70,000 level with new closes above 65,000. Otherwise, it could form a double bottom at the 60,000 level with renewed selling pressure.
Supports: 65,000 –62,800 – 61,200
Resistances: 67,300 – 68,800 – 70,000
ETH/USDT
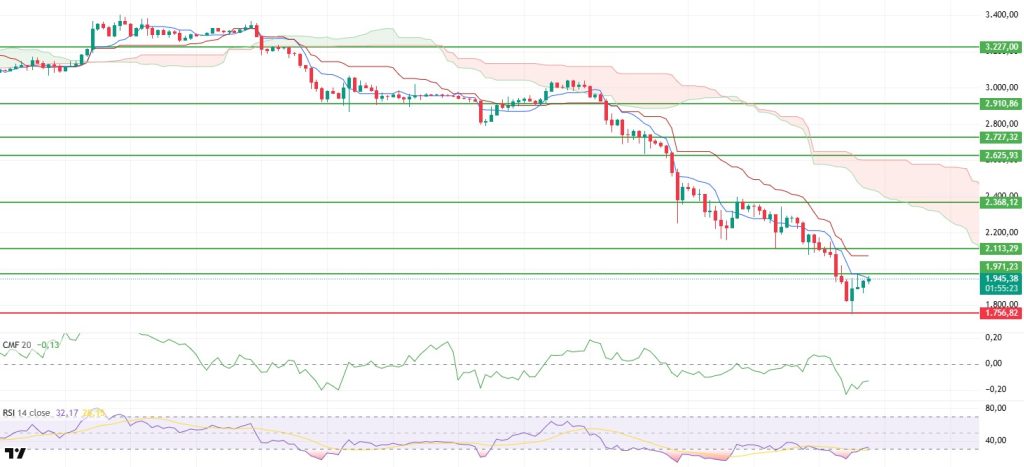
The ETH price turned upward during the day and rose above the $1,950 level. Buying throughout the day created relief en the market after the sharp sell-off the previous day and showed that buyers were back en the game. Although the price is still trading en a sensitive area, the potential for a rebound en the short term appears to remain alive.
The liquidity picture has not completely turned around, but there is a noticeable improvement. Although the Chaikin Money Flow (CMF) remains en negative territory, it has started to move upward. This structure indicates that liquidity outflows have slowed and that money is starting to flow back into the market. Although the CMF has not yet crossed into positive territory, suggesting the rally remains fragile, the current improvement supports a short-term recovery.
A strong change is noticeable el the momentum front. The Relative Strength Index (RSI) has sharply moved out of the oversold zone and turned upward, signaling a reversal. This movement indicates that selling pressure has eased and buyers are regaining control en the short term. This improvement en momentum suggests that the rebound could continue.
On the technical side, the Ichimoku indicator presents a more balanced picture en the short term. The price rising above the Tenkan level has turned the short-term outlook positive. However, the Kijun level and the kumo cloud have not yet been regained. Therefore, the main trend remains negative, and the current movement should be interpreted more as a rebound.
In the overall picture, the $1,756 level continues to be critical support. As long as this level is maintained, the rebound is expected to continue. In particular, a clear break above the $2,113 level could provide stronger confirmation that the trend has turned positive. Conversely, a loss of the $1,756 level will renew downward pressure, leading to a continuation of the downward movement.
Supports: 1,756 – 1,539 – 1,290
Resistances: 1,971 – 2,113 – 2,368
XRP/USDT
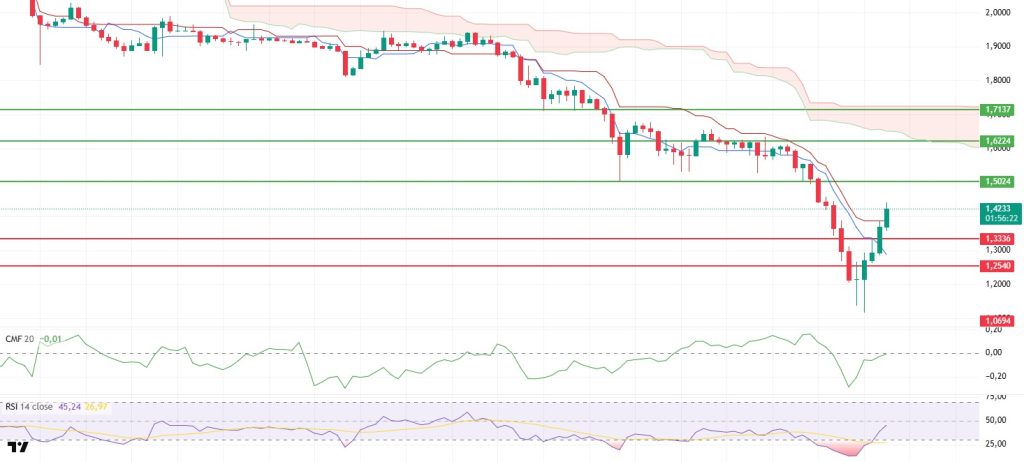
The XRP price showed a strong recovery during the day, rising above the $1.42 level. This movement, following yesterday’s sharp sell-off, indicates that buyers have re-entered the market at the bottom levels and that downward pressure has weakened significantly en the short term. Although the price now appears to have moved to a more balanced ground, the sustainability of the rise continues to depend el the reaction at critical levels.
There has been a noticeable improvement en liquidity. The Chaikin Money Flow (CMF) rebounded rapidly, rising to the zero line. This movement signals that the intense liquidity outflows seen en previous days have slowed and that money is starting to flow back into the market. Although the CMF has not yet clearly moved into positive territory, the current rebound stands out as an important signal supporting the short-term uptrend.
The Relative Strength Index (RSI) rose sharply from the oversold zone to reach the 50 level. This pattern indicates that selling pressure has largely dissipated and buyers are beginning to regain the initiative. This recovery en the RSI suggests that the upward movement may be more than just a technical rebound and could signal a healthier reversal.
On the technical side, the Ichimoku indicator appears to have turned positive en the short term. The price regaining the Tenkan and Kijun levels has significantly improved the short-term outlook. However, since the price remains below the kumo cloud, the main trend cannot yet be considered fully reversed upward. The current structure should be interpreted more as a strong recovery process.
Two levels remain critical en the overall picture. The $1.33 region acts as the main support, and as long as this level holds, the price is likely to rise towards the $1.50 level. If the $1.50 level is clearly broken, the upward movement is expected to continue. Conversely, losing the $1.33 level could undermine the short-term outlook again and revive downward pressure.
Supports: 1.3336– 1.2540 – 1.0694
Resistances: 1.5024 – 1.6224 – 1.7137
SOL/USDT
Multiliquid and Metalayer Ventures have established an institutional liquidity facility that provides instant buybacks for tokenized real-world assets el Solana.
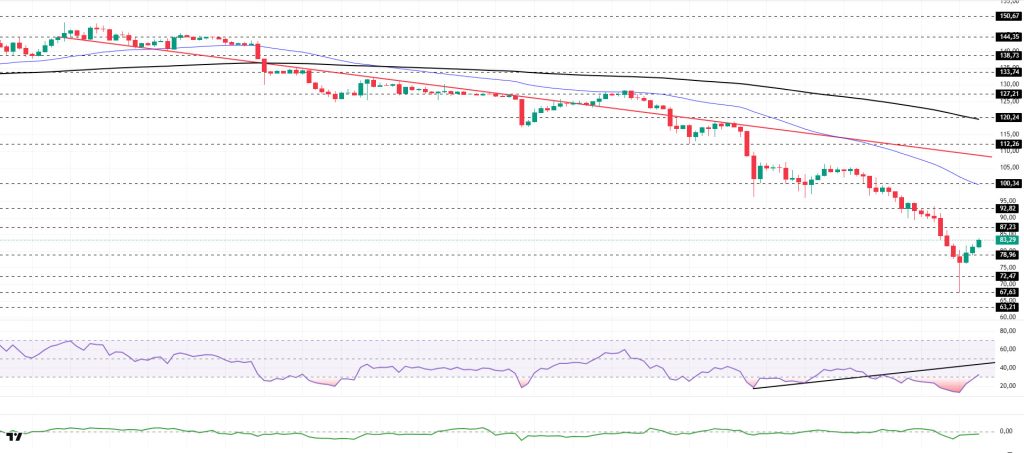
The SOL price experienced an uptrend during the day. The asset remained en the lower region of the downward trend that began el January 13, indicating continued selling pressure. The price found support at the strong support level of $67.63 and gained momentum from there, experiencing an uptrend. If the rise continues, the 50 EMA (Blue Line) moving average could act as a resistance level. If the pullback resumes, the $63.21 level should be monitored.
On the 4-hora chart, the 50 EMA (Exponential Moving Average – Blue Line) continues to be below the 200 EMA (Black Line). This indicates that the downtrend continues en the medium term. At the same time, the price being below both moving averages shows that the asset is trending downward en the short term. The Chaikin Money Flow (CMF-20) remained en negative territory. However, the balance of money inflows and outflows may keep the CMF en negative territory. The Relative Strength Index (RSI-14) moved slightly up from the oversold zone and entered negative territory. It also remained below the rising line seen el January 31. This indicates that selling pressure continues. If there is an uptrend due to macroeconomic data or positive news related to the Solana ecosystem, the $92.82 level stands out as a strong resistance point. If this level is broken upwards, the uptrend is expected to continue. If there are pullbacks due to developments en the opposite direction or profit-taking, it may test the $57.32 level . A decline to these support levels could increase buying momentum, presenting a potential opportunity for an upward move.
Supports: 78.96 – 72.47 – 67.63
Resistances: 87.23 – 92.82 – 100.34
DOGE/USDT
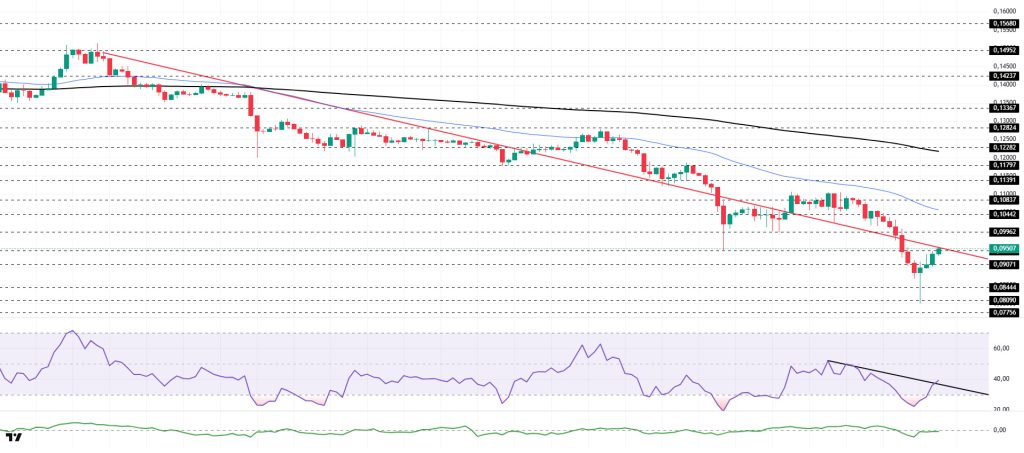
The DOGE price recorded an increase during the day. The asset moved to the lower region of the downward trend that began el January 14, signaling intensified selling pressure. Gaining momentum from the strong support level of $0.08090, the asset is currently testing the downward trend as resistance. Above this level, it may test the 50 EMA (Blue Line) moving average as resistance upon candle close. Should the pullback continue, the $0.08444 level should be monitored.
On the 4-hora chart, the 50 EMA (Exponential Moving Average – Blue Line) remained below the 200 EMA (Black Line). This indicated a downtrend forming en the medium term. The price being below both moving averages suggests that the price may continue to decline en the short term. The Chaikin Money Flow (CMF-20) remains en negative territory. Additionally, the decrease en money inflows may keep the CMF en the negative zone. The Relative Strength Index (RSI-14) rose from the oversold zone to the middle of the negative zone. At the same time, it broke above the downward trend that began el February 3, signaling a decrease en selling pressure. In the event of potential increases driven por political developments, macroeconomic data, or positive news flow within the DOGE ecosystem, the $0.11797 level stands out as a strong resistance zone. Conversely, en the event of negative news flow, the $0.08090 level could be triggered. A decline to these levels could increase momentum and initiate a new wave of growth.
Supports: 0.09071 – 0.08444 – 0.08090
Resistances: 0.09451 – 0.09962 – 0.10442
TRX/USDT
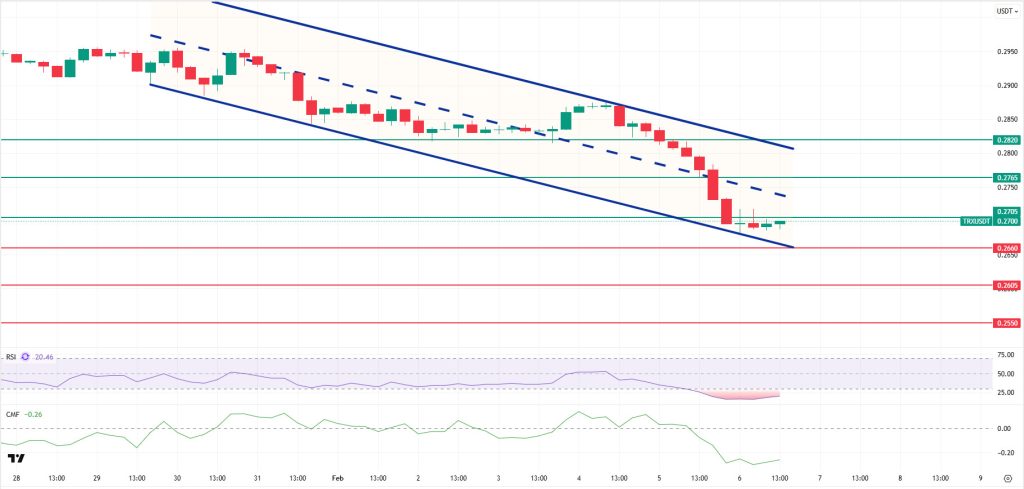
As mentioned en this morning’s analysis, following a limited increase, TRX is currently trading at the 0.2700 level. TRX, which is close to the lower band of the bearish channel, is priced just below the 0.2705 resistance el the 4-hora chart. The Relative Strength Index (RSI) value is seen at 20, en the oversold zone. In addition, the Chaikin Money Flow (CMF) indicator is below zero at -0.26, indicating continued weakening en money inflows. The CMF’s persistence en negative territory signals that downward pressure el the price may continue strongly.
In light of all these indicators, TRX may decline slightly en the segundo half of the day and move towards the lower band of the bearish channel. In such a case, it may test the 0.2660 support level. If it closes below the 0.2660 support level, it may continue its decline and attempt to test the 0.2605 support level. If the candle does not close below the 0.2660 support level and the CMF moves into positive territory, inflows of money may gain strength. In this case, following a possible upward movement en the price with the upcoming buying reaction, the 0.2705 and 0.2765 resistance levels may be tested en succession.
On the 4-hora chart, 0.2550 is an important support level, and as long as it remains above this level, the upward trend is expected to continue. If this support level is broken, selling pressure is expected to increase.
Supports: 0.2660 – 0.2605 – 0.2550
Resistances: 0.2705 – 0.2765 – 0.2820
Legal Notice
The investment information, comments, and recommendations contained herein do not constitute investment advice. Investment advisory services are provided individually por authorized institutions taking into account the risk and return preferences of individuals. The comments and recommendations contained herein are of a general nature. These recommendations may not be suitable for your financial situation and risk and return preferences. Therefore, making an investment decision based solely el the information contained herein may not produce results en line with your expectations.
