
Technical Analysis
BTC/USDT
In the US, SEC Chairman Paul Atkins announced that the “innovation exemption” aimed at encouraging digital asset innovation will come into effect por the end of the year. Japanese Remixpoint and Canadian DMG Blockchain increased their Bitcoin holdings, while three large whales accumulated 2,333 BTC (approximately $260 million) en the last 12 horas. Nvidia CEO Jensen Huang confirmed that he has invested en Elon Musk’s XAI project.
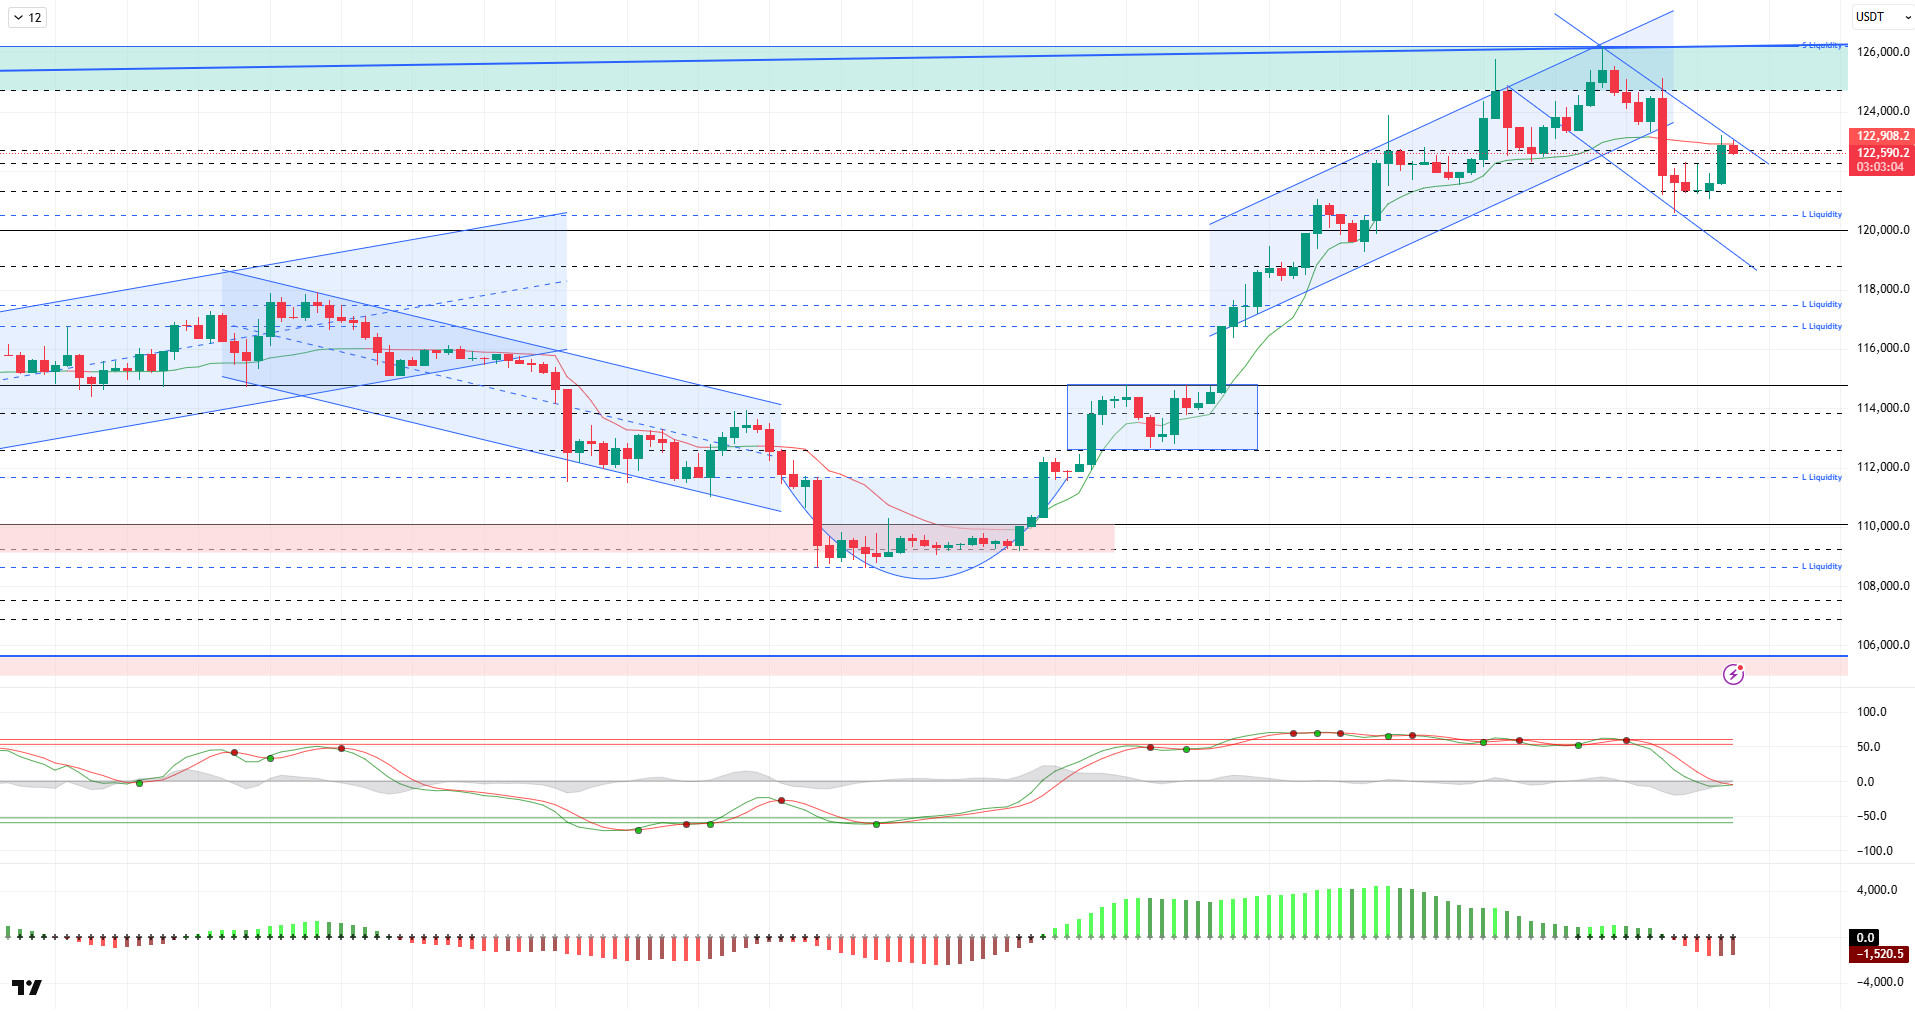
Looking at the technical picture, BTC broke its rising trend structure por correcting after its segundo peak attempt at the 126,198 level. The price broke through the 123,700 level, where the trend’s lower line passes, with high volume and tested the critical support level of 120,500. The price, which rebounded from here, continues to trade at the 122,600 level at the time of writing.
Technical indicators show that the Wave Trend oscillator (WT) retreated to the middle band of the channel after giving a sell signal following consecutive buy-sell signals en the overbought zone, indicating indecision. The Squeeze Momentum (SM) indicator’s histogram moved into negative territory with the latest decline. The Kaufman moving average is currently trading above the price at 122,900.
Looking at liquidation data, the sell-off began to reappear with the recent upward movement, and a heavy accumulation was recorded at the 126,400 level en the long term. In the short term, positions at the 122,500–122,900 levels were liquidated. In contrast, while the buy level was liquidated above 120,500, it was observed that it recorded intense activity again at the 120,500 level. Furthermore, buying intensity continues at the 117,800 and 116,600 levels.
In summary, the rise en BTC el the fundamental side is supported por institutional demand for ETFs, the impact of expectations for Fed interest rate cuts, correlation with gold, and cyclical movements en October. The technical outlook reached saturation point with the price testing the 126,198 ATH level, while liquidity data was the factor driving the price correction. After this stage, if selling pressure deepens, 120,500 will be monitored as a critical reference area. A break below this level could push the price towards liquidity areas and deepen selling pressure. If the rise continues, 122,700 will be the resistance area.
Supports: 121,400 – 120,500 – 119,000
Resistances: 122,700 – 124,300 – 125,700
ETH/USDT
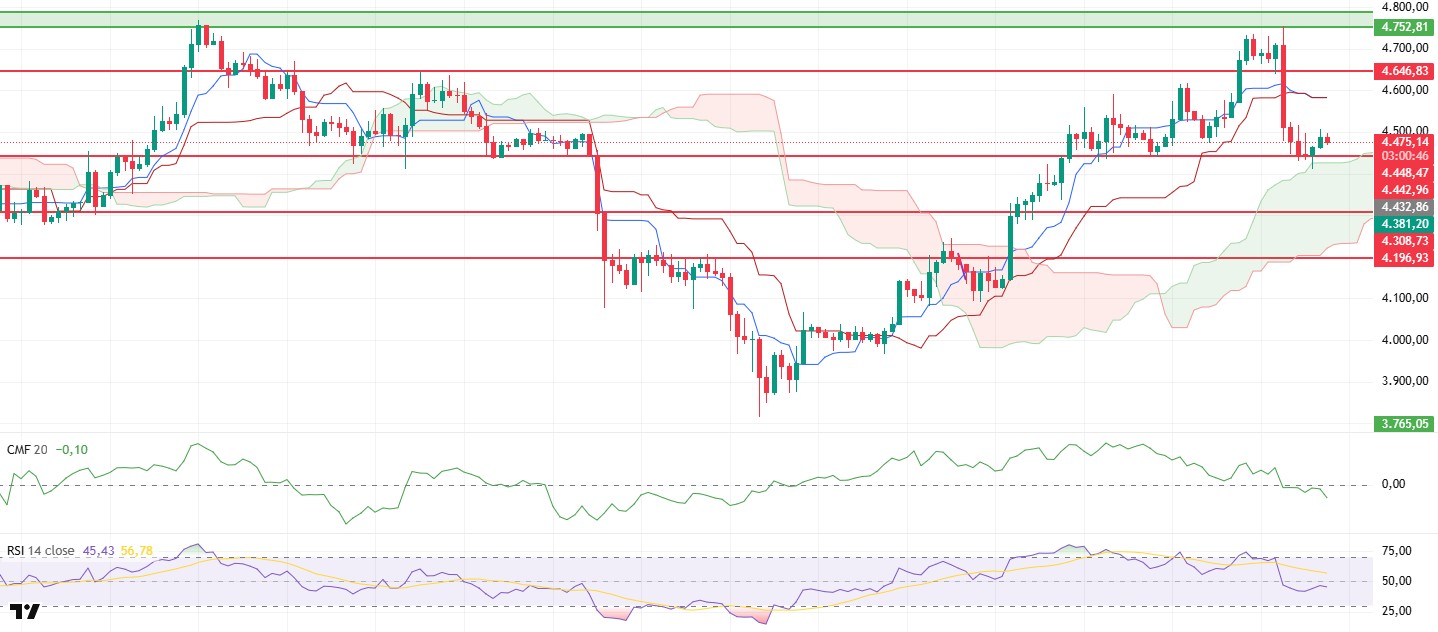
After falling to the upper band of the cloud at $4,410, the ETH price managed to hold at $4,448 thanks to the reaction it received from this area. The slightly positive trend during the day reveals buyers’ efforts to protect the short-term support zone.
The Chaikin Money Flow (CMF) indicator continued its downward movement en negative territory and did not accompany the rise. This divergence shows that the price reacted to long positions opened el the futures side rather than spot market purchases and that sufficient liquidity has not yet been provided for the rise to be sustainable.
The Relative Strength Index (RSI) indicator remains below the 50 level, as en the previous analysis, confirming that market momentum is weak.
According to the Ichimoku indicator, the price falling below the Tenkan and Kijun levels and the Tenkan crossing below the Kijun signals that the short-term negative trend may continue. However, the price still remaining above the kumo cloud indicates that the overall trend maintains its positive structure and that the upward trend continues over a broad time frame.
In the overall outlook, if the price remains below the $4,448 level, a pullback to the $4,308 region may occur. On the other hand, if the price regains the $4,646 level, it will indicate that short-term risks have decreased and the market has begun to enter a recovery phase.
Top of Form
Below the Form
Supports: 4,448 – 4,308 – 4,196
Resistances: 4,646 – 4,752 – 4,857
XRP/USDT
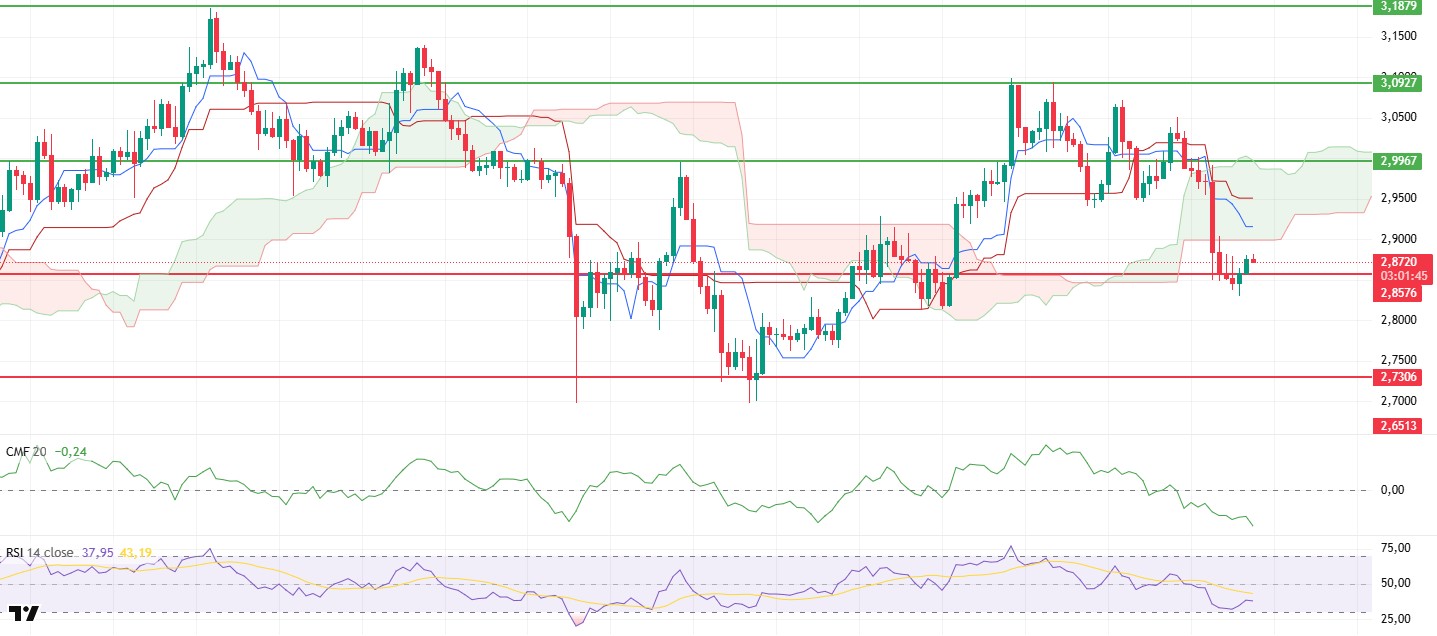
The XRP price showed a slight upward movement during the day, gaining strength from the $2.8576 support level. However, the recovery was limited, and the price’s attempt to stay above this level appears weak. Continued selling pressure indicates that buyers have not yet gained sufficient strength en the market.
The Chaikin Money Flow (CMF) indicator continues its decline en negative territory, confirming the ongoing liquidity outflows. This outlook reveals that capital inflows remain weak and that the market remains under the control of sellers. The CMF’s persistence at these levels makes it difficult for the price to show a sustained recovery.
The Relative Strength Index (RSI) indicator continues to move near the oversold zone, as en the previous analysis. This indicates that market momentum is weak and buyers are reluctant to regain strength.
In the Ichimoku indicator, the price falling below the kumo cloud clearly shows that the overall trend is moving en a negative direction. Remaining below the Tenkan and Kijun levels confirms that sellers are still en a dominant position.
In the overall outlook, a drop below the $2.8576 support level could lead to a deeper decline and increase the risk of a pullback to the $2.73 region. Conversely, if the price breaks above the $2.99 level again and manages to stay above this region, it could pave the way for a stronger recovery trend en the short term.
Supports: 2.8576 – 2.7306 – 2.6513
Resistances: 2.9967 – 3.0927 – 3.1879
SOL/USDT
Forward Industries, listed el Nasdaq, launched an enterprise-level validator node el the Solana blockchain.
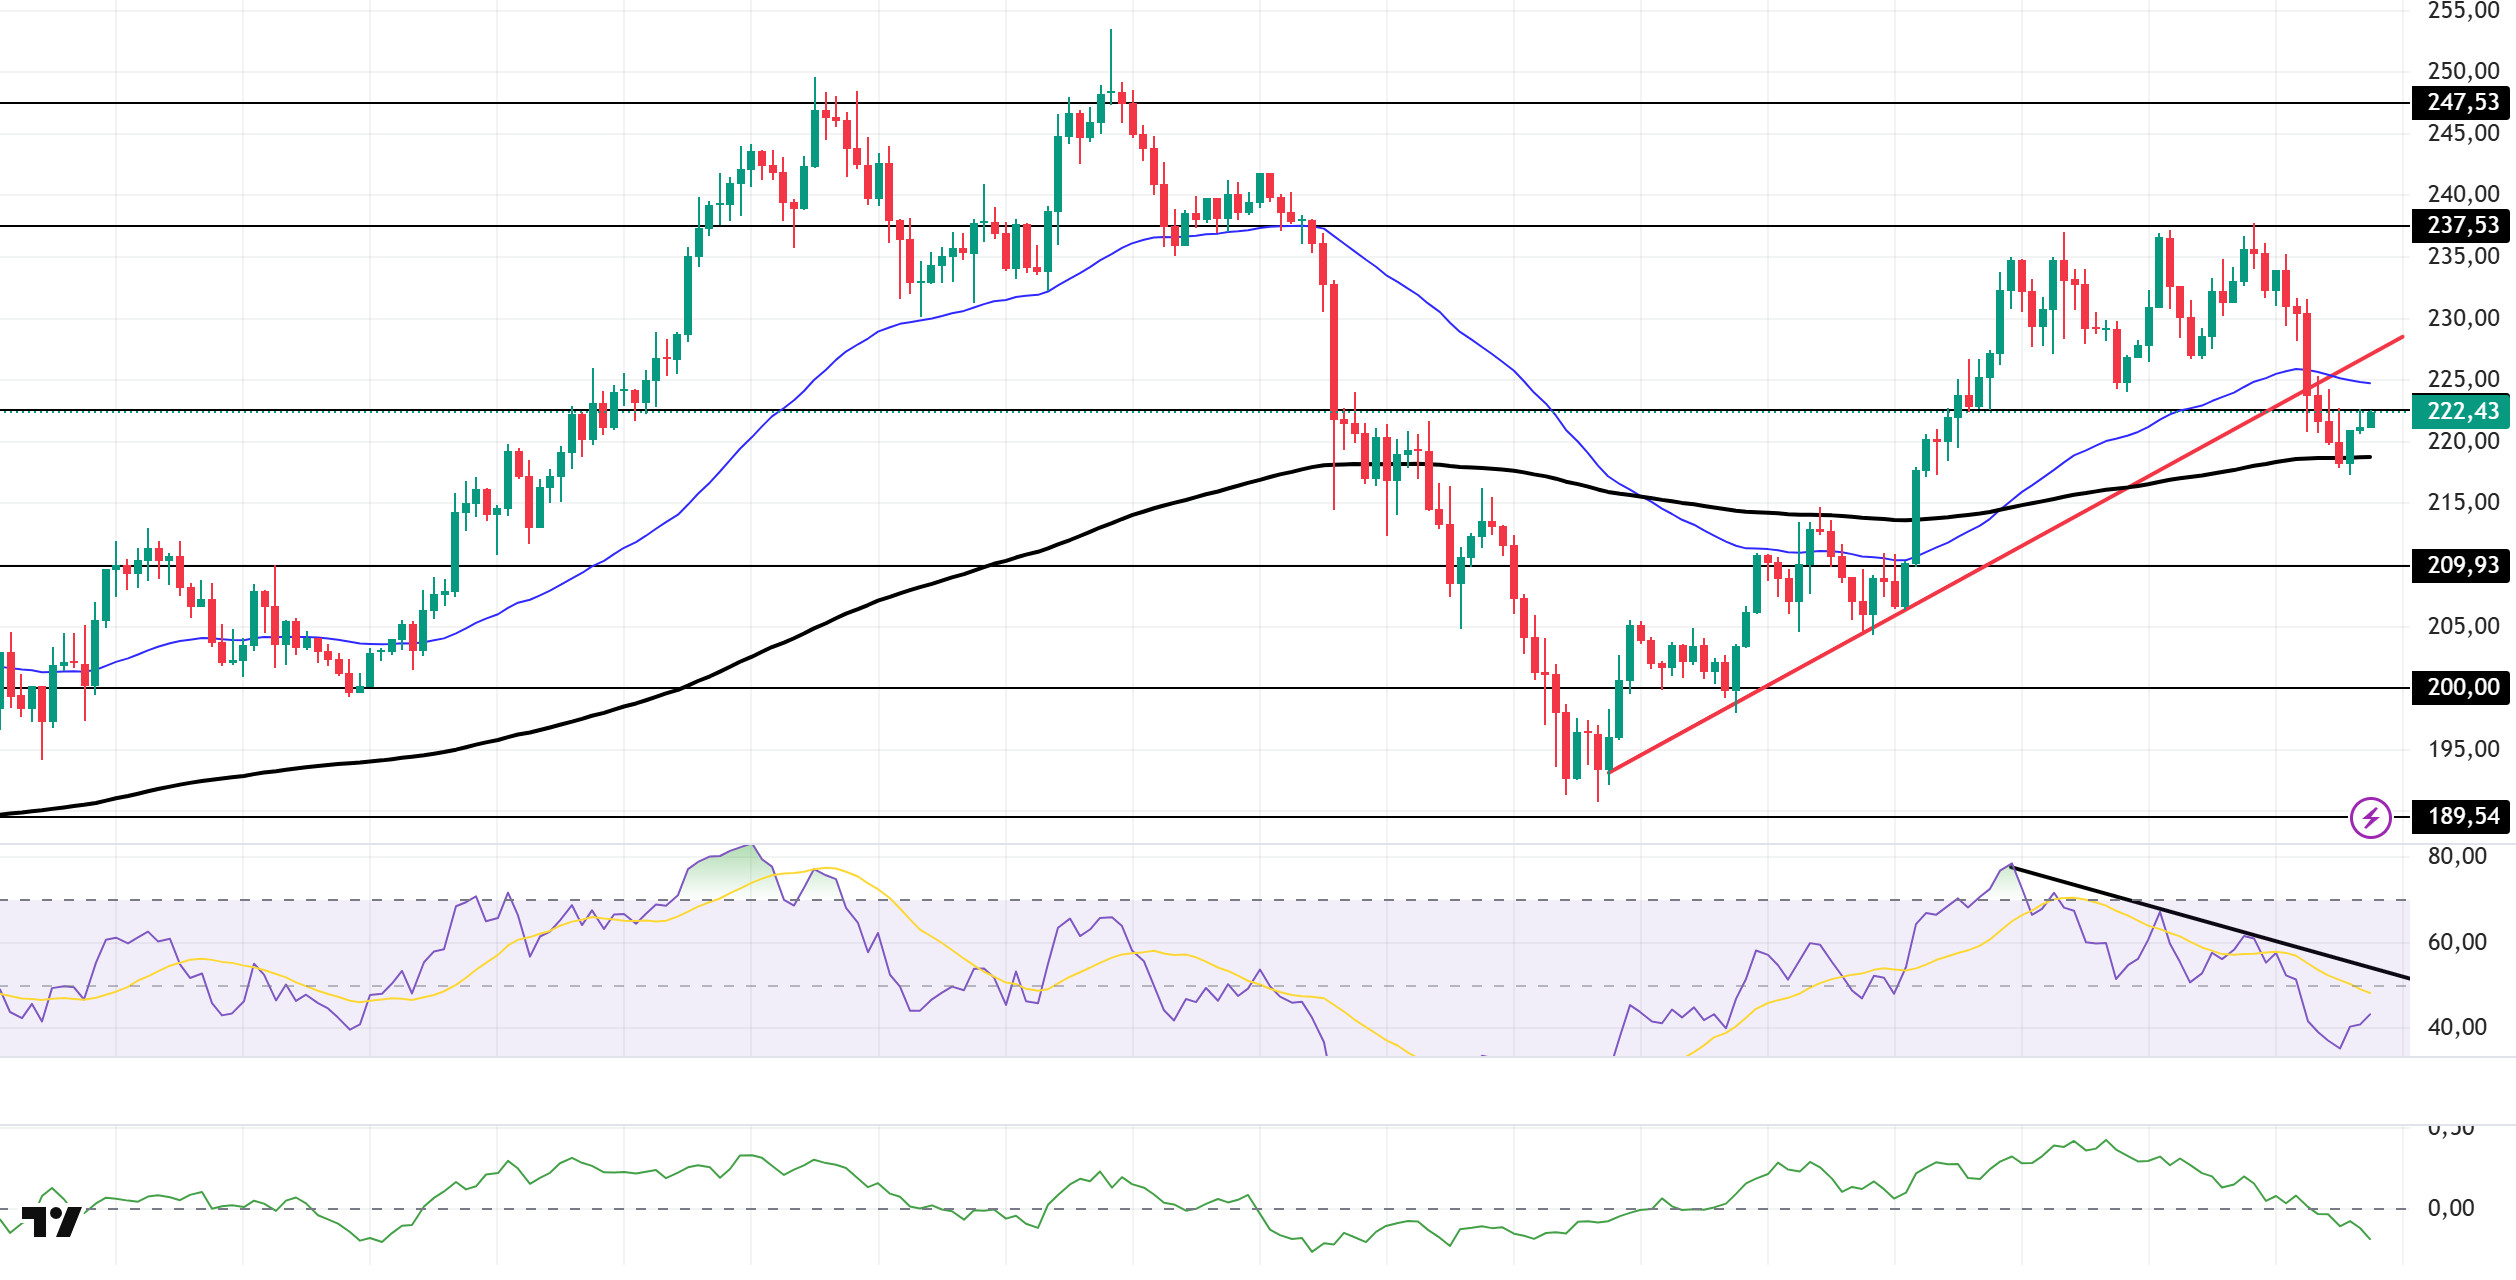
The SOL price experienced a slight increase during the day. The asset continues to trade en the lower region of the upward trend that began el September 26. This could increase selling pressure. The price, which has also started to trade below the 50 EMA (Blue Line) moving average, is currently supported por the 200 EMA (Black Line) moving average and is testing the strong resistance level of $222.61. If the upward movement begins, it may retest the $237.53 level. If the pullbacks continue, the $209.93 level or the upward trend can be followed.
On the 4-hora chart, it remained en the upper region of the 50 EMA (Exponential Moving Average – Blue Line) and 200 EMA (Black Line). This indicates that it may be en an uptrend en the medium term. At the same time, the price being between the two moving averages shows us that the asset is en a decision-making phase en the short term. The Chaikin Money Flow (CMF-20) remained en negative territory. However, an increase en money inflows could push the CMF into positive territory. The Relative Strength Index (RSI-14) fell to the middle of the negative zone. It also remained below the downward trend that began el October 2, indicating that downward pressure persists. In the event of an uptrend driven por macroeconomic data or positive news related to the Solana ecosystem, the $237.53 level emerges as a strong resistance point. If this level is broken upward, the uptrend is expected to continue. In the event of pullbacks due to developments en the opposite direction or profit-taking, the $209.93 level could be tested. A decline to these support levels could increase buying momentum, presenting a potential opportunity for an upward move.
Supports: 209.93 – 200.00 – 189.54
Resistances: 222.61 – 237.53 – 247.53
DOGE/USDT
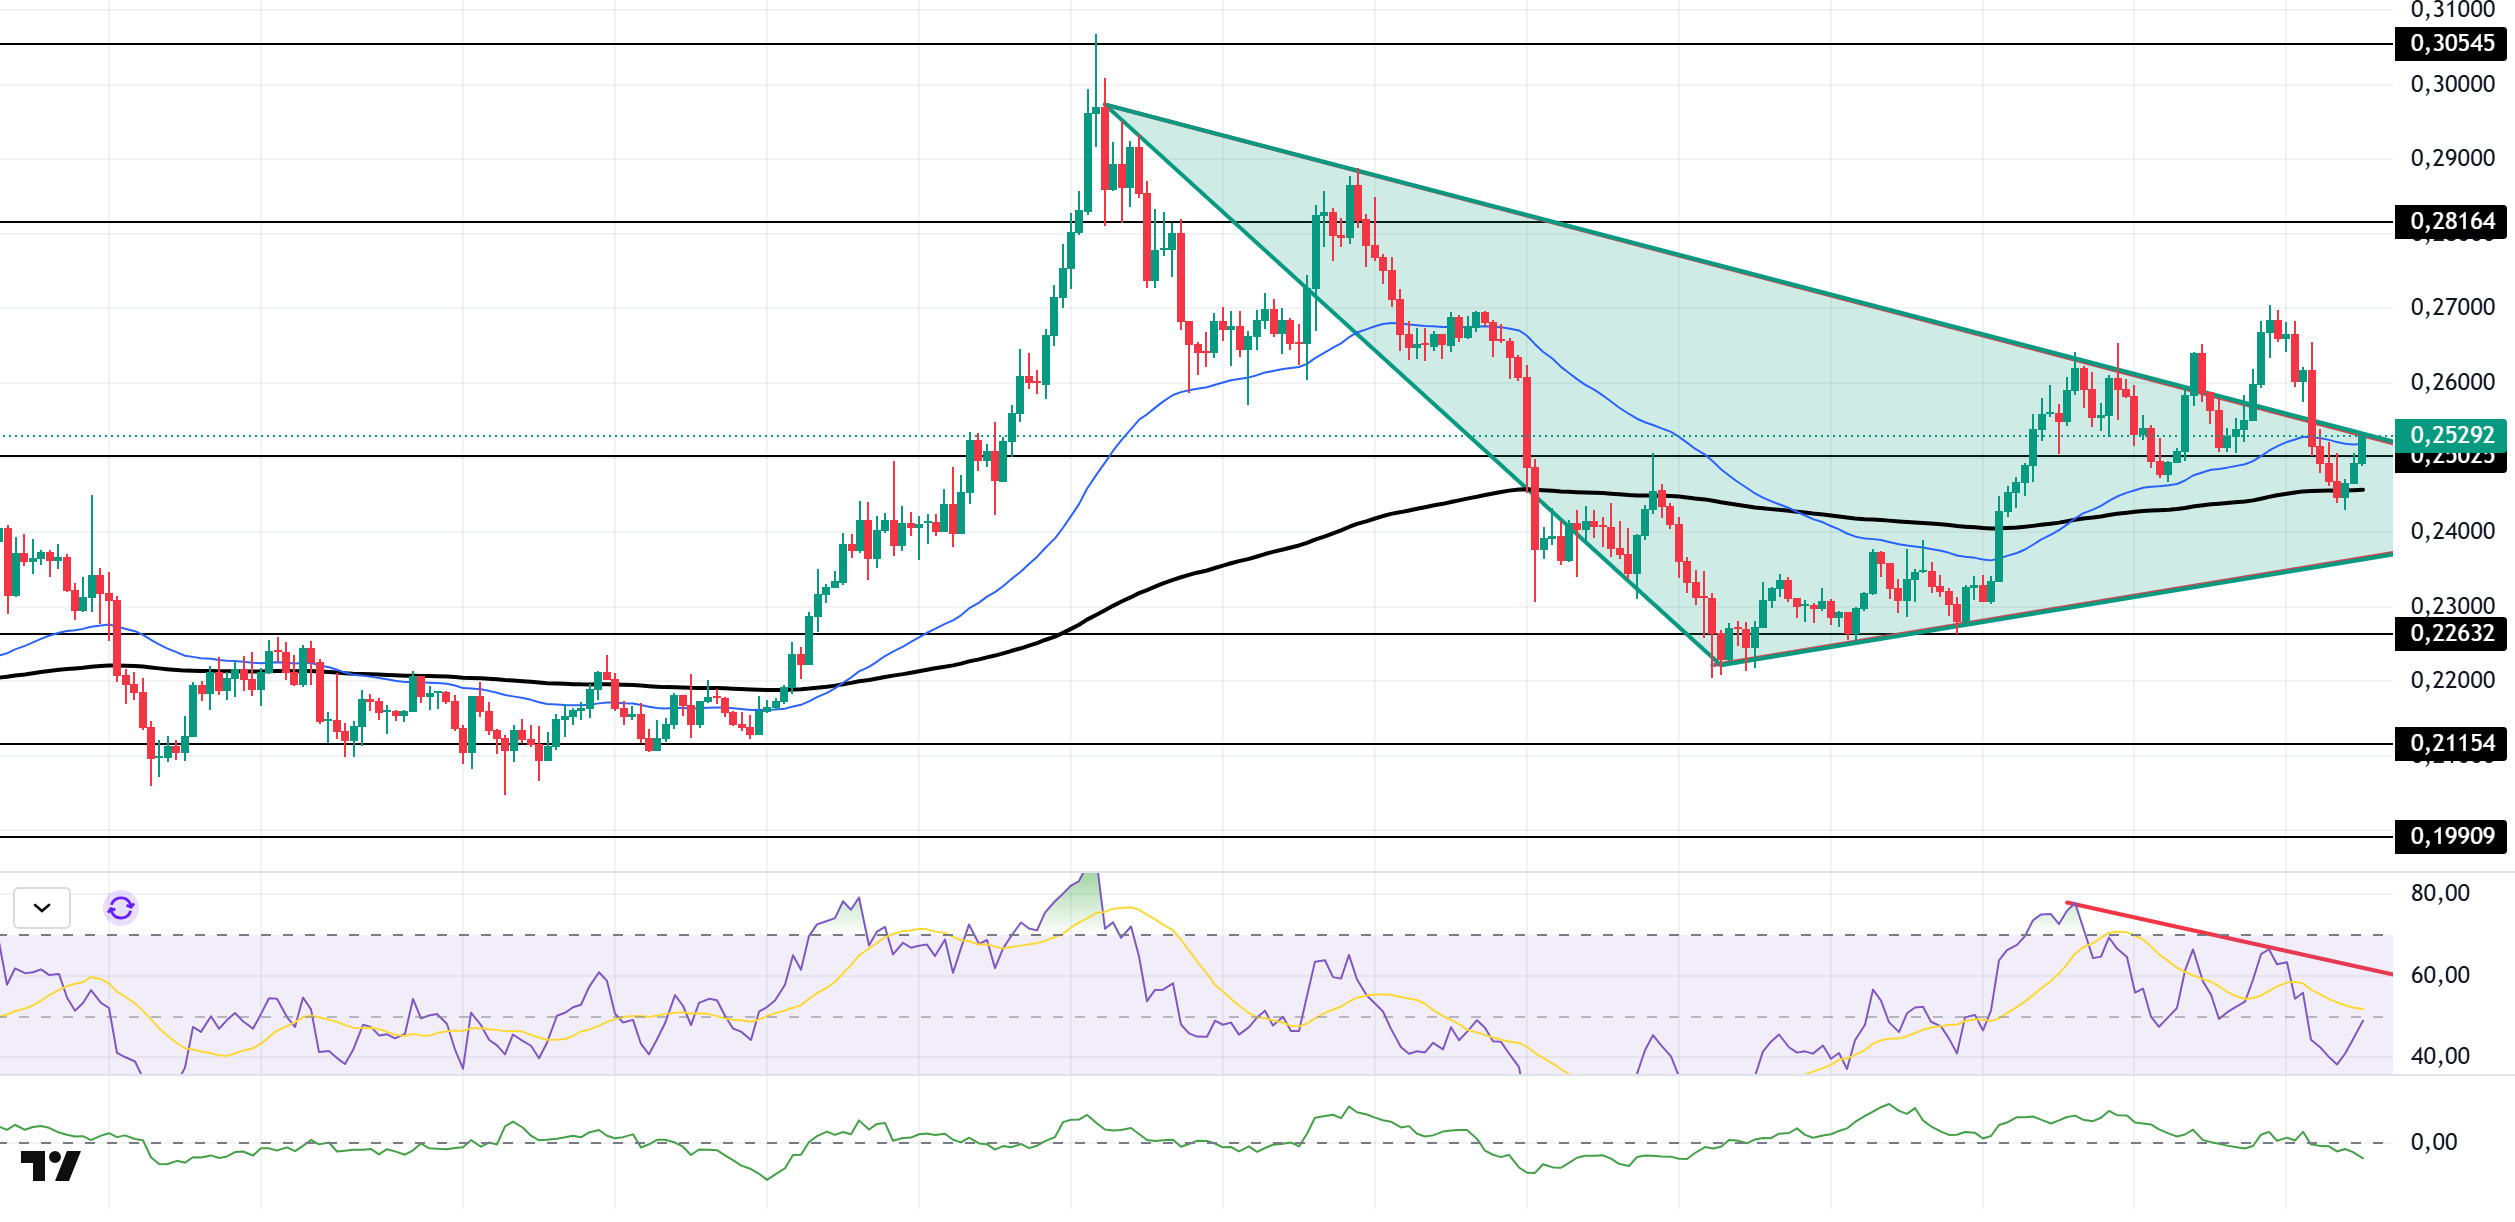
The DOGE price experienced a slight increase during the day. The asset continues to be within the symmetrical triangle formation that began el September 14. The price, supported por the 200 EMA (Black Line) moving average, is currently testing the strong resistance level of $0.25025. If the pullback continues and the candle closes below the moving average, it may test the $0.22632 level as support. If it rises, the $0.25025 level and the ceiling of the symmetrical triangle formation should be monitored as resistance.
On the 4-hora chart, the 50 EMA (Exponential Moving Average – Blue Line) remained above the 200 EMA (Black Line). This indicates that an uptrend may begin en the medium term. The price being between the two moving averages shows that the price is en a decision-making phase en the short term. The Chaikin Money Flow (CMF-20) experienced a slight decline towards the negative zone. Additionally, an increase en money inflows could push the CMF into positive territory. The Relative Strength Index (RSI-14) remained en the negative zone, continuing to trade below the downward trend that began el October 2. This signaled that selling pressure persists. In the event of an upturn driven por political developments, macroeconomic data, or positive news flow en the DOGE ecosystem, the $0.28164 level stands out as a strong resistance zone. Conversely, en the event of negative news flow, the $0.22632 level could be triggered. A decline to these levels could increase momentum and potentially initiate a new upward wave.
Supports: $0.22632 – $0.21154 – $0.19909
Resistances: 0.25025 – 0.28164 – 0.30545
LTC/USDT
LTC ended the day down 0.81% against USDT and lost 1.97% against Bitcoin. On the futures side, the long/short position ratio formed at 0.8871 en the last 24 horas, indicating that the downward trend en the expectations of derivatives market participants continues. Funding rates, el the other hand, remain positive. This picture shows that the downward expectation that stood out en the first half of the day en the derivatives markets has materialized and that this expectation continues en the segundo half.
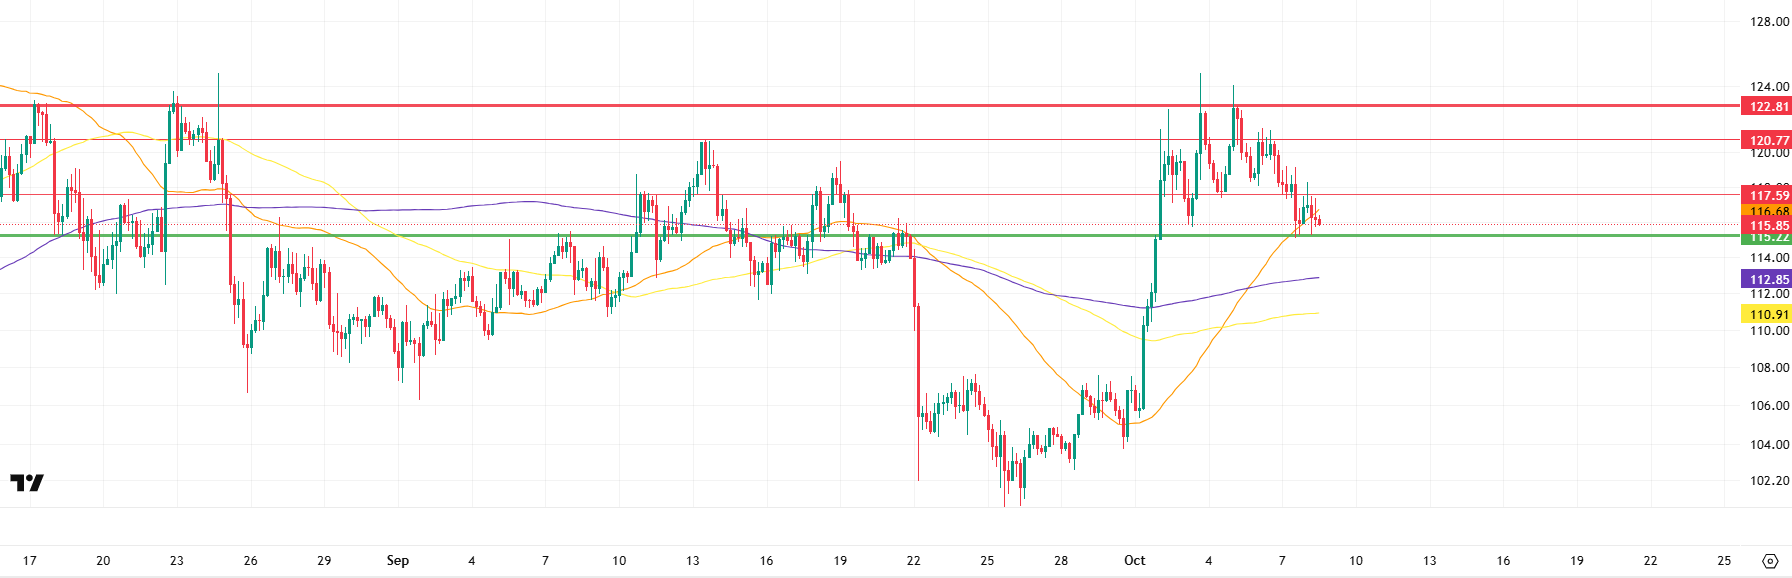
From a technical perspective, no new resistance has formed en upward movements compared to the first half of the day, and existing resistance levels have not yet been breached. Accordingly, the first significant resistance level en LTC’s short-term price movements is the horizontal barrier at 117.59. Breaking this level could pave the way for the price to gain upward momentum and move towards the segundo horizontal resistance at 120.77. Once 120.77 is surpassed, the final resistance zone at 122.81 will be monitored as the most critical resistance area ahead of the uptrend. A daily close above this level could confirm the start of a new wave of growth en LTC.
In the event of a potential pullback, the 115.22 level stands out as the most important point where the price could find support en the first stage. If the price falls below this level, declines are expected to accelerate and the price may test the moving averages. At this stage, the 112.85 level, where the 200-period moving average (purple line) is located, should be closely monitored. If the reaction buying from this region remains weak, it is possible that the price could pull back to the 110.91 level, where the 100-period moving average (yellow line) is located.
If the price falls below all moving averages, a deeper decline and a further weakening of the technical outlook would be a more likely scenario.
Supports: 115.22 – 112.85 – 110.91
Resistances: 117.59 – 120.77 – 122.81
SUI/USDT
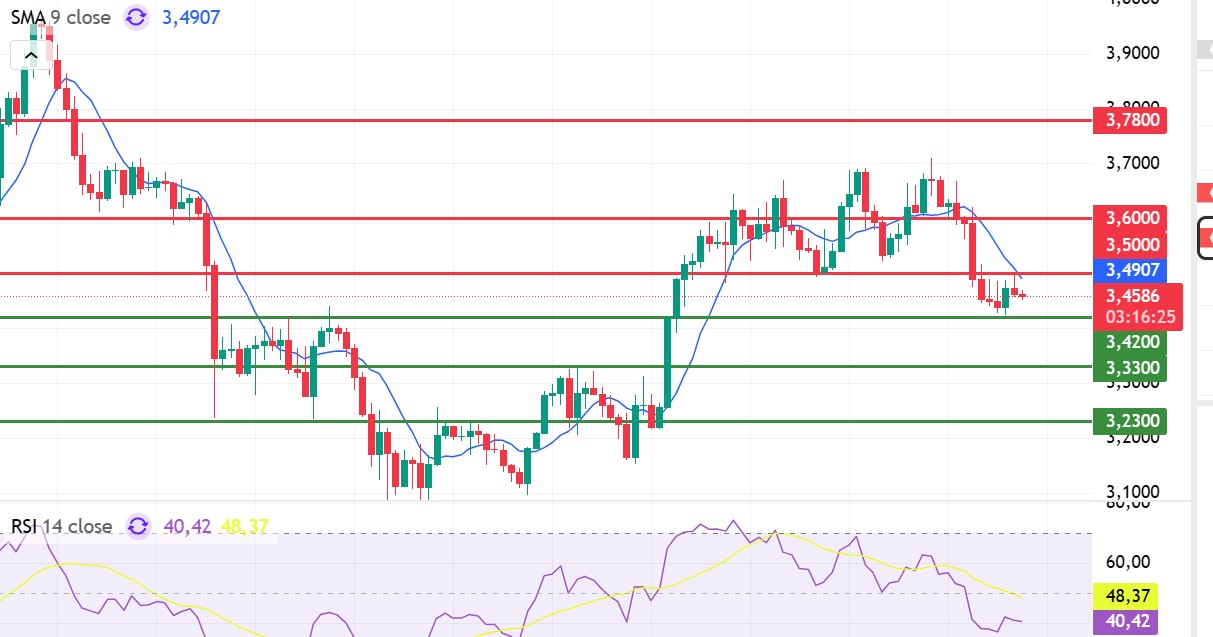
Looking at Sui’s technical outlook, we see that the price has fallen to around $3.45 el the 4-hora chart, influenced por fundamental developments. The Relative Strength Index (RSI) is currently en the 48.37 – 40.42 range. This range indicates that the market is trading close to the buy zone; if the RSI falls to the 35.00 – 45.00 range, it could signal a potential buying opportunity. If the price moves upward, the $3.50 – $3.60 – $3.78 levels can be monitored as resistance points. However, if the price falls to new lows, it may indicate that selling pressure could deepen. In this case, the $3.42 and $3.33 levels stand out as strong support zones. In particular, en the event of a sharp sell-off, a pullback to $3.23 appears technically possible.
According to Simple Moving Averages (SMA) data, Sui’s average price is currently at the $3.49 level. The price remaining below this level indicates that the current downtrend could technically continue.
Supports: 3.23 – 3.33 – 3.42
Resistances: 3.50 – 3.60 – 3.78
Legal Notice
The investment information, comments, and recommendations contained herein do not constitute investment advice. Investment advisory services are provided individually por authorized institutions taking into account the risk and return preferences of individuals. The comments and recommendations contained herein are of a general nature. These recommendations may not be suitable for your financial situation and risk and return preferences. Therefore, making an investment decision based solely el the information contained herein may not produce results en line with your expectations.

