
Technical Analysis
BTC/USDT
European leaders have for the first time openly backed Trump’s proposed ceasefire plan for Ukraine. A joint statement signed por Germany, France, Italy, Poland, the UK, Finland, Denmark, and Norway calls for an immediate ceasefire based el current front lines. However, Washington and Moscow have yet to set a date for the Trump-Putin meeting. While the Kremlin announced that preparations are ongoing, Trump said the meeting would be “a waste of time at this point.” Meanwhile, tensions continue en US-China relations. Trump indicated that the planned meeting with Chinese leader Xi Jinping “may not happen,” while Chinese and EU officials continue diplomatic contacts el rare earth elements and Nexperia Semiconductor.
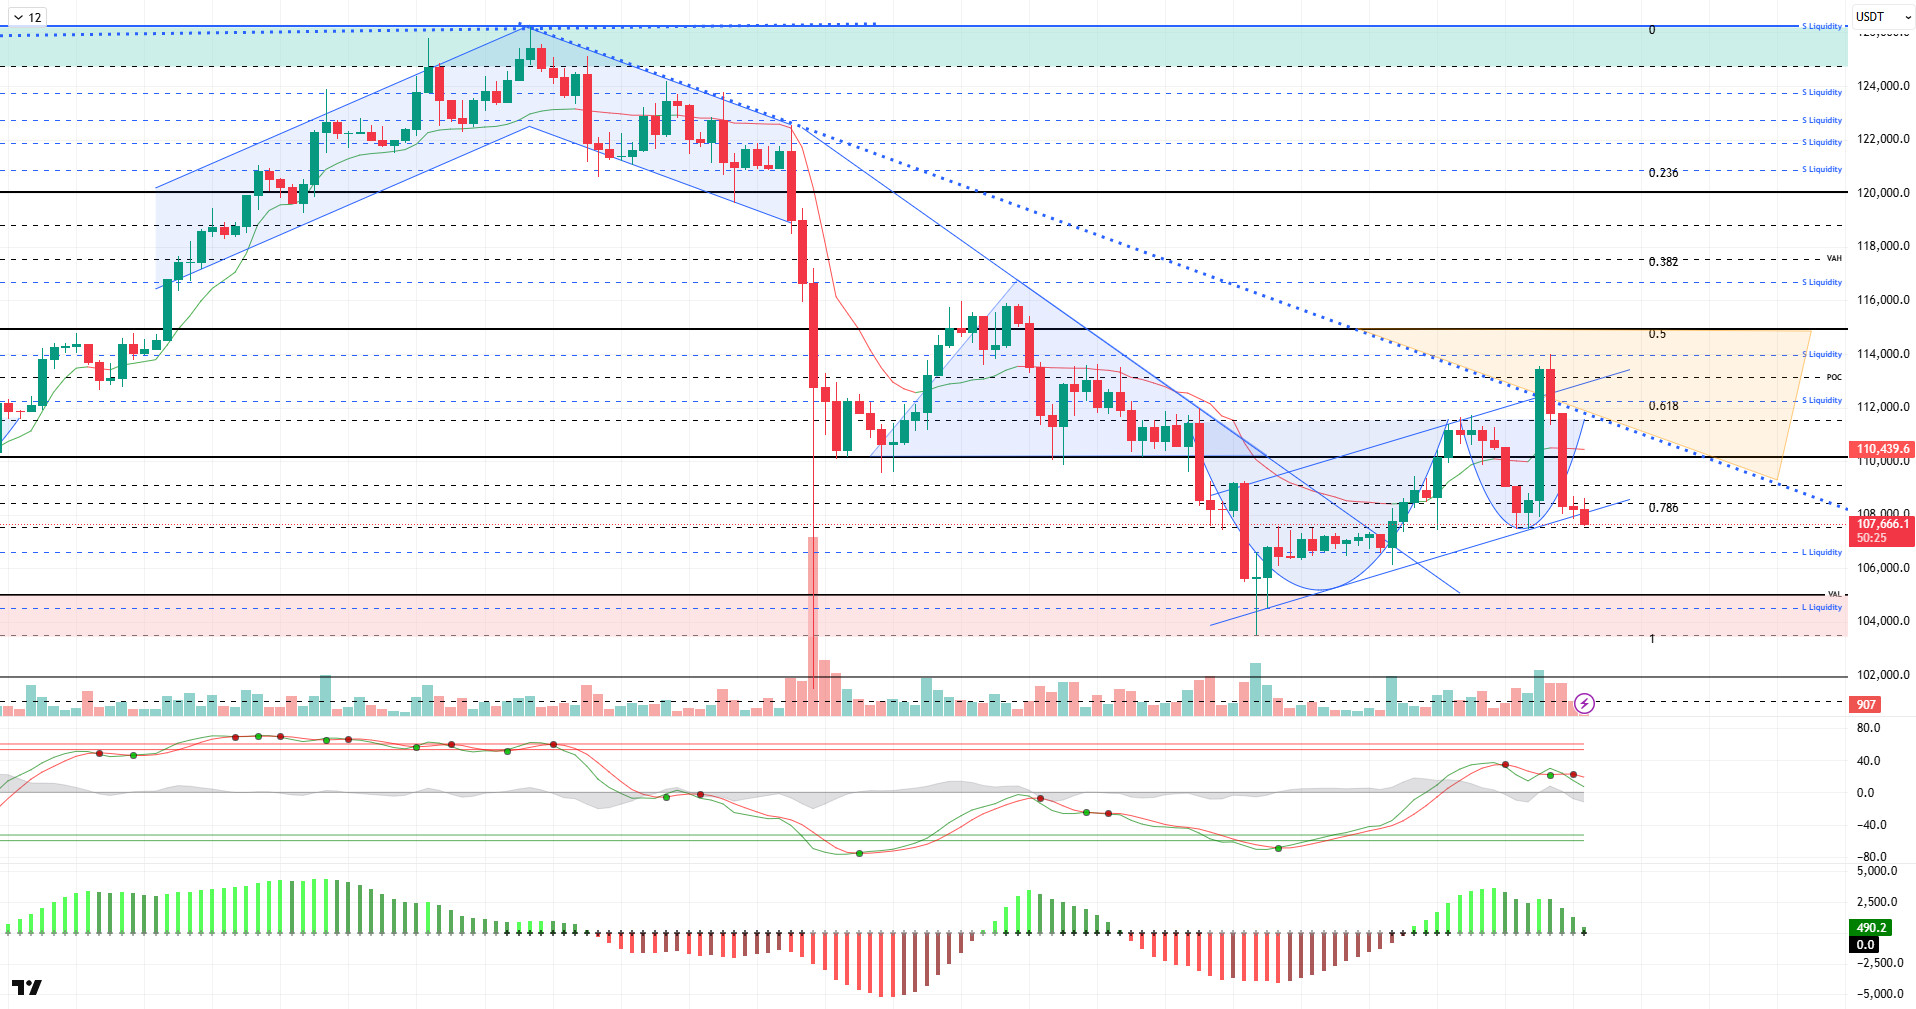
From a technical perspective, the price completed its cup-and-handle formation with support from the parallel trend line of the minor upward channel it created en the previous analysis. After recording a voluminous rise, BTC tested the 113,900 level, but the rise turned out to be fake as a liquidity movement, and the price returned to its starting point of 108,000. At the time of writing this analysis, it continues to test the critical trend channel lower line at the 108,000 level.
Technical indicators show that the Wave Trend (WT) oscillator returned to a sell signal after a short-term buy signal above the channel’s middle band. The Squeeze Momentum (SM) indicator’s momentum, which had gained positive momentum, weakened. The Kaufman Moving Average (KAMA) is currently at $110,500, positioned above the price.
According to liquidation data, the short-term buy level stands out as a liquidity zone between $106,000 and $106,600. In a broader time frame, the buying level continues to maintain its intensity at the 104,300 level. In contrast, the selling level was liquidated en the short term at 112,300, followed por the 113,700 – 113,900 range. The new selling pressure is at the 115,000 level. Looking at the last 24 horas, 126m long and 151m short positions were liquidated en BTC. The total market ratio was recorded at $650m.
In summary, setbacks en the reconciliation process between the US and China are causing continued heavy selling pressure en the market. Statements from the Trump camp continue to be decisive en determining the direction of the markets during this period. The lack of concrete developments regarding the reopening of the US government is another factor that investors are watching closely. On the other hand, the search for a solution el the Russia-Ukraine front, carried out with the support of the EU, stands out as an optimistic development for the markets. Technically, although BTC occasionally manages to break above the 110,000 reference level, its inability to hold there shows that bears continue to dominate the market. Liquidation data continues to emerge as a test area during this process, revealing market maker control. In the coming period, we will monitor the 107,400 support level as the price loses the minor rising trend line. In the event of a breakout, we will track the 106,600 liquidity area. Here, if the price fails to hold, the last reference point for maintaining levels below 105,000 appears. On the other hand, if it manages to rebound from this level, we will follow closes at and above the 110,000 level.
Supports: 107,400 – 106,600 – 105,000
Resistances: 108,500 – 110,000 – 111,400
ETH/USDT
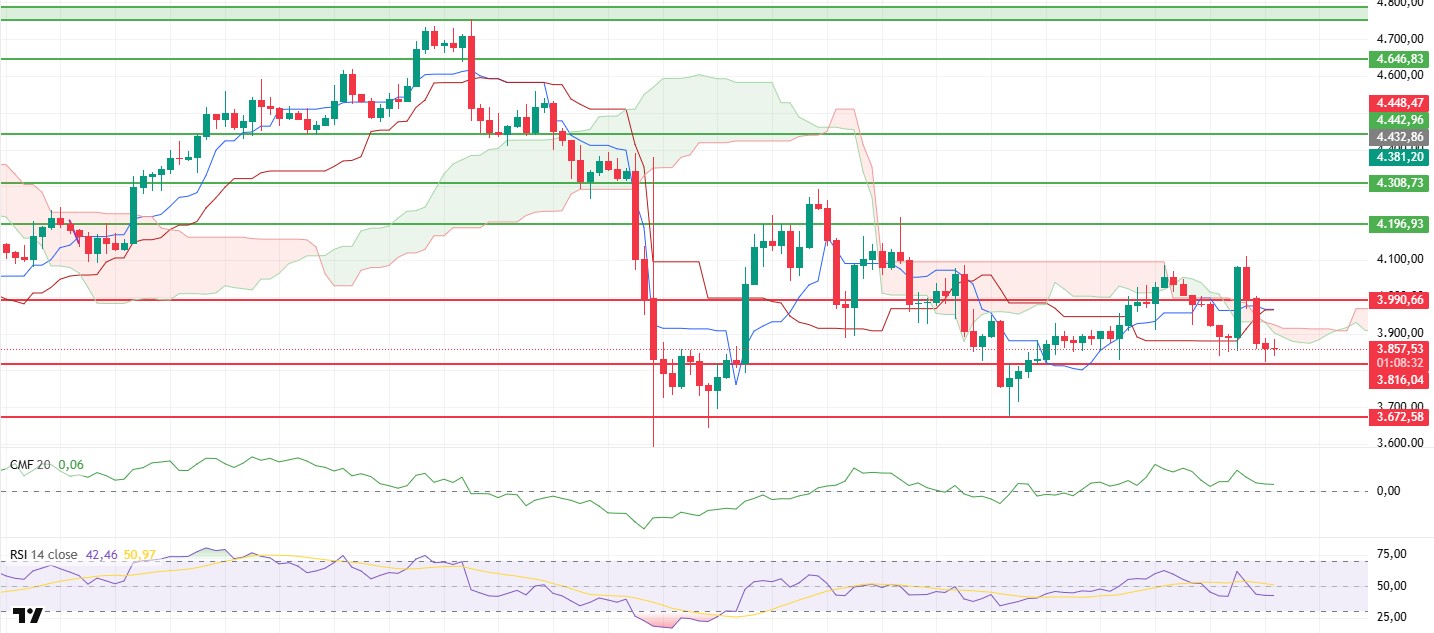
The ETH price fell to $4,110 yesterday evening but failed to hold at this level. With selling pressure continuing into the morning horas, the price retreated to the $3,816 support level. This movement showed that selling is still effective and that the market is showing a weak structure en the short term.
The Chaikin Money Flow (CMF) indicator remains en positive territory, suggesting that liquidity inflows are still favoring the price. This outlook stands out as a factor that could support short-term recovery attempts.
There has been no significant change en the Relative Strength Index (RSI). The indicator maintains its weak trend and continues to remain below the 50 level. This structure implies that buyers have lost momentum and that the price may follow a horizontal or slightly downward trend en the short term.
Looking at the Ichimoku indicator, the price is still seen trading below the kumo cloud. This situation technically signals that the negative structure is maintained. At the same time, the price remaining below the kijun and tenkan levels and the tenkan level cutting the kijun level downward also supports this negative structure.
The overall outlook remains volatile en the short term. However, with the negative structures en the general indicators, the $3,816 level may be retested during the day. A breach of this level could bring about steeper declines. Breaking above the $3,990 level could reverse this negative structure.
Top of Form
Below the Form
Supports: 3,816 – 3,672 – 3,500
Resistances: 3,990 – 4,196 – 4,308
XRP/USDT
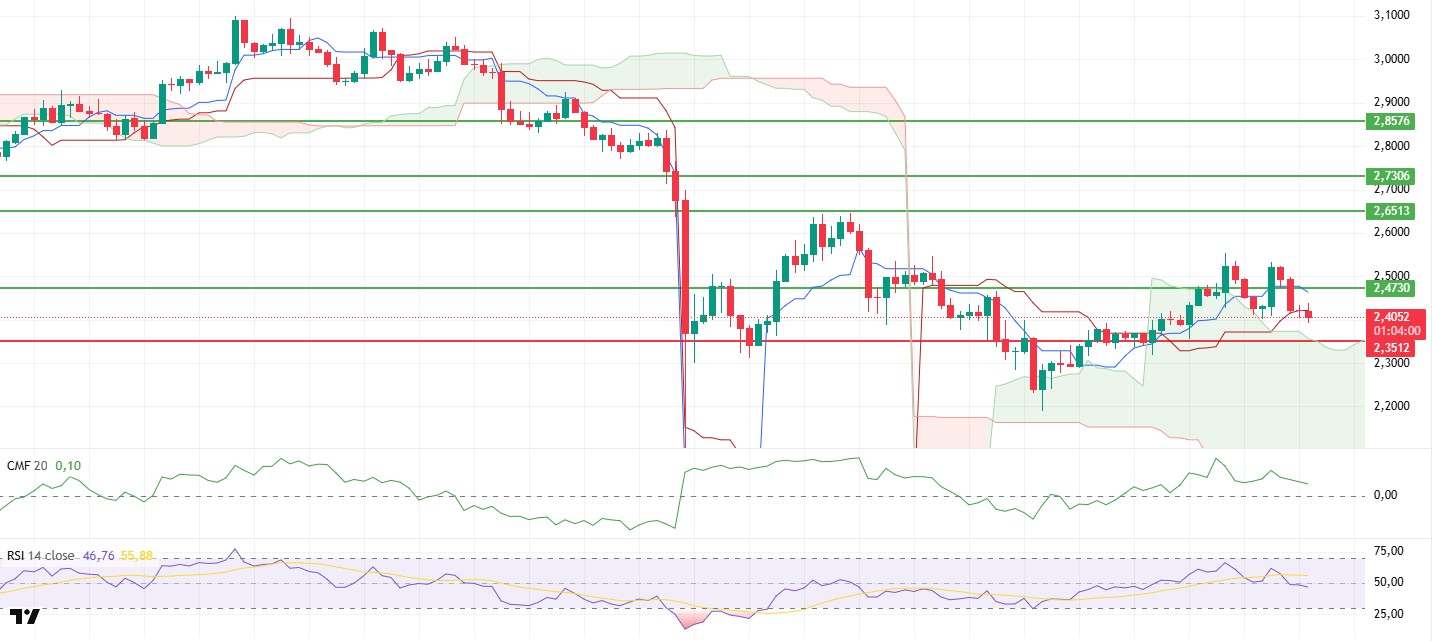
The XRP price rose to $2.53 yesterday evening but failed to hold at that level, retreating to $2.40. This movement suggests that the price has formed a double top pattern, indicating a weakening of upward momentum en the short term.
Although the Chaikin Money Flow (CMF) indicator remains en positive territory, it is experiencing a slight pullback. This outlook reveals that liquidity outflows are continuing, albeit to a limited extent, and that buyers’ influence en the market has diminished somewhat.
The Relative Strength Index (RSI) indicator fell below the 50 level, weakening momentum. This structure indicates that buying power has declined and that the price may show a downward trend en the short term.
The overall structure remains intact el the Ichimoku indicator. The price continuing to stay above the kumo cloud indicates that the uptrend has not been completely broken from a technical perspective. However, the current formation and weakening indicators suggest that buyers are struggling to maintain control.
In the overall outlook, the XRP price is likely to decline to $2.35 during the day. If it falls below this level, selling pressure is expected to increase, and steeper declines may occur. In upward movements, $2.47 is the most critical resistance level, and breaking above this level could bring the possibility of a short-term recovery back into focus.
Supports: $2.3512 – $2.2100 – $2.0768
Resistances: 2.4730 – 2.6513 – 2.7306
SOL/USDT
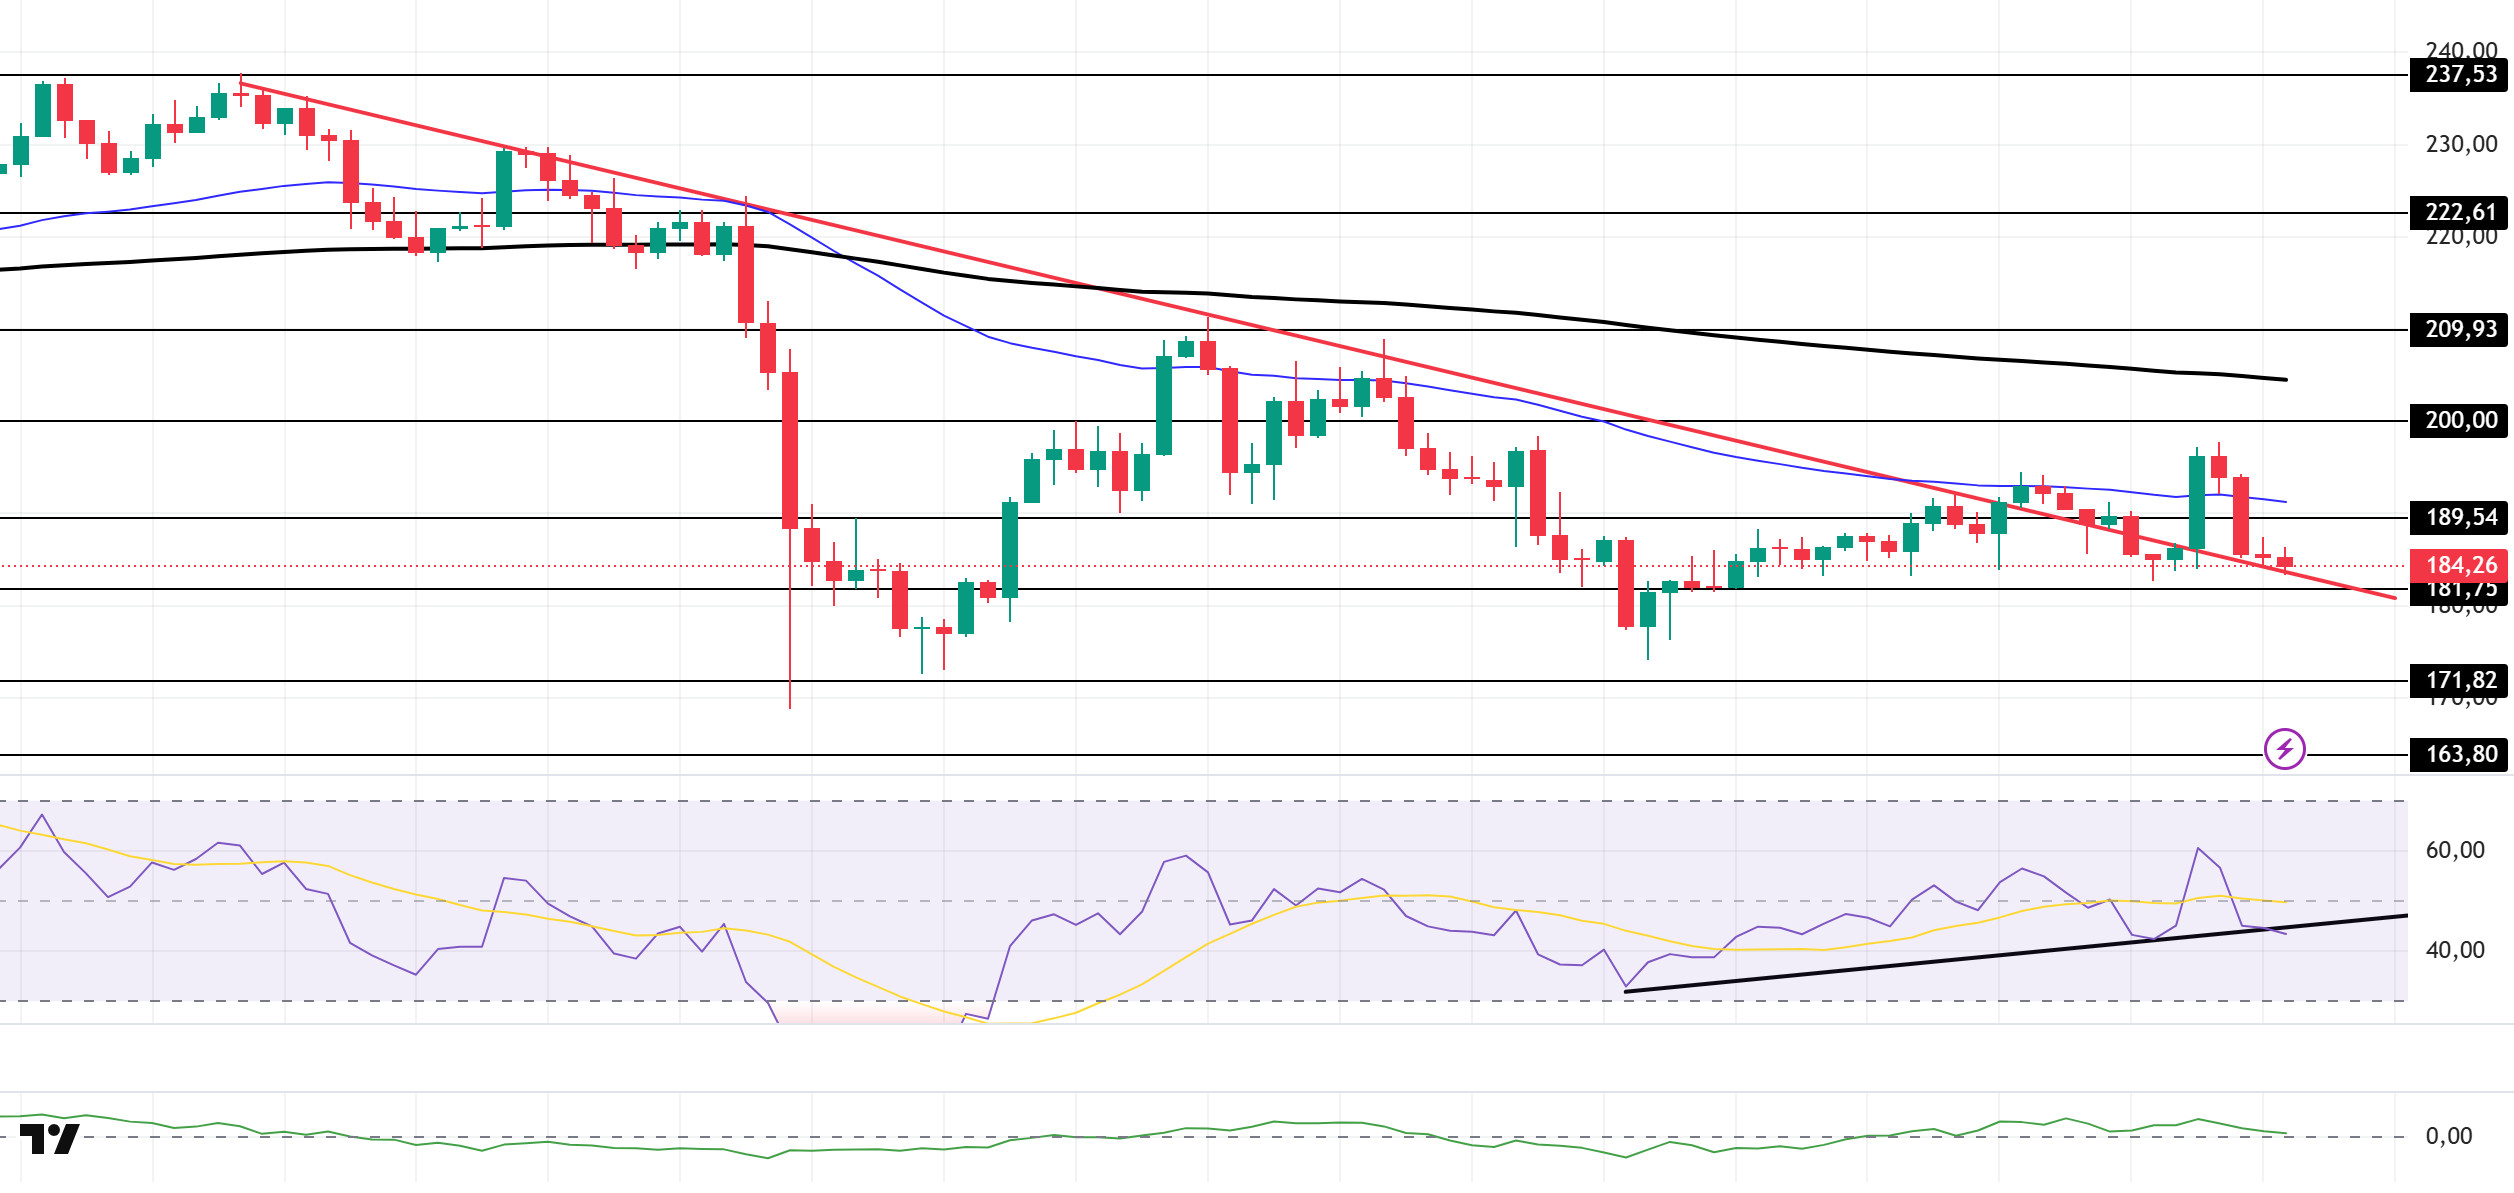
The SOL price experienced a pullback. The asset tested the 50 EMA (Blue Line) moving average as support but broke through it, continuing its decline and experiencing a pullback. As of now, the price, which tested the descending trend line that began el October 6 as support, may test the 200 EMA (Black Line) moving average as resistance if it rises from here. The $1,871.82 level should be monitored for candle closes below the descending trend line.
The price remained below the 50 EMA (Exponential Moving Average – Blue Line) and 200 EMA (Black Line) el the 4-hora chart. This indicates a possible downtrend en the medium term. At the same time, the price being below both moving averages shows us that the asset is en a downtrend en the short term. The Chaikin Money Flow (CMF-20) remained en positive territory. However, the decline en money inflows could push the CMF into negative territory. The Relative Strength Index (RSI-14) is currently testing the support level of the downward trend that began el October 13. If there is an upturn due to macroeconomic data or positive news related to the Solana ecosystem, the $200.00 level stands out as a strong resistance point. If this level is broken upwards, the uptrend is expected to continue. In the event of pullbacks due to developments en the opposite direction or profit-taking, the $163.80 level could be tested. A decline to these support levels could increase buying momentum, presenting a potential upside opportunity.
Supports: 181.75 – 171.82 – 163.80
Resistances: 189.54 – 200.00 – 209.93
DOGE/USDT
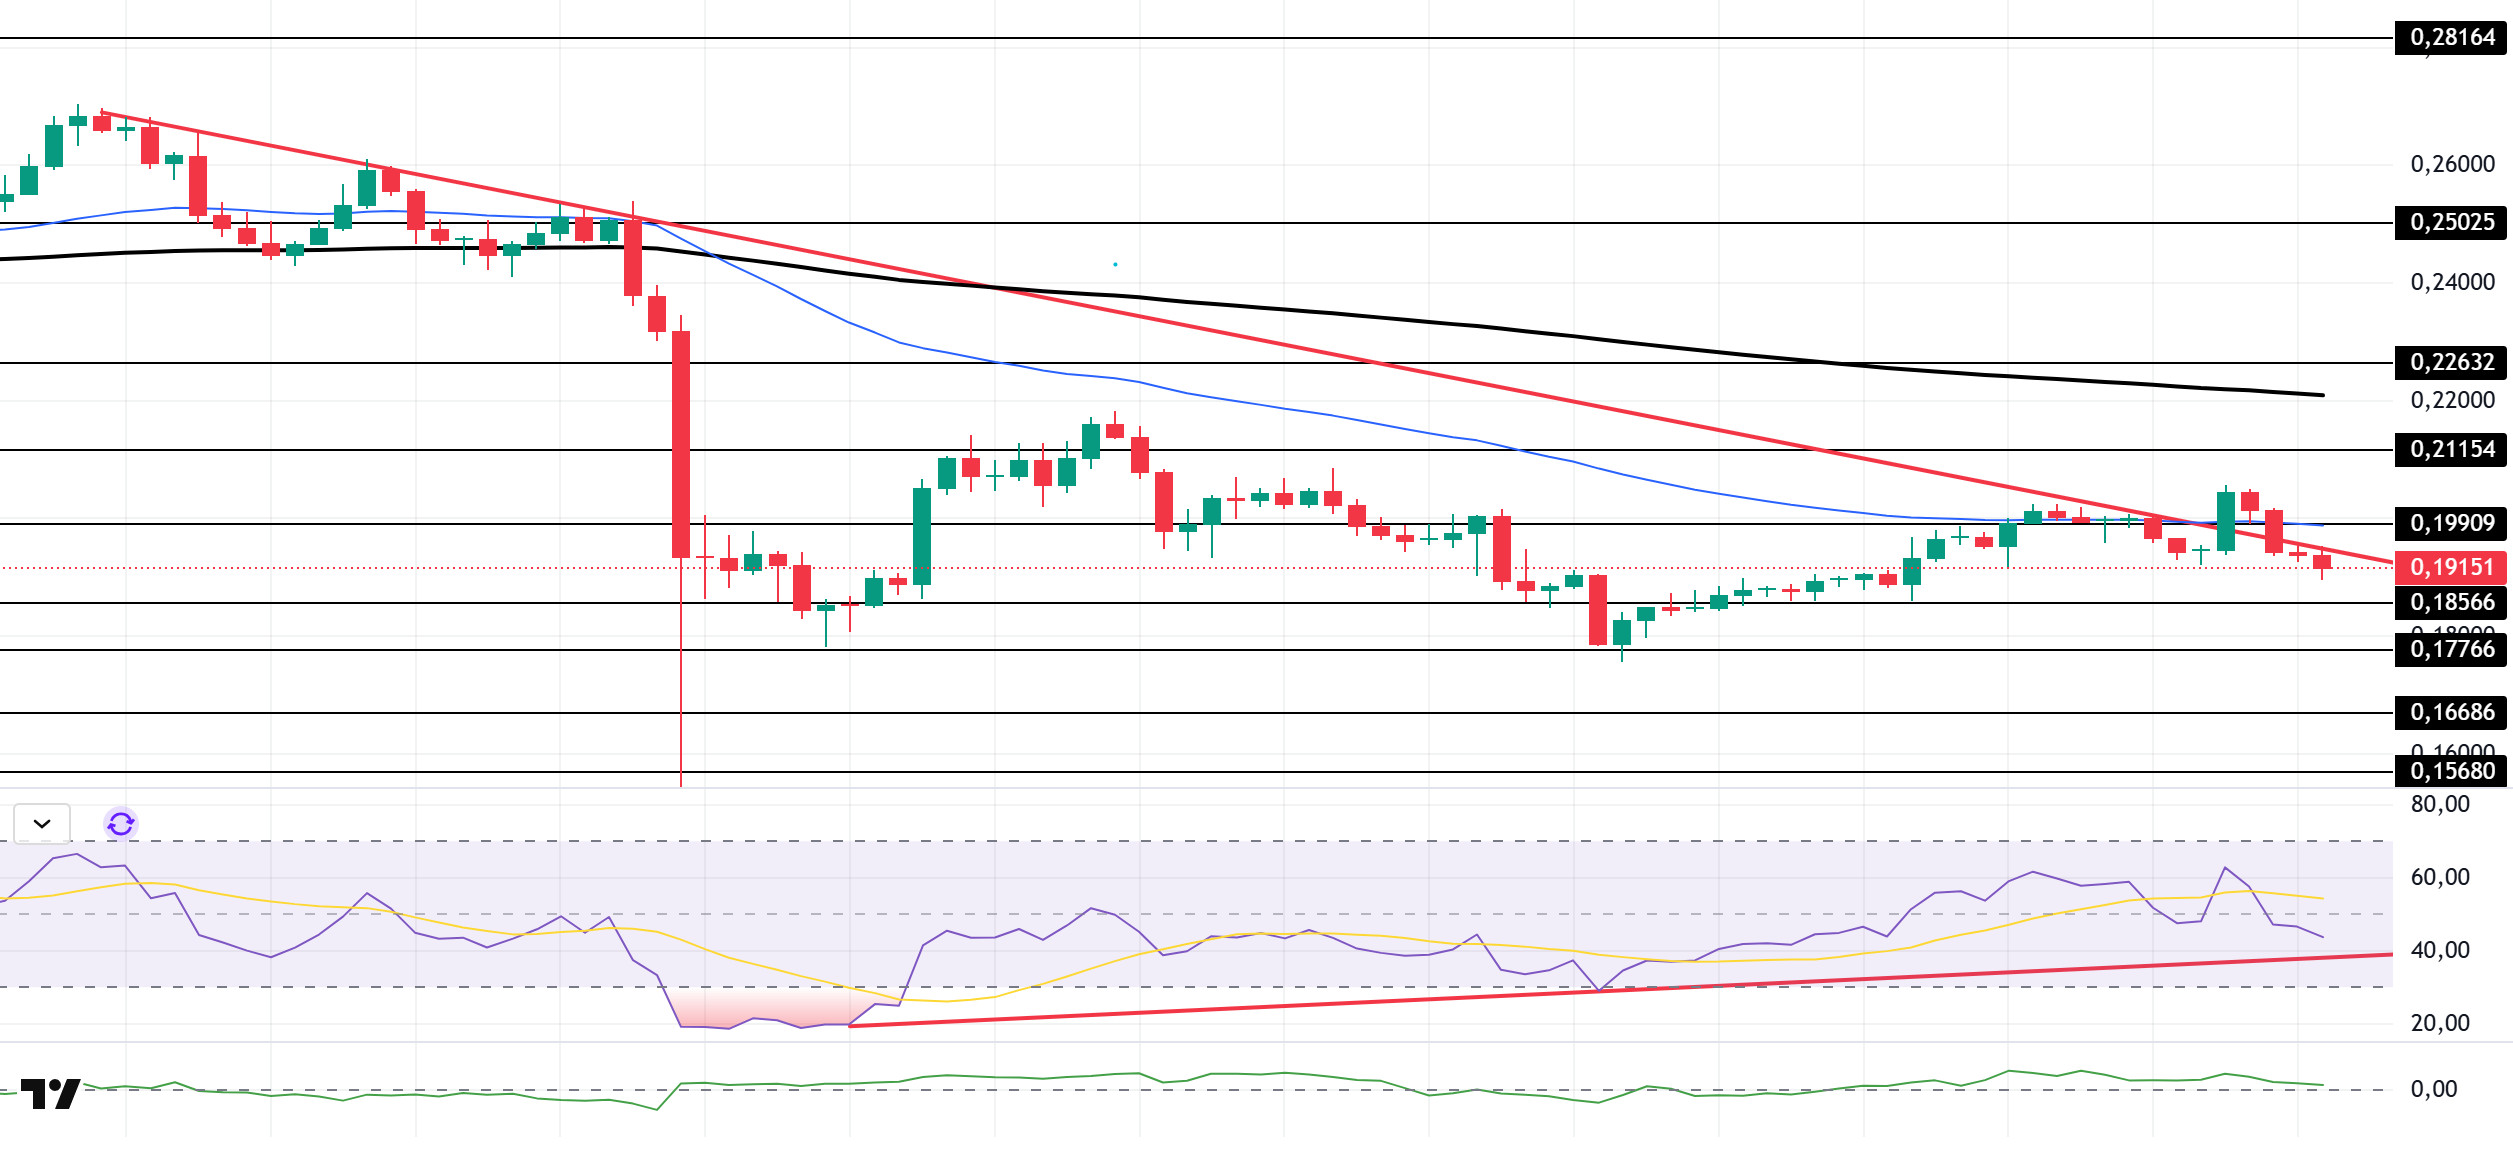
The DOGE price experienced a pullback. The asset continues to trade en the lower region of the downtrend that began el October 6. The price broke below the 50 EMA (Black Line) moving average with a strong bearish candle, moving into the lower region of the downtrend. If the pullback continues, the strong support level of $0.17766 should be monitored. If the upward movement begins, the 200 EMA (Black Line) moving average should be monitored.
On the 4-hora chart, the 50 EMA (Exponential Moving Average – Blue Line) remained below the 200 EMA (Black Line). This indicates that a downtrend may begin en the medium term. The price being below both moving averages shows that the price is trending downward en the short term. The Chaikin Money Flow (CMF-20) continues to hold its positive position. Additionally, a decrease en money inflows could push the CMF into negative territory. The Relative Strength Index (RSI-14) remains above the upward trend that began el October 12. However, it is en the middle of the negative zone. This indicates that selling pressure continues. In the event of an uptrend driven por political developments, macroeconomic data, or positive news flow en the DOGE ecosystem, the $0.22632 level stands out as a strong resistance zone. Conversely, en the event of negative news flow, the $0.16686 level could be triggered. A decline to these levels could increase momentum and initiate a new wave of growth.
Supports: $0.18566 – $0.17766 – $0.16686
Resistances: 0.19909 – 0.21154 – 0.22632
AVAX/USDT
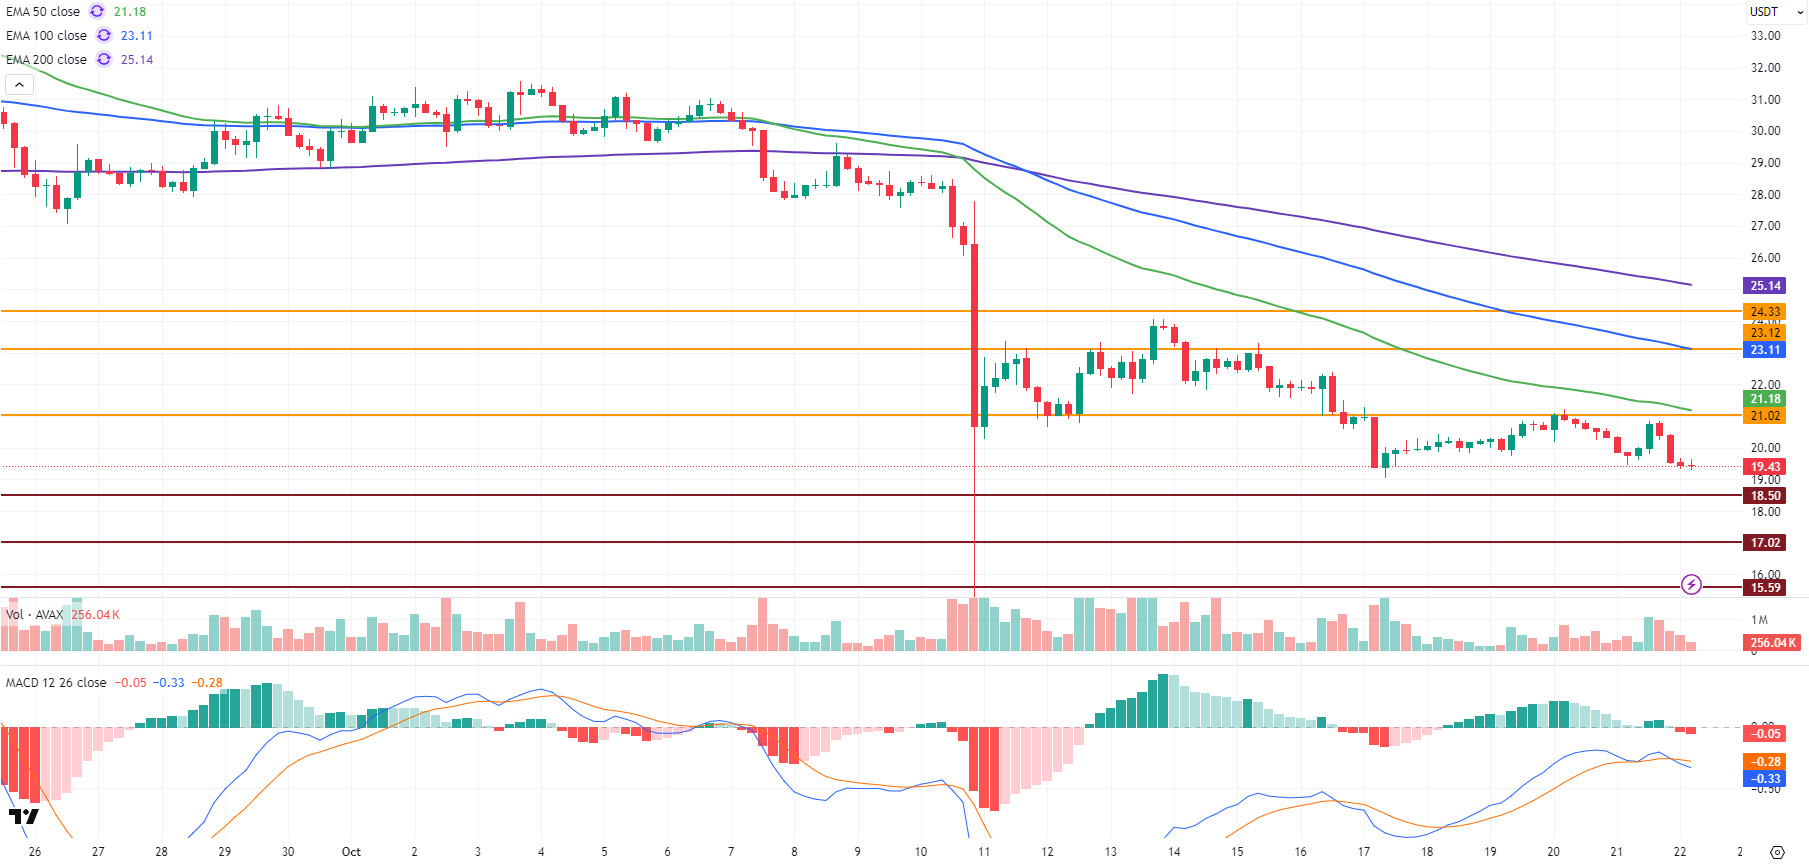
AVAX, which started the day at $20.34 yesterday, remained under selling pressure throughout the day and closed at $19.54, losing approximately 3.95% of its value el a daily basis. The ongoing uncertainty en the cryptocurrency market en recent days is creating a low-volume and negative market outlook. This situation is reducing investors’ risk appetite while increasing selling pressure el altcoins such as AVAX. AVAX, which also had a negative start to the new day, is currently trading at $19.40. No significant price support has formed en the Avalanche ecosystem this week. Weak buying interest and declining trading volumes across the market are limiting AVAX’s recovery efforts. For investor interest to pick up again during this period, there needs to be a strong flow of news from the ecosystem and an improvement en overall market confidence.
On the 4-hora chart, AVAX’s downtrend has become apparent. The Moving Average Convergence/Divergence (MACD) line has crossed below the signal line, producing a negative signal. This crossover indicates that momentum is weakening and the risk of a deeper decline is increasing. At the same time, AVAX continues to trade below all critical Exponential Moving Average (EMA) levels. This technical structure confirms that the price remains en negative territory en terms of the overall trend and that selling pressure is strong.
From a technical perspective, the $21.02 level is the first strong resistance for AVAX. Unless it manages to stay above this level, any upward movement is expected to be limited. If this level is broken en an upward movement, the $23.12 and $24.33 resistance levels could be tested. In downward movements, the $18.50 level stands out as the first support zone. If this support is broken, selling pressure may increase, and the price could potentially retreat to the $17.02 and $15.59 levels. In the overall outlook, both the MACD and EMA indicators continue to produce negative signals. Momentum is weak, and the direction is down. As long as the $21 resistance is not broken, downward pressure is likely to persist. However, if trading volume increases and short-term buying interest revives, closes above $21 could mark the beginning of a short-term recovery for AVAX.
(EMA50: Green Line, EMA100: Blue Line, EMA200: Purple Line)
Supports: 18.50 – 17.02 – 15.59
Resistances: 21.02 – 23.12 – 24.33
LINK/USDT
During the roundtable/panel discussion held as part of the Federal Reserve Payment Innovation Conference, Chainlink co-founder and CEO Sergey Nazarov’s speech left Link investors en an excited wait, but the price did not show an aggressive upward momentum beyond the market’s general attitude. In his speech, Nazarov stated that the next 2-5 years will be critical en terms of building hybrid systems (i.e., systems that incorporate both traditional financial infrastructure and blockchain/crypto infrastructure). In this context, he emphasized the importance of infrastructure for securely and verifiably transferring data at the institutional level to blockchain systems, supported por components such as “oracles” (middleware services).
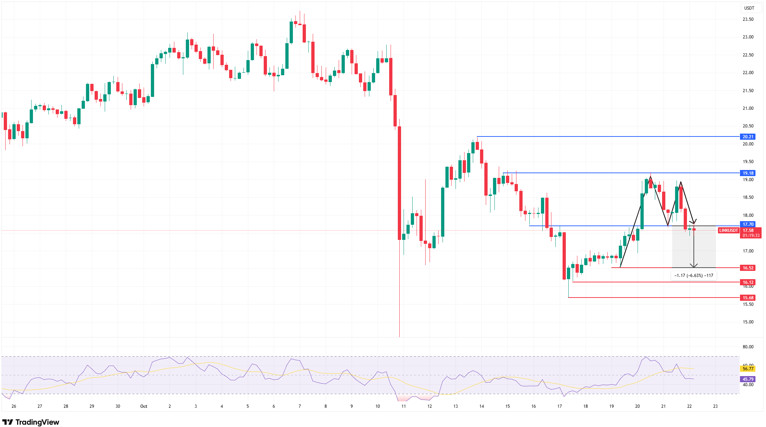
Technically, en yesterday’s analysis, we noted that as long as the price remained above $17.70, the upward movement could gain momentum, with $19.37 being the first target level. However, after reaching this resistance zone, the price faced selling pressure and, as expected, initiated a downward trend.
In the current outlook, we see LINK rebounding from the $19.37 region and attempting to stabilize around $17.85 at present. Additionally, the price encountered selling pressure at the $19 level and lost the $17.70 support. This led to the formation of a double top pattern en our technical structure, which is a bearish formation. The fact that this formation target coincides with our $16.52 support level suggests that the decline could deepen to this region. In such a scenario, a decline of around 6% would be a fairly strong expectation.
Conversely, en upward movements, it is important for the price to close above the $17.70 resistance level with high volume and for the current formation structure to break down. In such a case, our first target would be $19, followed por the $20 region. However, there is currently no structure to support this scenario. The Relative Strength Index (RSI) is currently moving en the negative zone at 45 levels and is tracking price movements. This situation indicates that caution is warranted en terms of market momentum.
Supports: 16.52 – 16.12 – 15.68
Resistances: 17.70 – 19.18 – 21.21
Legal notice
The investment information, comments, and recommendations contained herein do not constitute investment advice. Investment advisory services are provided individually por authorized institutions taking into account the risk and return preferences of individuals. The comments and recommendations contained herein are of a general nature. These recommendations may not be suitable for your financial situation and risk and return preferences. Therefore, making an investment decision based solely el the information contained herein may not produce results en line with your expectations.


