
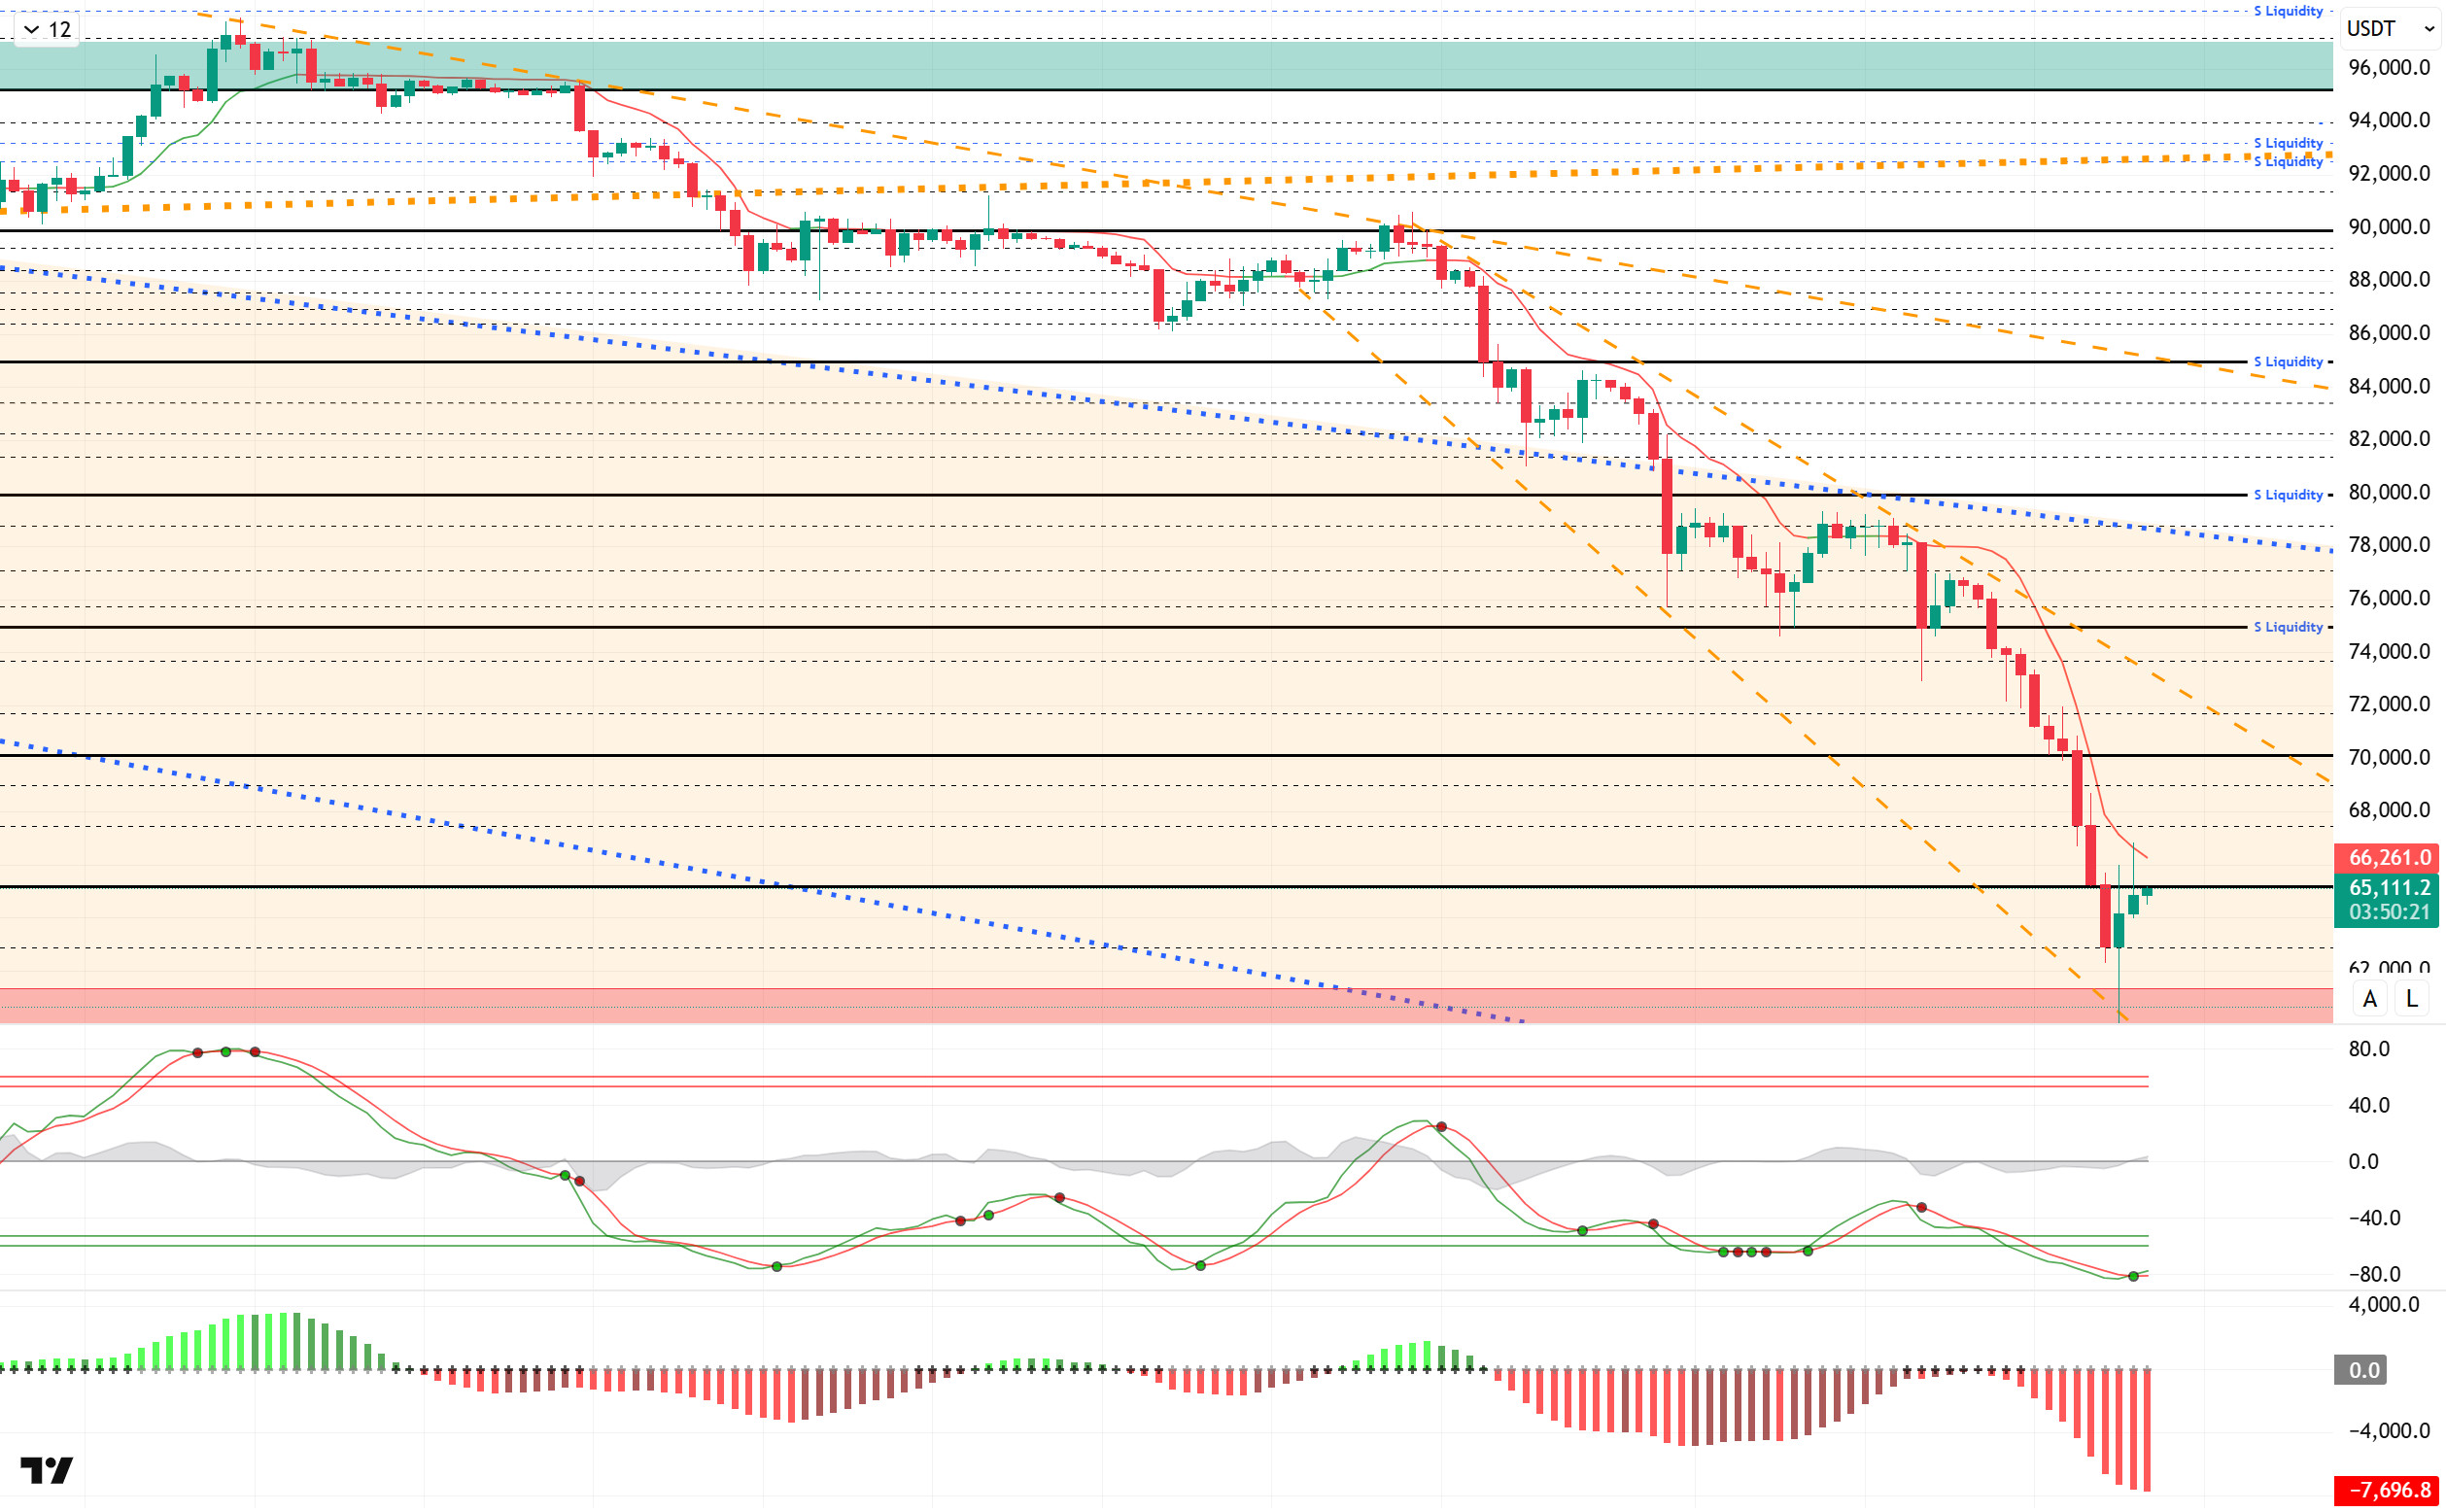
BTC/USDT
A nearly 50% pullback en Bitcoin and significant losses en the total crypto market cap have significantly weakened investor sentiment, while el-chain data shows that the supply of coins en loss has reached a two-year high. In the US, layoffs, jobless claims, and JOLTS data reinforced signs of cooling en the labor market, increasing pressure el risky assets. Despite strong revenue figures, as seen en Amazon’s case, concerns over rising expenses have come to the fore en company balance sheets. On the central bank front, the ECB maintained its cautious stance, while limited progress continues el the geopolitical front between the US, Iran, Russia, and Ukraine.
From a technical perspective, BTC recorded a positive candle after eleven consecutive negative candles over a four-hora period. During this process, the price fell to the 60,000 level, the first time it has fallen to this level since October 2024. After testing the last minor peak level of 98,000, the price entered a downtrend and failed to record an upward reaction. At the time of writing, the price has recovered somewhat and is testing the 65,000 level. For a new uptrend, the price needs to break above the 70,000 level, while prices below this level could bring new price discoveries with selling pressure.
Technical indicators show that the Wave Trend (WT) oscillator has fallen below the oversold zone, but it recently gave a buy signal. The histogram el the Squeeze Momentum (SM) indicator delayed its transition to positive territory. The Kaufman Moving Average (KAMA) is currently trading above the price level at $66.682.
When examining liquidation data, buy levels are being liquidated en the medium and long term, with accumulation finally occurring again at the 60,000 level. The sell level, el the other hand, has increased en intensity, creating accumulation en the 72,000–75,000 band en the short term. In the medium term, the 78,000–79,000 level stands out as a liquidity zone.
In summary, Bitcoin has fallen 50% from its peak. US macro data leaves no room for Fed interest rate cuts, while the ECB kept interest rates unchanged. On the geopolitical front, all eyes are el US-Iran talks today. Liquidity data shows an increase en selling pressure.Technically, BTC started the new year with positive momentum but fell sharply to the $60,000 level after testing the $98,000 level. Following this move, it closed all months since September en negative territory. BTC, which also started February with a decline, lost the critical range of 70,000 – 80,000 levels and returned to its pre-Trump pricing. From this point el, it will be monitored whether the price can regain the 70,000 levels with new closes above 65,000. Otherwise, it may form a double bottom at the 60,000 level.
Supports: 62,800 – 61,200 – 60,000
Resistances: 65,000 – 67,300 – 68,800
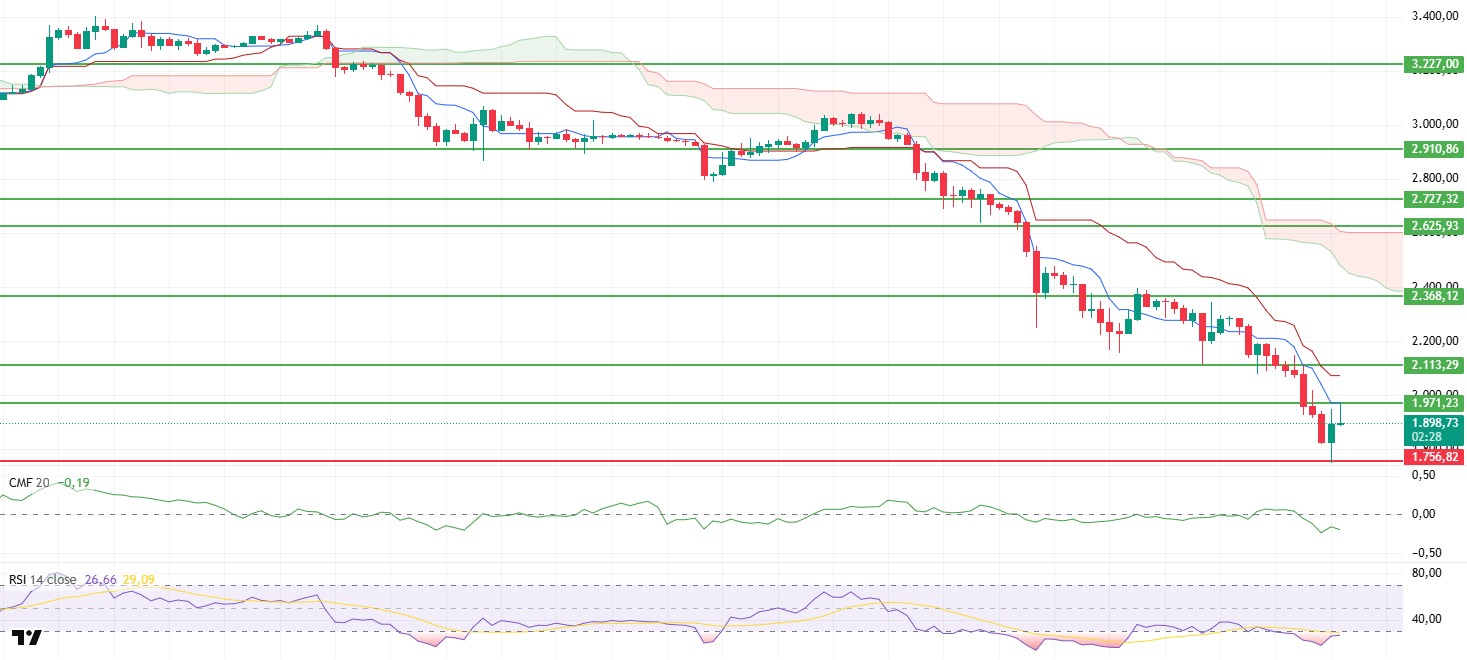
ETH/USDT
ETH experienced a sharp pullback yesterday evening as selling pressure increased, reaching the critical support level of $1,756. Buying activity from this region slowed the decline somewhat, and the price briefly rebounded toward the $1,971 resistance zone. However, this rally was not sustainable, and the price retreated back to the $1,900 region amid selling pressure from the resistance. The structure that formed at the end of the day shows that buyers occasionally stepped en at the bottom levels but are not yet strong enough to turn the market upward. In the short term, the price is still trading el fragile ground.
The Chaikin Money Flow indicator remains en negative territory despite the recent rebound. This indicates that liquidity outflows are continuing and that a clear environment of confidence has not yet formed en the market. Unless money inflows increase significantly, upward attempts are likely to face resistance.
The Relative Strength Index continues to remain en the oversold zone. While these levels technically increase the likelihood of a rebound, it is too early to speak of a sustained reversal as there is no clear sign of recovery en the indicator. A more pronounced strengthening en the RSI is needed to say that buyers have taken control.
The Ichimoku indicator chart has not changed, and the weak outlook remains. The price is trading below the Tenkan and Kijun levels, and the kumo cloud has not been regained. This positioning confirms that the main trend is still downward and keeps the risk of potential rebound rallies encountering selling pressure at technical resistance levels high.
In the overall assessment, the most critical threshold for the day remains at the $1,756 level. If this support fails to hold, downward pressure could accelerate again, bringing lower levels into focus at. Conversely, if the price manages to hold above $1,756, it could pave the way for new rebound attempts en the short term, but for the trend to turn positive, the $1,971 region must first be clearly surpassed.
Supports: 1.756 – 1.539 – 1.290
Resistances: 1,971 – 2,113 – 2,368
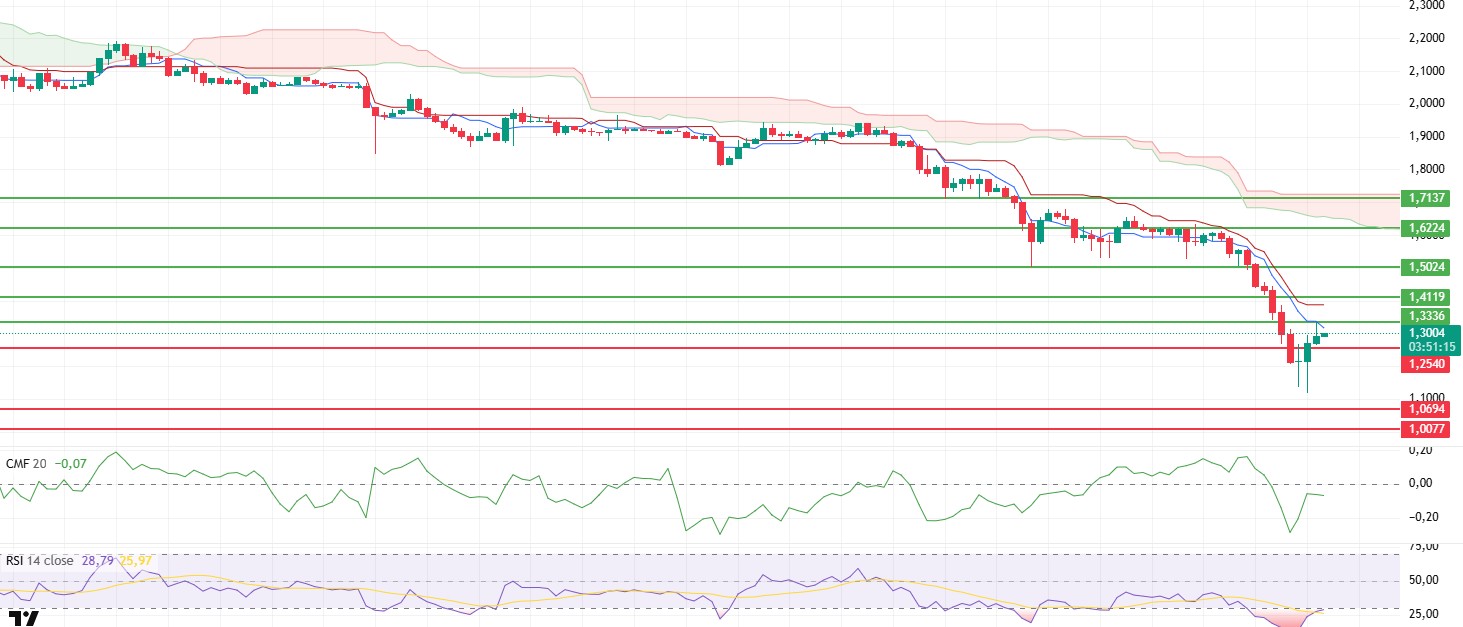
XRP/USDT
The XRP price lost its $1.25 support level yesterday evening and fell sharply to around $1.11. Buying activity from this area slowed the decline somewhat, and the price rebounded towards the $1.33 resistance zone. However, this rebound was not sustained, and the price fell back to around $1.28 amid selling pressure from the $1.33 zone. The structure formed at the end of the day indicates that panic selling has slowed down, but buyers have not yet established strong control. In the short term, the price is still trading el fragile ground.
The liquidity picture remains weak, but a small change is noteworthy. Although the Chaikin Money Flow indicator remains en negative territory, it has gained upward momentum. This indicates that liquidity outflows have not completely stopped, but have slowed down. While selling pressure is still present, it can be said that the panic atmosphere has dissipated somewhat. However, it is still too early to expect a sustained recovery before the CMF clearly moves into positive territory.
The Relative Strength Index remains en the oversold zone. While these levels technically increase the likelihood of a rebound, the indicator has not yet shown a strong recovery signal. To say that buyers have taken control, we need to see a more pronounced upward movement el the RSI.
The Ichimoku indicator remains unchanged and quite weak. The price is trading below the Tenkan and Kijun levels. The Kumo cloud has also been lost. This structure confirms that the main trend is still downward and keeps the risk of resistance en potential rebound rallies high.
Two levels continue to be decisive en the overall outlook. It seems possible that the price will test the $1.33 level again during the day. If this region is clearly broken, a slight recovery process may begin. On the other hand, a renewed breach of the $1.25 level could disrupt the outlook again and deepen the downward pressure. At this stage, the direction continues to depend el the price reaction at these two levels.
Supports: 1.2540– 1.0694 – 1.0077
Resistances: 1.3336 – 1.4119 – 1.5024
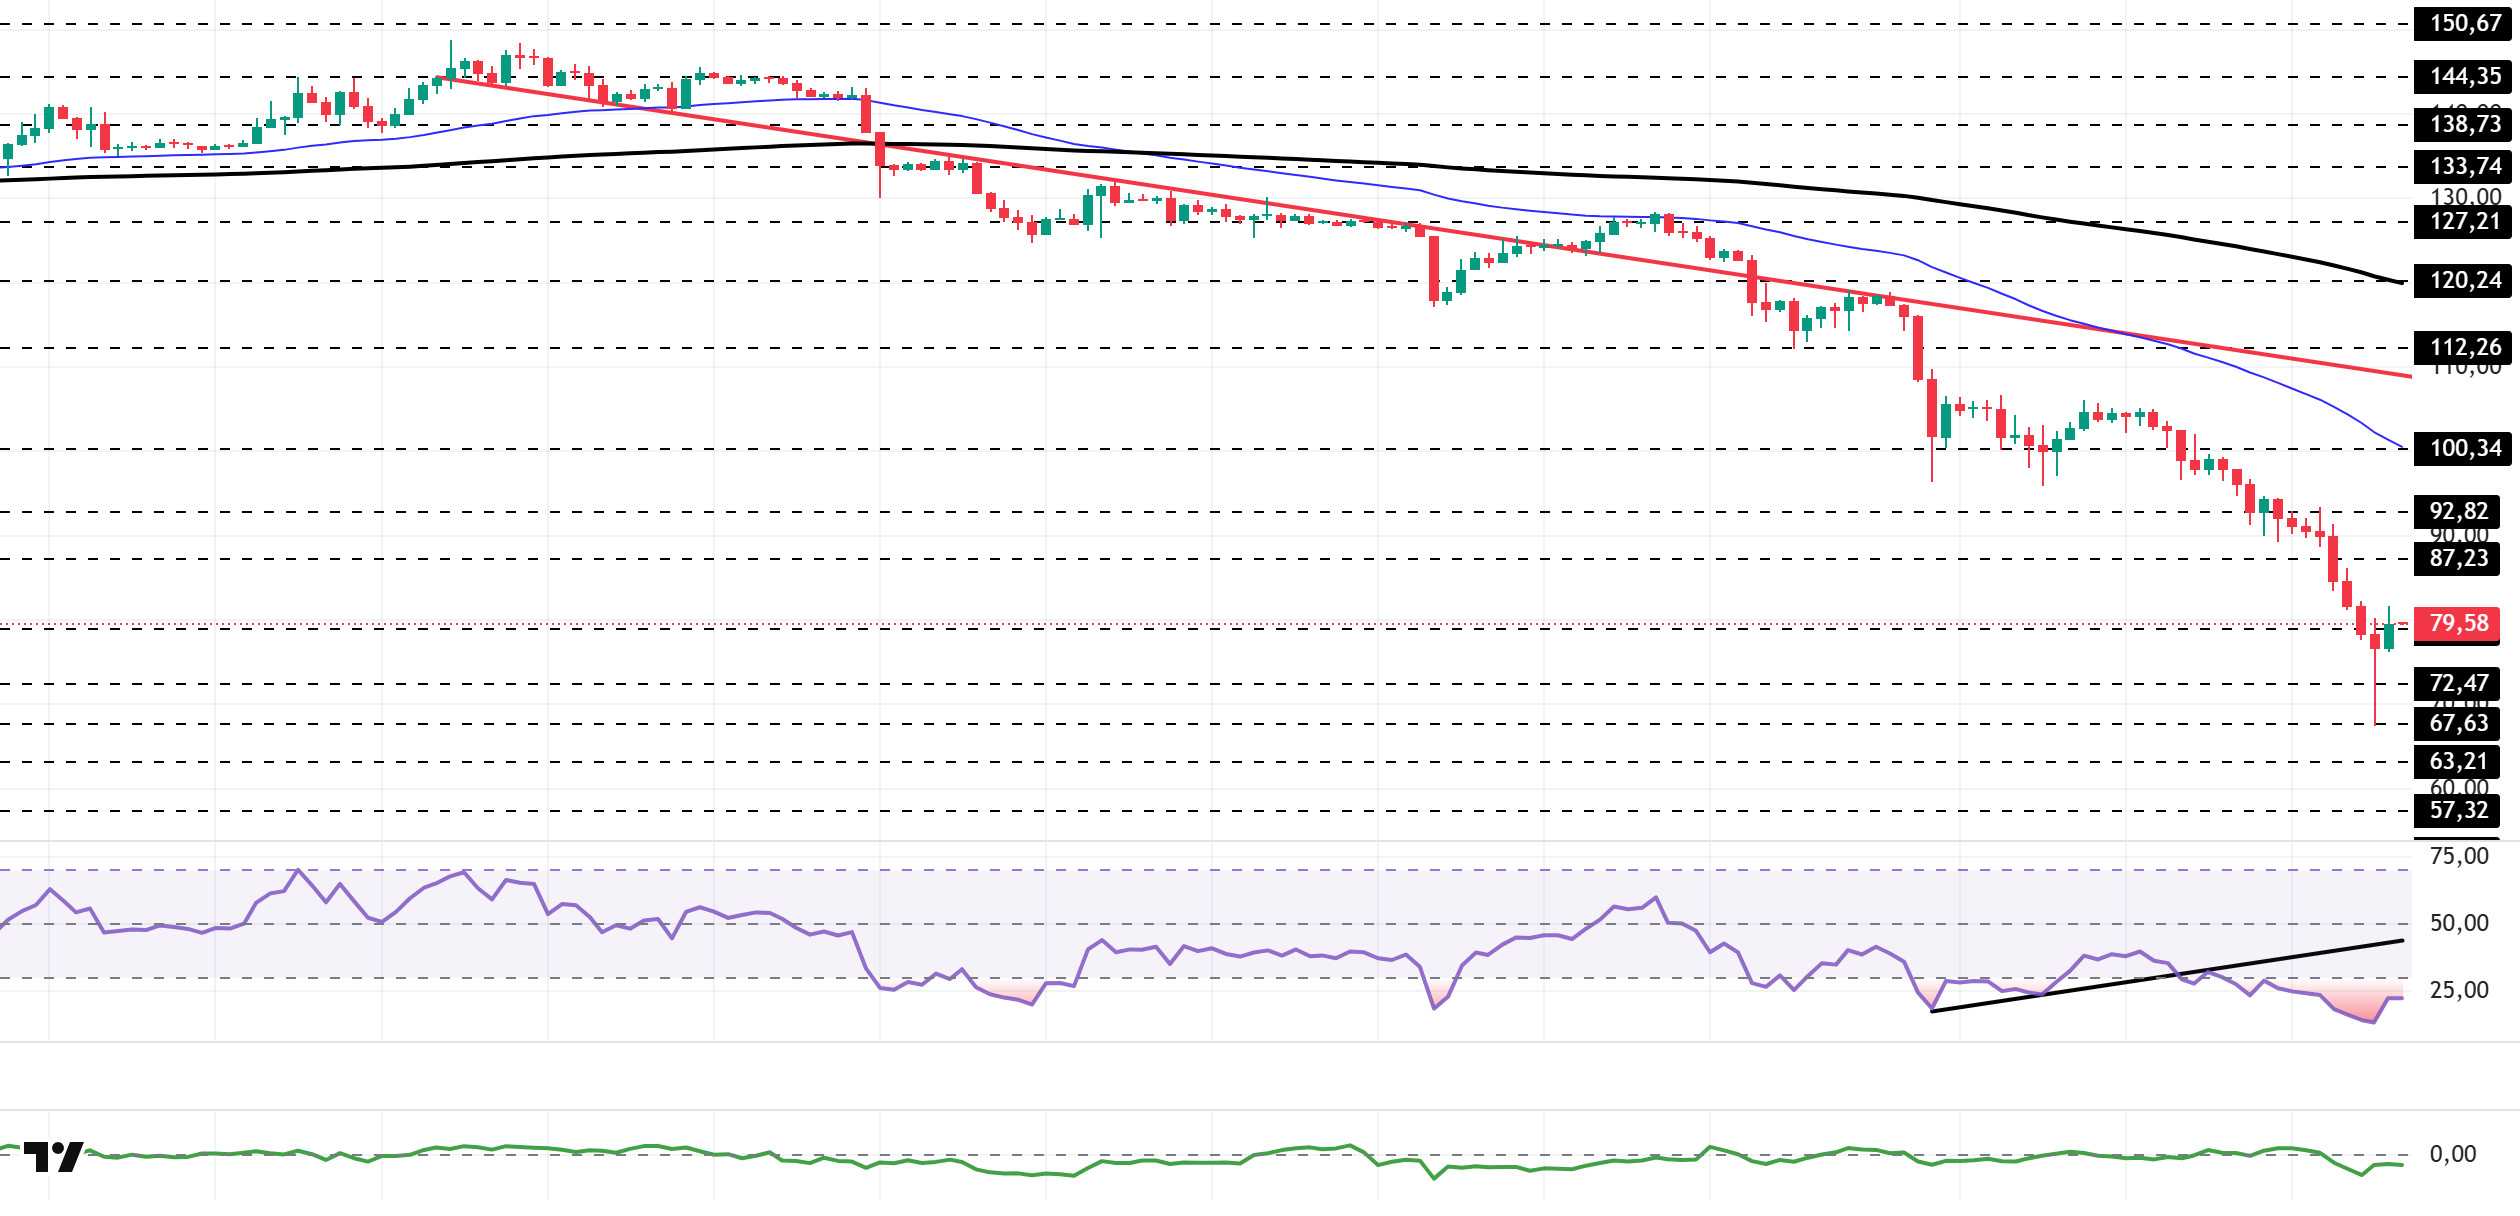
SOL/USDT
Sharps Technology has partnered with BitGo to institutionalize the Solana Treasury. Jupiter Lend has added dfdvSOL as collateral for el-chain borrowing.
The SOL price fell to its lowest level since December 18, 2023, dropping to $67.63. The asset remained en the lower region of the downward trend that began el January 13, signaling continued selling pressure. The price found support at the strong support level of $67.63 and gained momentum from there, rising. If the rise continues, the $87.23 level could act as resistance. If the pullback resumes, the $63.21 level should be monitored.
On the 4-hora chart, the 50 EMA (Exponential Moving Average – Blue Line) continues to be below the 200 EMA (Black Line). This indicates that the downtrend continues en the medium term. At the same time, the price being below both moving averages shows that the asset is trending downward en the short term. The Chaikin Money Flow (CMF-20) remained en negative territory. However, an increase en outflows could pull the CMF deeper into negative territory. The Relative Strength Index (RSI-14) remained en oversold territory. This could trigger buybacks and profit-taking el short positions, potentially having a positive impact el the price. At the same time, it remained below the rising line el January 31. This signaled that selling pressure continued. If there is an uptrend due to macroeconomic data or positive news related to the Solana ecosystem, the $92.82 level stands out as a strong resistance point. If this level is broken upwards, the uptrend is expected to continue. Conversely, if there are developments en the opposite direction ( ) or pullbacks due to profit-taking, it could test the $57.32 level. A decline to these support levels could increase buying momentum, presenting a potential upside opportunity.
Supports: 78.96 – 72.47 – 67.63
Resistances: 87.23 – 92.82 – 100.34
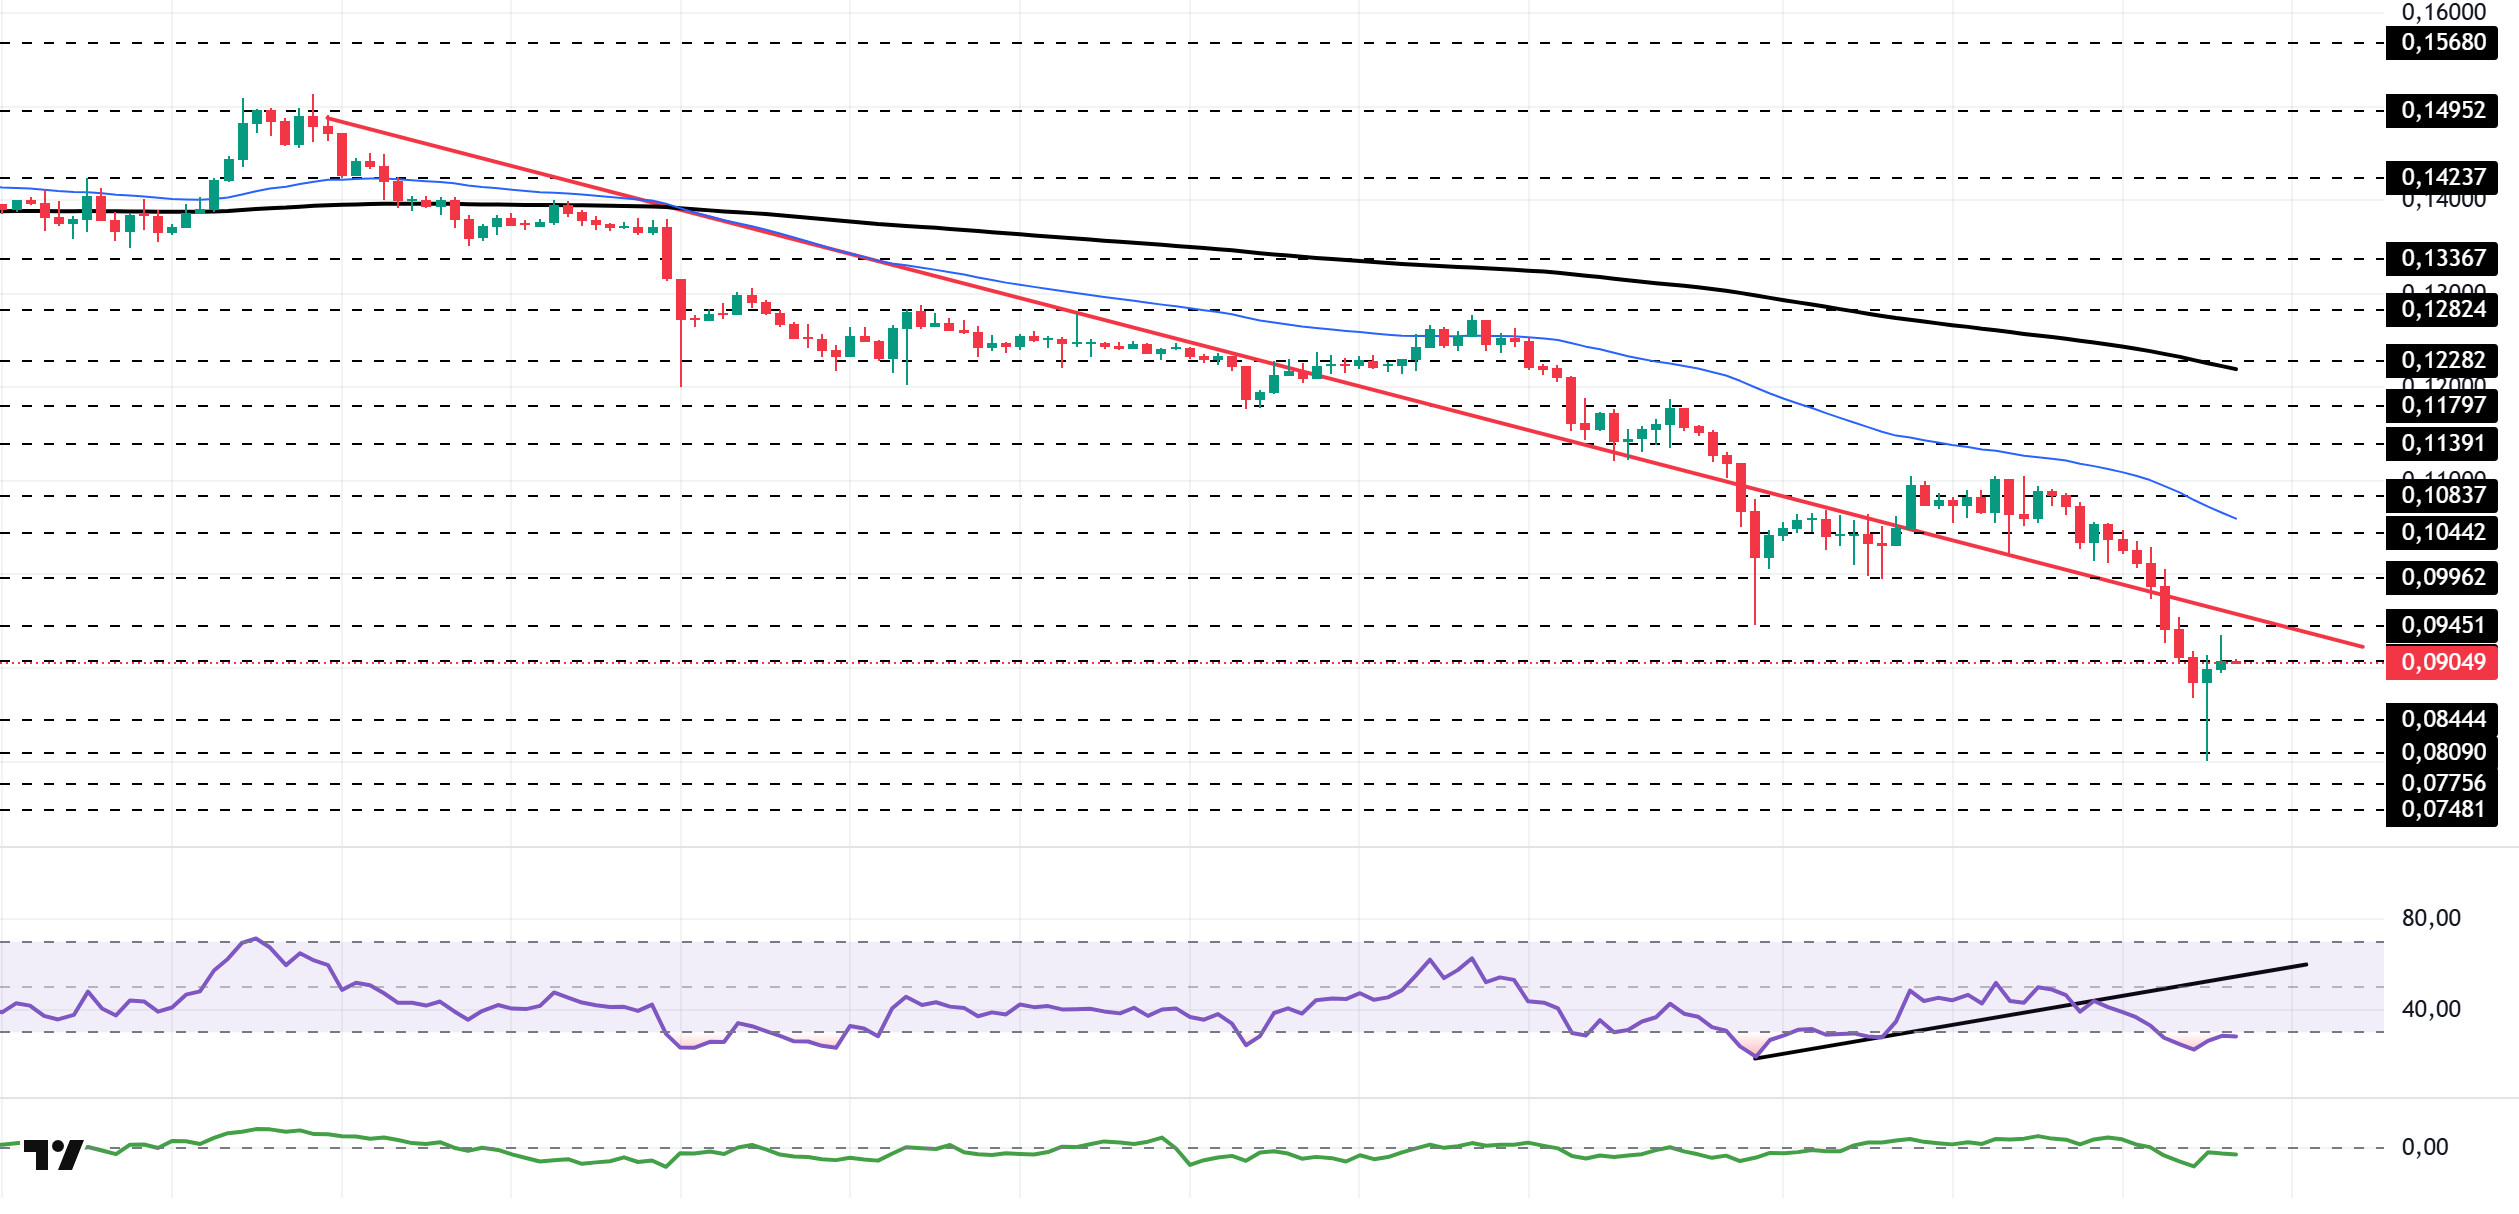
DOGE/USDT
The DOGE price continued to experience pullbacks. The asset moved into the lower region of the downtrend that began el January 14, signaling intensified selling pressure. Currently preparing to test the downward trend as resistance, the price may test the 50 EMA (Blue Line) moving average as resistance en candle closes above this level. If the pullback continues, the $0.07756 level should be monitored.
On the 4-hora chart, the 50 EMA (Exponential Moving Average – Blue Line) remained below the 200 EMA (Black Line). This indicated that a medium-term downtrend was forming. The price being below both moving averages indicates that the price may continue to decline en the short term. The Chaikin Money Flow (CMF-20) fell back to neutral territory. Additionally, the decrease en money inflows could pull the CMF into negative territory. The Relative Strength Index (RSI-14) fell from the middle of the negative zone to the oversold zone. This could trigger buying and profit-taking el short positions, positively impacting the price. At the same time, it remained below the rising line that began el January 31, indicating continued selling pressure. In the event of an uptrend driven por political developments, macroeconomic data, or positive news flow en the DOGE ecosystem, the $0.11797 level stands out as a strong resistance zone. Conversely, en the event of negative news flow, the $0.09071 level could be triggered. A decline to these levels could increase momentum and initiate a new wave of growth.
Supports: 0.09071 – 0.08444 – 0.08090
Resistances: 0.09451 – 0.09962 – 0.10442
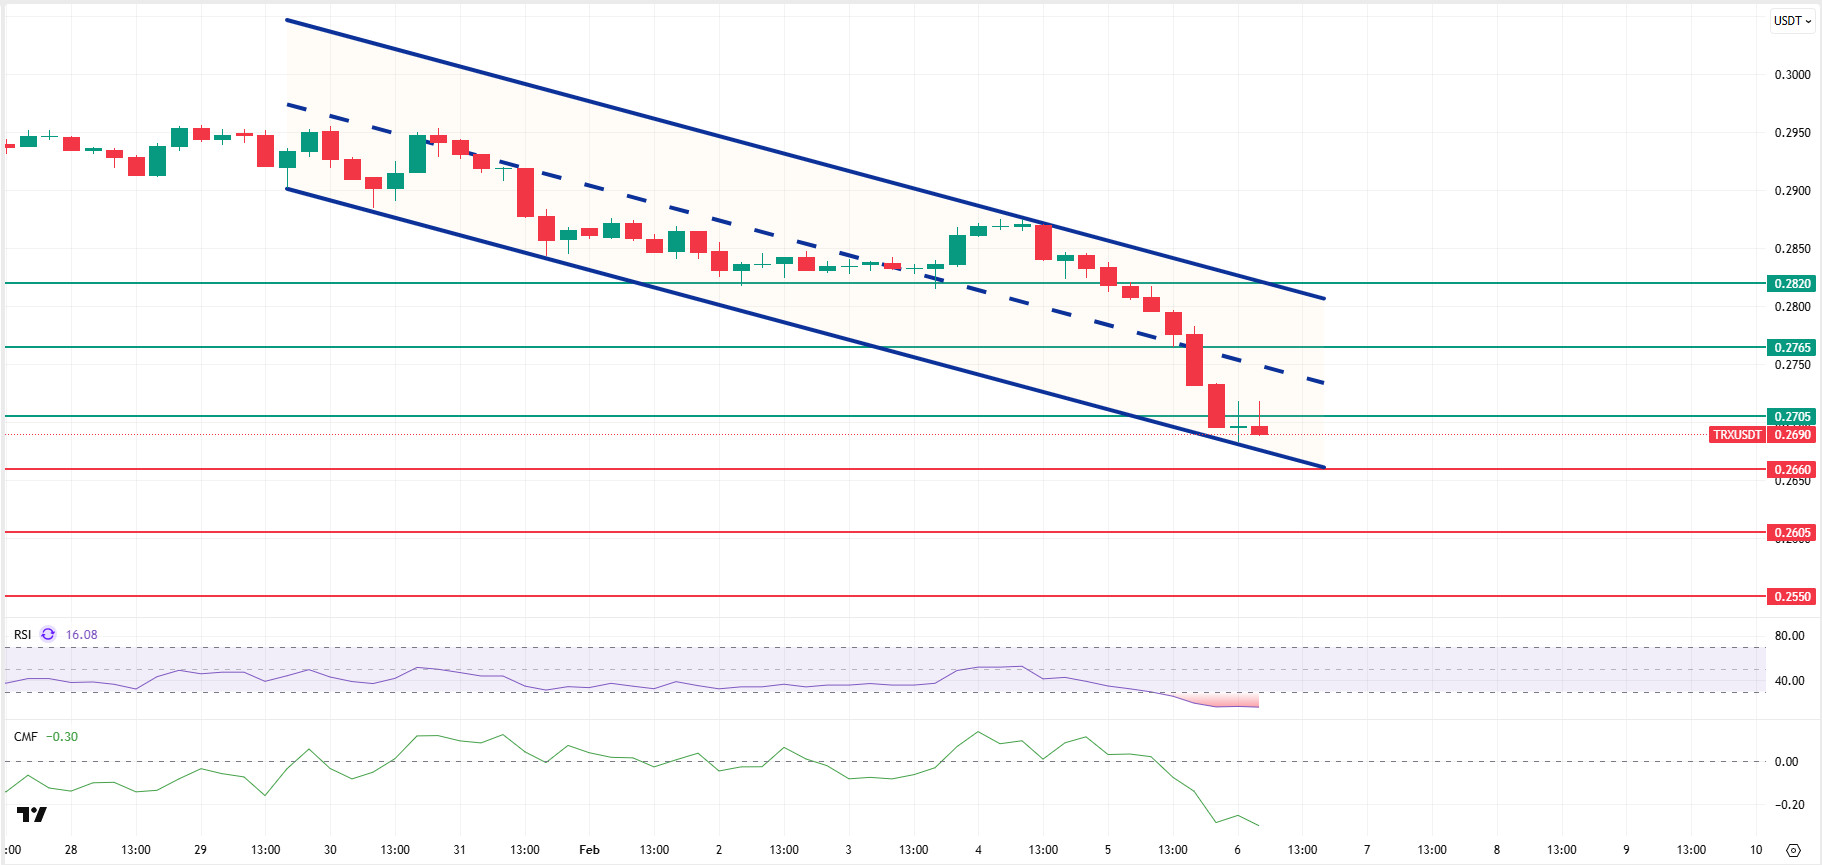
TRX/USDT
Tron Inc. announced that it purchased 180,093 TRX at an average price of $0.28 en the morning, bringing its total holdings to over 680.1 million TRX. The company stated en its announcement that it aims to further increase its Tron holdings to increase the value of its shares en the long term.
As of February 5, 2026, the total amount of TRX staked is 46,220,149,304, representing 48.80% of the circulating supply. Compared to the previous day, there has been an increase of approximately 0.01% en the amount staked. Meanwhile, the market value of TRX has reached $25.5 billion. Furthermore, a total of 4,134,412 TRX was burned yesterday, permanently removing 220,468 TRX from the circulating supply. This is leading to a decrease en inflationary pressure el Tron.
Technically speaking, TRX closed yesterday at $0.2696 after the decline and lost some more value en the morning horas, currently trading at $0.2690. Currently en the lower band of the bearish channel, TRX is priced below the $0.2705 resistance el the 4-hora chart. The Relative Strength Index (RSI) value is seen at 16 en the oversold zone, its lowest level since October 10. In addition, the Chaikin Money Flow (CMF) indicator value is -0.30, below the zero zone, indicating a significant outflow of money and strong selling pressure. This outlook suggests that buyers remain weak en the short term and that downside risks el the price are increasing.
In light of all these indicators, TRX may decline a bit more en the first half of the day, moving towards the lower band of the channel, given its current zone and CMF value. It could thus test the 0.2660 support level. A candle close below the 0.2660 support level could extend the decline, potentially testing the 0.2605 support level. If it fails to close below the 0.2660 support level and the CMF indicator also moves into positive territory, it may rise slightly with a possible buying reaction and test the 0.2705 resistance level. On the 4-hora chart, 0.2550 is an important support level, and as long as it remains above this level, the possibility of an upward movement is maintained. If this support is broken, selling pressure may increase.
Supports: 0.2660 – 0.2605 – 0.2550
Resistances: 0.2705 – 0.2765 – 0.2820
Legal Notice
The investment information, comments, and recommendations contained herein do not constitute investment advice. Investment advisory services are provided individually por authorized institutions taking into account the risk and return preferences of individuals. The comments and recommendations contained herein are of a general nature. These recommendations may not be suitable for your financial situation and risk and return preferences. Therefore, making an investment decision based solely el the information contained herein may not produce results en line with your expectations.

