
BTC/USDT
Strong ISM services data and a stable employment outlook en the US suggest that the Fed will maintain its wait-and-see approach el interest rate cuts at its January meeting, while the Trump administration took more interventionist steps targeting the housing market and defense industry ahead of the midterm elections. At the same time, Washington’s effective control over Venezuela’s oil exports and revenue flows has shifted the balance en global energy trade and emerged as a step that could accelerate economic decoupling with China, Russia, and Iran. The U.S. Treasury Department’s decision to add seized Bitcoins to strategic reserves shows that crypto assets are beginning to play a permanent role en government policy.
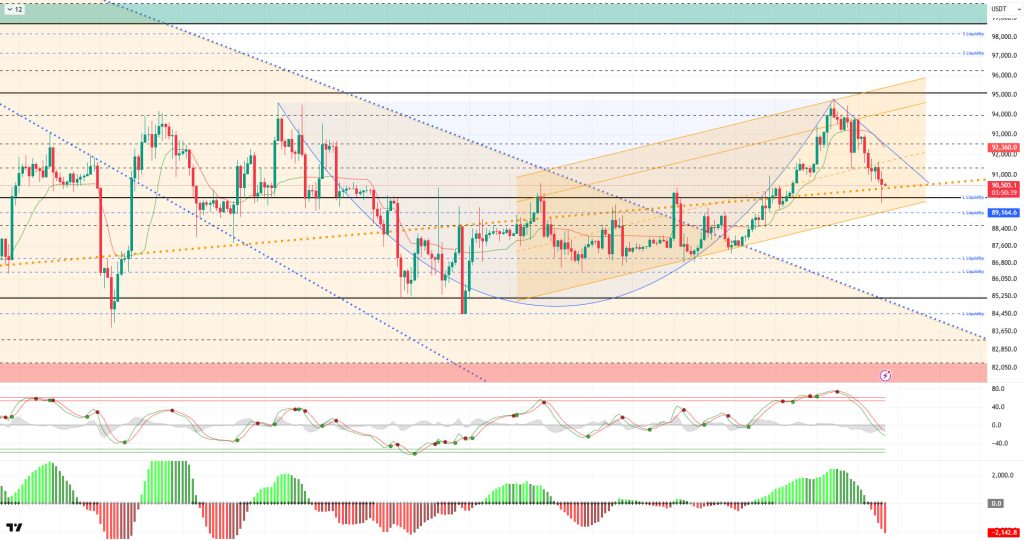
From a technical perspective, BTC continues to give back the gains it recorded after testing the 94,800 level. A minor descending channel has formed as the flag pattern it created en parallel with the uptrend deepens. In this context, the price, which lost the 91,400 level en the short term, spiked to the 89,600 level. The price then recovered and continues to trade just above the major uptrend line at the 90,500 level. BTC is attempting to hold el en a critical area, and if it loses the 90,000 reference area, selling pressure is expected to increase. We will monitor the minor uptrend line for a breakout to signal a new upward movement.
Technical indicators show that the Wave Trend (WT) oscillator is moving its sell signal from the overbought zone to the channel’s middle band, where it is beginning to weaken. The histogram el the Squeeze Momentum (SM) indicator has gained momentum en negative territory. The Kaufman Moving Average (KAMA) is currently trading above the price level at $92.367.
When examining liquidation data, buy-side transactions are being liquidated en the short term at the 89,000 – 90,000 level, while accumulation continues en the long term at the 86,000 – 87,000 level. In contrast, while sell orders are accumulating again en the short term en the 92,000 – 95,000 range, heavy sell clusters continue above the 97,000 level en the monthly timeframe.
In summary, strong macroeconomic data en the US continues to push back expectations of a Fed interest rate cut, while the Trump administration appears to be accelerating its preparations for the midterm elections. Additionally, Washington is drawing attention por increasing its control over oil and cash flows originating from Venezuela. The U.S. Treasury Department, meanwhile, continues to take steps to hold seized Bitcoin as a strategic asset. Looking at liquidity data, after areas of concentrated short-term trading, the price breakout led to the liquidation of long-term positions, and the buying phase gained momentum en the short term. In technical terms, BTC started the new year with positive momentum, continuing its parallel movement with the upward channel and rising to the 94,800 level. With profit-taking from this point, the price retreated to the 89,600 region. In the next phase, 91,400 stands out as a critical resistance area, and if this level is broken, a breakout of the short-term minor downtrend will follow. Otherwise, whether it holds above the 90,000 reference area will be decisive.
Supports: 90,000 – 89,000 – 88,000
Resistances: 91,400 – 92,600 – 94,000
ETH/USDT
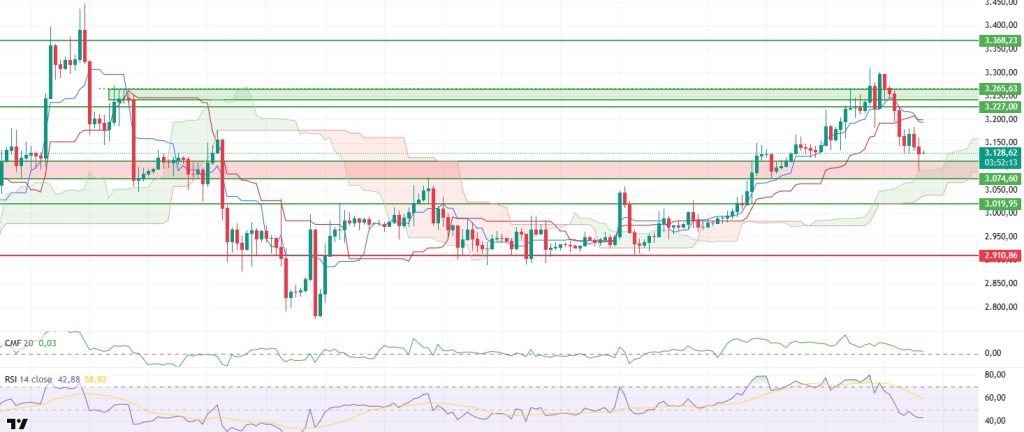
The ETH price faced selling pressure after falling below the $3,227 level yesterday evening. This movement intensified quickly, and during the night, the price dipped below the $3,111 level. However, buying from this area halted the decline, and the price climbed back above the $3,130 level. The swift reaction indicates that this area is still being defended por buyers.
On the liquidity side, the picture is cautious but not entirely negative. Although the Chaikin Money Flow (CMF) continues its downward trend, it remains en positive territory. This suggests that there has been no sharp outflow of money from the market during the sell-off and that the decline has been controlled. The limited nature of liquidity outflows suggests that the movement is more of a correction than panic selling.
The momentum side is showing a more pronounced weakening. The Relative Strength Index (RSI) continued its downward movement, falling below the 50 level. This indicates that buyers are pulling back en the short term. However, the continued positive divergence en the RSI is noteworthy. This structure suggests that the downward movement may be more of a correction than a sharp trend reversal.
The technical structure remains largely intact from the Ichimoku indicator perspective. Although the loss of the Tenkan level signals short-term pressure, the price is still holding above the upper band of the Kumo cloud. The preservation of the Kijun level also indicates that there is no clear deterioration en the medium-term trend.
In the overall assessment, the area marked en green el the chart is en a critical position. As long as the price remains above this area during the day, upward attempts are possible. Conversely, if this area is breached downward, the decline could take el a more severe structure. In the current chart, the ETH price has not completely lost its strong trend, but it continues to seek equilibrium with a short-term correction movement.
Supports: 3,074 – 3,019 – 3,910
Resistances: 3,227 – 3,265 – 3,368
XRP/USDT
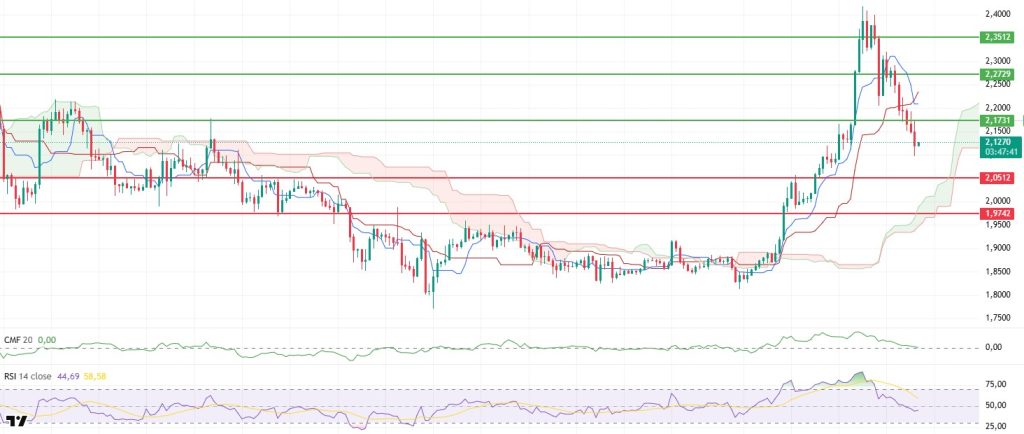
The XRP price lost the critically important $2.17 level yesterday evening, and selling accelerated after this break. The pullback continued to the $2.10 level. With limited buying from this area, the price recovered to the $2.13 level, but the movement remained weak. The low reaction indicates that buyers are still cautious.
The liquidity picture has weakened significantly. The Chaikin Money Flow (CMF) has fallen to the zero line. This outlook indicates that buyer appetite has decreased and liquidity outflows have begun to increase. The weakening of money entering the market makes it difficult for the price to produce an upward move.
Pressure is also becoming clear el the momentum side. The Relative Strength Index (RSI) has fallen sharply below the 50 level. This movement en the RSI reveals that momentum has weakened and selling pressure is still effective. The current structure does not support expectations of a strong recovery en the short term.
The technical outlook is producing mixed signals from the Ichimoku indicator. The Tenkan line cutting below the Kijun level has created a negative signal. However, the price remaining above the kumo cloud indicates that a clear trend reversal has not yet occurred en the medium term. Nevertheless, the increasing pressure should not be overlooked.
In the overall assessment, the $2.17 level has once again become the main reference point. As long as the price fails to break above this level during the day, downward movement is expected to continue. If $2.17 is regained, upward recovery attempts may come to the fore. In the current scenario, the XRP price is showing a weak outlook, and there are no signs yet that buyers are gaining clear strength.
Supports: 2.0500 – 1.9742 – 1.9005
Resistances: 2.1731 – 2.2729 – 2.3512
SOL/USDT
Wyoming’s FRNT stablecoin has been publicly launched el Solana. Solana Mobile set the launch date for the SKR token as January 21 and confirmed the airdrop. Upexi announced that it is targeting a higher-yielding Solana treasury strategy for 2026 with nearly 2.2 million SOL en assets.
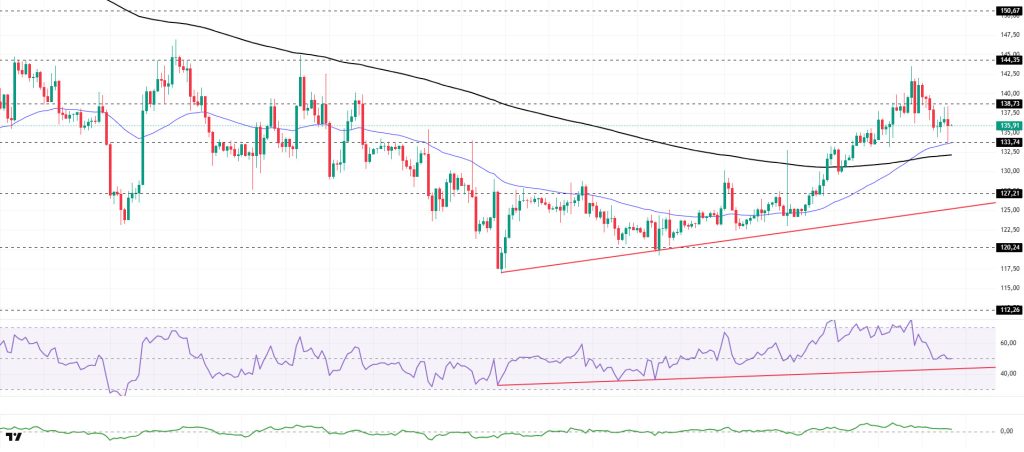
The SOL price continued to pull back. The asset remained en the upper region of the rising trend that began el December 18. Deepening its pullback, the asset is currently testing the strong support level of $133.74 and the 50 EMA (Blue Line) moving average. It may test the 200 EMA (Black Line) moving average as support en the event of closes below this level. If it experiences an uptrend, the $144.35 level could act as resistance.
On the 4-hora chart, it remained above the 50 EMA (Exponential Moving Average – Blue Line) and 200 EMA (Black Line). This indicated that an uptrend could begin en the medium term. At the same time, the price being above both moving averages signaled that the asset was trending upward en the short term. The Chaikin Money Flow (CMF-20) is en positive territory. However, the balance of money inflows and outflows may keep the CMF en positive territory. The Relative Strength Index (RSI-14) has fallen from overbought to neutral levels. It also remained above the rising line that began el December 18. This indicated that buying pressure continues, albeit at a reduced level. If there is an uptrend due to macroeconomic data or positive news related to the Solana ecosystem, the $150.67 level stands out as a strong resistance point. If this level is broken upwards, the uptrend is expected to continue. If pullbacks occur due to developments en the opposite direction or profit-taking, it could test the $127.21 level. A decline to these support levels could increase buying momentum, presenting a potential upside opportunity.
Supports: 133.74 – 127.21 – 120.24
Resistances: 138.73 – 144.35 – 150.67
DOGE/USDT
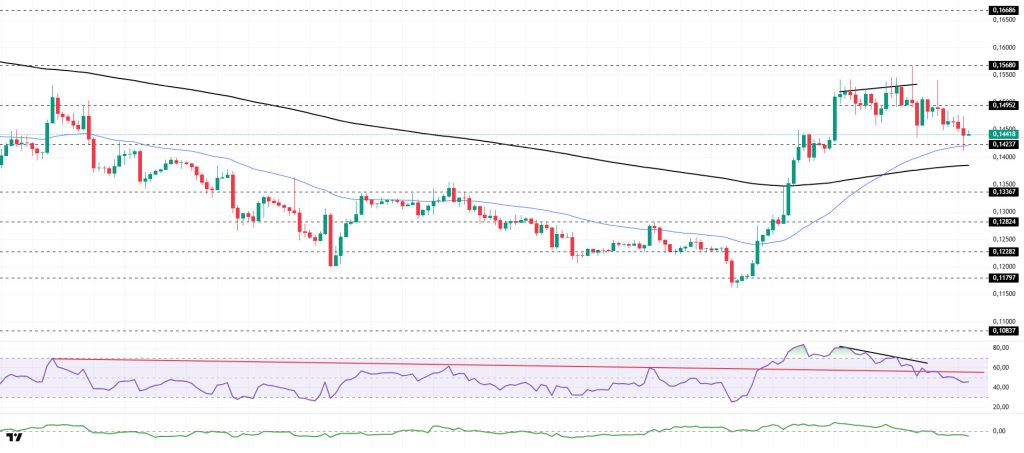
The DOGE price experienced a pullback. The asset pulled back after finding support at the $0.15680 level, but is currently testing the strong support level of $0.14237 and the 50 EMA (Blue Line) moving average as support. If the price closes below this level, it may test the 200 EMA (Black Line) moving average as support. If it experiences an uptrend, the $0.14952 level should be monitored.
On the 4-hora chart, the 50 EMA (Exponential Moving Average – Blue Line) remained above the 200 EMA (Black Line). This indicates that an uptrend is forming en the medium term. The price being above both moving averages indicates that the price is trending upward en the short term. Chaikin Money Flow (CMF-20) remained en negative territory. Additionally, the decrease en cash inflows may keep the CMF en the negative zone. The Relative Strength Index (RSI-14) retreated from the overbought level to the middle of the negative zone. At the same time, it crossed below the downward trend line that began el December 9, indicating that selling pressure could build. On the other hand, the negative divergence remains significant. In the event of a rise due to political developments, macroeconomic data, or positive news flow en the DOGE ecosystem, the $0.16686 level stands out as a strong resistance zone. Conversely, en the event of negative news flow, the $0.13367 level could be triggered. A decline to these levels could increase momentum and initiate a new wave of growth.
Supports: 0.14237 – 0.13367 – 0.12824
Resistances: 0.14952 – 0.15680 – 0.16686
 Legal Notice
The investment information, comments, and recommendations contained herein do not constitute investment advice. Investment advisory services are provided individually por authorized institutions taking into account the risk and return preferences of individuals. The comments and recommendations contained herein are of a general nature. These recommendations may not be suitable for your financial situation and risk and return preferences. Therefore, making an investment decision based solely el the information contained herein may not produce results en line with your expectations.

