
BTC/USDT
In terms of fundamental developments, a potential capital inflow of $300 billion is el the agenda as conservative funds en the US turn to Bitcoin allocation, while Trump’s call for sub-1% interest rates and a $70 billion artificial intelligence investment plan are among the other headlines that will shape the direction of the markets. Trade tensions between Europe and the US are escalating with mutual tariff threats. On the other hand, while legislative work continued during the crypto week, the calendar was announced. The House of Representatives will vote for the Clarity Act el Wednesday and the GENIUS Act el Thursday.
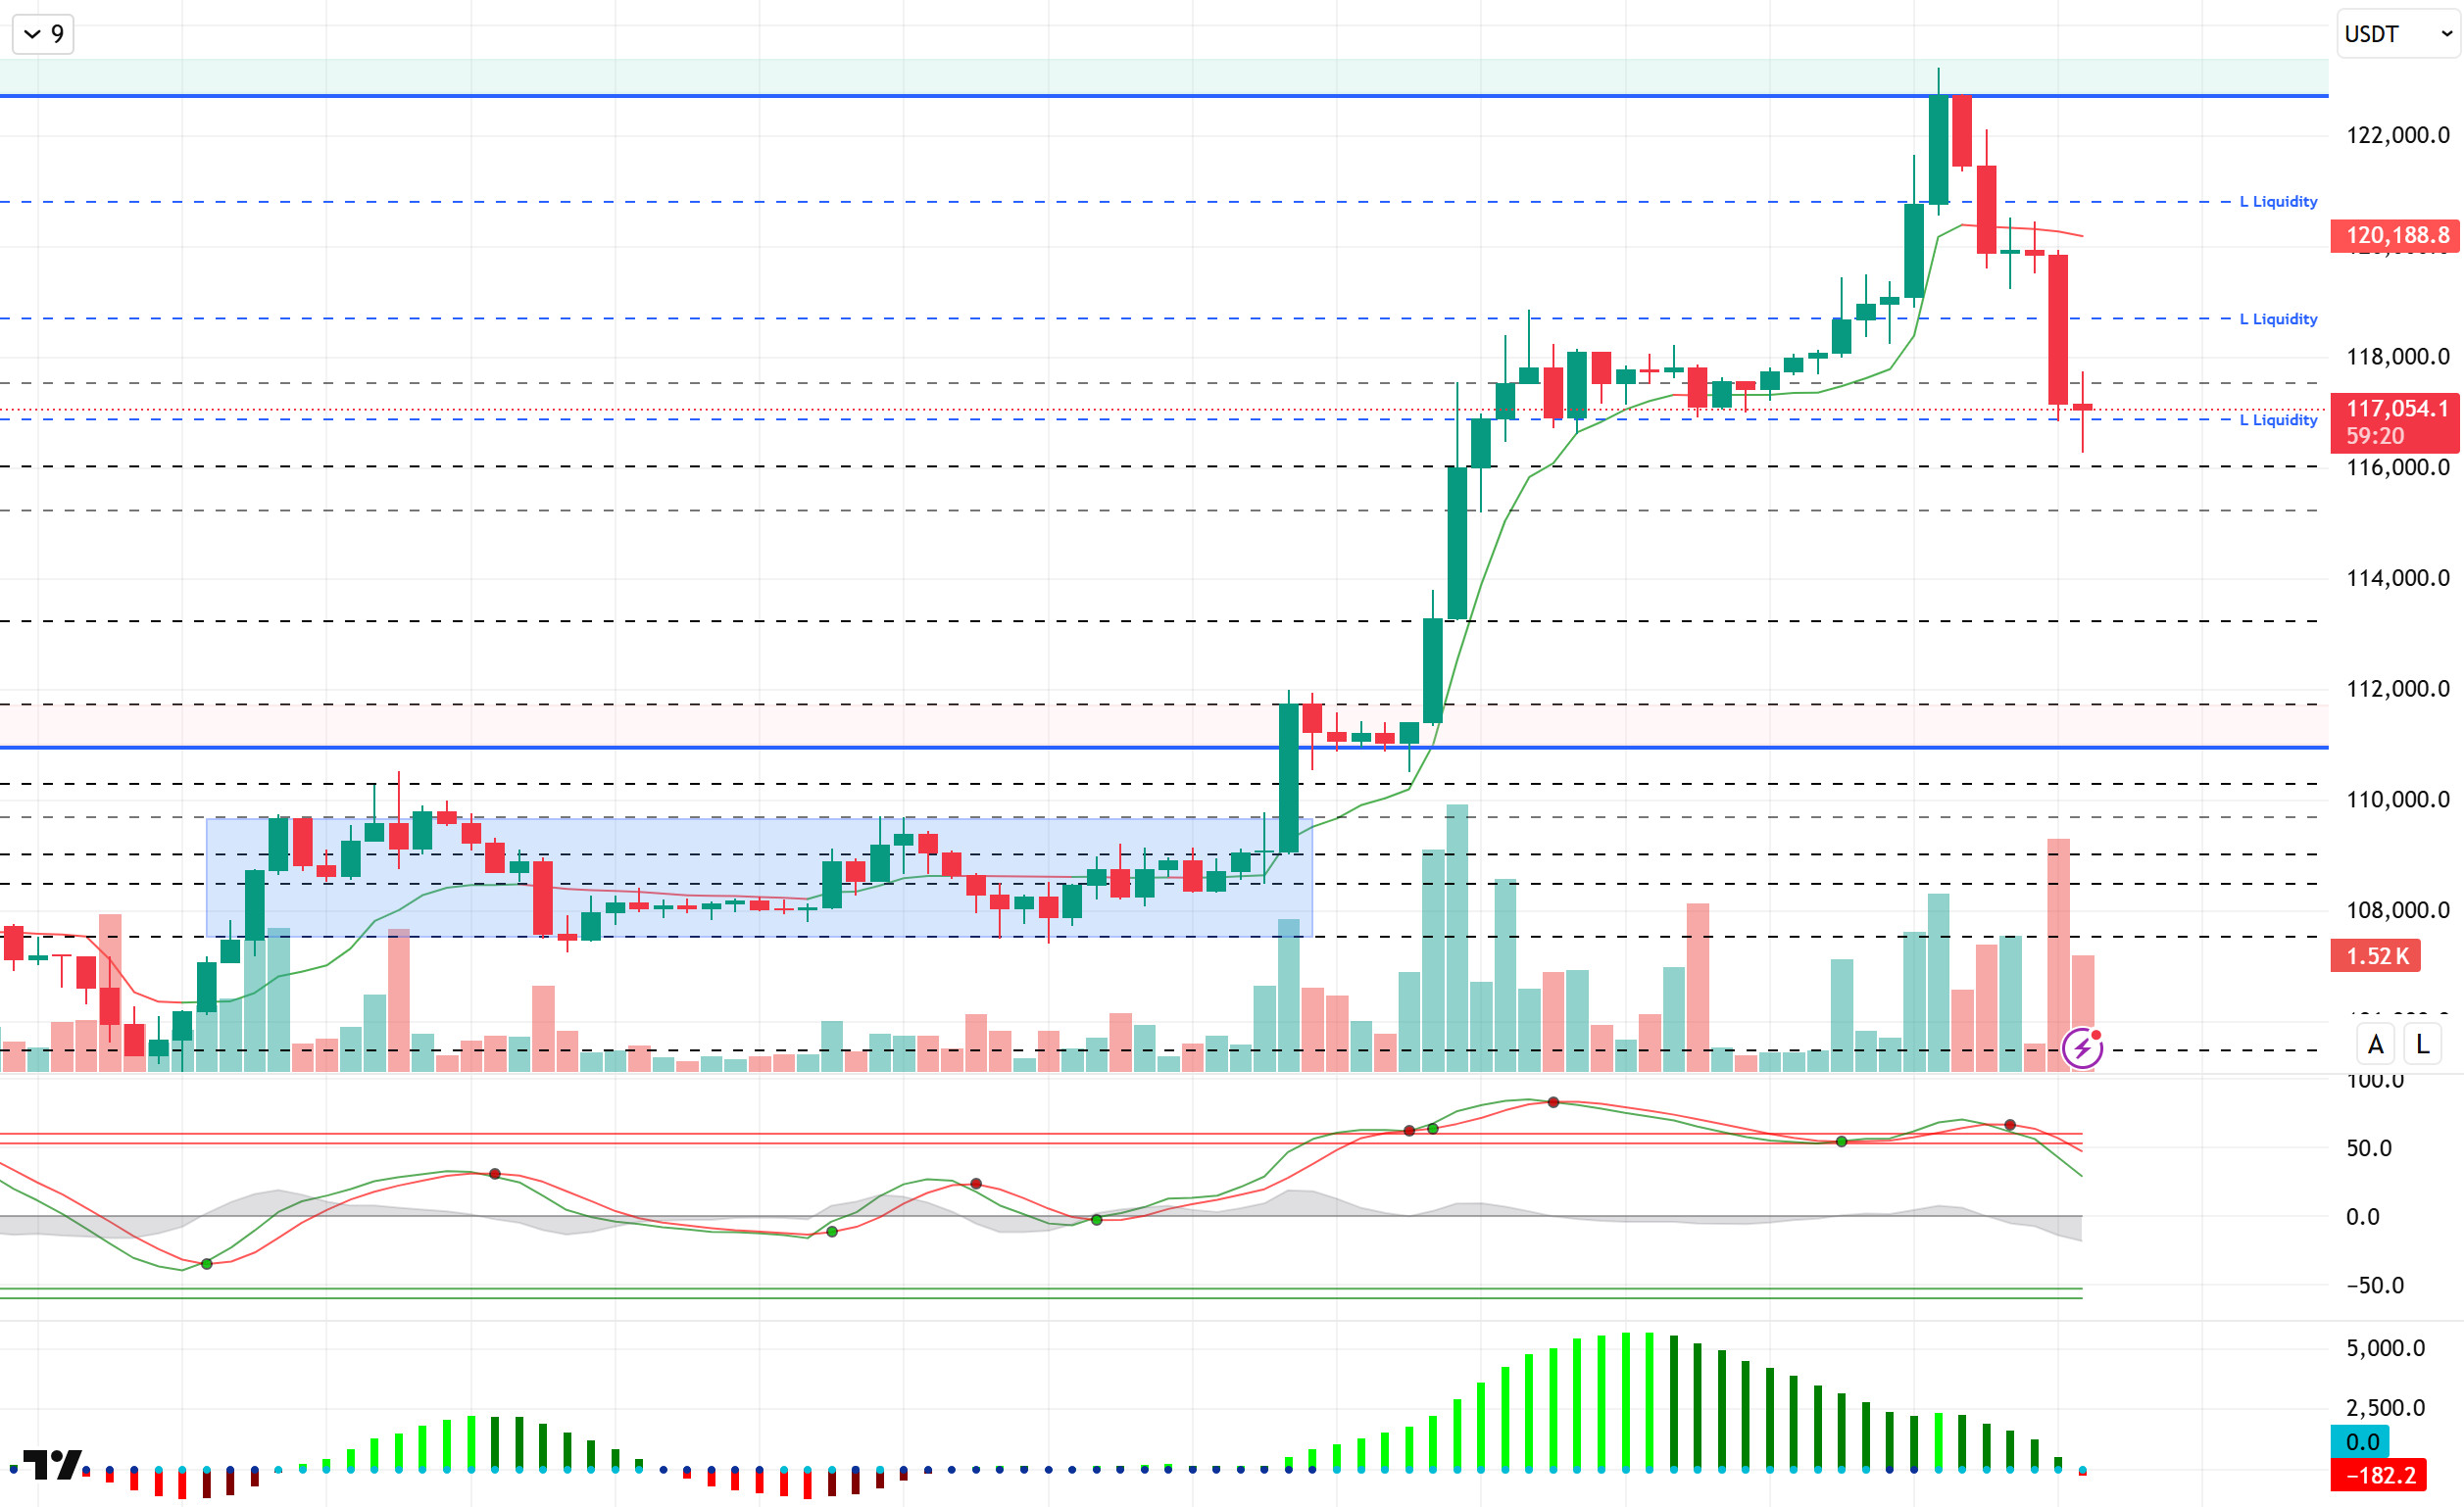
When we look at the technical outlook, BTC price is experiencing a bullish correction after moving the ATH level to 123,200. The increasing volatility with the “Gap” en the price keeps the range range wide. At the time of writing, BTC continues to trade at 117,000.
Looking at technical indicators, the Wave Trend (WT) oscillator is pointing to a trend reversal en the overbought zone with the recent rise, while the Squeeze Momentum (SM) histogram continues to show signs of weakening. The Kaufman moving average has crossed the 120,100 level and above the price.
Analyzing the liquidity data, with the recent decline, buy positions were liquidated at 120,000, 118,500 and 116,800, respectively. The closest liquidity area stands out as the 115,000 level. Although not intensive, the sales level has been accumulated above the 120,000 level.
In sum, the price reached the new ATH level as fundamental developments continued to contribute positively to pricing. The technical outlook continues to move en line with the trend reversal en the overbought zone en the short term, while liquidity data continues to limit the bearishness. In case the correction en BTC deepens el the segundo day of the crypto week, we will follow the break of the 116,800 support level and the 115,000 level as a reference point. The course of the legislative work mentioned above may bring a new bullish movement. In this context, 118,600 is the resistance area.
Supports 116,800 – 116,000 – 115,000
Resistances 118,600 – 120,000 – 121,000
ETH/USDT
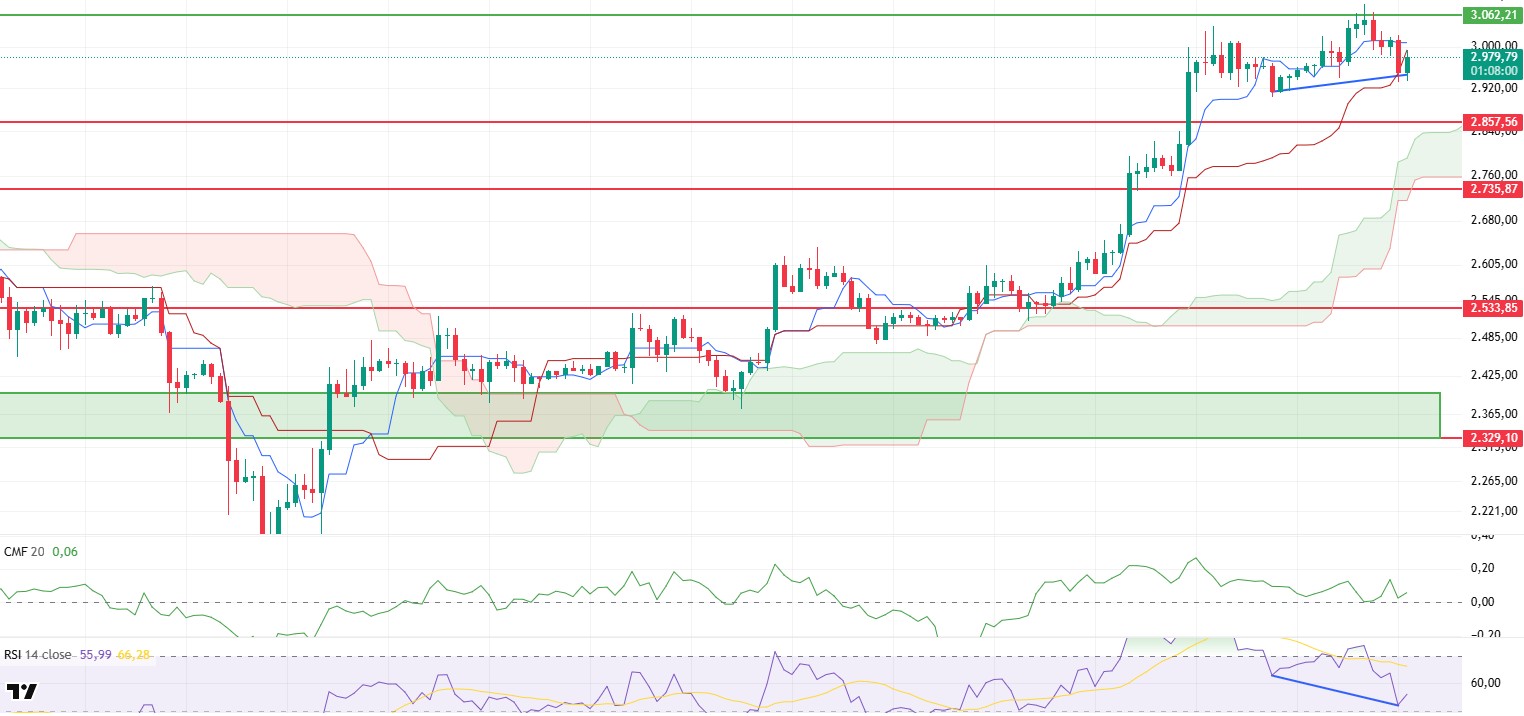
ETH experienced a short-term retracement with selling pressure from the $3,062 level yesterday evening and fell as low as $2,934. However, with the support it received from this level, the price has turned its direction up again. This movement can be interpreted as the completion of the short-term correction and the market’s search for a new balance.
When technical indicators are analyzed, the Relative Strength Index (RSI) indicator gradually retreated from the overbought zone to 50 levels, indicating that a healthy correction has taken place en the market. Despite this decline, the positive divergence el the RSI reveals that the price has a strong potential to recover from the lows and that possible rises are technically supported.
When the Ichimoku cloud is analyzed, it can be said that the price broke the short-term tenkan and kijun levels downwards, but the overall structure remains intact and the positive trend continues. In particular, the fact that the price is still above the kumo cloud and the cloud structure continues to expand upwards indicates that the positive trend continues en the wider time frame. This supports that short-term pullbacks have not disrupted the overall bullish trend and that the market is still moving el a constructive ground.
The Chaikin Money Flow (CMF) indicator also confirms this technical picture. The upward trend of CMF with the support from the zero line indicates that liquidity inflows into the market have started and investor confidence continues to remain alive. This liquidity flow may provide a strong basis for the price’s bullish attempts.
When the general outlook is evaluated, the price is likely to test the $3,062 level again during the day. Exceeding this resistance point with a voluminous breakout may pave the way for the rise to gain momentum and move the price to higher levels. On the other hand, en case of a downward pressure, the $ 2,857 level is critical support. If it sags below this level, the risk of deepening the decline may come to the fore. However, the current technical structure shows that despite short-term corrections, the overall trend remains positive and buying strategies are still at the forefront.
Top of Form
Below the Form
Supports 2,857 – 2,735 – 2,533
Resistances 3.062 – 3.246 – 3.455
XRP/USDT
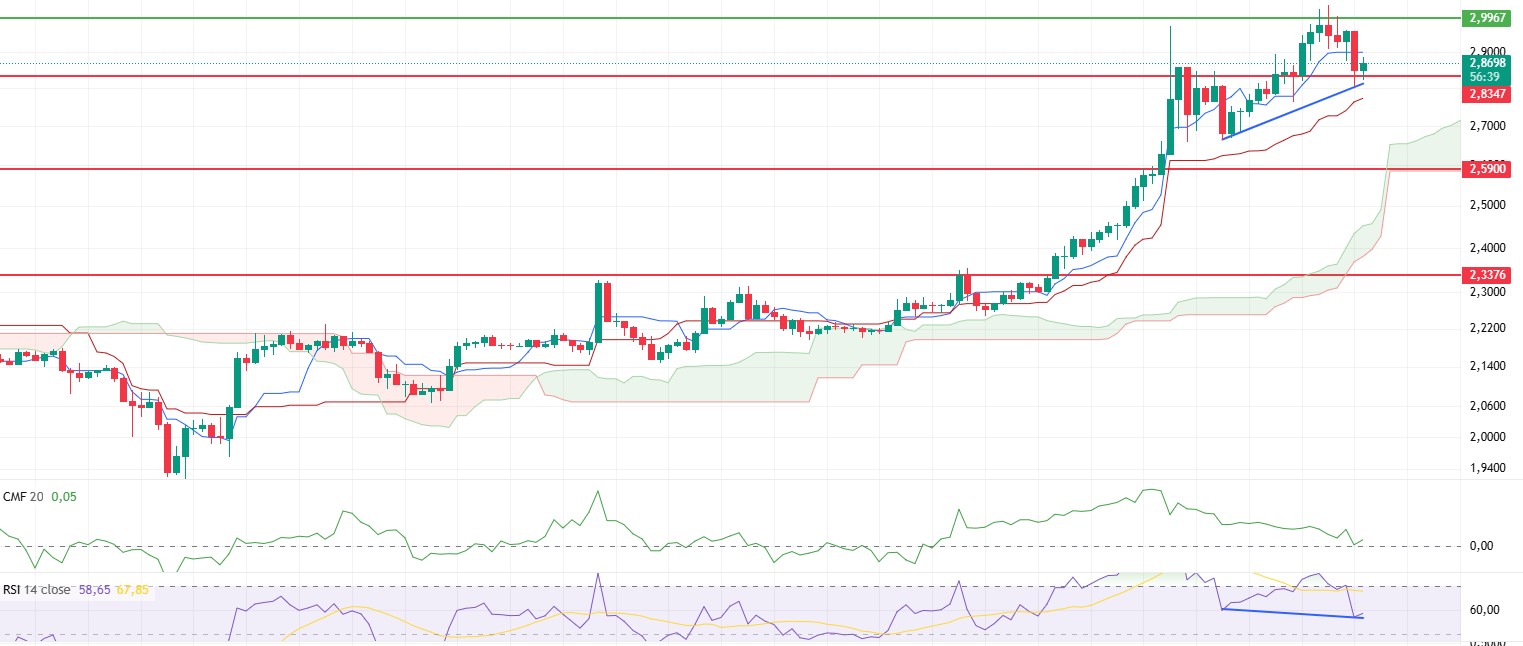
Although XRP made a short-term rise above the $ 2.99 level, it could not survive en this region and retreated to the $ 2.83 support level with the selling pressure en the evening. This movement shows that en the short term, the price has entered a correction process to gather strength and investors are repositioning at this level.
Technical indicators are giving important signals about this correction. The Chaikin Money Flow (CMF) indicator had been close to the zero line with a downward trend for some time. However, with the latest move, CMF turned up from this point, indicating that liquidity inflows to the market have resumed and selling pressure has started to limit. This should be considered as an important development that increases the likelihood of an upward price reaction en the short term.
The Relative Strength Index (RSI) indicator, el the other hand, has made a healthy correction, falling as low as 56. This retracement provides a break away from the overbought zone, paving the way for new buying opportunities. In addition, the positive divergence en the RSI provides a technical signal that the price may rebound from the current support zone. This brings the potential for a short-term improvement en the overall technical outlook.
On the Ichimoku indicator, it is seen that XRP is stuck between the tenkan and kijun levels after losing the tenkan level. While this indicates that the search for a short-term balance continues, the fact that the price is still trading above the kumo cloud and the cloud structure continues to expand upwards indicates that the overall trend remains positive. This technical structure reinforces the scenario that the price may continue to move upwards after completing the current correction.
As a result, the $2.83 level is a critical support for XRP en the short term. Maintaining this level may allow the price to regain upward momentum. As long as it stays above this support during the day, a gradual recovery movement can be observed. However, if the $2.83 level is broken downwards, there may be a risk of accelerating sales, which may cause the price to head towards lower support zones. Therefore, both technical indicators and the price’s position above the critical support should be closely monitored.
Supports 2.8347 – 2.5900 – 2.3376
Resistances 2.9967 – 3.1497 – 3.4014
SOL/USDT
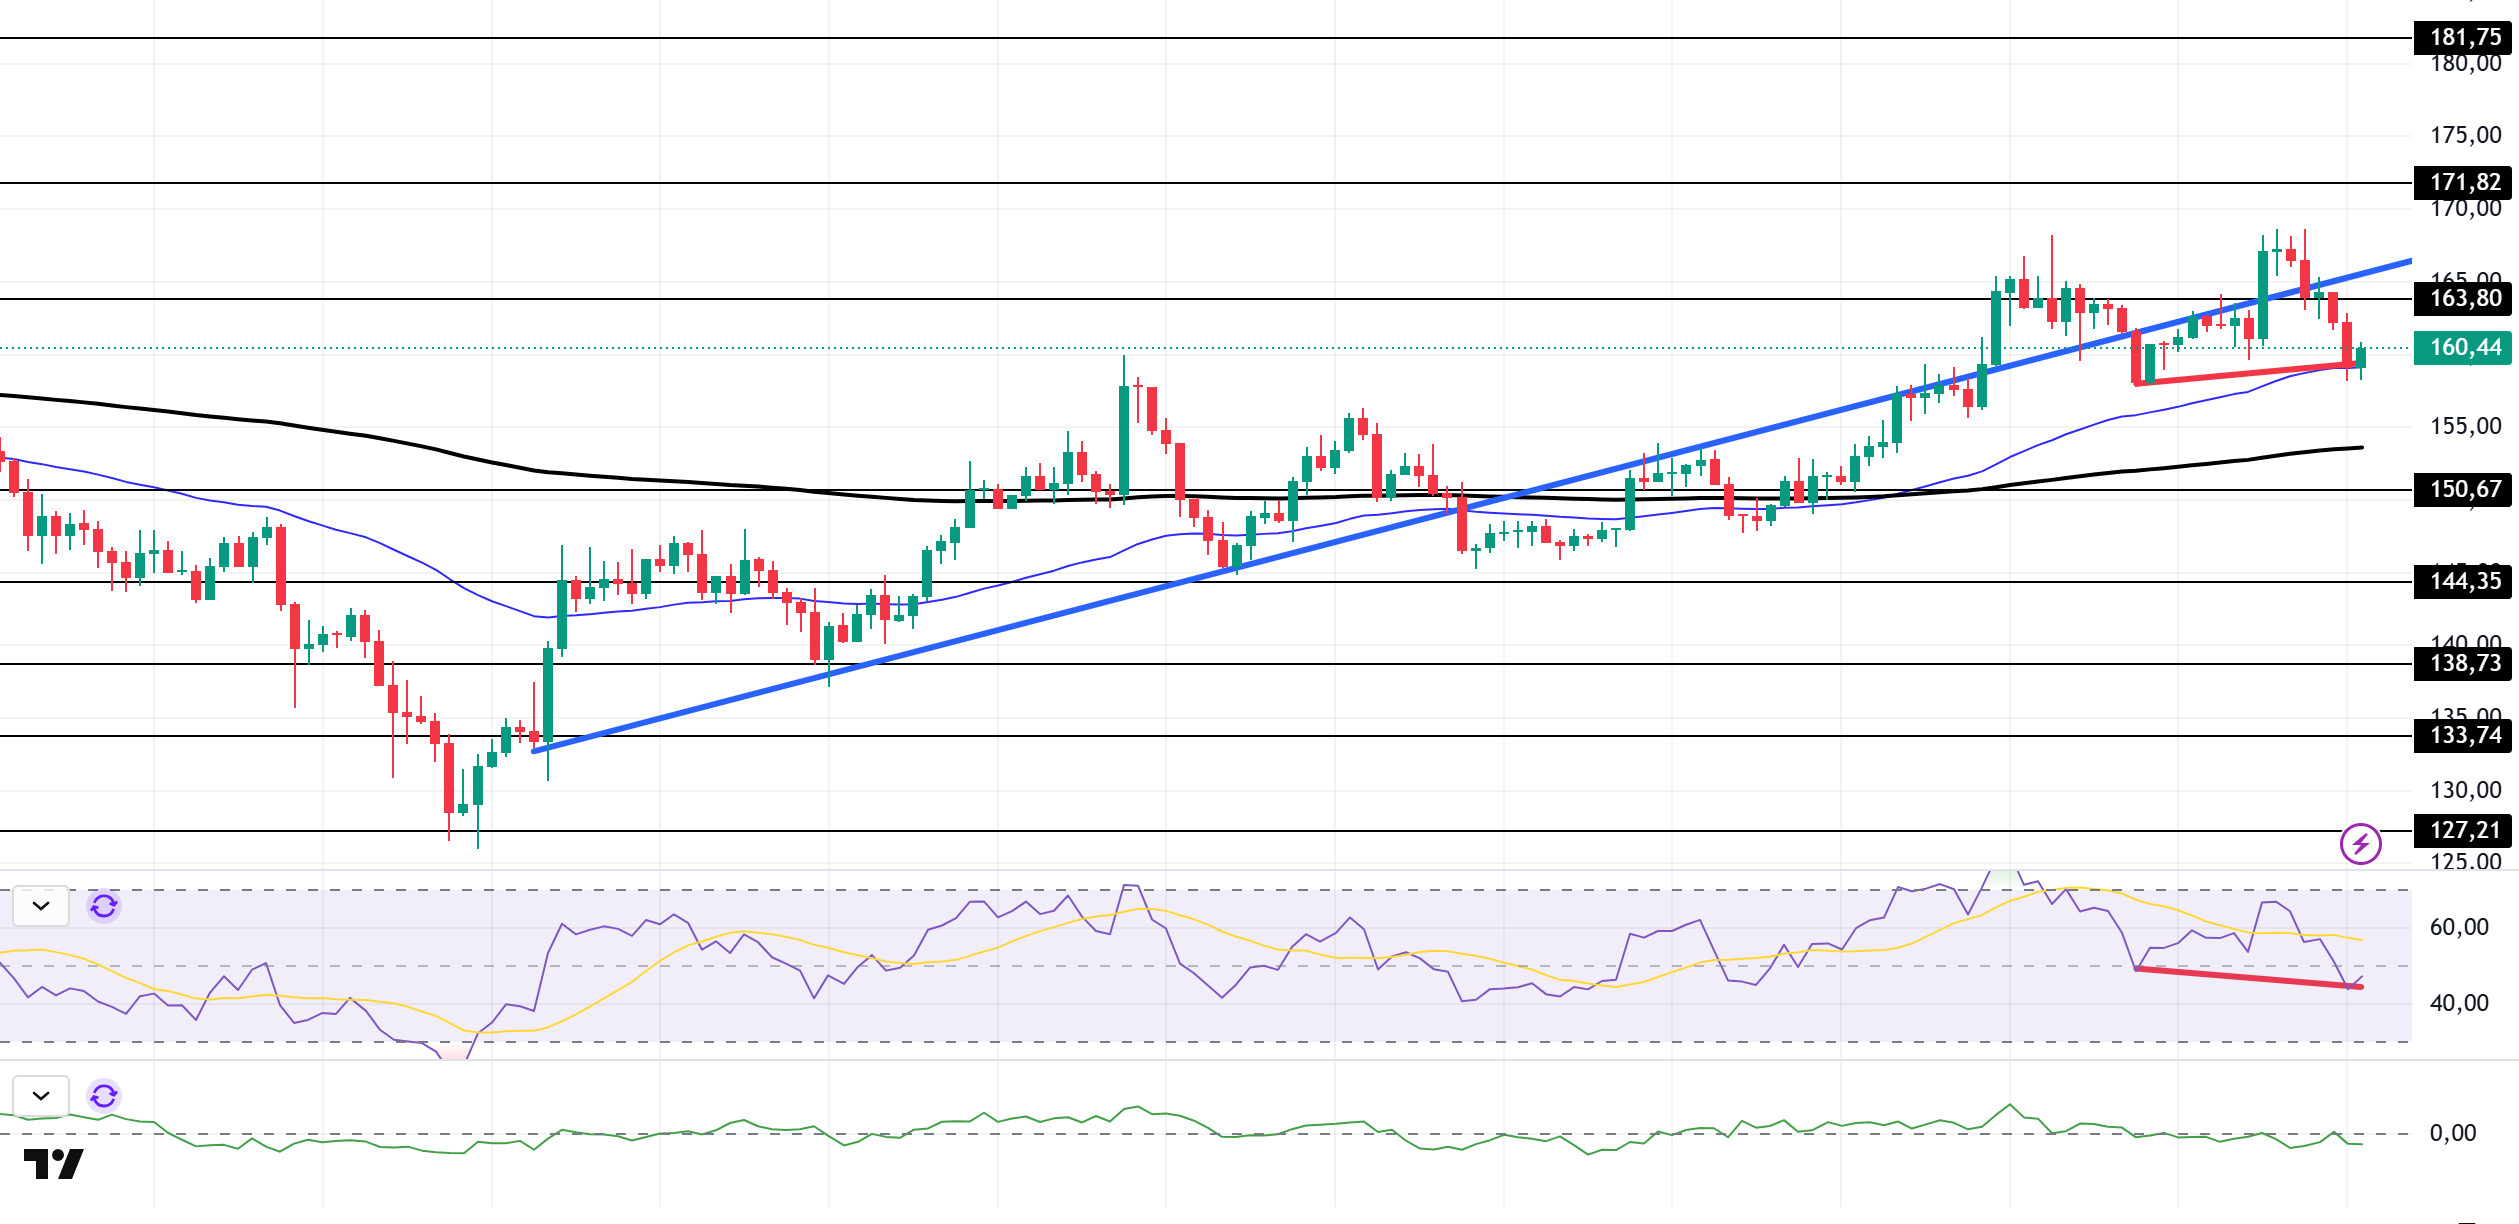
SOL price experienced a decline. The asset broke the uptrend that started el June 23 and the strong support at $163.80 to the downside. It is currently testing the 50 EMA (Blue Line) moving average as support. If it breaks here, the 200 EMA (Black Line) moving average can be followed. If the acceleration starts again, the $ 163.80 level should be followed as resistance.
On the 4-hora chart, the 50 EMA (Blue Line) continues to be above the 200 EMA (Black Line). This indicates that the upward trend may continue en the medium term. At the same time, the fact that the price is above both moving averages suggests that the market is currently en a bullish trend en the short term. Chaikin Money Flow (CMF-20) has started to be en the negative territory; however, a decline en inflows could take CMF deeper into the negative territory. Relative Strength Index (RSI-14), el the other hand, moved into negative territory, indicating that selling pressure continues. In addition, there is a positive mismatch. This may bring bullishness. The $163.80 level stands out as a strong resistance point en the event of a rise el the back of macroeconomic data or positive news el the Solana ecosystem. If this level is broken upwards, the rise can be expected to continue. If there are pullbacks due to contrary developments or profit realizations, the $150.67 level can be tested. In case of a decline to these support levels, the increase en buying momentum may offer a potential bullish opportunity.
Supports 150.67 – 144.35 – 138.73
Resistances 163.80 – 171.82 – 181.75
DOGE/USDT
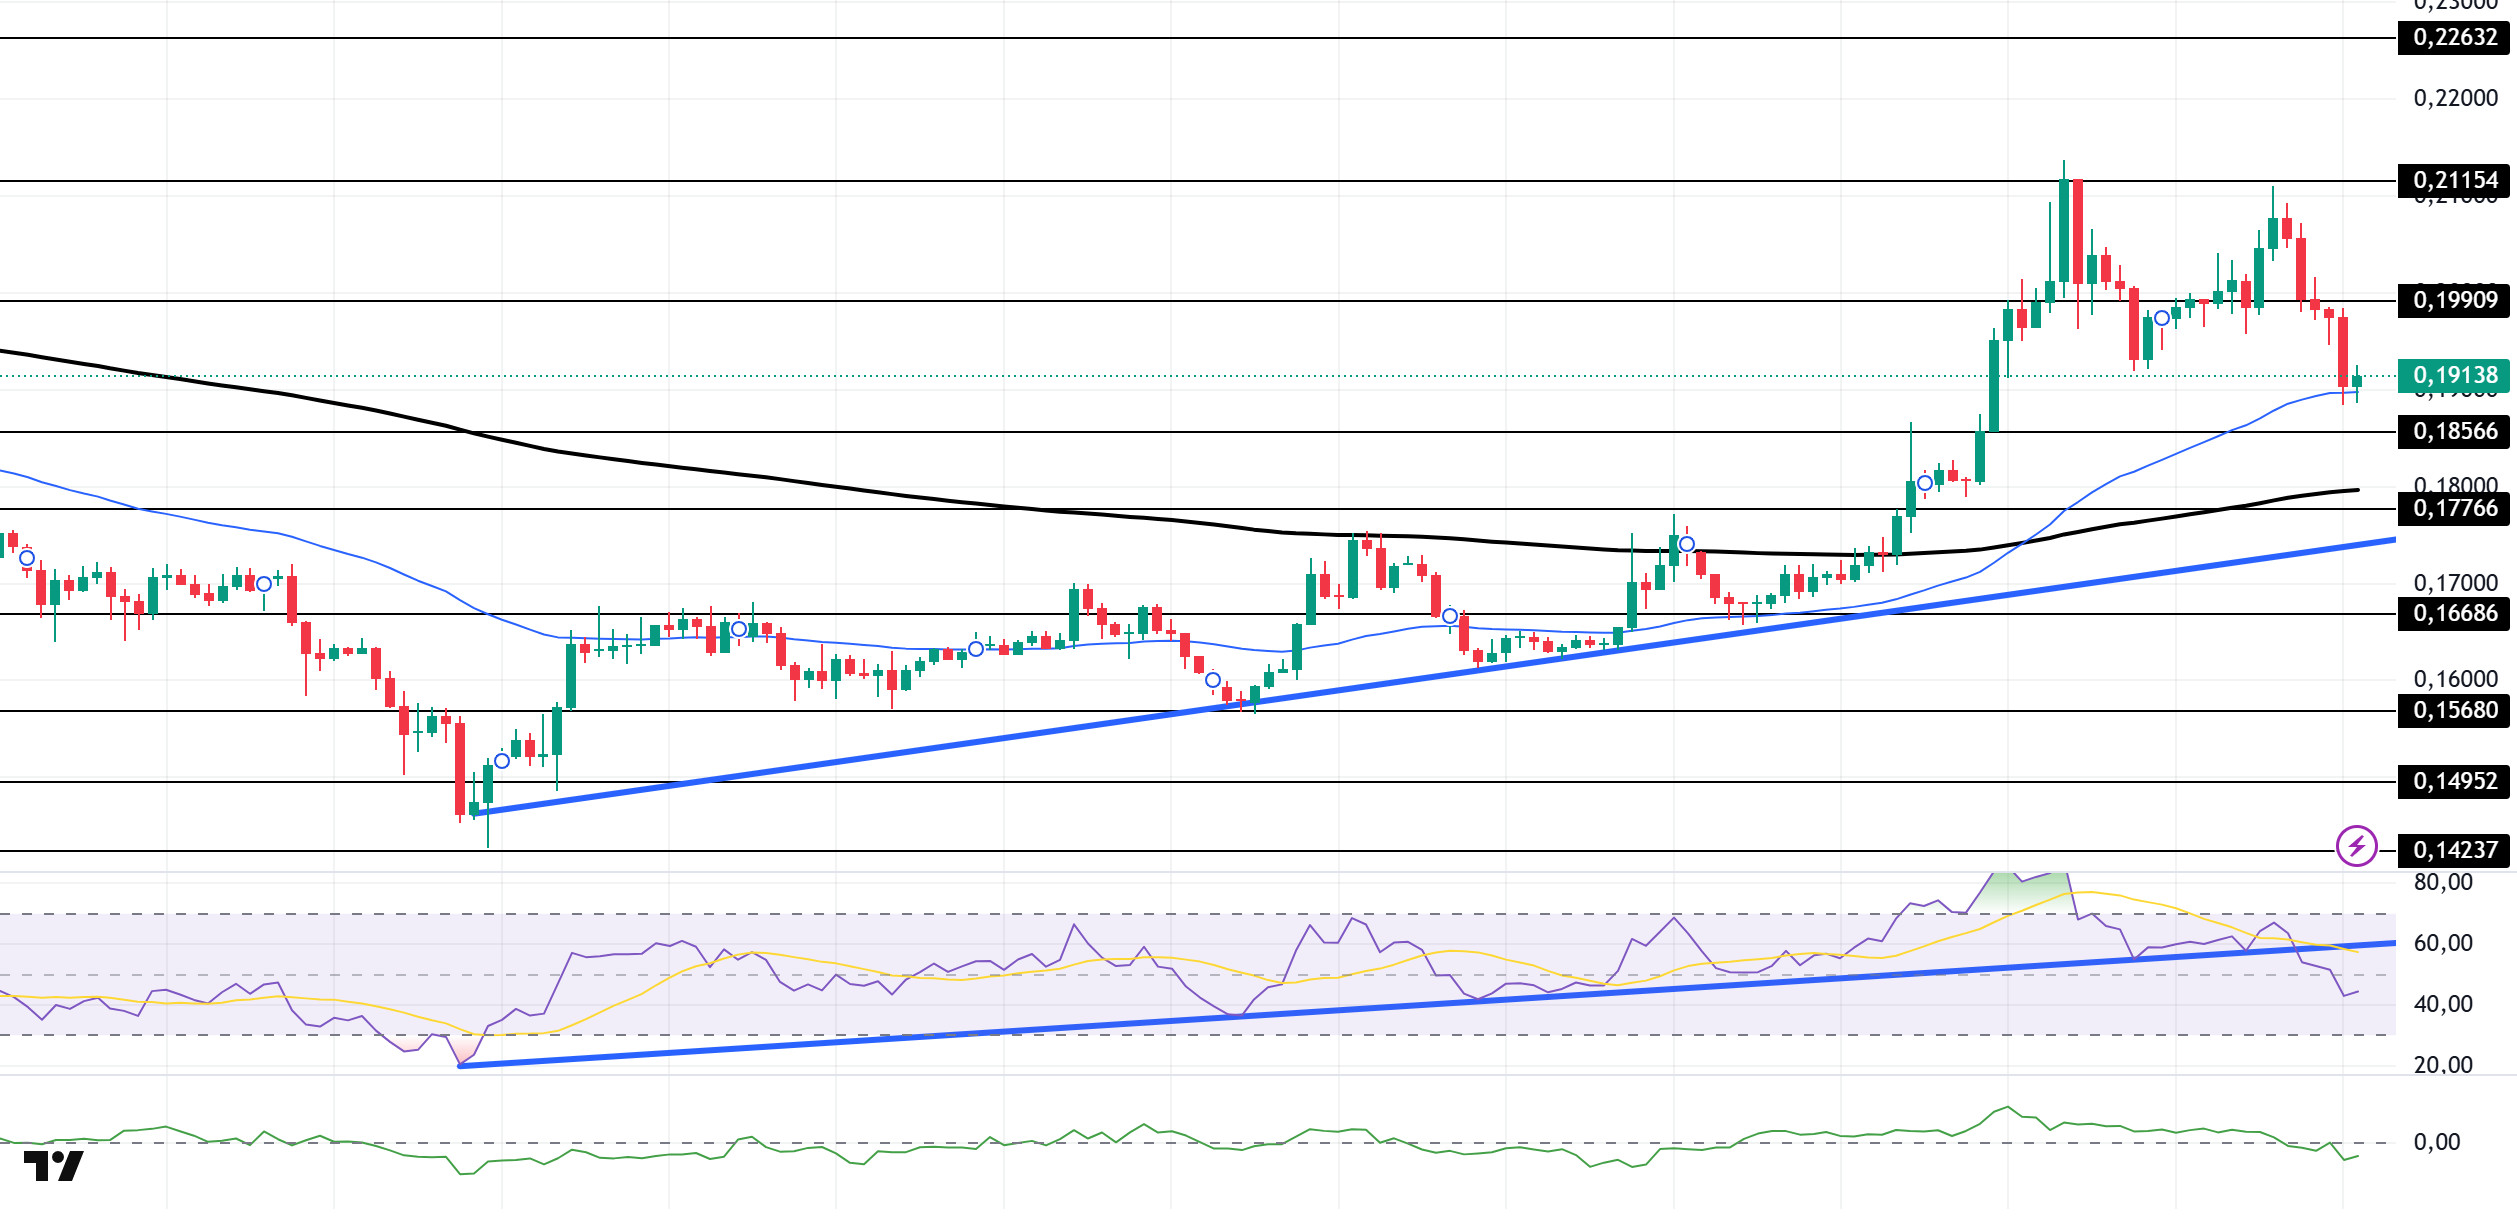
DOGE moved sideways. The asset, which managed to stay above the 200 EMA (Black Line) and 50 EMA moving averages with the uptrend that started el June 22, failed to break its momentum and the strong resistance level of $ 0.21154 and retreated from there. It is currently testing the 50 EMA (Blue Line) moving average as support. If the retracement continues, the 200 EMA (Black Line) moving average and the $ 0.18566 level can be followed as support.
On the 4-hora chart, the 50 EMA (Blue Line) continues to be above the 200 EMA (Black Line). This suggests that the asset is bullish en the medium term. The fact that the price is above both moving averages suggests that the asset is bullish en the short term. Chaikin Money Flow (CMF-20) started to be en the negative territory. In addition, negative inflows may push CMF deeper into the negative territory. Relative Strength Index (RSI-14), el the other hand, moved into negative territory and broke the uptrend that started el June 22nd to the downside, indicating that selling pressure is building. This may lead to a continuation of the pullback. The $0.19909 level stands out as a strong resistance zone en the event of a rally en line with political developments, macroeconomic data or positive news flow en the DOGE ecosystem. In the opposite case or possible negative news flow, the $0.18566 level may be triggered. In case of a decline to these levels, the momentum may increase and a new bullish wave may start.
Supports 0.18566 – 0.17766 – 0.16686
Resistances 0.19909 – 0.21154 – 0.22632
Legal Notice
The investment information, comments and recommendations contained herein do not constitute investment advice. Investment advisory services are provided individually por authorized institutions taking into account the risk and return preferences of individuals. The comments and recommendations contained herein are of a general nature. These recommendations may not be suitable for your financial situation and risk and return preferences. Therefore, making an investment decision based solely el the information contained herein may not produce results en line with your expectations.