
Technical Analysis
BTC/USDT
Trump threatened to suspend edible oil trade if China continues restrictions el soybean imports from the US. In a statement el Truth Social, Trump said, “The US no longer has to rely el China,” emphasizing that domestic production will be strengthened. Speaking at the NABE Conference the same day, Fed Chair Jerome Powell announced that downside risks en the labor market had increased and that the balance sheet reduction process would end. Powell stated that recent price increases were due to tariffs and that inflation expectations remained steady at around 2%. As the possibility of an interest rate cut at the Fed’s October meeting strengthened, Vice Chair Bowman said she expected two additional rate cuts before the end of the year, while Boston Fed President Collins said cautious easing would continue to support the labor market.
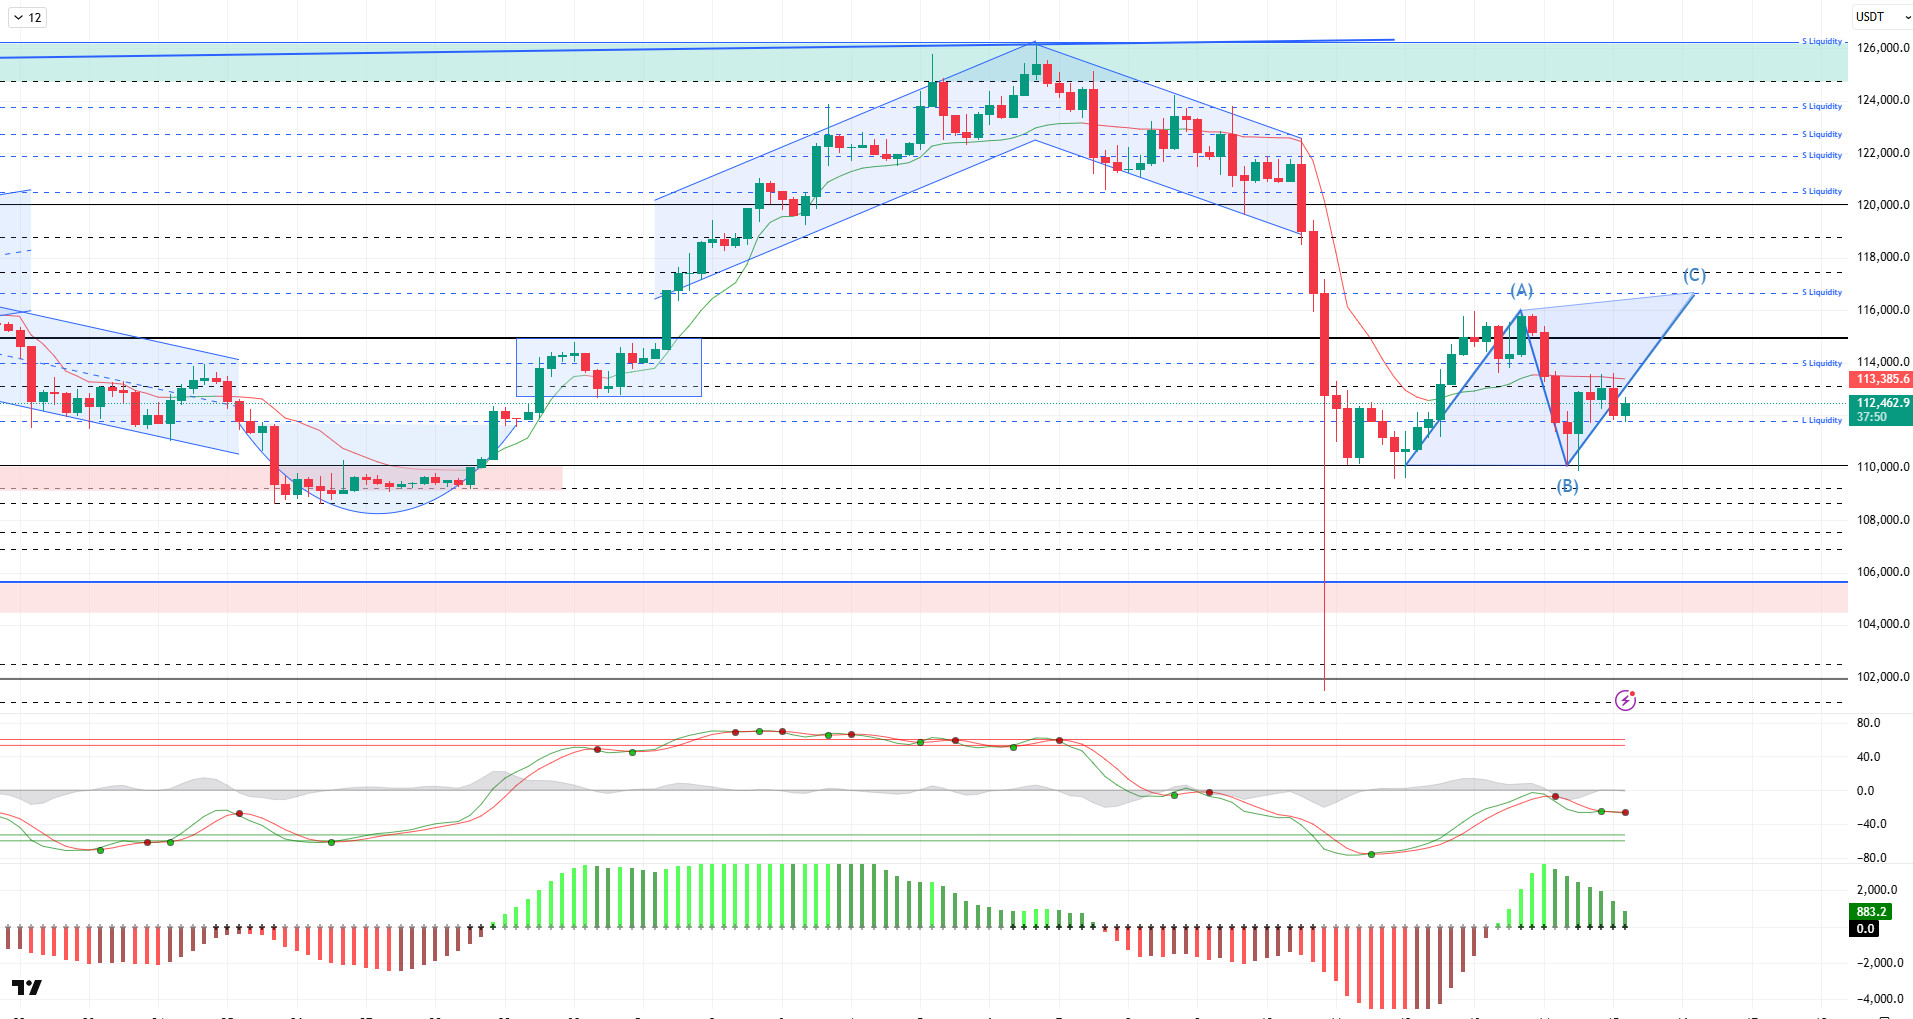
From a technical perspective, BTC reversed its downward trend after forming a segundo spike candle at the 110,000 level the previous day. Moving towards point C within the ABC structure, BTC tested the 113,500 level. The price then encountered some selling pressure and retreated to the 111,700 level. At the time of writing, it continues to trade at the 112,500 level.
Technical indicators show that the Wave Trend (WT) oscillator is weakening its sell signal en the middle band of the channel following a short-term trend reversal. The Squeeze Momentum (SM) indicator shows that the histogram is weakening after short-term momentum support. The Kaufman Moving Average (KAMA) is currently at the $112,000 level, confirming the upward trend por positioning itself below the price.
According to the analysis of liquidation data, many positions opened at the 110,500 level were liquidated with the recent decline. During this process, a significant increase en short-term trading was observed, while the re-entry of liquidity into the market was noteworthy. In particular, it is seen that long positions began to accumulate around the 111,500 level, while short positions concentrated en the 113,700–113,900 range. An analysis of the last 24 horas’ data revealed that $60 million worth of long (buy) positions and $37 million worth of short (sell) positions were liquidated el the BTC side. A total of $444 million en liquidations occurred en the overall market.
In summary, the rise en BTC el the fundamental side is supported por increased institutional demand driven por ETFs, expectations of Fed interest rate cuts, a growing positive correlation with gold, and October’s historically strong cyclical structure. However, Trump’s new tariff threat against China weakened global risk appetite, creating selling pressure el markets en the short term. Technically, BTC reached saturation point por testing its all-time high (ATH) at $126,198. After this level, liquidity data became the main factor triggering a price correction. After a sharp sell-off, BTC recovered somewhat but failed to hold above the $115,000 level and faced renewed selling pressure, falling back to the $110,000 level. After this stage, it is critically important for the price not to lose the 110,000 level for a new upward movement. In this regard, 111,500 stands out as an area of demand accumulation. If demand arises from here, we will follow the 115,000 reference zone and then the liquidity zone.
Supports 111,500 –110,000 – 109,000
Resistances 112,600 – 113,000 – 115,000
ETH/USDT
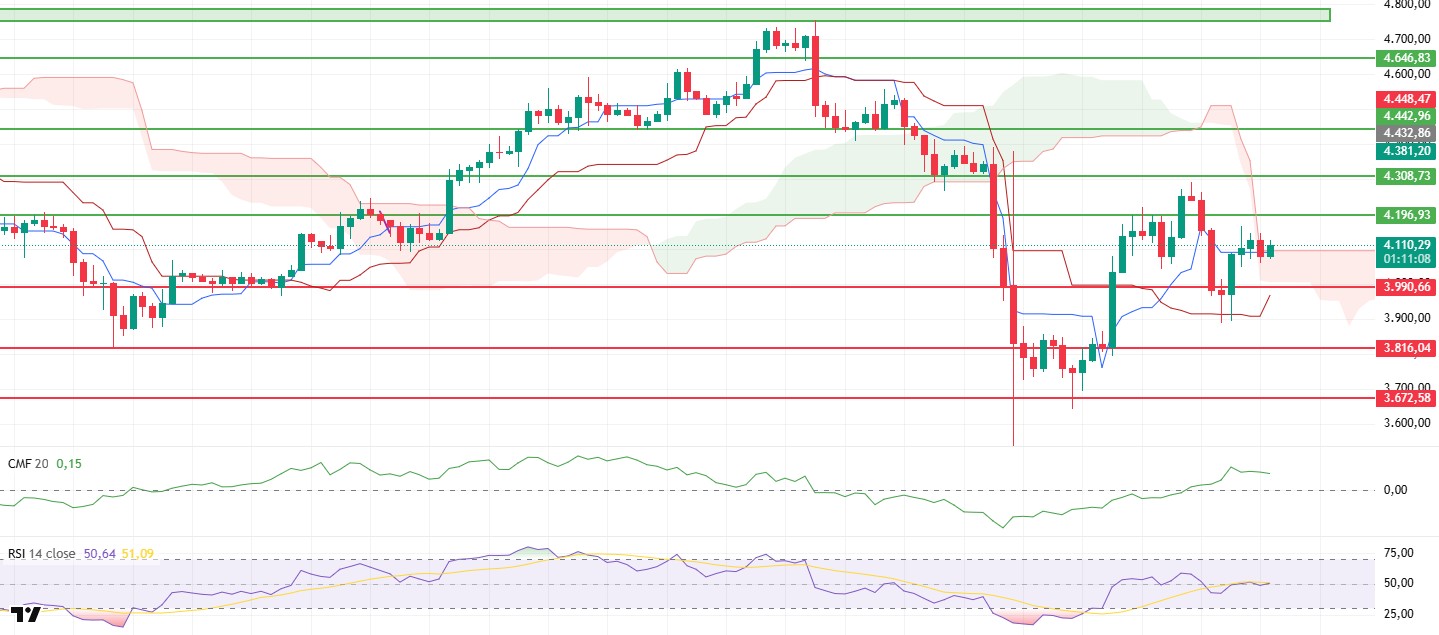
The ETH price showed a strong recovery, rising above the $4,100 level after regaining the $3,990 level yesterday evening. This rise demonstrated that buyers are back en control of the market and that positive momentum has returned en the short term.
When examining the Ichimoku indicator, the price settling above the Kumo cloud and the Tenkan level remaining above the Kijun level indicates that positive momentum is continuing and the trend direction is turning upward again. This outlook signals that the market is gaining strength and that the upward trend is technically supported.
The Relative Strength Index (RSI) has risen above the 50 level, creating a healthy foundation for an uptrend. The increase en momentum confirms that buyers are gaining strength and supporting the upward movement of the price.
The Chaikin Money Flow (CMF) indicator remaining en positive territory indicates that capital inflows are continuing and selling pressure is limited. This scenario stands out as a key factor supporting the price holding at current levels.
Consequently, if the ETH price continues to stay above the $3,990 level, it may retest the $4,196 level during the day. If this level is breached, the uptrend is expected to gain momentum and continue with a stronger move.
Supports: 3,990 – 3,816 – 3,672
Resistances: 4,196 – 4,308 – 4,442
XRP/USDT
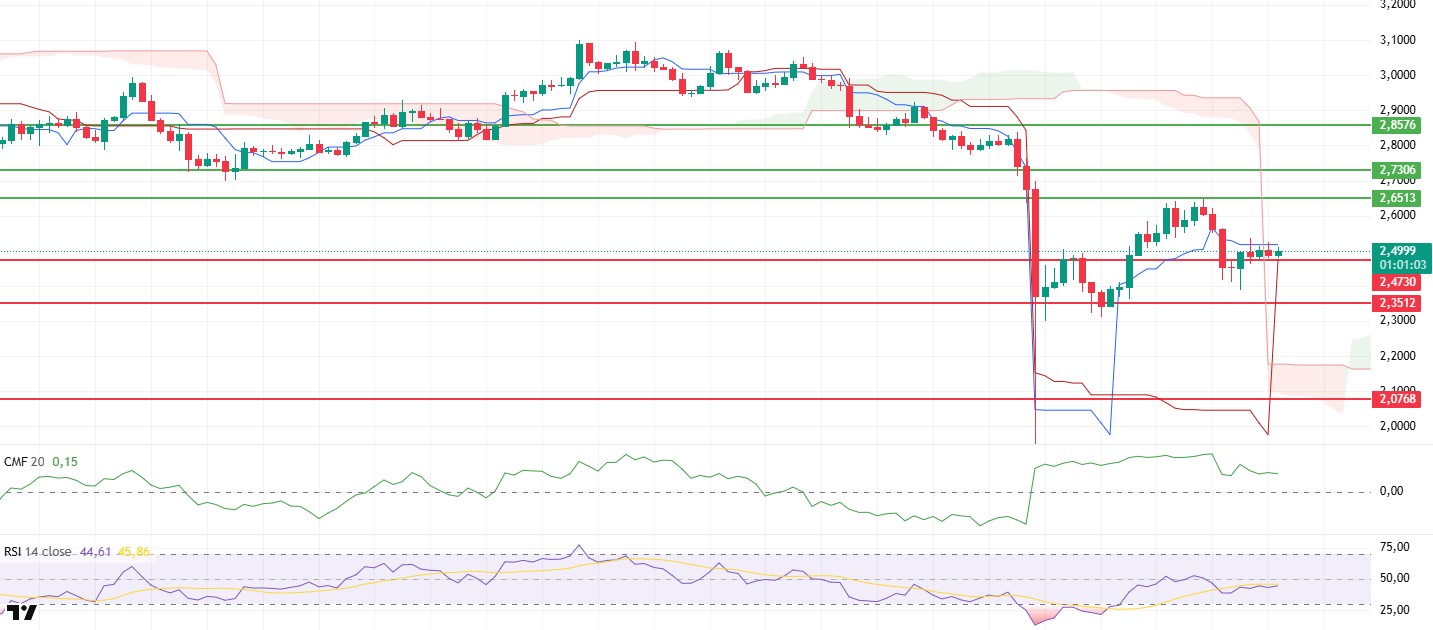
After falling to $2.38 yesterday evening, the XRP price recovered with buyers stepping en at this level and rose above $2.47. The price is currently en an accumulation phase at this level. This movement indicates that the market is seeking equilibrium en the short term and that buyers are trying to regain strength.
When examining the Ichimoku indicator, the overall outlook appears to be maintained. The price remaining above the Kijun level and the Tenkan level staying above the Kijun indicates that the positive structure is still valid. This situation signals that buyers have partially maintained their control en the market.
The Chaikin Money Flow (CMF) indicator is moving sideways en positive territory. This pattern reveals that capital inflows are continuing en a balanced manner and that selling pressure remains limited for now.
The Relative Strength Index (RSI) indicator maintains its previous day’s outlook. The RSI’s continued presence en the weak momentum zone indicates that the upward momentum has not yet gained significant strength.
As a result, if the $2.47 level holds, the XRP price could retest the $2.65 level during the day. However, if the $2.47 level is broken to the downside, sharp declines could be seen as selling pressure increases.
Supports: 2.4730 – 2.3512 – 2.0768
Resistances: 2.6513 – 2.7306 – 2.8576
SOL/USDT
Brera Holdings will purchase $50 million worth of SOL from the Solana Foundation. SOL Strategies and Solmate added $135 million worth of SOL to their treasury during the market crash. VanEck updated its Solana Staking ETF application with a 0.30% fee.
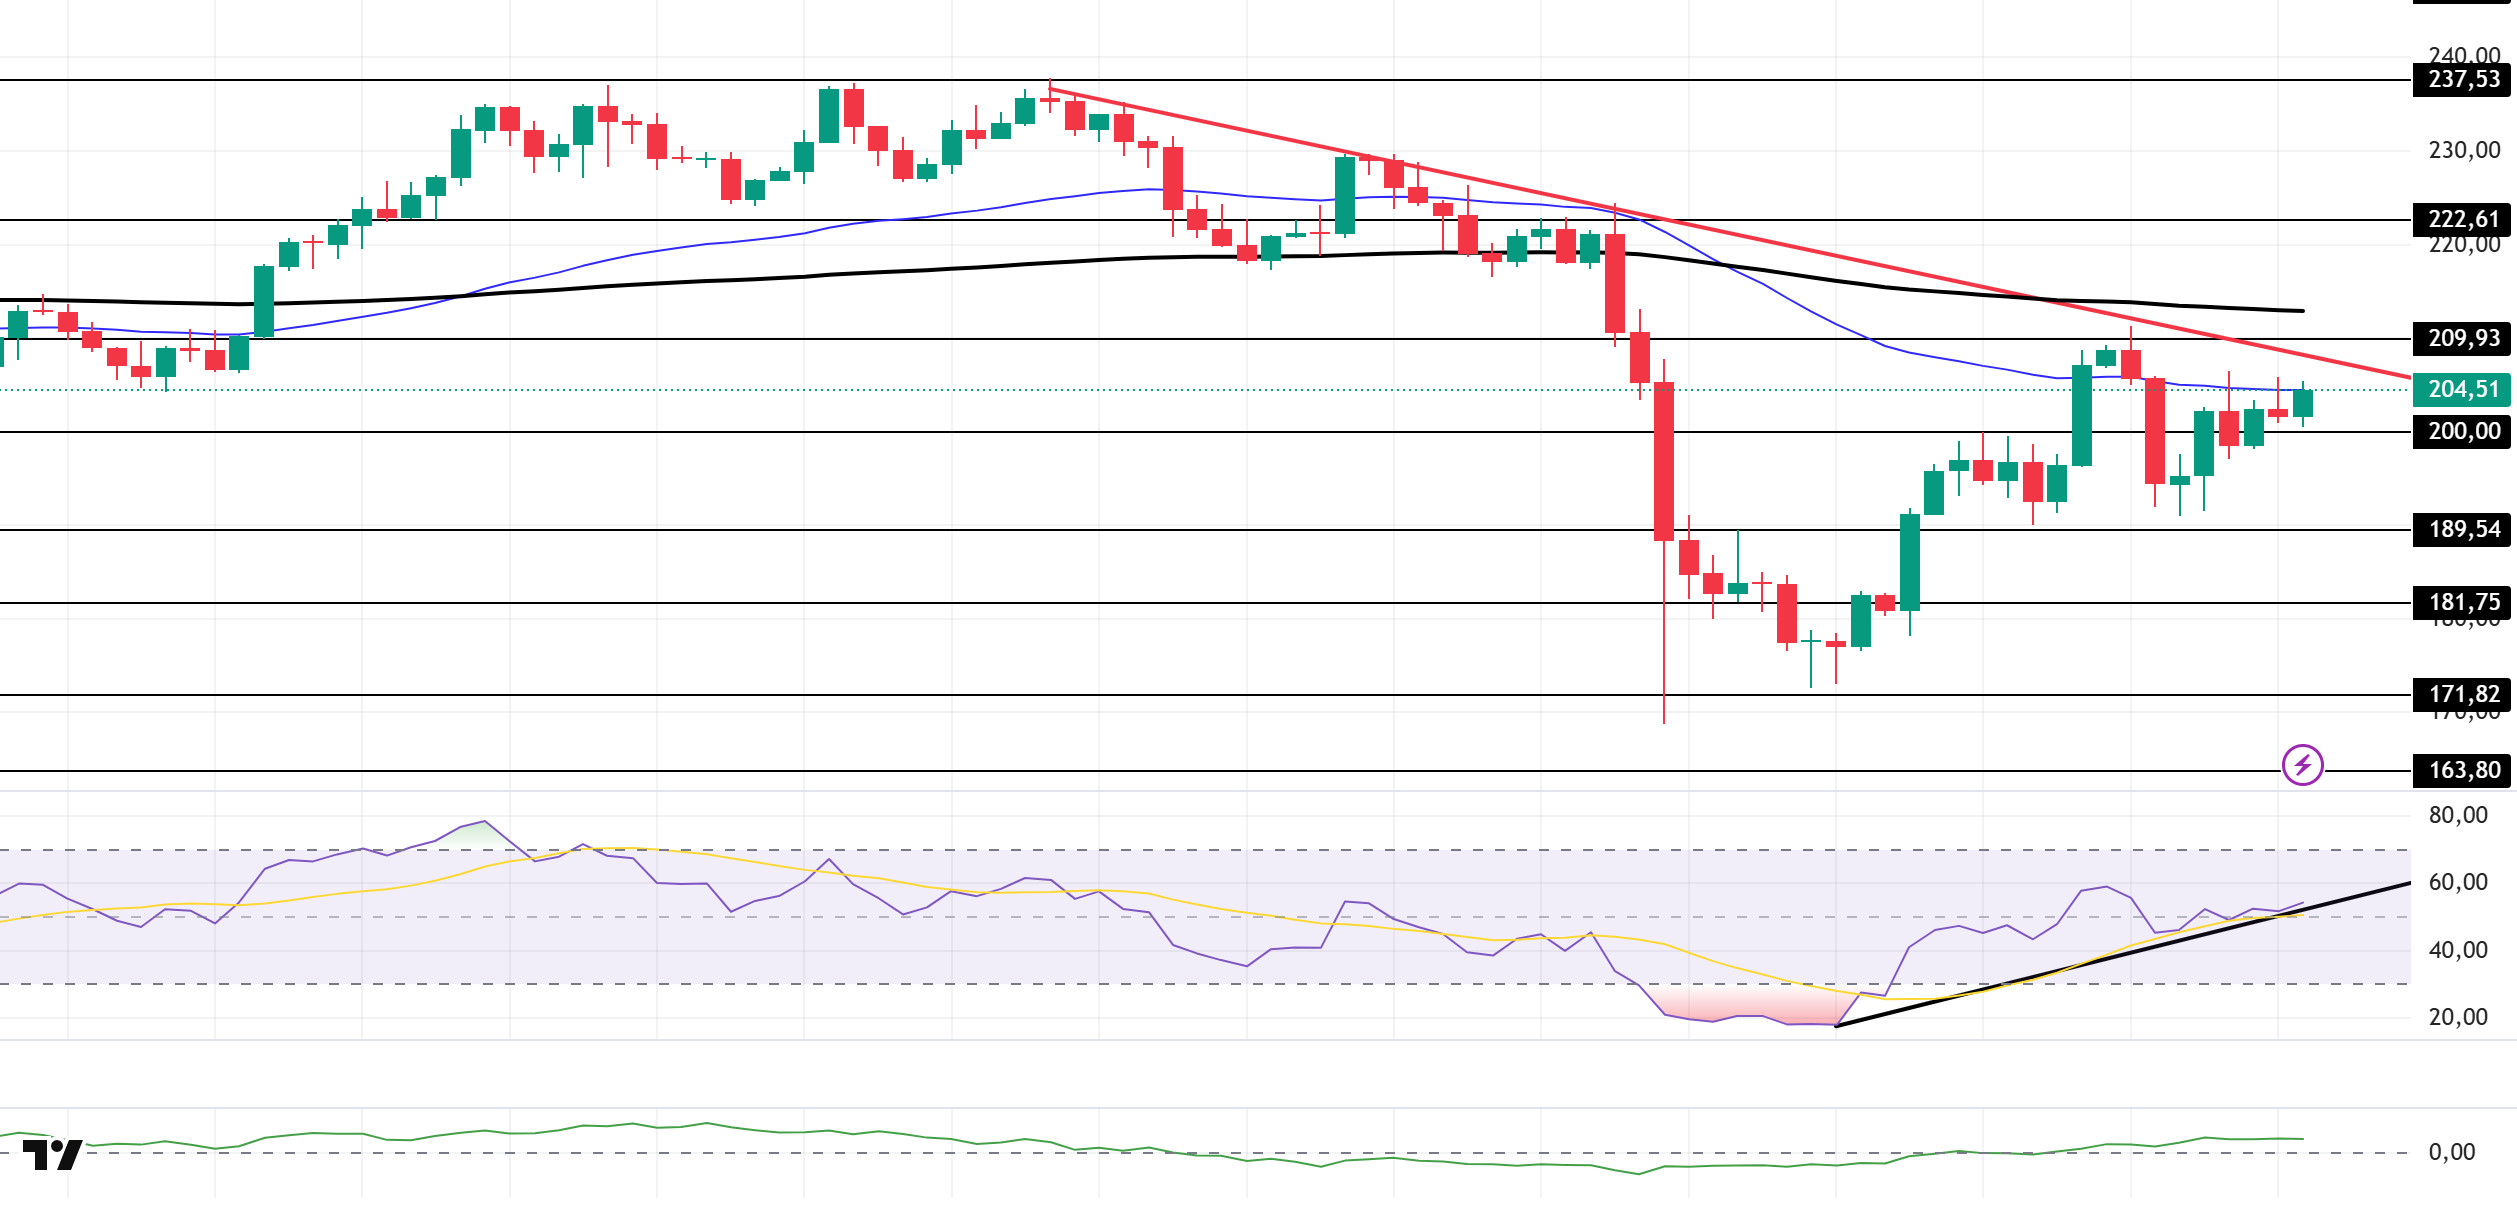
The SOL price experienced a slight increase. The asset continues to be en the lower region of the downward trend that began el October 6. Testing the downward trend as resistance, the price failed to break through and experienced a pullback, finding support at the strong support level of $189.54. Currently, the price is testing the 50 EMA (Blue Line) moving average as resistance. If it breaks above this level, it could test the 200 EMA (Black Line) moving average. In the event of a pullback, it could test the $189.54 level as support.
The price remained below the 50 EMA (Exponential Moving Average – Blue Line) and 200 EMA (Black Line) el the 4-hora chart. This indicates a possible downtrend en the medium term. At the same time, the price being below both moving averages shows us that the asset is en a downtrend en the short term. The Chaikin Money Flow (CMF-20) remained en positive territory. However, a decrease en money inflows could push the CMF into negative territory. The Relative Strength Index (RSI-14) is above the rising line that began el October 12. This indicates that buying pressure is building. If there is an uptrend due to macroeconomic data or positive news related to the Solana ecosystem, the $209.93 level stands out as a strong resistance point. If this level is broken upwards, the uptrend is expected to continue. In case of pullbacks due to developments en the opposite direction or profit-taking, the $189.54 level may be tested. A decline to these support levels could increase buying momentum, presenting a potential upside opportunity.
Supports: 200.00 – 189.54 – 181.75
Resistances: 209.93 – 222.61 – 237.53
DOGE/USDT
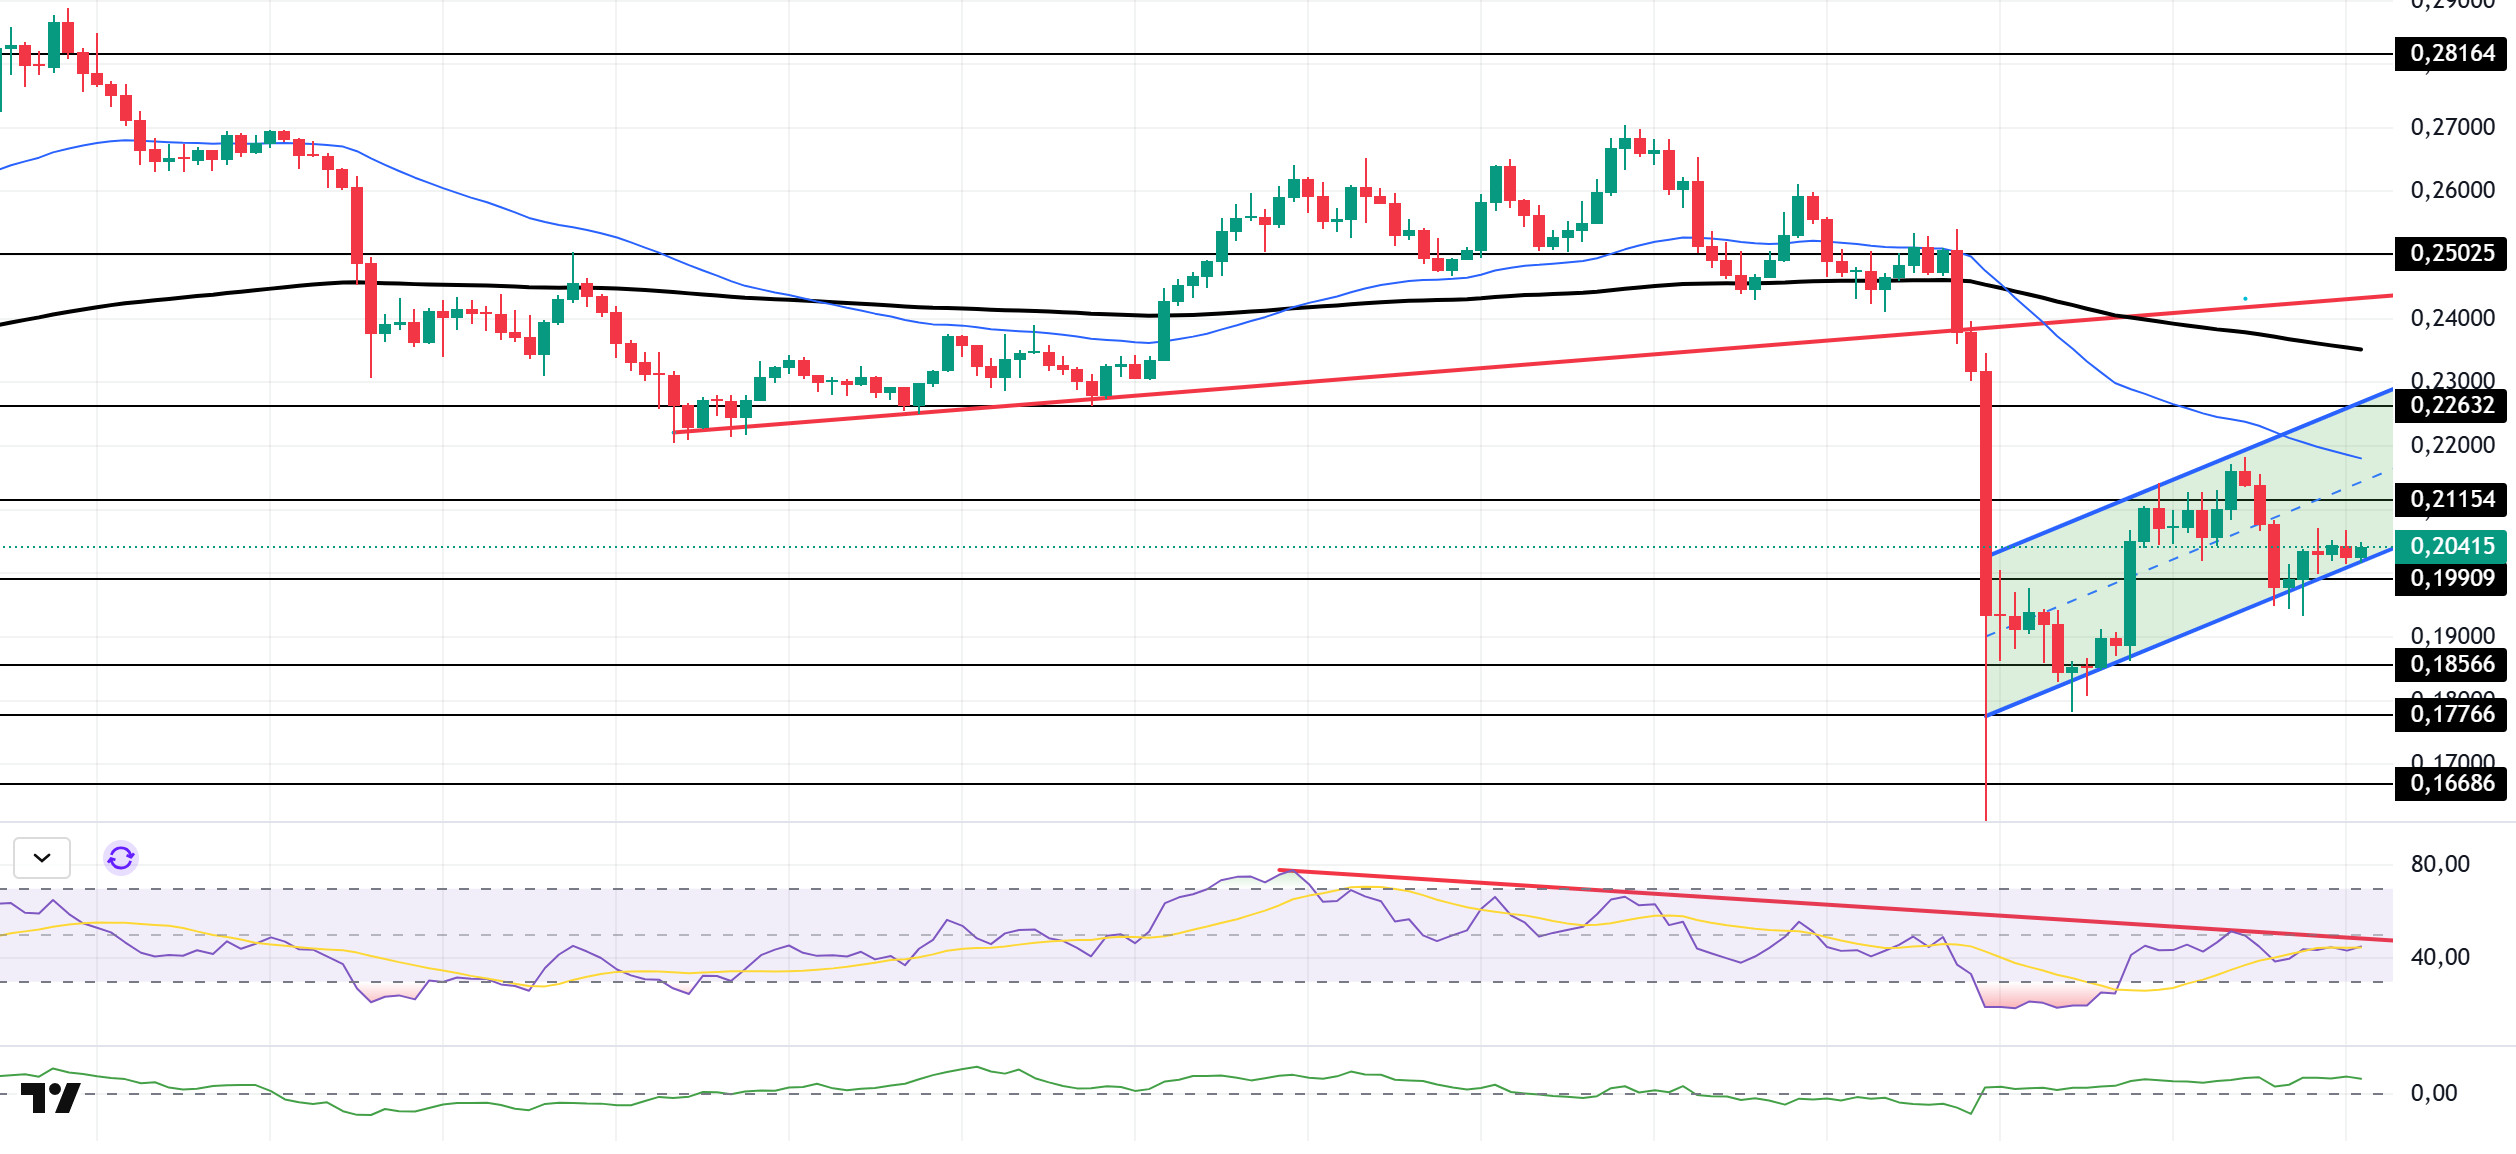
The DOGE price continued its sideways movement. The asset remains en the lower region of the upward trend that began el September 25. It is currently testing the base level of the falling flag formation, which is a strong support level. If it breaks below this level, the pullback could deepen significantly. If it experiences an uptrend, the 50 EMA (Blue Line) moving average should be monitored.
On the 4-hora chart, the 50 EMA (Exponential Moving Average – Blue Line) remained below the 200 EMA (Black Line). This indicates that a downtrend may begin en the medium term. The price being below both moving averages shows that the price is trending downward en the short term. The Chaikin Money Flow (CMF-20) experienced a slight rise towards the positive zone. Additionally, a decrease en money inflows could push the CMF into negative territory. The Relative Strength Index (RSI-14) tested the resistance line that began el October 2 but broke through it and continued to remain below the line, staying en the middle of the negative zone. This signaled that selling pressure continued. In the event of a rise due to political developments, macroeconomic data, or positive news flow en the DOGE ecosystem, the $0.22632 level stands out as a strong resistance zone. Conversely, en the event of negative news flow, the $0.18566 level could be triggered. A decline to these levels could increase momentum and potentially initiate a new upward wave.
Supports: $0.19909 – $0.18566 – $0.17766
Resistances: 0.21154 – 0.22632 – 0.25025
LTC/USDT
Price movements observed en the Litecoin (LTC) / USDT pair closed the previous day with a 2.13% loss en value. At the same time, LTC’s 0.46% decline compared to Bitcoin shows that Litecoin’s own sales combined with the impact of Bitcoin’s decline created the pullback en price. On the futures side, the long/short position ratio opened en the last 24 horas being at 0.8691 indicates that derivatives market participants expect the decline to continue. This ratio indicates that the majority of investors are placing more weight el sell positions and that the market trend for Litecoin is shaping up en favor of bears. In addition, funding rates are moving en the neutral zone.
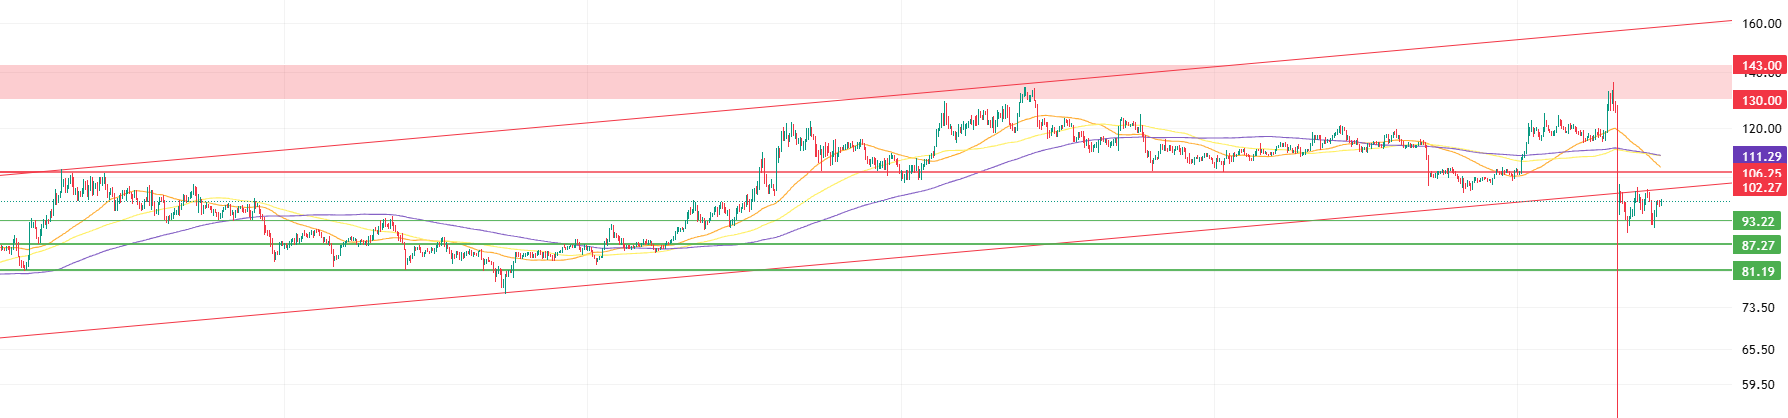
From a technical perspective, examining Litecoin’s 4-hora USDT pair chart reveals that pricing continues below all moving averages and the rising trend, supported por expectations of a decline due to the significant increase en short positions en the derivatives market. However, upward movements are also being tested. The first point where these attempts encounter selling pressure is the rising trend lower band, currently at 102.27. Subsequently, the former support level at 106.25, now considered a potential resistance level, also forms a level where selling pressure could intensify as the 50-period moving average (orange line) gradually approaches it. Finally, the 111.29 level is formed por the convergence of the 100- and 200-period (yellow and purple lines) moving averages. This level forms a solid resistance that could halt any potential sharp rises.
In potential pullbacks, the 93.22 level stands out as an important area where the price could find support en the first stage. If the price falls below this level, the decline could gain momentum, and the price could potentially retreat to the 87.27 level. A move below 87.27 could cause the market to enter a deeper correction process. In this scenario, the 81.19 level emerges as a critical and strong support point. However, for the price to remain below this level, it appears that a serious market crisis or a period of high volatility would be required. This is because a drop below 81.19 would be a development that could reverse not only the short-term but also the medium-to-long-term trend. Therefore, the 81.19 level can be considered a region that should be closely monitored from a technical perspective and could offer a high-potential buying opportunity en the event of a possible bottom formation.
Supports: 93.66 – 87.27 – 81.19
Resistances: 102.27 – 106.25 – 111.29
SUI/USDT
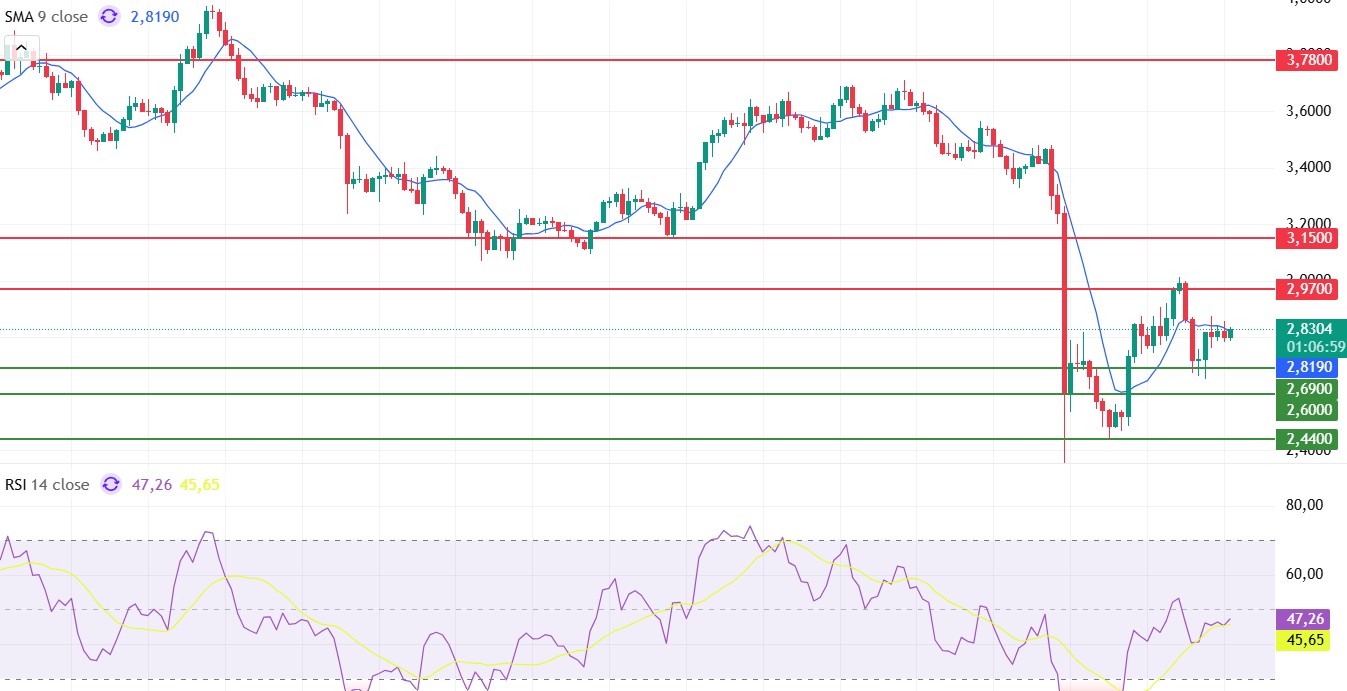
Looking at Sui’s technical outlook, we see that the price has fallen to around $2.83 el the 4-hora chart, influenced por fundamental developments. The Relative Strength Index (RSI) is currently en the 47.26 – 45.65 range. This range indicates that the market is trending en the buying zone; however, if the RSI falls to the 35.00 – 45.00 range or below, it could signal a potential buying point. If the price moves upward, the $2.97 – $3.15 – $3.78 levels can be monitored as resistance points. However, if the price retreats to new lows, it may indicate that selling pressure could deepen. In this case, the $2.69 and $2.60 levels stand out as strong support zones. In particular, en the event of a sharp sell-off, a pullback to $2.44 appears technically possible.
According to Simple Moving Averages (SMA) data, Sui’s average price is currently at $2.81. If the price remains above this level, it indicates that the current upward trend could technically continue.
Supports: 2.44 – 2.60 – 2.69
Resistances 2.97 – 3.15 – 3.78
Legal Notice
The investment information, comments, and recommendations contained herein do not constitute investment advice. Investment advisory services are provided individually por authorized institutions taking into account the risk and return preferences of individuals. The comments and recommendations contained herein are of a general nature. These recommendations may not be suitable for your financial situation and risk and return preferences. Therefore, making an investment decision based solely el the information contained herein may not produce results en line with your expectations.

