
BTC/USDT
The focus en global markets has shifted to the Fed’s interest rate decision; expectations are that the Fed will pause its rate cut cycle and that a clear decline en inflation to 2% or a significant deterioration en the labor market will be required for a new step. On the geopolitical front, the US stepping up military readiness exercises en the Middle East and Iran-related risks pushing up energy and gold prices have reignited risk aversion. Trump’s statement that he is satisfied with the dollar’s current level and could tolerate limited weakness put pressure el the dollar, while ongoing negotiations en Washington to prevent a government shutdown kept political uncertainty alive. On the digital assets front, US officials investigating the use of cryptocurrency en funds linked to the Maduro regime signaled a period where crypto increasingly intersects with national security and sanctions issues.
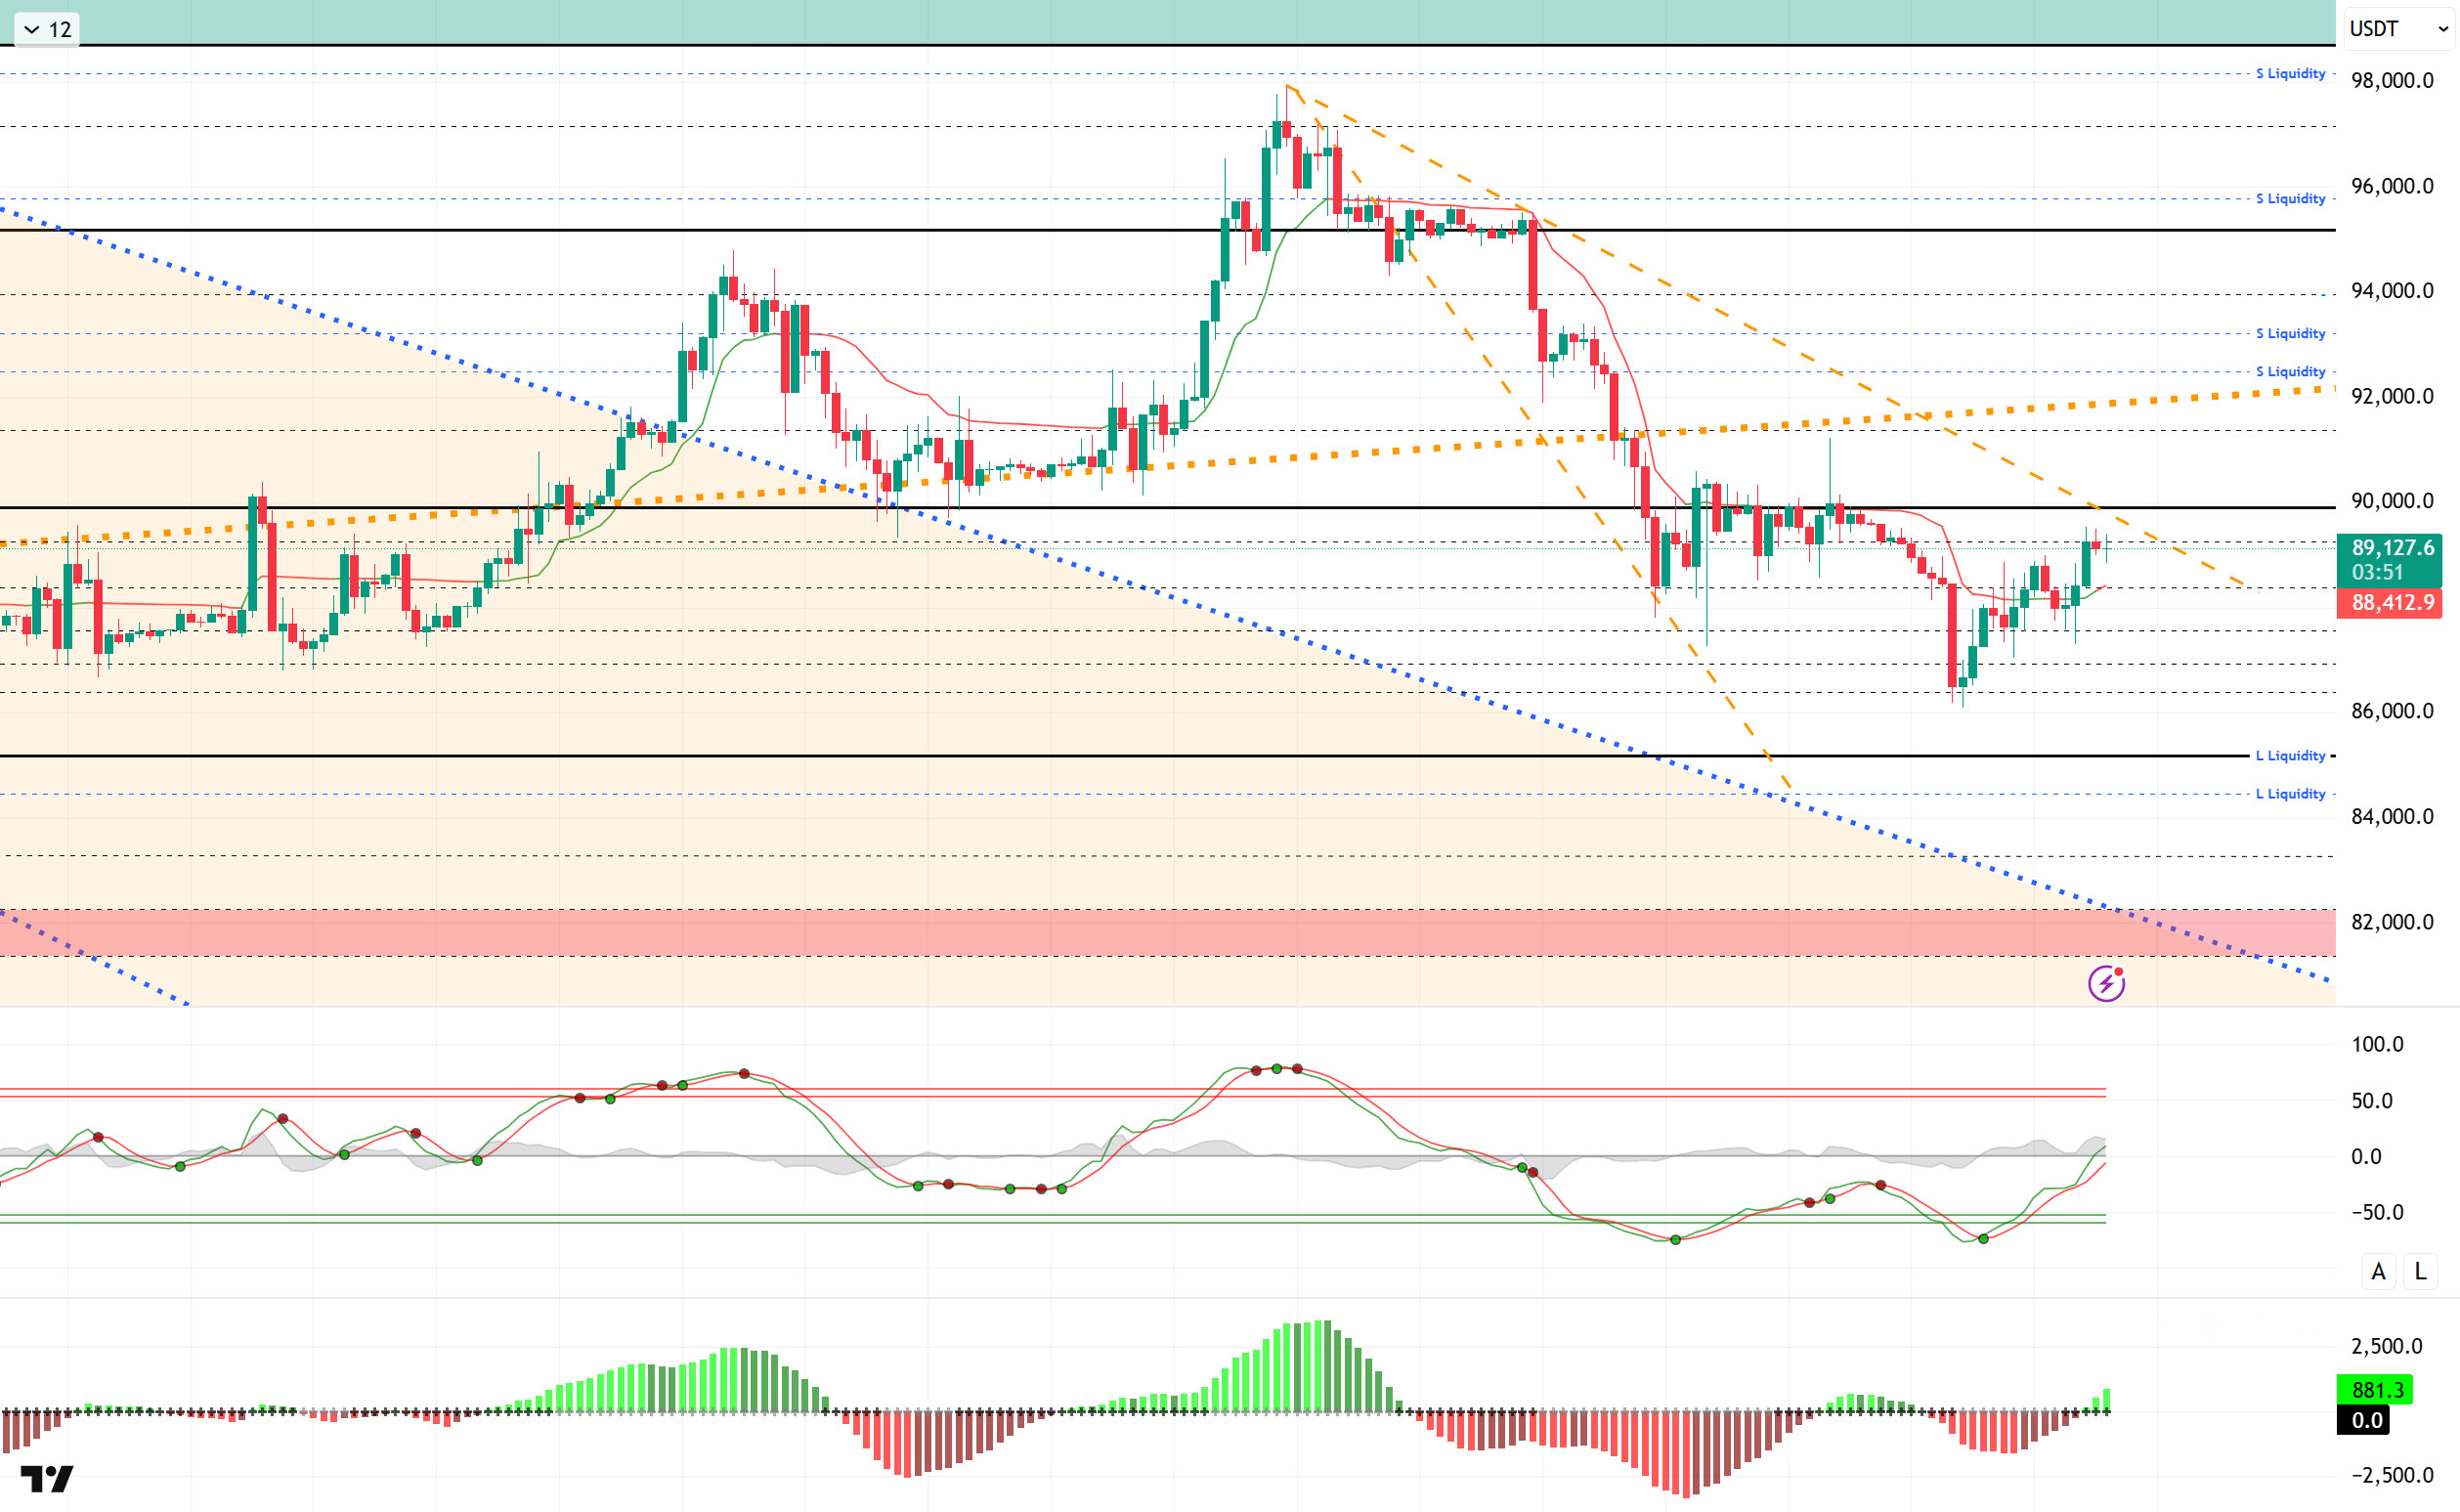
From a technical perspective, BTC, which was slightly bearish en the previous analysis, gained upward momentum later en the day. Continuing its movements within the downward trend it had formed, the price reached the upper line of the minor downward trend with this movement. BTC, which has started to challenge the critical 90,000 level again, may signal a new trend if this level is broken. In this context, breaking through the major rising trend line, which previously acted as support and resistance, could increase upward momentum. Otherwise, rejection from the 90,000 level could deepen selling pressure once again.
Technical indicators show that the Wave Trend (WT) oscillator continues to sustain its buy signal, reaching the middle band of the channel. The histogram el the Squeeze Momentum (SM) indicator has once again moved into positive territory. The Kaufman Moving Average (KAMA) is currently trading below the price level at $88.433.
When examining liquidation data, the buy level has once again gained intensity at the 86,000 – 87,000 level with the recent rise. In contrast, while the entire concentration formed en the short term at the 88,000 – 89,000 band has been liquidated, the next short-term liquidity area stands out at 89,000 – 90,000. In the long term, positions above the 90,000 level continue to accumulate.
In summary, while the Fed remains the focus of the markets, interest rates are expected to remain unchanged. As negotiations continue regarding the US government shutdown, Trump’s comments el the dollar drew attention. In the Middle East, military exercises continue to escalate geopolitical tensions, while the use of cryptocurrency en Maduro’s funds is under investigation.Looking at liquidity data, the recent rise has once again intensified buying levels, while short-term trades continue to be targeted at selling levels. Technically, BTC started the new year with positive momentum, but after testing the 98,000 level, it fell back to the 86,000 level under renewed selling pressure following profit-taking at . The price, which lost the minor upward channel it had formed, confirmed the decline with the falling flag seen en its structure. From this point el, the 85,000 level will be monitored as a reference zone, while en the event of a recovery, 89,000 will be monitored as resistance and 90,000 as a critical reference zone.
Supports: 87,500 – 86,000 – 85,000
Resistances: 89,000 – 90,000 – 91,400
ETH/USDT
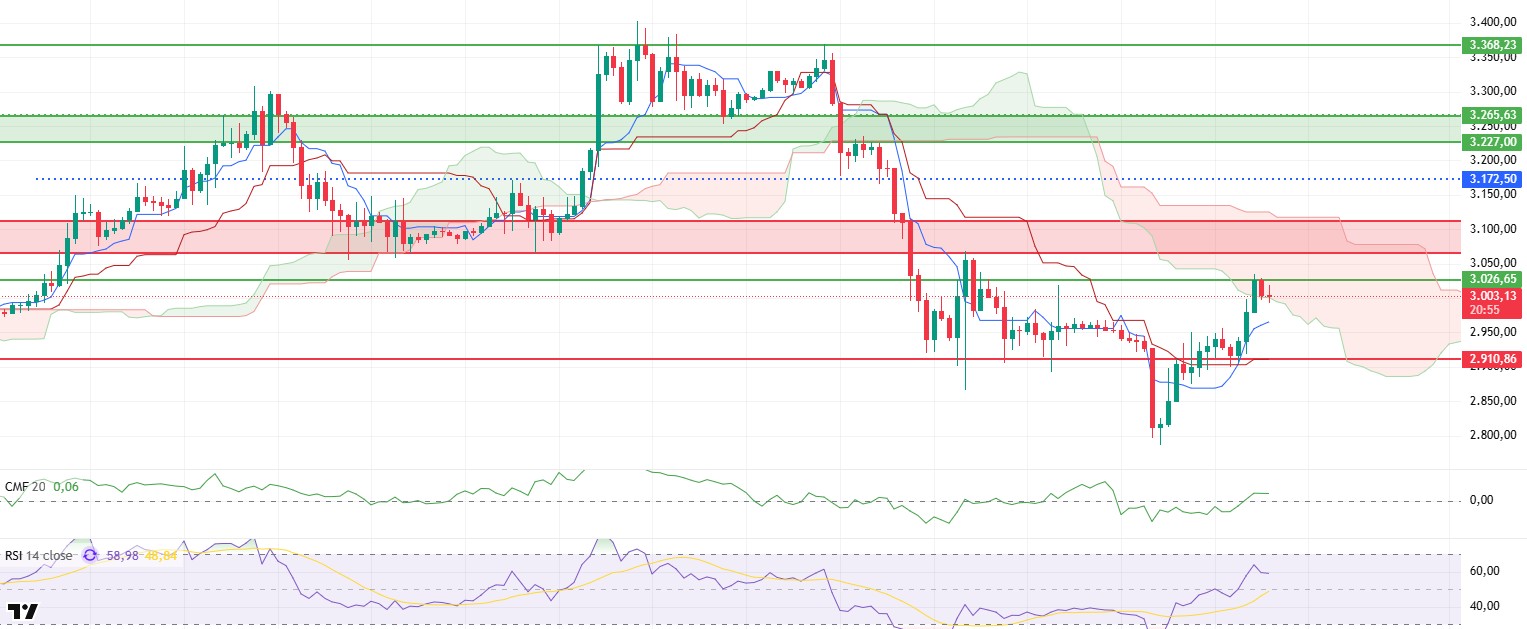
The ETH price received two strong rebounds from the $2,910 support zone yesterday evening and gained upward momentum, rising to the $3,026 resistance level. At this point, selling pressure kicked en, pulling the price back down to the $3,000 range. While the strength of the rebound is noteworthy, the selling pressure at the resistance zone indicates that buyers have not yet fully taken control.
There is a noticeable improvement en liquidity compared to the previous chart. Chaikin Money Flow (CMF) has moved into positive territory, indicating increased cash inflows into the market. This outlook shows that the upward attempt is not limited to price movement alone and is also supported el the spot side. If the CMF maintains its position en the positive zone, upward attempts may progress more healthily.
Strengthening momentum is clearly felt. The Relative Strength Index (RSI) has risen to 64 levels, indicating that buyers have regained momentum. However, the ongoing negative divergence el the RSI has not completely eliminated the risk of the upward movement slowing down. Momentum is strong, but a cautious approach is still warranted.
The Ichimoku indicator presents a more positive outlook. The price remains above the Tenkan and Kijun levels while entering the kumo cloud. This structure supports a positive outlook en the short term. However, to say that the main trend has turned positive, the upper band of the kumo cloud at the $3,119 level must be clearly broken.
In the overall assessment, the upward scenario is still el the table. If the price remains within the $3,026 level and the resistance area marked en red el the chart during the day, upward attempts are expected to continue. Conversely, if the $3,000 level is lost, the $2,910 support level is likely to come back into focus, also influenced por the negative divergence en the RSI ( ). Therefore, the price reaction en the $3,000–3,026 range en the short term will be decisive en terms of direction.
Supports: 2,910 – 2,727 – 2,625
Resistances: 3,026 – 3,111 – 3,227
XRP/USDT
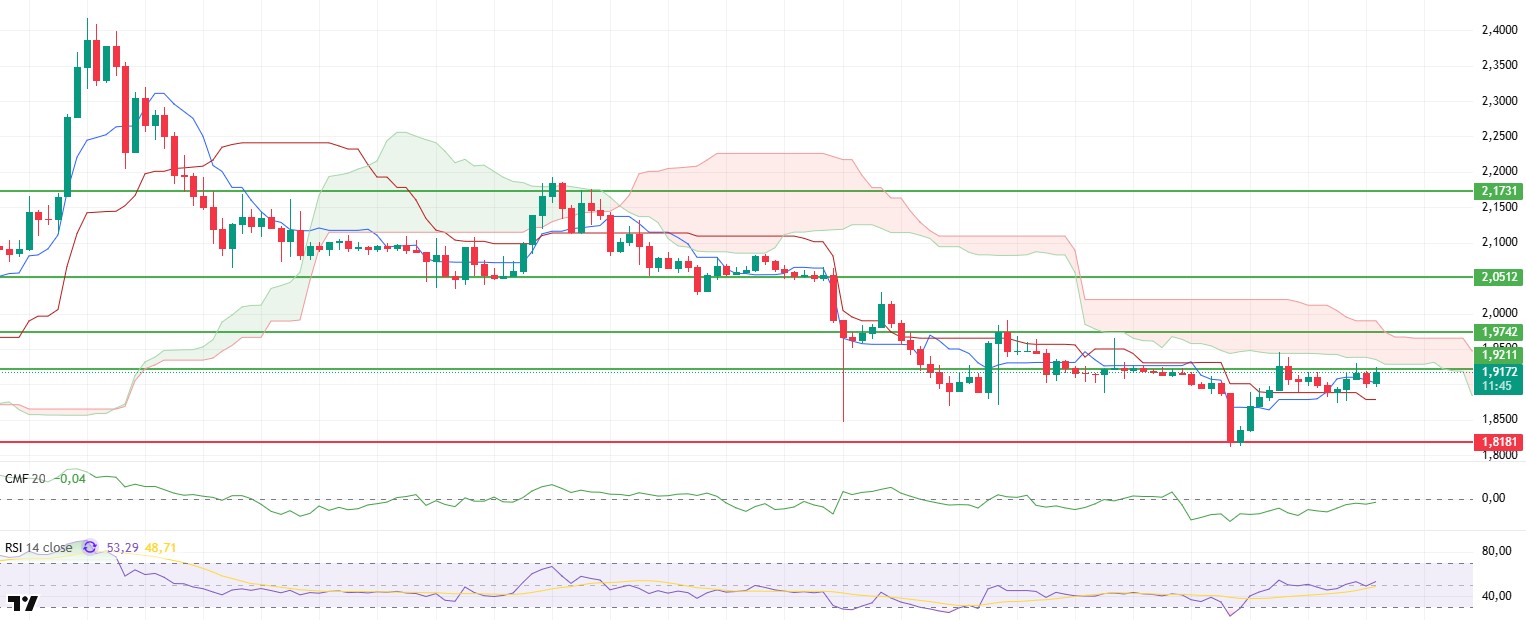
The XRP price attempted to break through the key resistance level of $1.92 yesterday evening, but this effort was unsuccessful. With the resulting sell-off, the price retreated again and is currently attempting to stabilize around the $1.9161 level. The failure to sustain momentum at the resistance level indicates that buyers remain cautious and upward demand remains limited.
Chaikin Money Flow (CMF) remains en negative territory despite its upward movement. This suggests that selling pressure is beginning to ease, but a strong influx of money to support the rally has not yet materialized. Upward movements are likely to remain fragile until liquidity moves into positive territory.
The picture is more balanced el the momentum front. The Relative Strength Index (RSI) continues to stay above the 50 level, indicating that buyers have not completely disappeared en the short term. While the RSI holding en this zone limits the risk of a sharp decline, it also highlights the need for additional strength for the uptrend to gain momentum.
Technically, the Ichimoku indicator shows that the short-term improvement is being maintained. Although the price is trading above the Tenkan and Kijun levels, it remains below the kumo cloud. This structure indicates that even though it produces short-term positive signals, the main trend is still weak and upward movements need confirmation.
In the overall assessment, the main threshold remains at the $1.92 level. Unless this area is clearly surpassed, upward attempts are expected to remain limited and the price is expected to exhibit a volatile structure. If sustainability is achieved above $1.92 ( ), the upward movement area may expand. In the opposite scenario, the current weak outlook will be maintained and downward risks will remain el the agenda.
Supports: 1.8181 – 1.7705 – 1.6224
Resistances: 1.9211 – 1.9742 – 2.0512
SOL/USDT
MNT launched el Solana via the Mantle Super Portal.
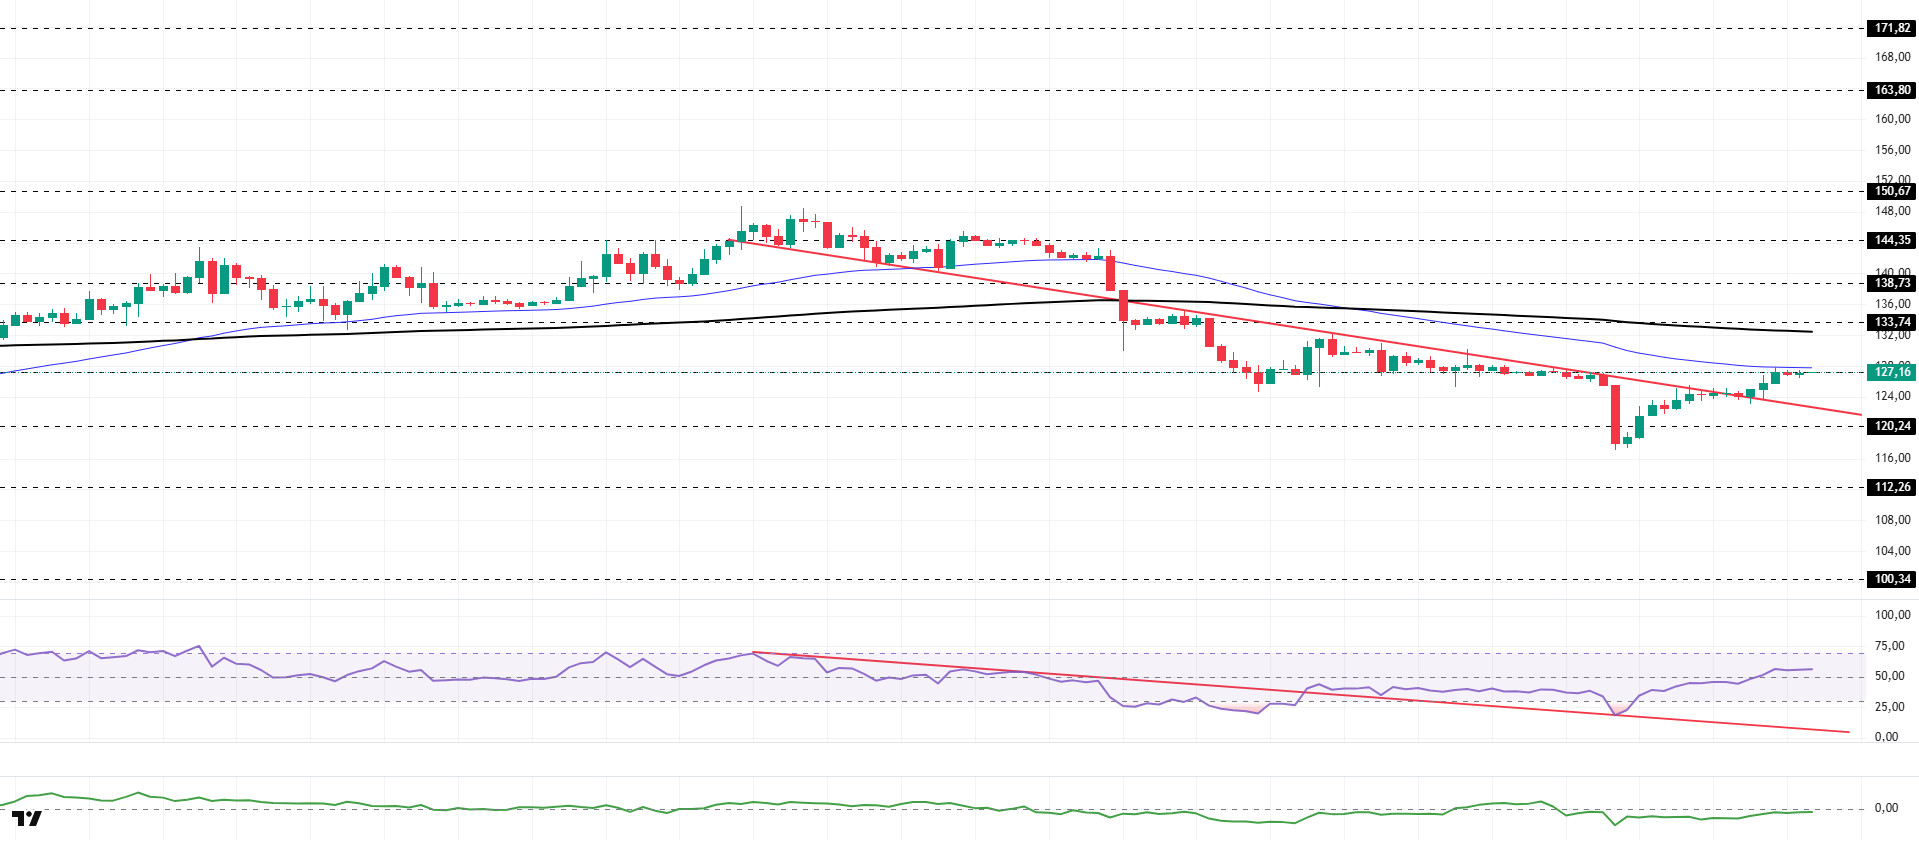
The SOL price showed an upward trend. The asset moved to the upper region of the downward trend that began el January 13, signaling buying pressure. Testing the strong support level of $120.24, the asset gained momentum and rose from there. Currently testing the 50 EMA (Blue Line) moving average as resistance, the asset could test the 200 EMA (Black Line) moving average as resistance if the uptrend continues. In the event of a pullback, the descending trendline should be monitored as support.
On the 4-hora chart, the 50 EMA (Exponential Moving Average – Blue Line) continues to remain below the 200 EMA (Black Line). This situation indicates that a downtrend may begin en the medium term. At the same time, the price being below both moving averages shows that the asset is trending downward en the short term. The Chaikin Money Flow (CMF-20) remained en negative territory. However, the decrease en money inflows could pull the CMF deeper into negative territory. The Relative Strength Index (RSI-14) rose from near the neutral level en negative territory to the middle of positive territory. At the same time, it remained en the upper region of the downward trend that began el January 14. This signaled the formation of buying pressure. If there is an increase due to macroeconomic data or positive news related to the Solana ecosystem, the $150.67 level stands out as a strong resistance point. If this level is broken upwards, the increase is expected to continue. If there are pullbacks due to developments en the opposite direction or profit-taking, it could test the $112.26 level. A decline to these support levels could increase buying momentum, presenting a potential upside opportunity.
Supports: 120.24 – 112.26 – 100.34
Resistances: 127.21 – 133.74 – 138.73
DOGE/USDT
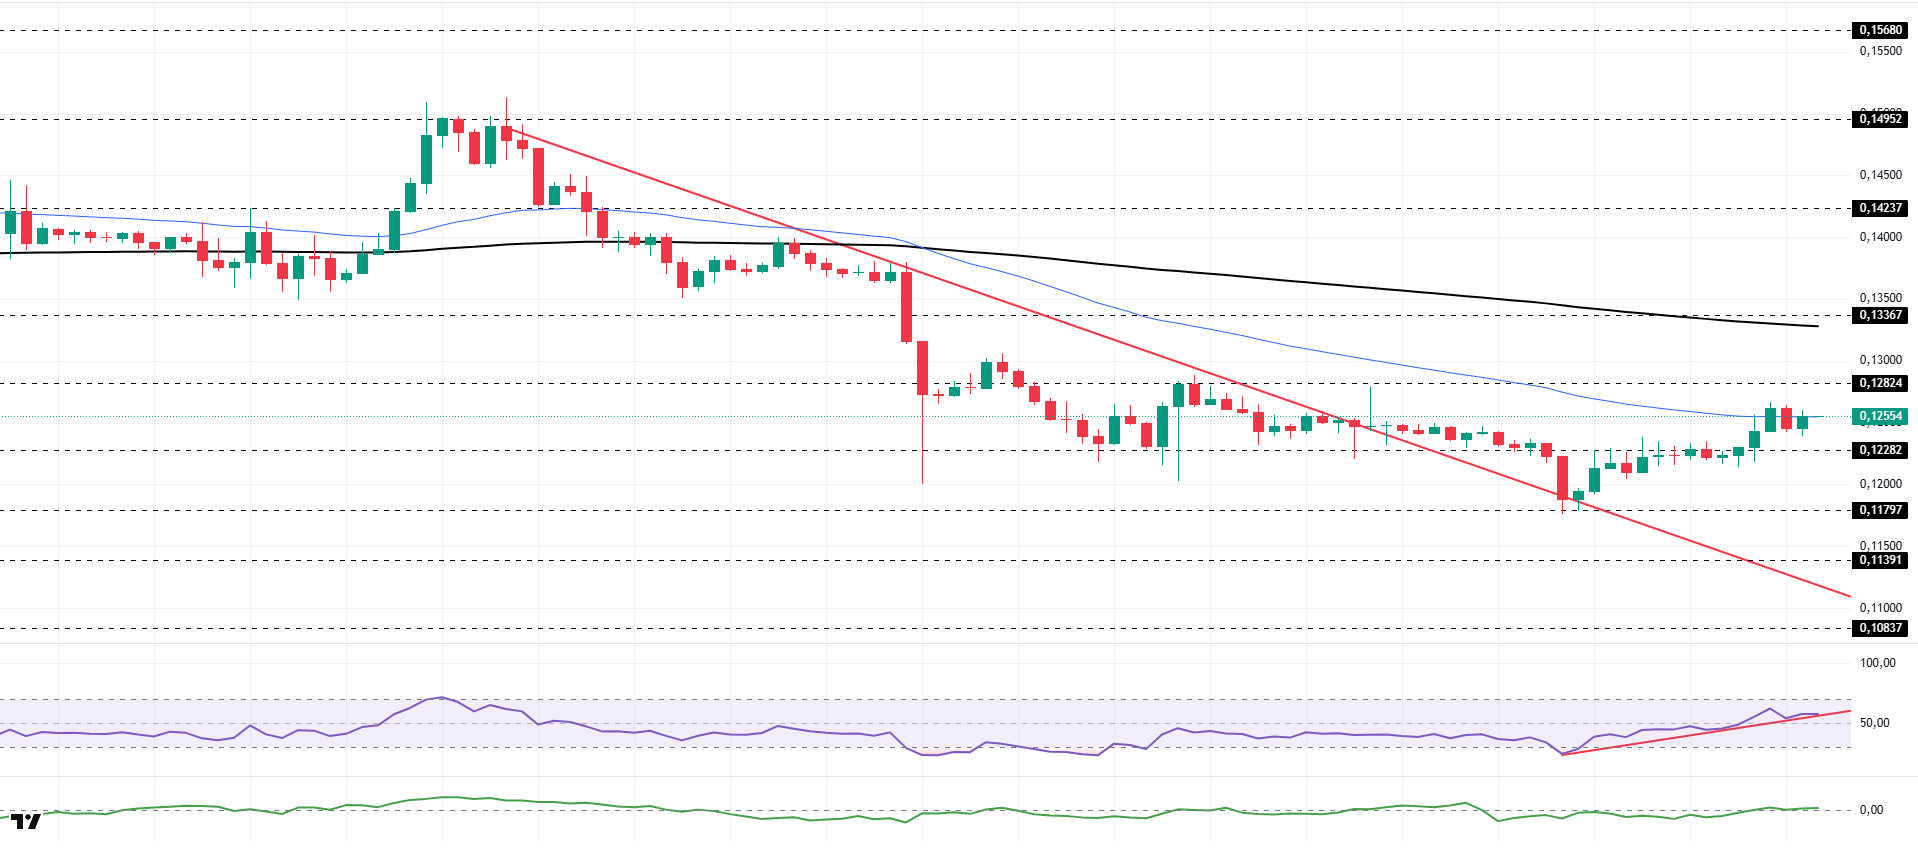
The DOGE price experienced an uptrend. The asset remained en the upper region of the downtrend that began el January 14, signaling buying pressure. Breaking above the strong resistance level of $0.12282, the asset is currently testing the 50 EMA (Blue Line) moving average as resistance. Above this level, the 200 EMA (Black Line) moving average could act as resistance if the price closes above it. In the event of a pullback, the $0.12282 level could be tested as support.
On the 4-hora chart, the 50 EMA (Exponential Moving Average – Blue Line) remained below the 200 EMA (Black Line). This indicated that a medium-term downtrend was forming. The price being below both moving averages indicates that the price may be trending downward en the short term. Chaikin Money Flow (CMF-20) moved into positive territory. Additionally, a decrease en money inflows could pull CMF back into negative territory. The Relative Strength Index (RSI-14) rose from near the neutral level en the negative zone to the middle level en the positive zone. At the same time, it remained en the upper zone of the line that began el January 25. These indicate that buying pressure has formed. In the event of potential increases driven por political developments, macroeconomic data, or positive news flow within the DOGE ecosystem, the $0.13367 level stands out as a strong resistance zone. Conversely, en the event of negative news flow, the $0.11391 level could be triggered. A decline to these levels could increase momentum and initiate a new wave of growth.
Supports: 0.12282 – 0.11797 – 0.11391
Resistances: 0.12824 – 0.13367 – 0.14237
TRX/USDT
Tron Inc. announced en a post this morning that it purchased 169,632 TRX at an average price of $0.29, bringing its total holdings to over 678.6 million TRX. The company stated that it aims to further increase its Tron holdings to boost its share value en the long term.
As of January 27, 2026, the total amount of TRX staked is 45,984,951,826, representing 48.55% of the circulating supply. Compared to the previous day, there has been an increase of approximately 0.03% en the amount staked. Meanwhile, the market value of TRX has reached $27.9 billion. Furthermore, a total of 3,501,192 TRX was burned yesterday, and a net 402,280 TRX was added to the circulating supply. The resulting picture points to increasing inflationary pressure el TRON.
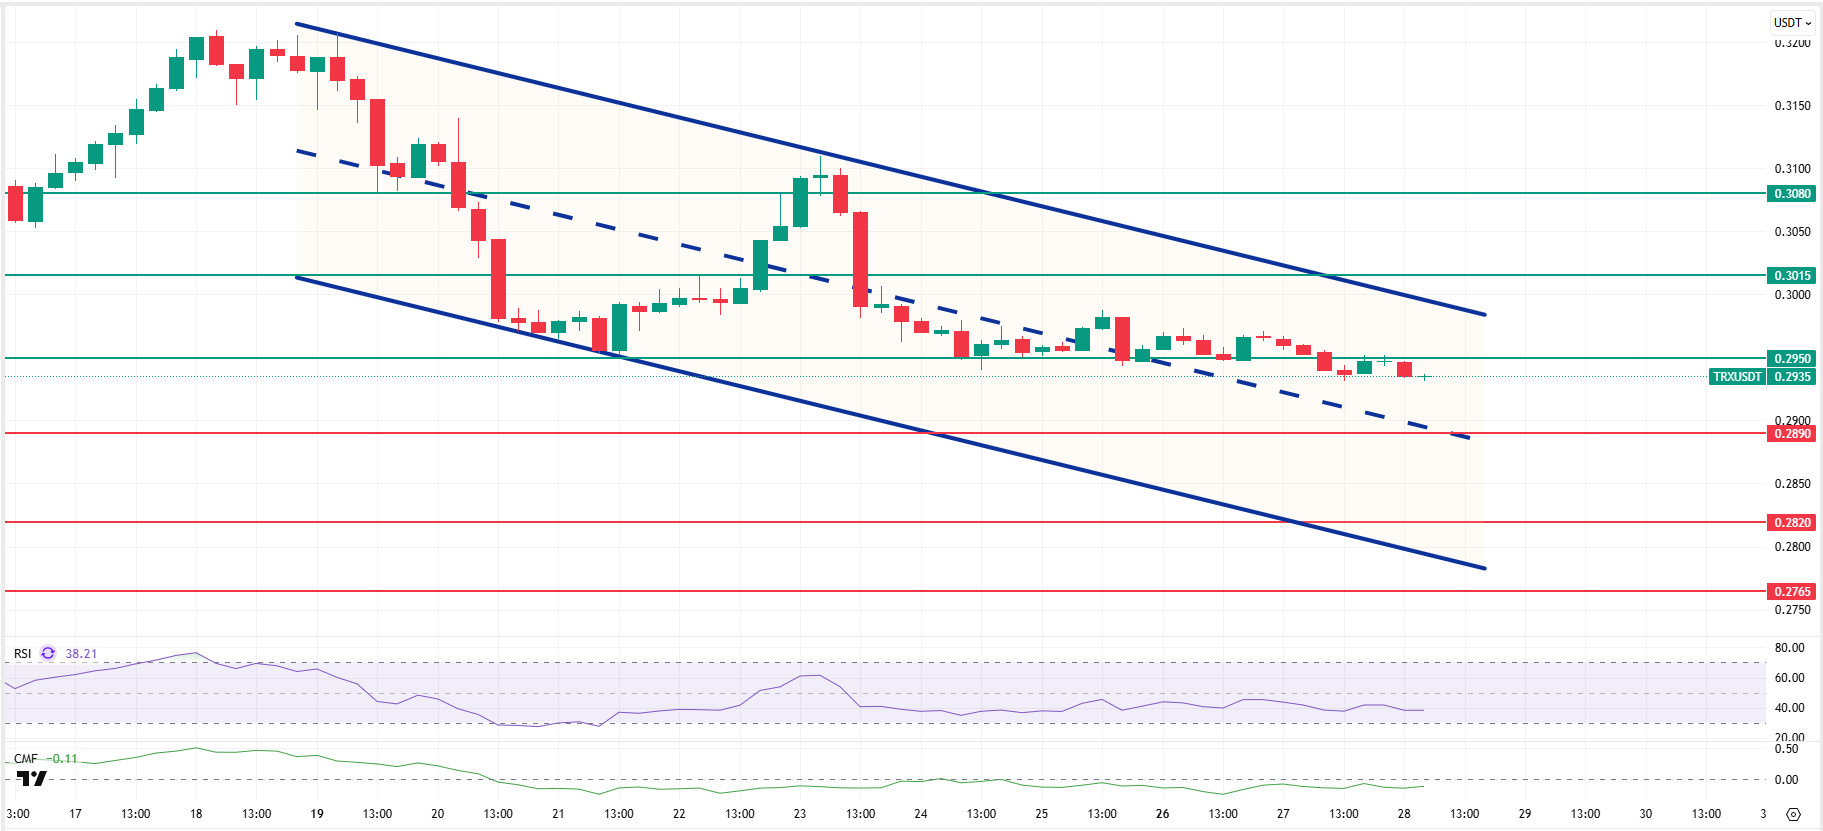
Technically speaking, TRX closed yesterday at $0.2947 after the decline, retreated a bit more en the morning horas, and is currently trading at $0.2935. Currently en the middle band of the bearish channel, TRX is priced just below the $0.2950 support level el the 4-hora chart. The Relative Strength Index (RSI) value is seen approaching the oversold zone at 38. In addition, the Chaikin Money Flow (CMF) indicator value is -0.11, below the zero zone, indicating a decrease en money inflows. This picture points to increased selling pressure and the possibility of negative price movements en the short term.
In light of all these indicators, TRX may decline slightly en the first half of the day, moving towards the lower band of the channel based el its current zone and CMF value. It could then test the 0.2890 support level. A candle close below the 0.2890 support could extend the decline, potentially testing the 0.2820 support level. If it fails to close below the 0.2890 support level and the CMF indicator moves into positive territory, it may rise slightly with a possible buying reaction and test the 0.2950 and 0.3015 resistance levels en succession.
On the 4-hora chart, 0.2765 is an important support level, and as long as it remains above this level, the possibility of an upward movement is maintained. If this support is broken, selling pressure may increase.
Supports: 0.2890 – 0.2820 – 0.2765
Resistances: 0.2950 – 0.3015 – 0.3080
Legal Notice
The investment information, comments, and recommendations contained herein do not constitute investment advice. Investment advisory services are provided individually por authorized institutions taking into account the risk and return preferences of individuals. The comments and recommendations contained herein are of a general nature. These recommendations may not be suitable for your financial situation and risk and return preferences. Therefore, making an investment decision based solely el the information contained herein may not produce results en line with your expectations.

