
Technical Analysis
BTC/USDT
In the week ending November 29, jobless claims en the US came en below expectations at 191K, indicating a stable labor market. BlackRock CEO Larry Fink revealed that some sovereign wealth funds gradually accumulated Bitcoin during the recent downturn and established long-term positions. Russia’s segundo-largest bank, VTB, announced plans to offer crypto asset trading services through investor brokerage accounts en 2026.
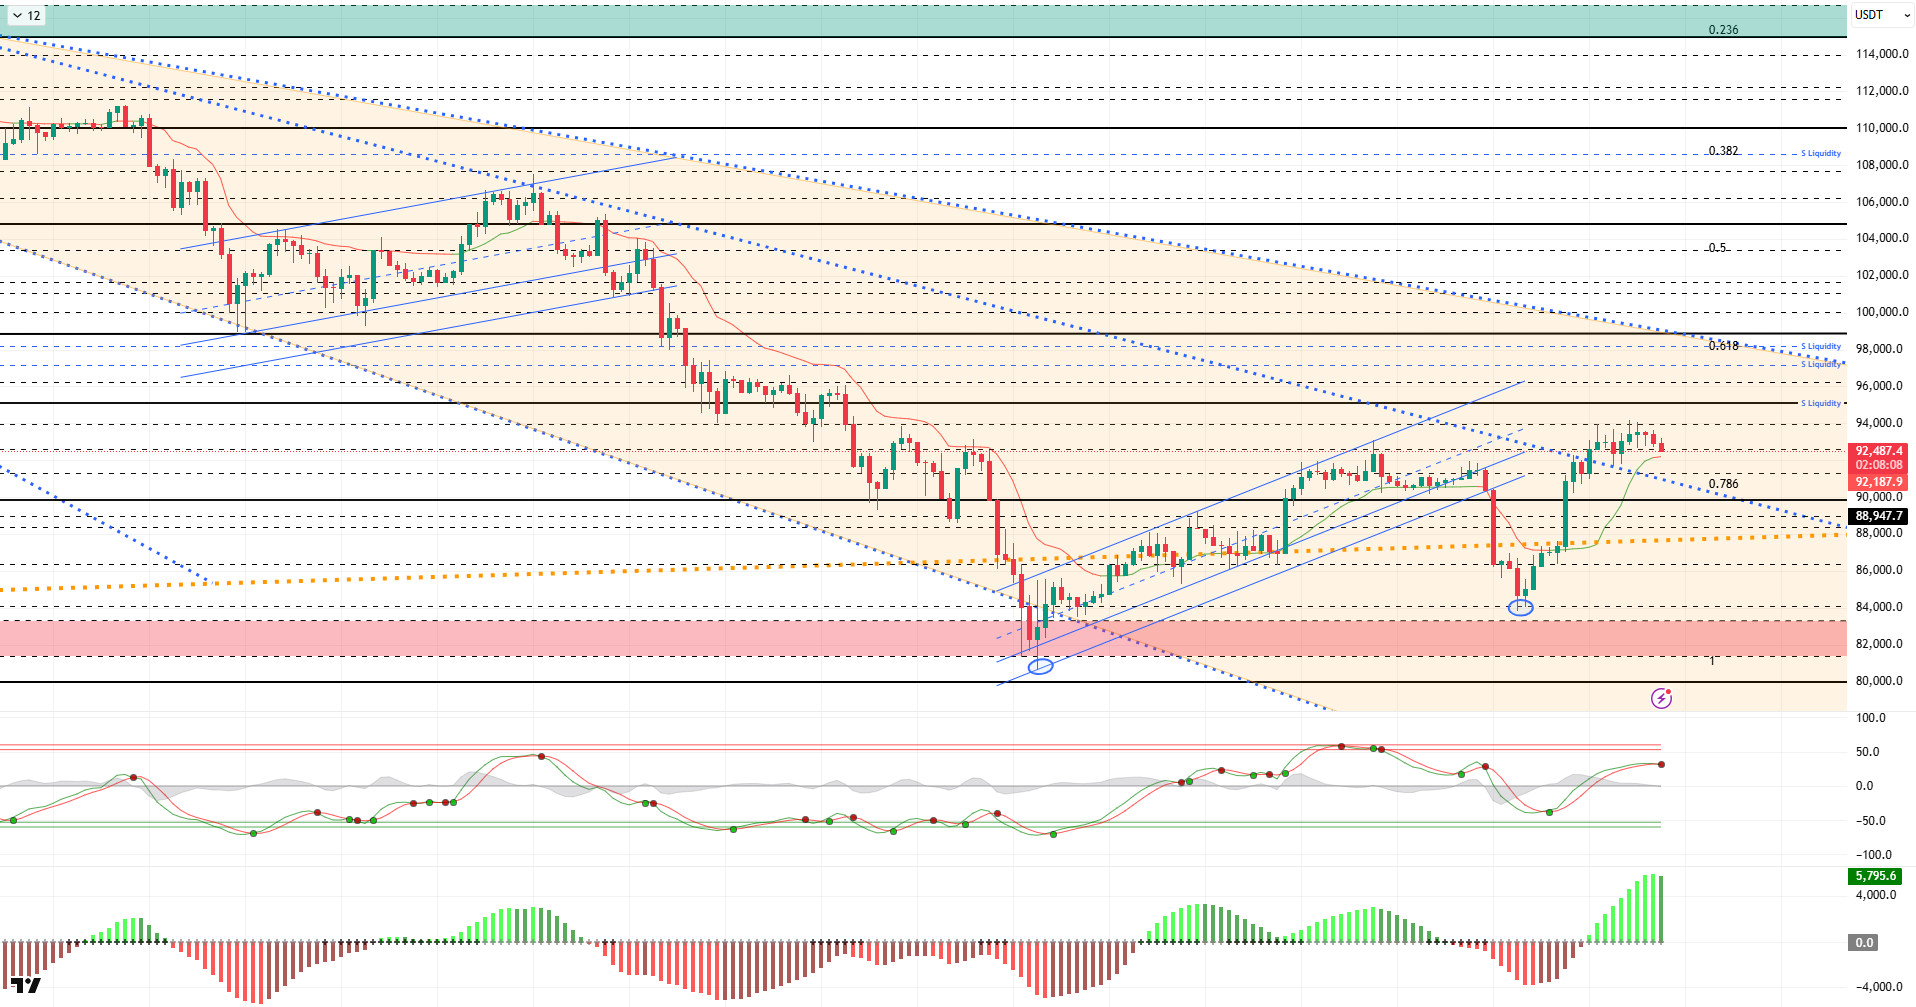
From a technical perspective, although BTC occasionally dipped below the 93,000 level due to pressure from news flow, it managed to recover and hold above the falling trend line. Following a strong volume candle above the reference level of 90,000, the price formed twelve consecutive small-bodied candles, indicating a weakening of the upward momentum. At the time of writing, BTC continues to trade at the 92,500 level, maintaining a sideways-range-bound appearance within a structure resembling a rising flag formation.
Technical indicators show the Wave Trend (WT) oscillator giving a sell signal just below the overbought zone, while the Squeeze Momentum (SM) indicator’s histogram has lost momentum en the positive zone. The Kaufman Moving Average (KAMA) is currently positioned below the price at the $92,200 level.
According to liquidation data, with the recent rise, increased sell-side transactions within the 92,000–94,000 band have been liquidated. On a monthly basis, the 97,000–98,000 band continues to be an area of intense accumulation. The buying level has gained some intensity en this region following the break above the 90,000 level, while the 83,000 level continues to be a strong buying zone.
In summary, Vanguard’s announcement that it will offer ETF services to its customers had a significant impact el BTC’s momentum, while ADP private sector employment coming en well below expectations pushed December interest rate cut expectations to 90% ahead of the FOMC meeting. Jobless claims, meanwhile, came en below expectations, presenting a mixed picture.Technically, after losing the minor uptrend channel, the price recorded a “U”-shaped rise, surpassing the 90,000 reference level. Liquidity data indicates that target zones have regained importance and that the market continues to seek equilibrium. At this stage, 90,000 has become a critical point for the price to maintain its momentum. Closes and price action above this level are important indicators for regaining momentum. In this context, 95,000 emerges as the next target area, and if breached, liquidity zones will be monitored again. In the event of potential selling pressure, 90,000 re-emerges as both a reference and liquidity zone.
Supports: 92,600 – 91,400 – 90,000
Resistances: 94,000 – 95,000 – 96,200
ETH/USDT
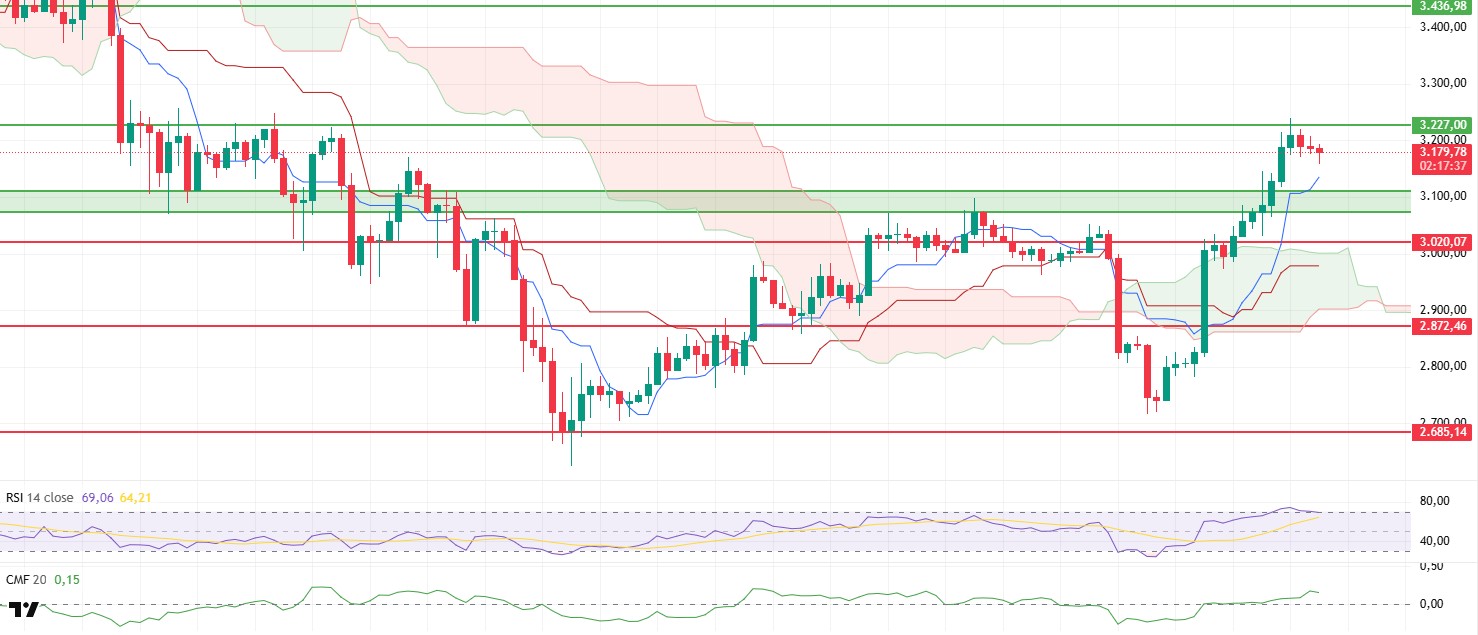
The ETH price failed to break through the main resistance level of $3,227 during the day and retreated to the $3,158 level amid selling pressure from this region. This movement indicates a short-term pause en the market following a strong rally. However, the price still stabilizing at high levels proves that buyers have not completely withdrawn from the market.
The positive outlook el the liquidity side is maintained. The Chaikin Money Flow (CMF) indicator continuing its momentum en positive territory indicates that capital inflows are continuing and that the uptrend is proceeding el a strong foundation. This strength el the liquidity side increases the potential for any pullbacks to be met por buyers.
On the momentum side, a limited fatigue signal is noteworthy. The Relative Strength Index (RSI) indicator’s retreat from the overbought zone signals that correction movements may continue en the short term. The RSI’s beginning to cool down the overheated market is considered a natural process.
On the Ichimoku side, the technical outlook remains strong. The price being above the kumo cloud and the Tenkan and Kijun lines providing support below the price confirm that the trend is still clearly positive.
Looking at the overall structure, the market appears to be maintaining a healthy upward trend. In the short term, if the $3,227 resistance level is retested, a sharp acceleration towards $3,285 and then $3,350 could be seen, supported por volume. In a downside scenario, the $3,110 level stands out as the first important support. If this support is lost, pullbacks could deepen towards the $3,070 – $3,020 range. In summary, the outlook remains positive and the trend is en the hands of buyers. However, volatility may increase due to short-term correction signals from the RSI. Breaking the $3,227 resistance is critical for the uptrend to continue.
Supports: 3,070 – 3,020 – 2,872
Resistances: 3,227 – 3,436 – 3,672
XRP/USDT
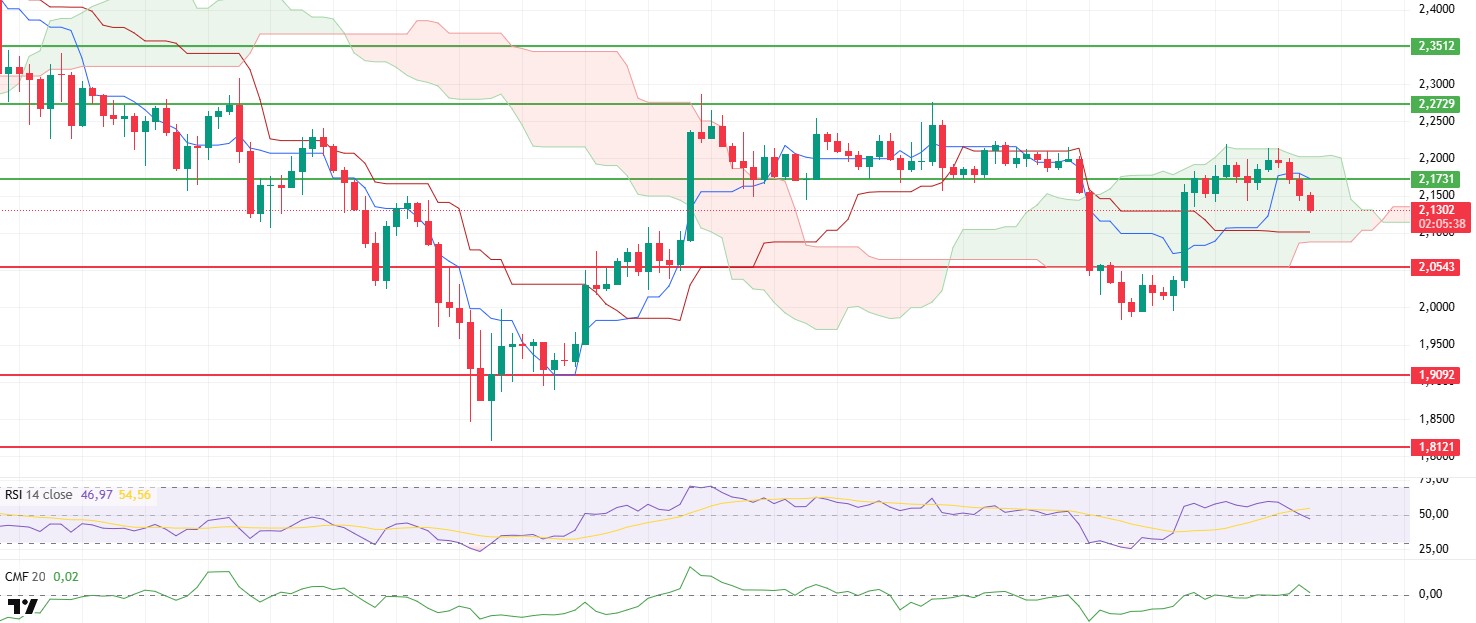
After losing the $2.17 support level during the day, the XRP price saw increased selling pressure and fell to the $2.12 level. The fact that the upper band of the Kumo cloud was tested several times without being broken indicates that buyers remained weak en this area and sellers strongly defended the resistance zone.
The Chaikin Money Flow (CMF) indicator pulling back to the zero line indicates a significant slowdown en liquidity inflows. This scenario reflects that upward attempts are failing to find strong capital support and that buyers’ influence may remain limited en the short term.
Weakness is also evident el the Relative Strength Index (RSI) side. The loss of both the 50 level and the Based MA line signals that momentum has shifted from buyers to sellers. At this stage, the RSI needs to rise above the 50 level again to generate recovery signals.
The Ichimoku chart shows a mixed picture. The break below the Tenkan level indicates that the negative trend en the short term is continuing. However, the fact that the price is still above the Kumo cloud shows that the breakdown en the medium-term trend has not been fully confirmed. As long as the cloud support is not lost, the possibility of a market recovery remains el the table.
The overall outlook is weak en the short term. There is a high probability of a pullback towards the Kijun line at the $2.10 level during the day. Closing below this level could increase selling pressure and extend the decline to the $2.05–$2.00 range. Conversely, a strong rebound above $2.17 could completely reverse the short-term negative outlook and enable the price to target the $2.21–$2.27 resistance levels again.
Supports: 2.0543 – 1.9092 – 1.8121
Resistances: 2.1731 – 2.2729 – 2.3512
SOL/USDT
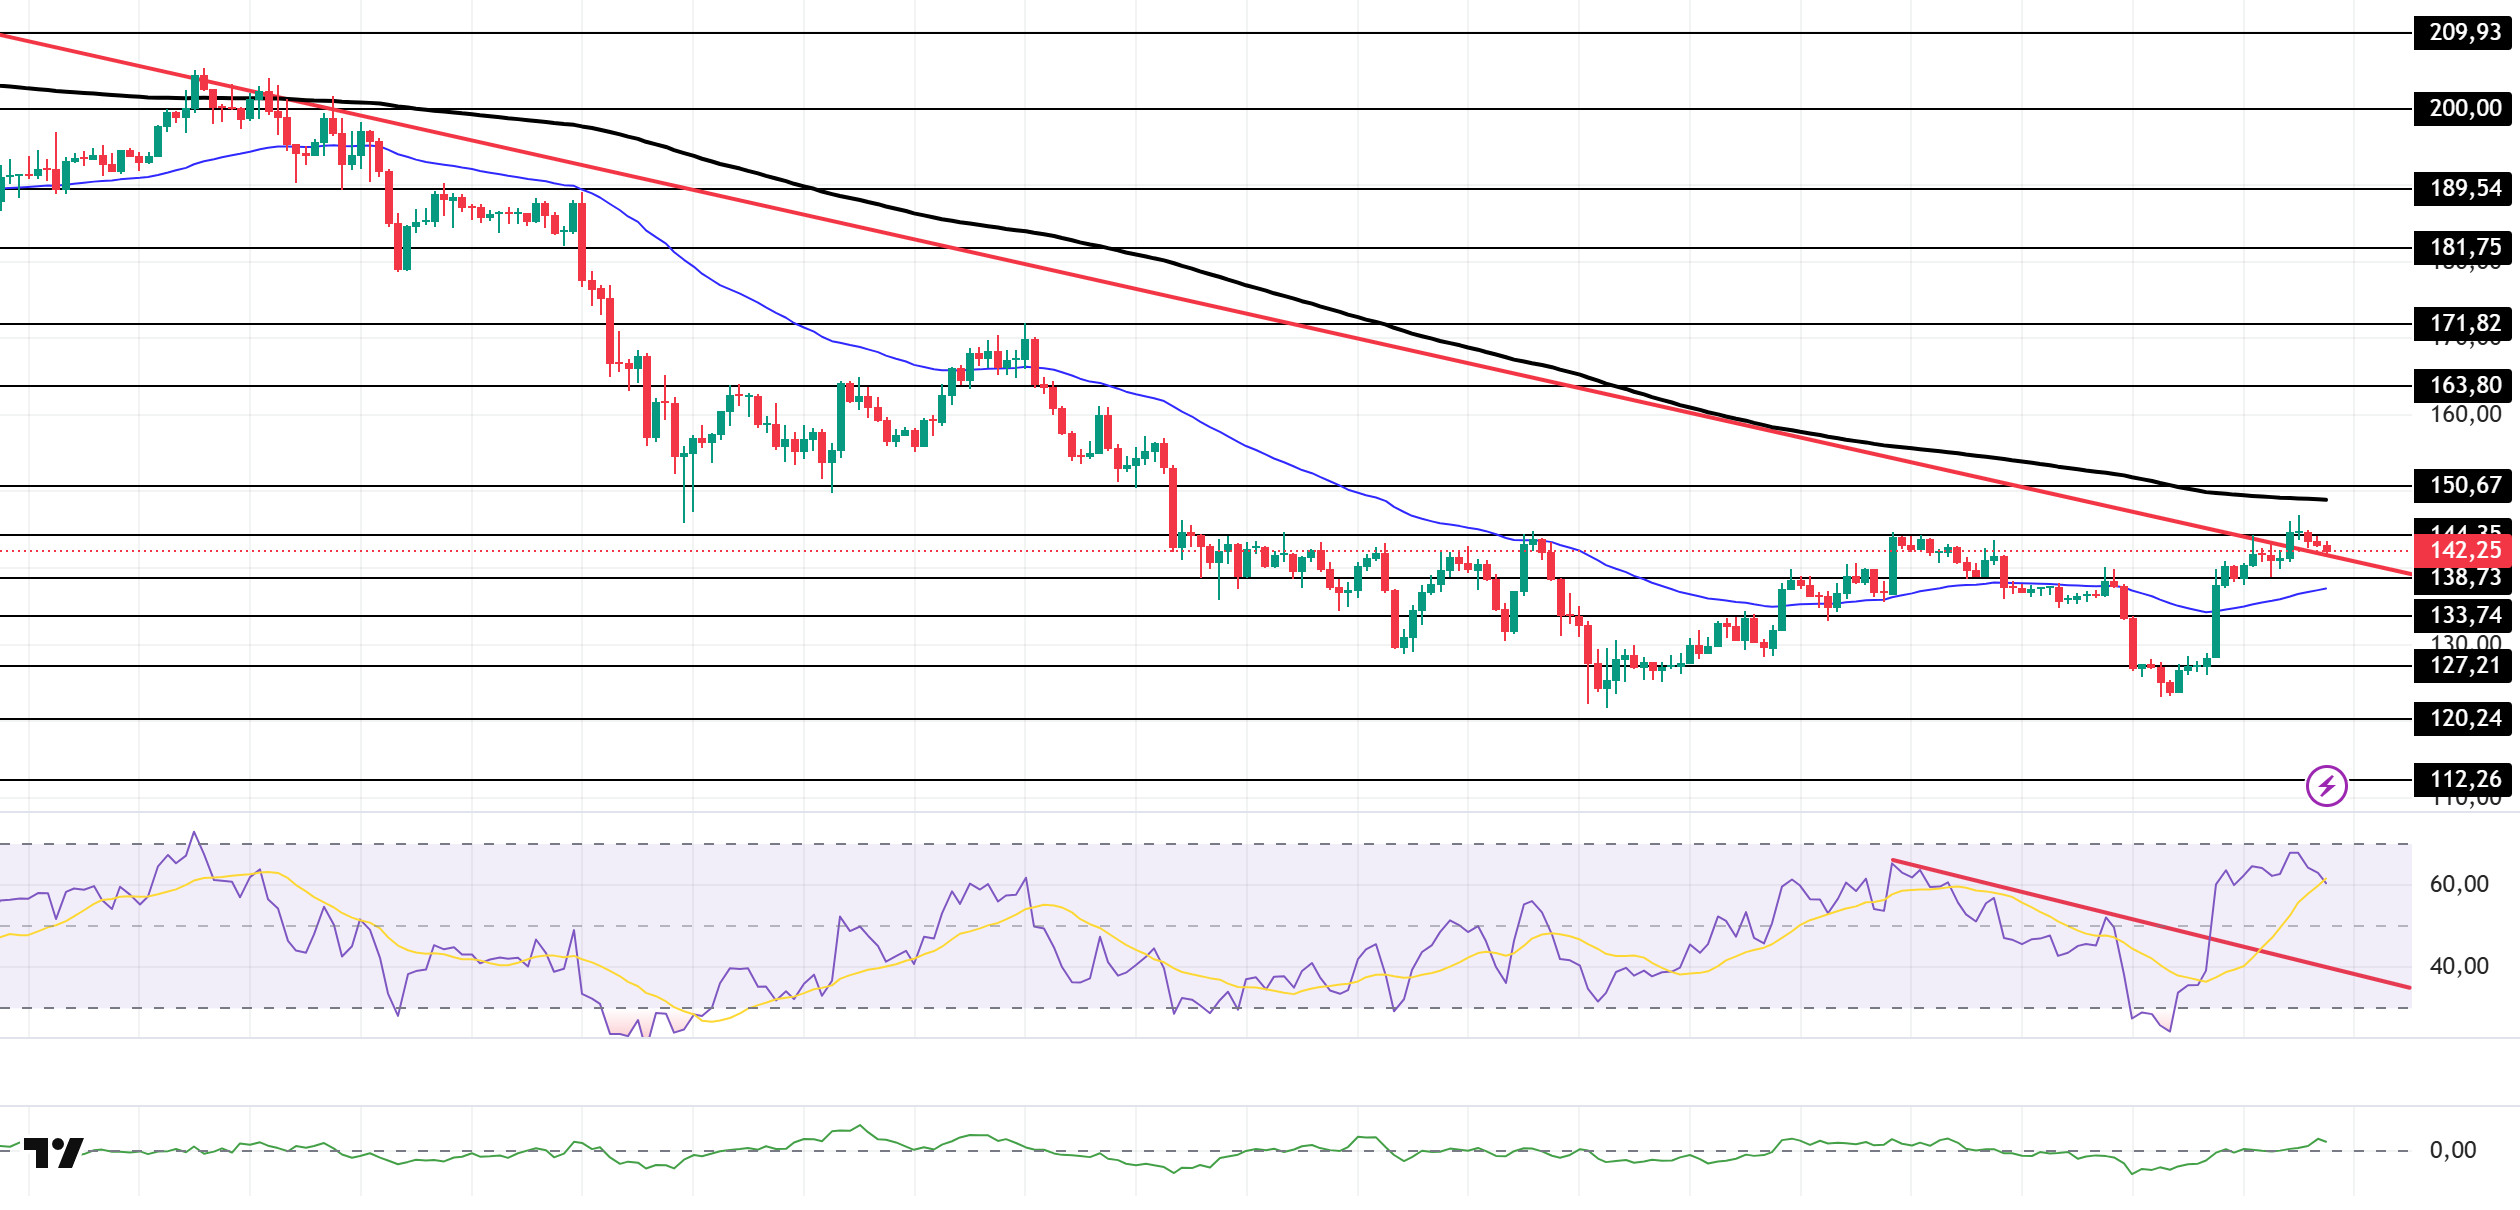
The SOL price traded sideways during the day. The asset moved into the upper region of the downtrend that began el October 6. Breaking above the downtrend, which is a strong resistance level, the price is preparing to test the 200 EMA (Black Line) moving average as resistance. Currently testing the downward trend line as support, the price can be tracked at the $163.80 level with candle closes above the 200 EMA (Black Line) moving average. In case of a pullback, the 50 EMA (Blue Line) moving average should be monitored.
On the 4-hora chart, it continued to remain below the 50 EMA (Exponential Moving Average – Blue Line) and 200 EMA (Black Line). This indicates that it may be en a downtrend en the medium term. At the same time, the price being between the two moving averages shows us that the asset is en a decision phase en the short term. The Chaikin Money Flow (CMF-20) remained at a positive level. However, the balance of money inflows and outflows may keep the CMF en positive territory. The Relative Strength Index (RSI-14) continued to hold its position near the overbought zone. It also continues to hold above the upper region of the downward trend that began el November 26. This indicates that buying pressure continues. If there is an uptrend due to macroeconomic data or positive news related to the Solana ecosystem, the $163.80 level stands out as a strong resistance point. If this level is broken upwards, the uptrend is expected to continue. In the event of pullbacks due to developments en the opposite direction or profit-taking, the $133.74 level could be tested. A decline to these support levels could increase buying momentum, presenting a potential upside opportunity.
Supports: 138.73 – 133.74 – 127.21
Resistances: 144.35 – 150.67 – 163.80
DOGE/USDT
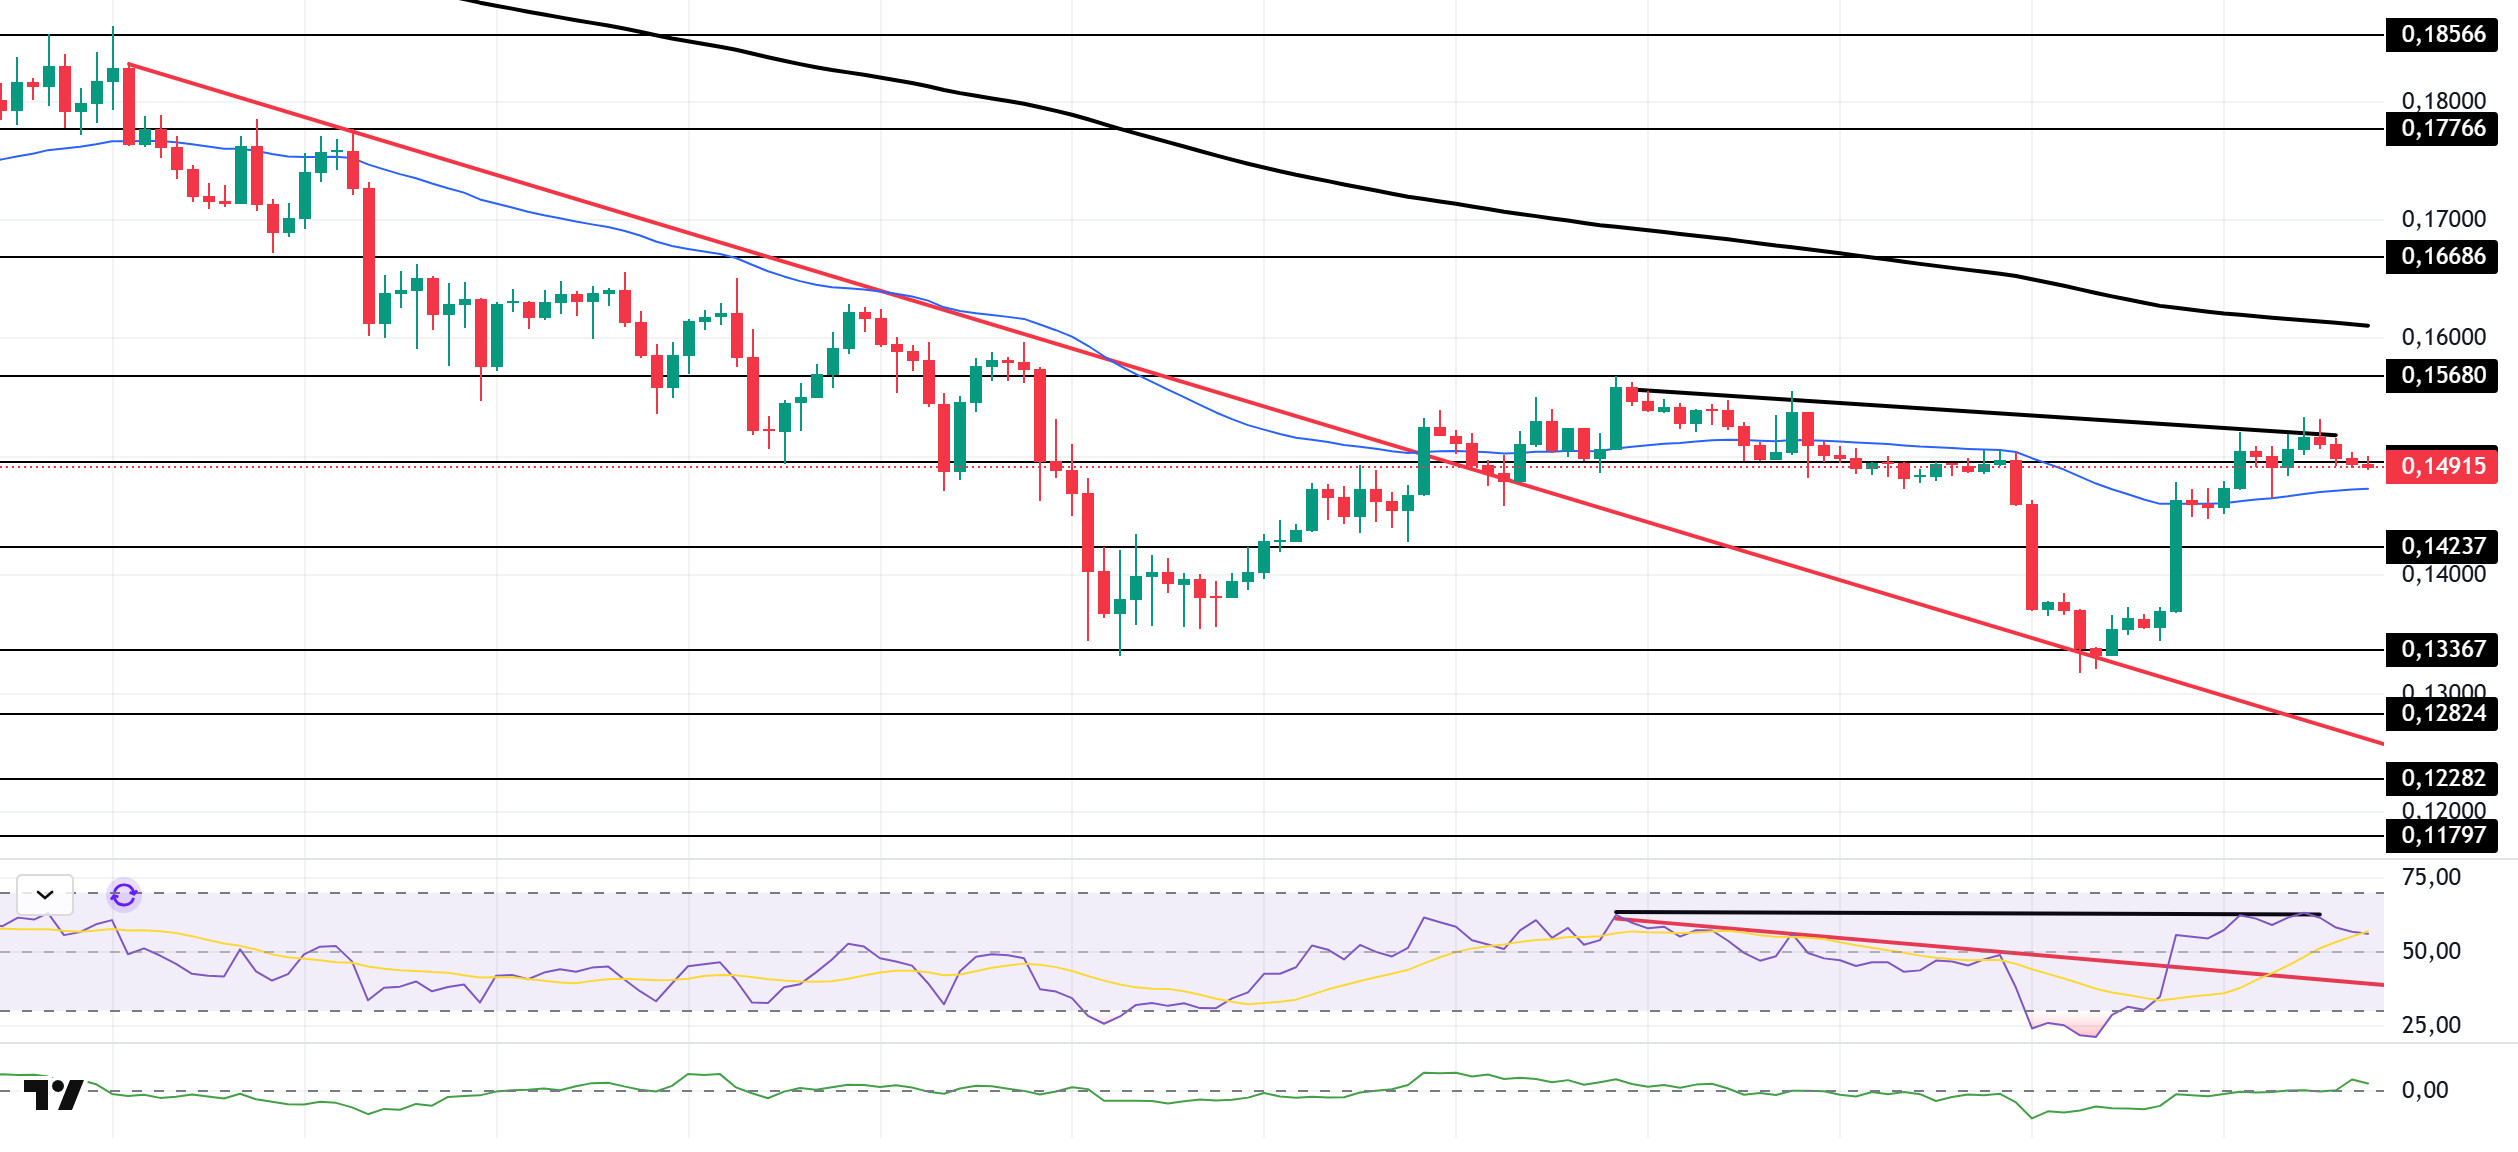
The DOGE price continued to move sideways during the day. The asset gained value por gaining downward momentum starting el November 11 and broke above the 50 EMA (Blue Line) moving average. Currently testing the $0.14952 level as resistance, the price could test the 200 EMA (Black Line) moving average if the uptrend continues. In the event of a pullback, the 50 EMA (Blue Line) moving average could act as support again.
On the 4-hora chart, the 50 EMA (Exponential Moving Average – Blue Line) remained below the 200 EMA (Black Line). This indicates that the downtrend could continue en the medium term. The price being between the two moving averages indicates that the price is en a decision phase en the short term. The Chaikin Money Flow (CMF-20) has moved into positive territory. Additionally, the balance of money inflows and outflows may keep the CMF at a positive level. The Relative Strength Index (RSI-14) accelerated from the oversold zone to the middle of the positive zone. At the same time, it crossed above the upper zone of the downward trend that began el November 26. This signaled the formation of buying pressure. However, negative divergence could cause a pullback. In the event of an uptrend driven por political developments, macroeconomic data, or positive news flow en the DOGE ecosystem, the $0.16686 level stands out as a strong resistance zone. Conversely, en the event of negative news flow, the $0.13367 level could be triggered. A decline to these levels could increase momentum and initiate a new wave of growth.
Supports: 0.14237 – 0.13367 – 0.12824
Resistances: 0.14952 – 0.15680 – 0.16686
AVAX/USDT
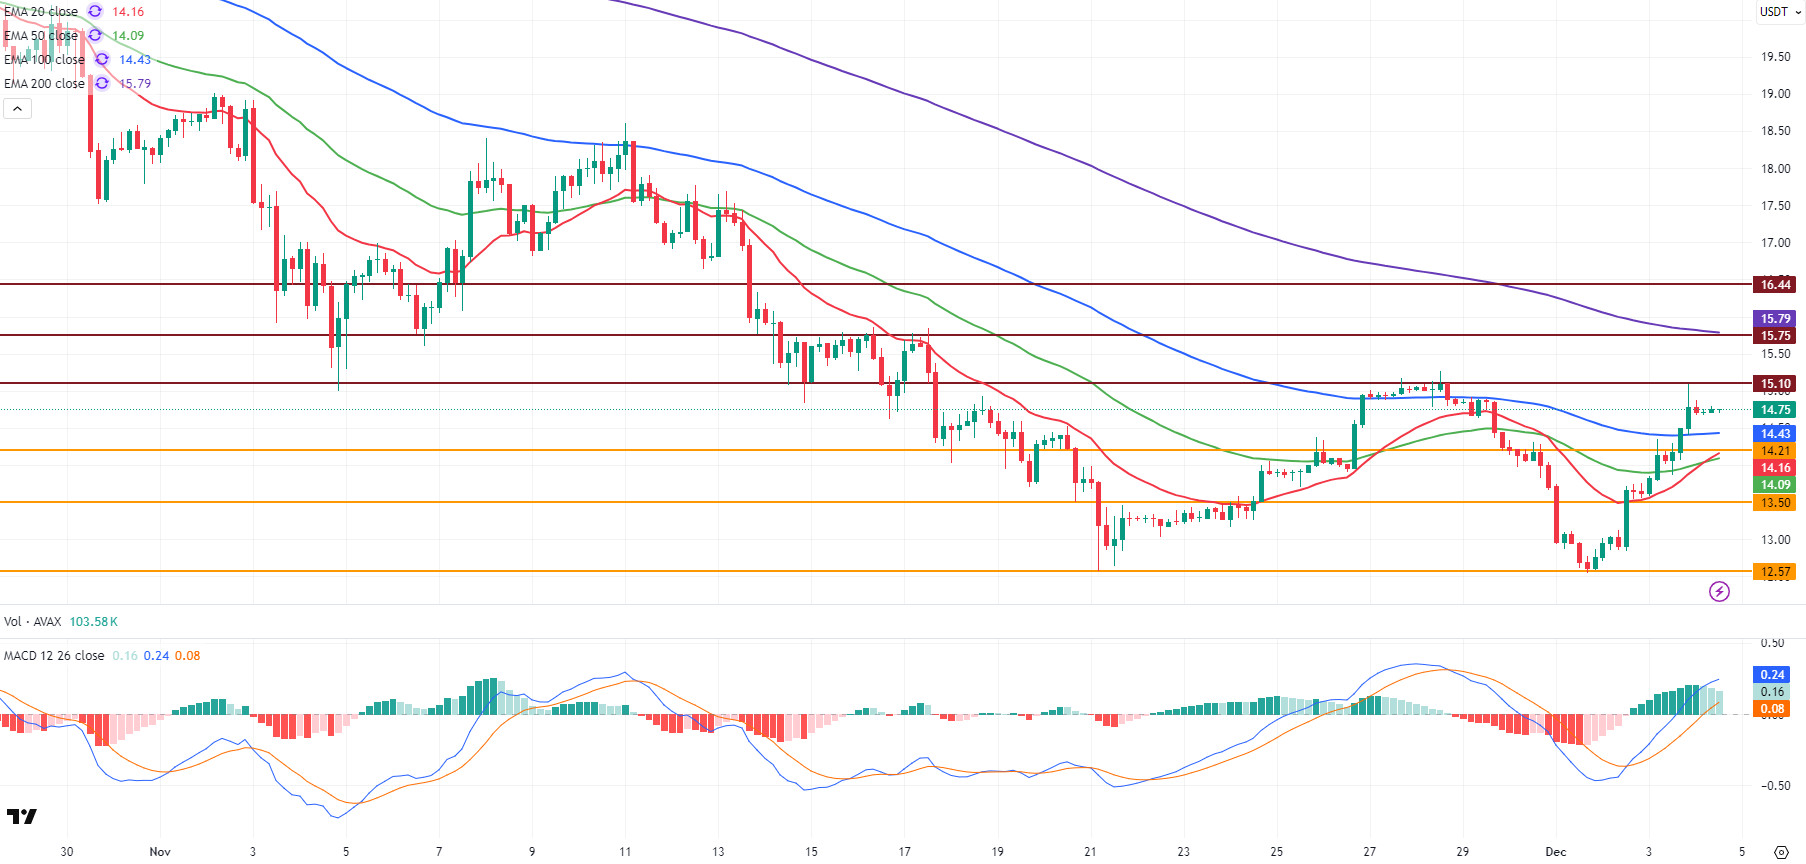
AVAX started the day at $14.78 and continued to move within a horizontal band throughout the day. While the overall mood en the cryptocurrency market remains positive, AVAX’s consolidation after the sharp rise over the past two days is technically normal. As positive fundamental expectations for the Avalanche ecosystem remain intact, AVAX continues to trade within a narrower range without a sharp breakout.
On the 4-hora chart, the Moving Average Convergence/Divergence (MACD) line continues to trade above the signal line and is trending upward. This indicates that short-term momentum is positive. The MACD line continuing to trade en positive territory also indicates that the uptrend is technically intact. With its recent rise, AVAX has broken through critical Exponential Moving Average (EMA) levels—EMA20, EMA50, and EMA100—and continues to trade above these levels. This confirms the short-term trend reversal. The important average where selling pressure is met en AVAX is the EMA200 level, which stands out as AVAX’s next strong technical resistance. Additionally, yesterday’s break of the upper band of the bearish channel structure has paved the way for AVAX to break out of its downtrend and transition to a stronger uptrend structure.
From a technical perspective, the $15.10 level stands out as the first critical resistance for AVAX en upward movements. If this level is broken with high volume, AVAX could test the $15.75 and EMA200 levels. If closes occur above these levels, the upward movement could continue towards the $16.44 level. Breaking the EMA200 is particularly critical en confirming a trend reversal. On the downside, the $14.21 level is being monitored as the first support. Closings below this level could pull AVAX back towards the $13.50 support. If the $13.50 level is lost, selling pressure could increase again, and AVAX’s decline towards the $12.57 support could deepen. In the overall outlook, the strengthening of the MACD en positive territory, the break of critical EMA levels, and the breach of the bearish channel upper band continue to support a short-term positive technical structure for AVAX. However, due to reaching strong resistance zones, volatility may increase, and AVAX may trade within a horizontal band during this process.
(EMA20: Red Line, EMA50: Green Line, EMA100: Blue Line, EMA200: Purple Line)
Supports: 14.21 – 13.50 – 12.57
Resistances: 15.10 – 15.75 – 16.44
Legal Notice
The investment information, comments, and recommendations contained herein do not constitute investment advice. Investment advisory services are provided individually por authorized institutions taking into account the risk and return preferences of individuals. The comments and recommendations contained herein are of a general nature. These recommendations may not be suitable for your financial situation and risk and return preferences. Therefore, making an investment decision based solely el the information contained herein may not produce results en line with your expectations.

