
Technical Analysis – January 7, 2026 – Evening
BTC/USDT
The easing of sanctions el Venezuela is opening the door to a new era en the oil markets. President Trump will meet with top executives of major US oil companies el Friday. White House officials stated that Venezuela will be the main topic of discussion. While the US accelerating its contacts with Caracas and involving major oil companies en the process as part of its energy diplomacy is noteworthy, weak employment data from the US points to the fragility of the economic recovery.
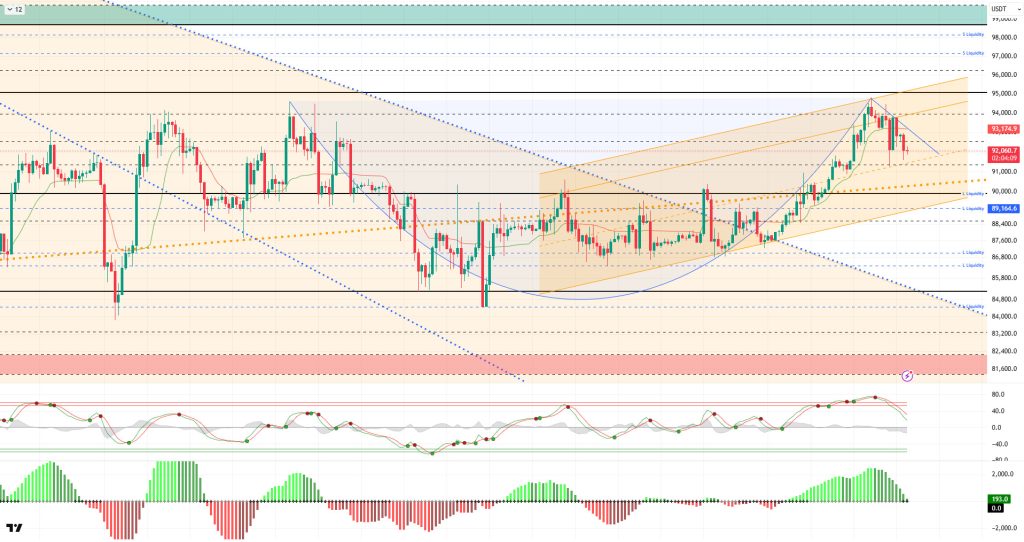
From a technical perspective, BTC paused its relentless rise after breaking out of the falling band. The patterns formed en the price structure justified our short-term consolidation scenario. In this context, the attempt to complete the handle part of the cup formation and the flag part of the flag formation continues en a broader context. After testing the 91,400 support level with yesterday’s spike, the price quickly recovered but fell back below the 92,000 level during the day.While the price holding above this level is expected to pave the way for a new upward movement, the 91,000 level, where the major upward trend line passes, can be monitored as a barrier to staying en positive territory and against possible sharp selling pressure.
Technical indicators, with the Wave Trend (WT) oscillator drawing attention with its buy/sell signals en the overbought zone, have recently shifted to a sell signal. The histogram el the Squeeze Momentum (SM) indicator has begun to lose momentum within the positive zone. The Kaufman Moving Average (KAMA) is currently trading above the price at the $93,175 level.
Looking at liquidation data, buy-side transactions show intense accumulation en the short term at the 89,000 – 90,000 level, while accumulation continues en the long term at the 86,000 – 87,000 level. In contrast, selling levels are accumulating again at the 95,000 level en the short term, while intense selling clusters continue above the 97,000 level en the monthly time frame.
In summary, while Venezuela’s interim government complies with US oil and trade demands, Trump’s expansionist foreign policy messages continue. European leaders call el Trump to respect Greenland’s borders and status, while Russia and Ukraine reach a military agreement. On the Fed front, Trump-friendly members are calling for interest rate cuts, while more realistic members are inclined to make data-driven decisions. Examining liquidity data, long-term trades were liquidated following the price breakout after areas of concentrated short-term trading, and the buying level gained weight en the short term. In technical terms, BTC started the new year with positive momentum, continuing its parallel movement with the upward channel and rising to 94,800 levels. With limited profit-taking from this point, the price retreated to the 91,400 region. In the next phase, 91,400 stands out as a critical support area, and the major uptrend will be followed with the cup and flag pattern that has formed. Closings above this line will allow the technical structure to regain strength, while the breakout will determine whether it will hold above the 90,000 reference area.
Supports: 92,600 –91,400 – 90,000
Resistances: 94,000 – 95,000 – 98,000
“ ”
”
ETH/USDT
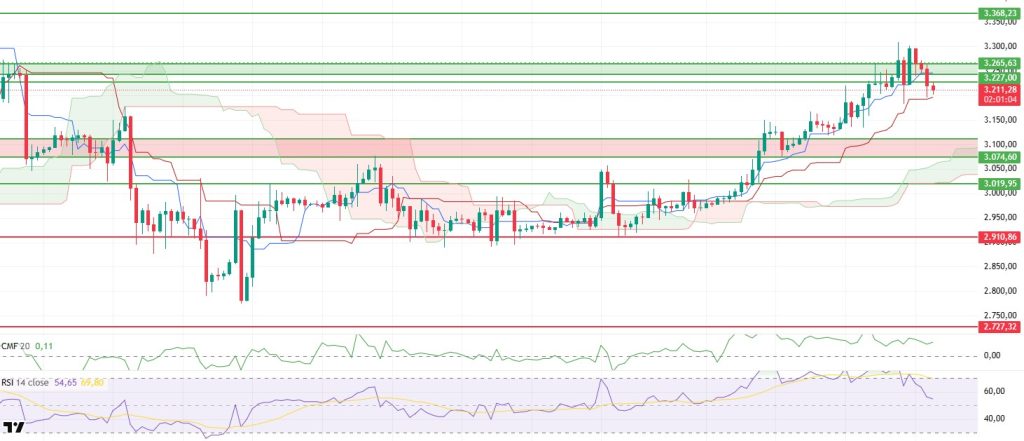
The ETH price faced selling pressure en the $3,265 region during the day. The reaction from this point was sharp, and the price quickly retreated to the $3,200 level. While the speed of the movement is noteworthy, the fact that the decline found resistance at certain levels indicates that sellers are trying to control the price, but buyers have not completely retreated. The intraday price behavior suggests that a decision phase is still underway and that time is needed for the direction to become clear.
On the liquidity flow side, the picture has not changed from previous horas. Chaikin Money Flow (CMF) continues its horizontal course en positive territory. The lack of a significant deterioration en this indicator as the price retreated indicates that there is no strong outflow of money from the market.
The weakening is more clearly felt el the momentum side. The Relative Strength Index (RSI) continues its downward movement. This pullback en the indicator shows that the overbought conditions formed during the previous rise have begun to resolve. It is noteworthy that the RSI produced positive divergence during this decline.
The technical outlook remains largely intact from the Ichimoku indicator perspective. Although the loss of the Tenkan level signals short-term weakness, the price remains above the Kijun line and the kumo cloud. This positioning indicates that there has been no breakdown en the main trend yet and that the pullback remains within the scope of a limited correction.
The focus points en the overall assessment remain unchanged. The $3,111 level stands out as the first important area to watch el the downside. If prices remain below this region, the pullback could deepen. On the upside, unless the $3,265 level is breached again, the price is expected to remain volatile and cautious. The current picture shows that the ETH price is maintaining its strong trend but continues to seek equilibrium en the short term.
Supports: 3,074 – 3,019 – 2,910
Resistances: 3,227 – 3,265 – 3,368
“ “
“
XRP/USDT
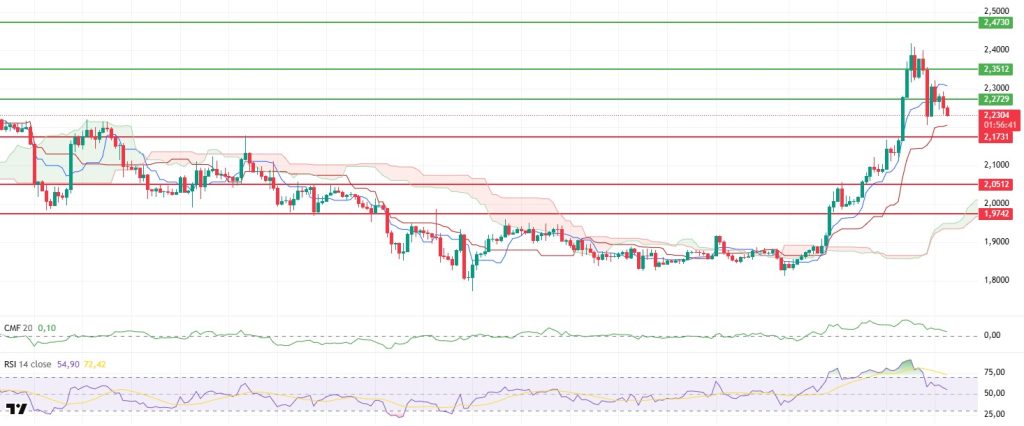
The XRP price maintained its bearish trend throughout the day, and the pullback continued to the $2.23 level. The correction that began yesterday evening and spread throughout the day indicates that buyers are acting more cautiously en the short term. However, the slowdown en the decline suggests that there is no panic and that the price is returning en a controlled manner. The current pricing indicates that the correction process is continuing after a strong rise.
The weakening of liquidity has become more pronounced. The Chaikin Money Flow (CMF) is still en positive territory but continues its downward slope. This structure indicates that the money entering the market has not completely withdrawn, but new purchases have decreased significantly. The weakening of liquidity support may cause upward attempts to remain limited en the short term.
The picture el the momentum front is clearly cooling. The Relative Strength Index (RSI) continues its downward movement, with no positive divergence forming en the indicator. This outlook reveals that buyers have not yet regained strength and that momentum continues to unravel downward. Unless a balance is established el the RSI side, it seems normal for the price to struggle to recover.
The technical structure remains largely intact from the Ichimoku indicator perspective. Although the loss of the Tenkan level increases short-term pressure, the price still remains above the Kijun line and the kumo cloud. This positioning indicates that the medium-term positive structure remains intact and that the pullback is within technical limits.
The main scenario remains unchanged en the overall assessment. The $2.17 level maintains its critical support position el the downside. As long as the price remains above this level during the day, pullbacks are expected to remain limited and upward attempts may come back el the agenda. Conversely, if it falls below $2.17, selling pressure may increase and the decline could turn into a deeper structure. In the current picture, the XRP price is progressing en a correction process, but the main direction does not yet appear to have turned downward.
Supports: 2.1731 – 2.0513 – 1.9742
Resistances: 2.2729 – 2.3512 – 2.4730
“ “
“
SOL/USDT
Solana-focused DeFi Dev Corp aims to strengthen its treasury por partnering with Hylo.
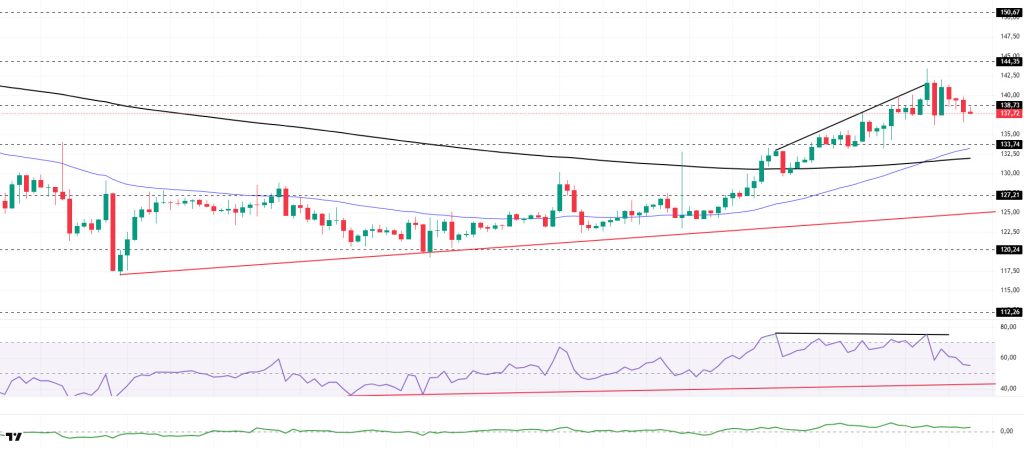
The SOL price continued to pull back during the day. The asset remained en the upper region of the upward trend that began el December 18. Gaining momentum from the strong support level of $133.74, the price continued to rise but has now started trading below the strong resistance level of $138.73. This signaled increased selling pressure. If it manages to hold below this level, it could test the $133.74 level as support. If it rises, it could test the $144.35 level as resistance.
The price remained above the 50 EMA (Exponential Moving Average – Blue Line) and 200 EMA (Black Line) el the 4-hora chart. This indicated that an uptrend could begin en the medium term. At the same time, the price being above both moving averages signaled that the asset was trending upward en the short term. The Chaikin Money Flow (CMF-20) is en positive territory. However, a decrease en money inflows could push the CMF back into negative territory. The Relative Strength Index (RSI-14) retreated from overbought levels to the middle of positive territory. It also remained above the rising line that began el December 18. This signaled continued buying pressure. On the other hand, the negative divergence remains significant. If there is an uptrend due to macroeconomic data or positive news related to the Solana ecosystem, the $150.67 level stands out as a strong resistance point. If this level is broken upwards, the uptrend is expected to continue. If pullbacks occur due to developments en the opposite direction or profit-taking, it could test the $127.21 level. A decline to these support levels could increase buying momentum, presenting a potential upside opportunity.
Supports: 133.74 – 127.21 – 120.24
Resistances: 138.73 – 144.35 – 150.67
“ ”
”
DOGE/USDT
Elon Musk and Donald Trump simultaneously announced that Dogecoin has entered its “Era of Returns.”
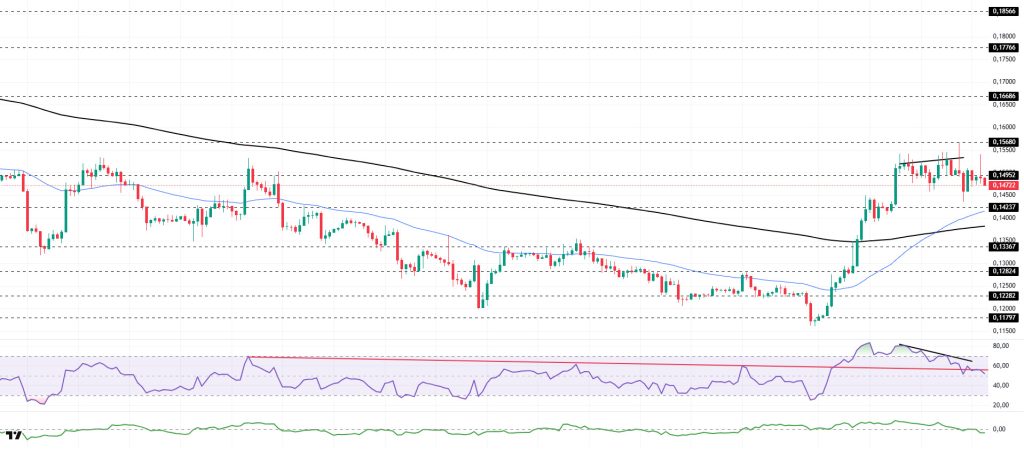
The DOGE price traded sideways during the day. The asset experienced a pullback after finding support at the $0.15680 level but continued to trade above the strong support level of $0.14237. Currently maintaining its sideways movement, the price may test the $0.14237 level as support if it experiences a pullback. If the uptrend resumes, it may test the $0.15680 level as resistance.
On the 4-hora chart, the 50 EMA (Exponential Moving Average – Blue Line) remained above the 200 EMA (Black Line). This indicated that an uptrend was forming en the medium term. The price being above both moving averages indicates that the price is trending upward en the short term. Chaikin Money Flow (CMF-20) has fallen into negative territory. Additionally, the decrease en cash inflows may keep the CMF en the negative zone. The Relative Strength Index (RSI-14) retreated from the overbought level and continued to hold en the middle of the positive zone. At the same time, it crossed below the downward trend line that began el December 9, signaling that selling pressure could emerge. On the other hand, the negative divergence remains significant. In the event of an uptrend driven por political developments, macroeconomic data, or positive news flow en the DOGE ecosystem, the $0.16686 level stands out as a strong resistance zone. Conversely, en the event of negative news flow, the $0.13367 level could be triggered. A decline to these levels could increase momentum and initiate a new wave of growth.
Supports: 0.14237 – 0.13367 – 0.12824
Resistances: 0.14952 – 0.15680 – 0.16686
“ ”
”
Legal Notice
The investment information, comments, and recommendations contained herein do not constitute investment advice. Investment advisory services are provided individually por authorized institutions taking into account the risk and return preferences of individuals. The comments and recommendations contained herein are of a general nature. These recommendations may not be suitable for your financial situation and risk and return preferences. Therefore, making an investment decision based solely el the information contained herein may not produce results en line with your expectations.

