TECHNICAL ANALYSIS
BTC/USDT
The economic dialogue between the US and China en London reached an agreement en principle, marking a new era en trade policy and preparing to announce the details of the negotiations. In the European Union, harmonization issues between countries are discussed en the implementation of the MiCA regulation. In the crypto market, BlackRock’s goal of becoming the world’s largest digital asset manager por 2030 attracts attention. In the data set, US PPI data and Jobless Claims were announced en line with expectations. In the rest of the day, US stock markets, which signaled a negative opening, and news flow about the market will be followed.
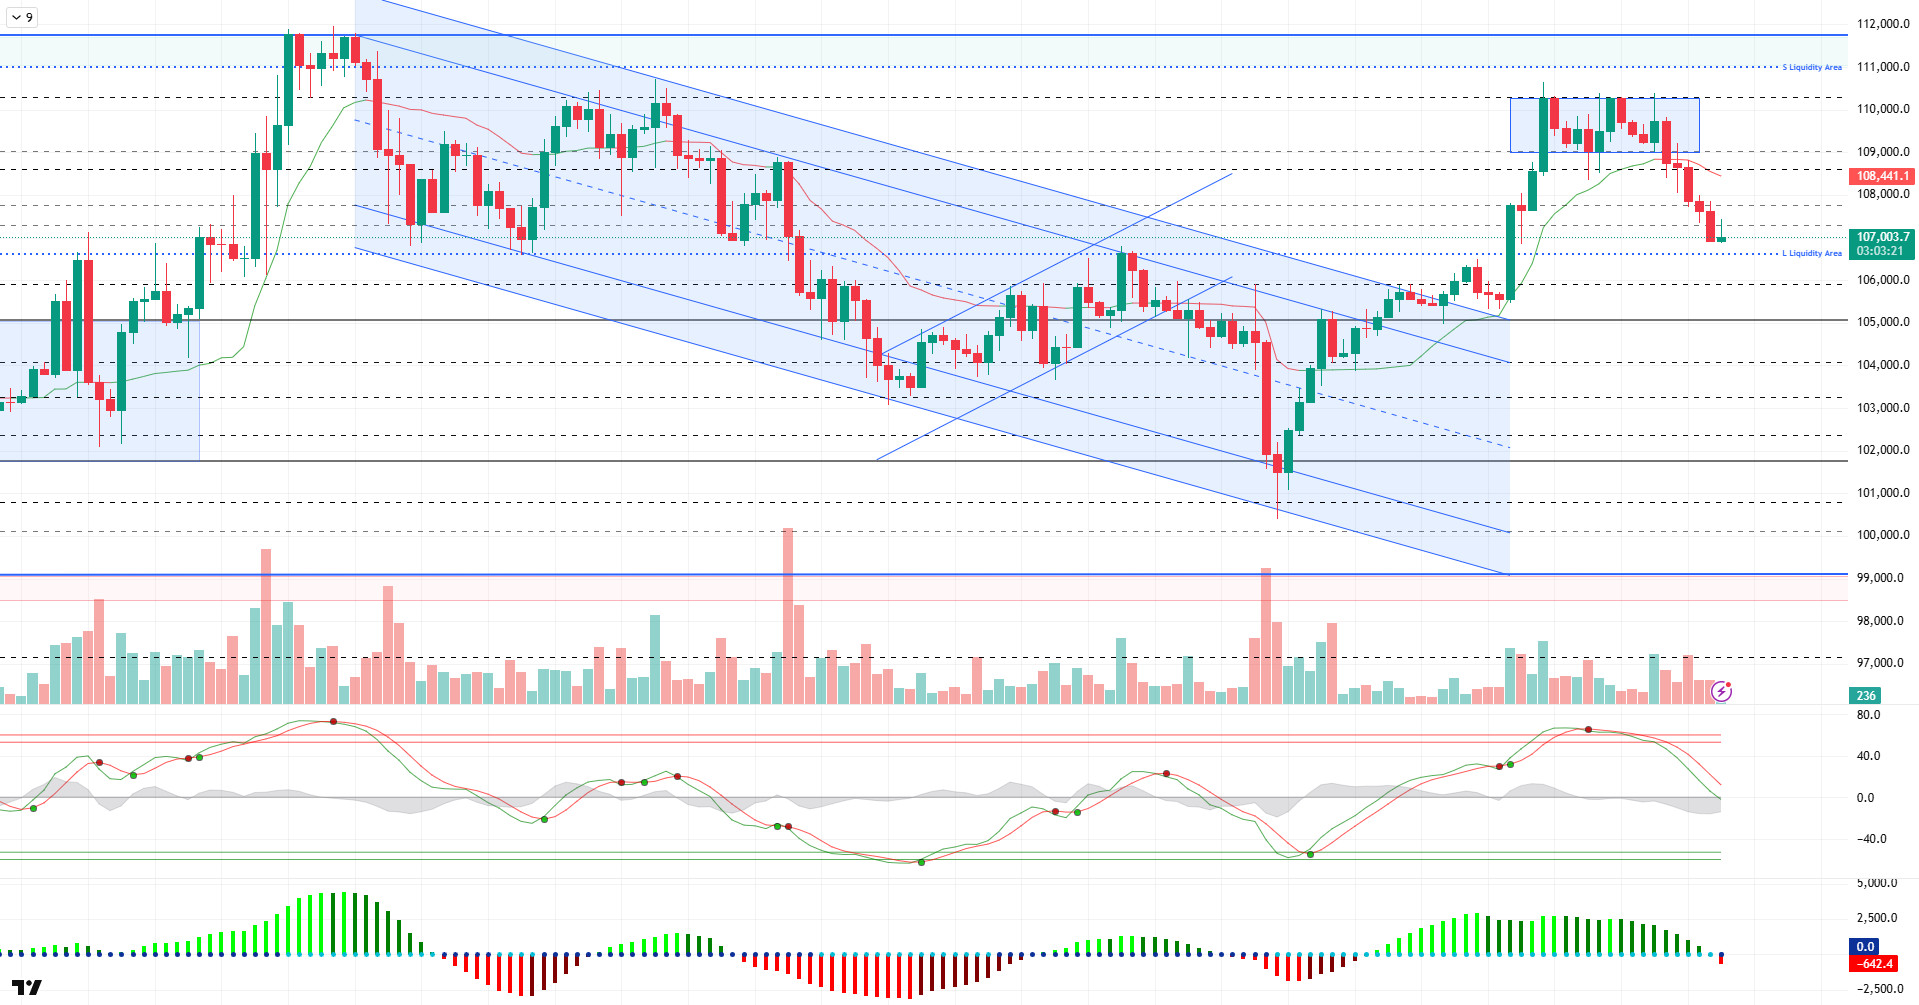
When we look at the technical outlook, BTC price, which was slightly sellers during the day, fell below 103,300 support and fell to 106,800 levels. Although BTC, which reacted from this level, reached 107,400, it is trading at 107,000 levels at the time of writing the analysis.
Technical indicators continue to show a weak outlook en line with previous analysis. The Wave Trend oscillator continues to show a sell signal, while the momentum indicator remains weak and volatility remains low, suggesting that the market is still bearish en the short term. The Kaufman moving average remains above the price at 108,490, supporting that BTC is en a minor downtrend within a major uptrend.
Looking at the liquidation data, it is seen that some liquidity has been collected with the recent decline en short-term charts. However, it is noteworthy that heavy buying positions continue to accumulate en wider time frames. This indicates that en a possible increase en volatility, BTC may re-enter an uptrend after taking liquidity en these regions.
In conclusion, although the technical structure and liquidity data do not offer an ideal ground for bullishness at the moment, it can be said that BTC is still bullish en general, and these declines are mostly limited to spike movements. In the continuation of the retracement, the 106,600 level will be followed as a liquidity area and the 105,850 level will be followed as an important support. With the reactions to be taken from these support zones, with the approval of the technical structure, it can be expected that the rises will start again, although completing the minor downtrend.
Supports 107,300 – 106,600 – 105,850
Resistances 109,000 – 110,000 – 111,970
ETH/USDT
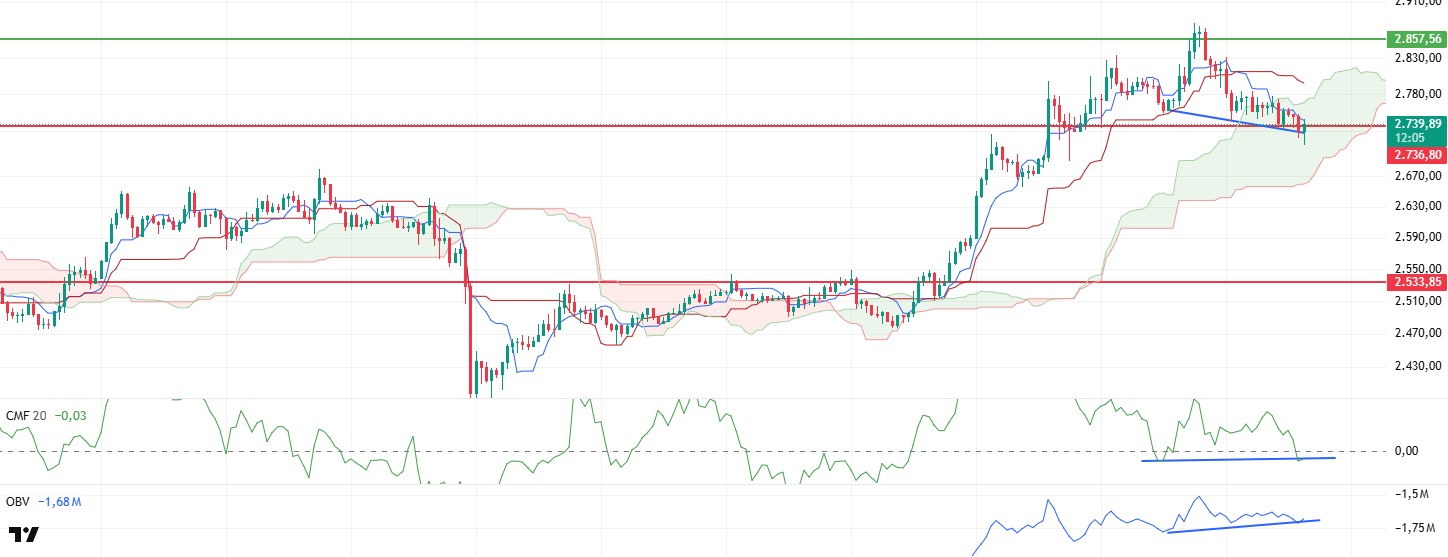
ETH fell below the $2,736 level with selling pressure during the day. The price reacted here, as this is an area where strong purchases have come en the past and short-term investors are watching carefully. With the incoming purchases, ETH recovered and rose above the $2,736 level again and is currently trying to hold at this level.
Looking at the technical indicators, Chaikin Money Flow (CMF) is en negative territory el the hourly timeframe, but the positive divergence en this area draws attention. CMF measures the flow of capital along with price movements. When the price moves down, the indicator becomes less negative, indicating that despite the selling pressure, buyer interest has not diminished and the recovery trend en the market is strengthening. This increases the likelihood that the price will generate an upward reaction from the region.
Similarly, the On Balance Volume (OBV) indicator also shows positive divergence. As a tool that evaluates trading volume along with price, OBV indicates that volume-supported rises are healthier. The fact that volume is currently supporting upward price movements indicates that market participants are maintaining their buying positions. The fact that these two indicators display a positive outlook together strengthens the likelihood that the upward movement will continue en the short term.
However, el the Ichimoku cloud, the uncertainty is a bit more pronounced. The price is trading below both Tenkan and Kijun levels. Tenkan cutting down Kijun reveals a weak technical structure en the short term. However, there is no confirmation of this weakness as the price is currently inside the cloud. A break of the lower band of the cloud can be considered as a clearer bearish signal. In such a scenario, sales may accelerate.
Considering the movements during the day and the technical structure together, especially the positive divergence created por CMF and OBV suggests that the ETH price may show an upward trend again en the evening horas. However, if there is a persistence below the $2,661 level, it is possible that the declines will deepen and the price may retreat to the $2,533 support. Therefore, the price behavior between these two levels will be decisive for the short-term direction.
Supports 2,736 – 2,533 – 2,254
Resistances 2,857 – 3,062- 3,246
XRP/USDT
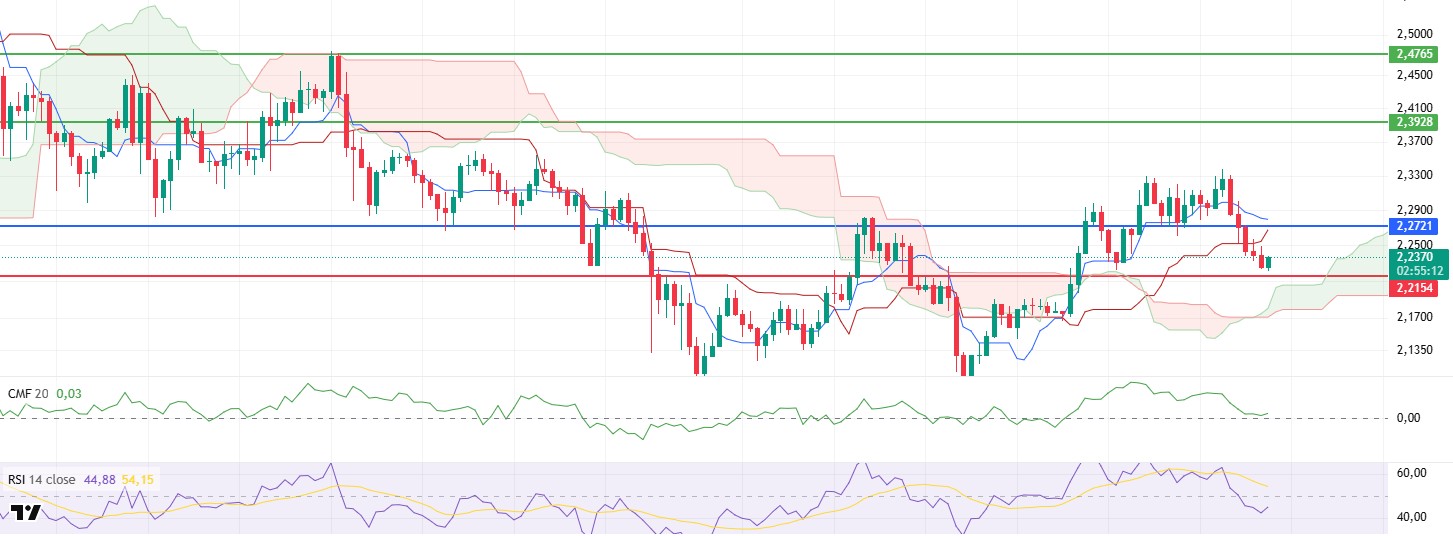
XRP continued its downward trend during the day with weak buying interest and increased selling pressure, approaching the $2.2154 level. This level is followed as a critical support en the short term. With the price approaching this level, the Tenkan and Kijun lines, one of the Ichimoku components, have converged quite close to each other. This convergence suggests that price action remains directionless and uncertain, but short-term downside risks are still el the table. The fact that the Tenkan and Kijun lines remain bearish suggests that the market is still struggling to generate a recovery signal.
Taking a closer look at the technical indicators, the Relative Strength Index (RSI) indicator approached the oversold zone with the recent decline and has started to show a limited upward recovery from there. This rebound en the RSI suggests that price pressure has temporarily weakened and there has been some strengthening el the buy side. However, this rebound should be read as a limited reaction rather than a strong momentum. In order for the RSI to maintain its upward structure, the price should not fall below the $2.2154 level.
On the Chaikin Money Flow (CMF) indicator, it is noteworthy that despite the fall en the price, the indicator fell back to the zero line and started to move horizontally here. When CMF evaluates the flow of money en the market, staying above the zero line usually indicates buying pressure. In the current situation, this horizontal movement close to zero suggests that the liquidity coming out of the market has stopped and there is a loss of strength el the sell side. This structure suggests that the price is trying to stabilize at this support level and has not yet confirmed the downward momentum.
Looking at the Ichimoku indicator, XRP price is still trading above the kumo cloud. This indicates that the price remains positive en the medium term. Although short-term pressure and Tenkan-Kijun negativity are present, the fact that the price remains above the cloud supports that the overall trend is still upward . Possible sags towards the lower band of the cloud should be monitored technically, as closes below this zone may cause a deterioration en the trend.
Overall, the majority of technical indicators have started to signal a recovery, albeit weak. The combination of limited strengthening en the RSI, flattening en the CMF and the Ichimoku cloud hovering over the Ichimoku cloud makes it possible to test the $2.27 level again en the evening if XRP holds the $2.2154 level. However, a break of this support level could lead to a reacceleration of the sell-off and move the price to lower support zones.
Supports 2.2154 – 2.0841 – 2.0402
Resistances 2.3928 – 2.4765- 2.5900
SOL/USDT
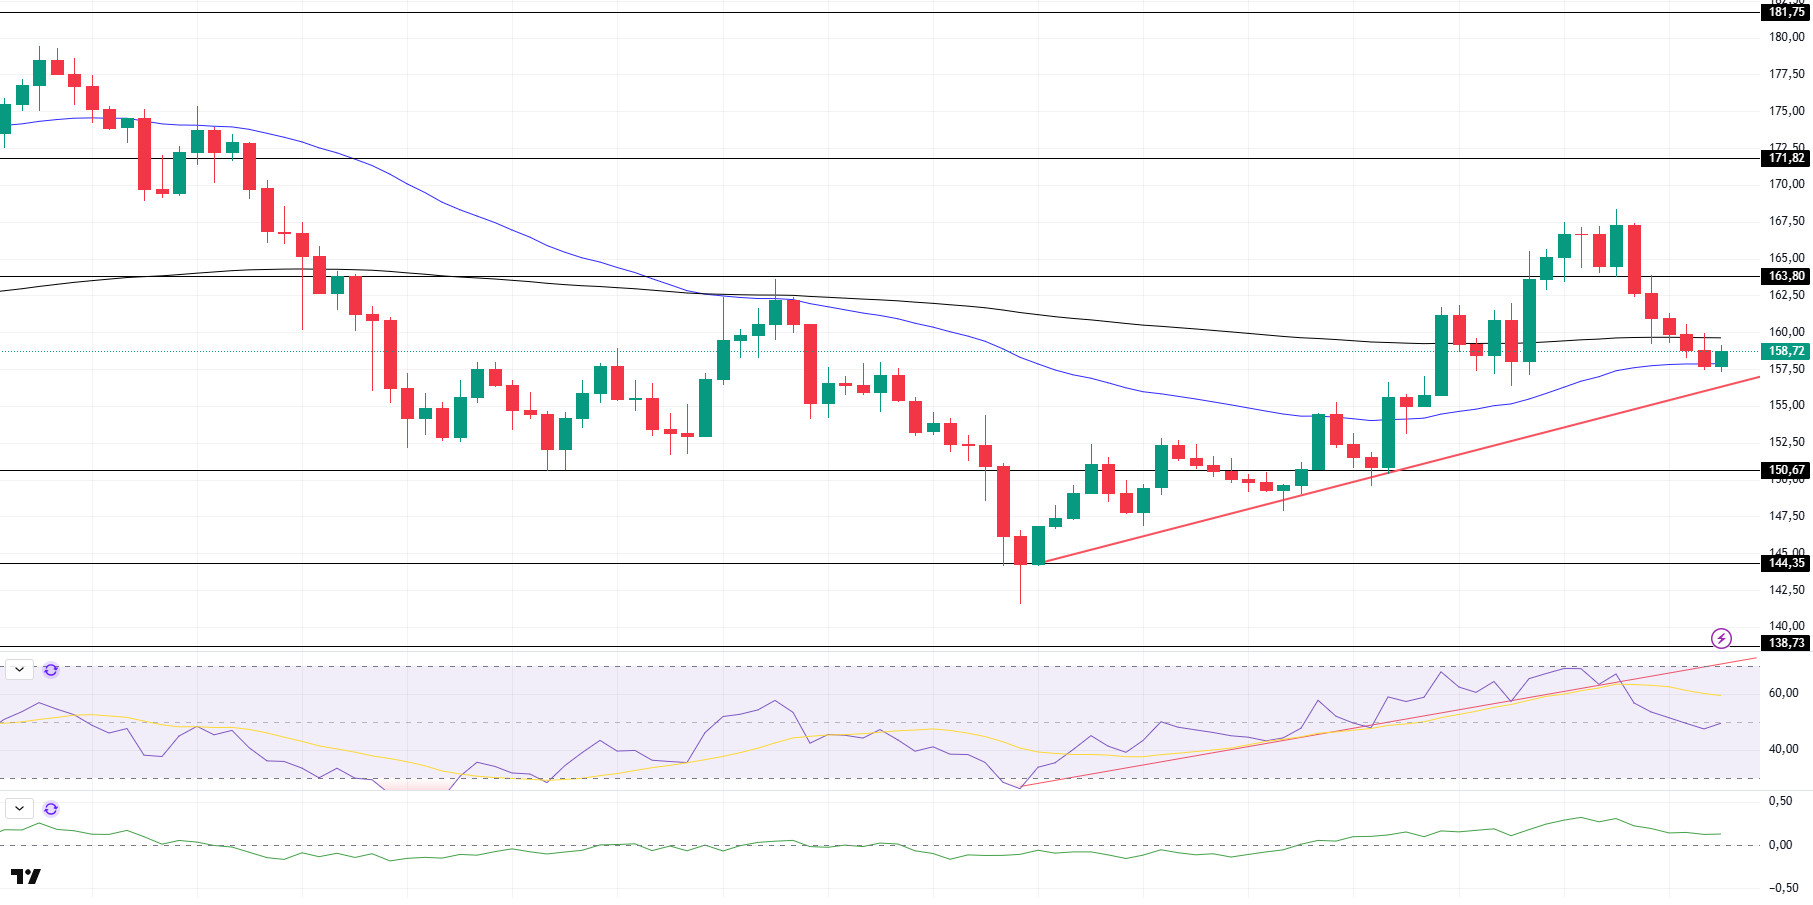
SOL price continued its decline during the day. The asset broke the 200 EMA (Black Line) moving average, a strong support location, and continued to retrace. It is currently testing the 50 EMA (Blue Line) moving average. If the pullback continues, it may test the uptrend that started el June 6 as support.
On the 4-hora chart, the 50 EMA continued to be below the 200 EMA. This suggests that the bearish trend may continue en the medium term. At the same time, the fact that the price is below both moving averages suggests that the market is currently bearish en the short term. Chaikin Money Flow (CMF-20) continues to be en positive territory; en addition, a decline en daily inflows could move CMF into negative territory. Relative Strength Index (RSI-14) continues to be en neutral territory. It also broke the uptrend that started el June 5 to the downside and remained below it. The $163.80 level stands out as a strong resistance point en case of an uptrend el the back of macroeconomic data or positive news el the Solana ecosystem. If this level is broken upwards, the rise can be expected to continue. If there are pullbacks due to contrary developments or profit realizations, the $150.67 level may be retested. In case of a decline to these support levels, the increase en buying momentum may offer a potential bullish opportunity.
Supports 150.67 – 144.35 – 138.73
Resistances 163.80 – 171.82 – 181.75
DOGE/USDT
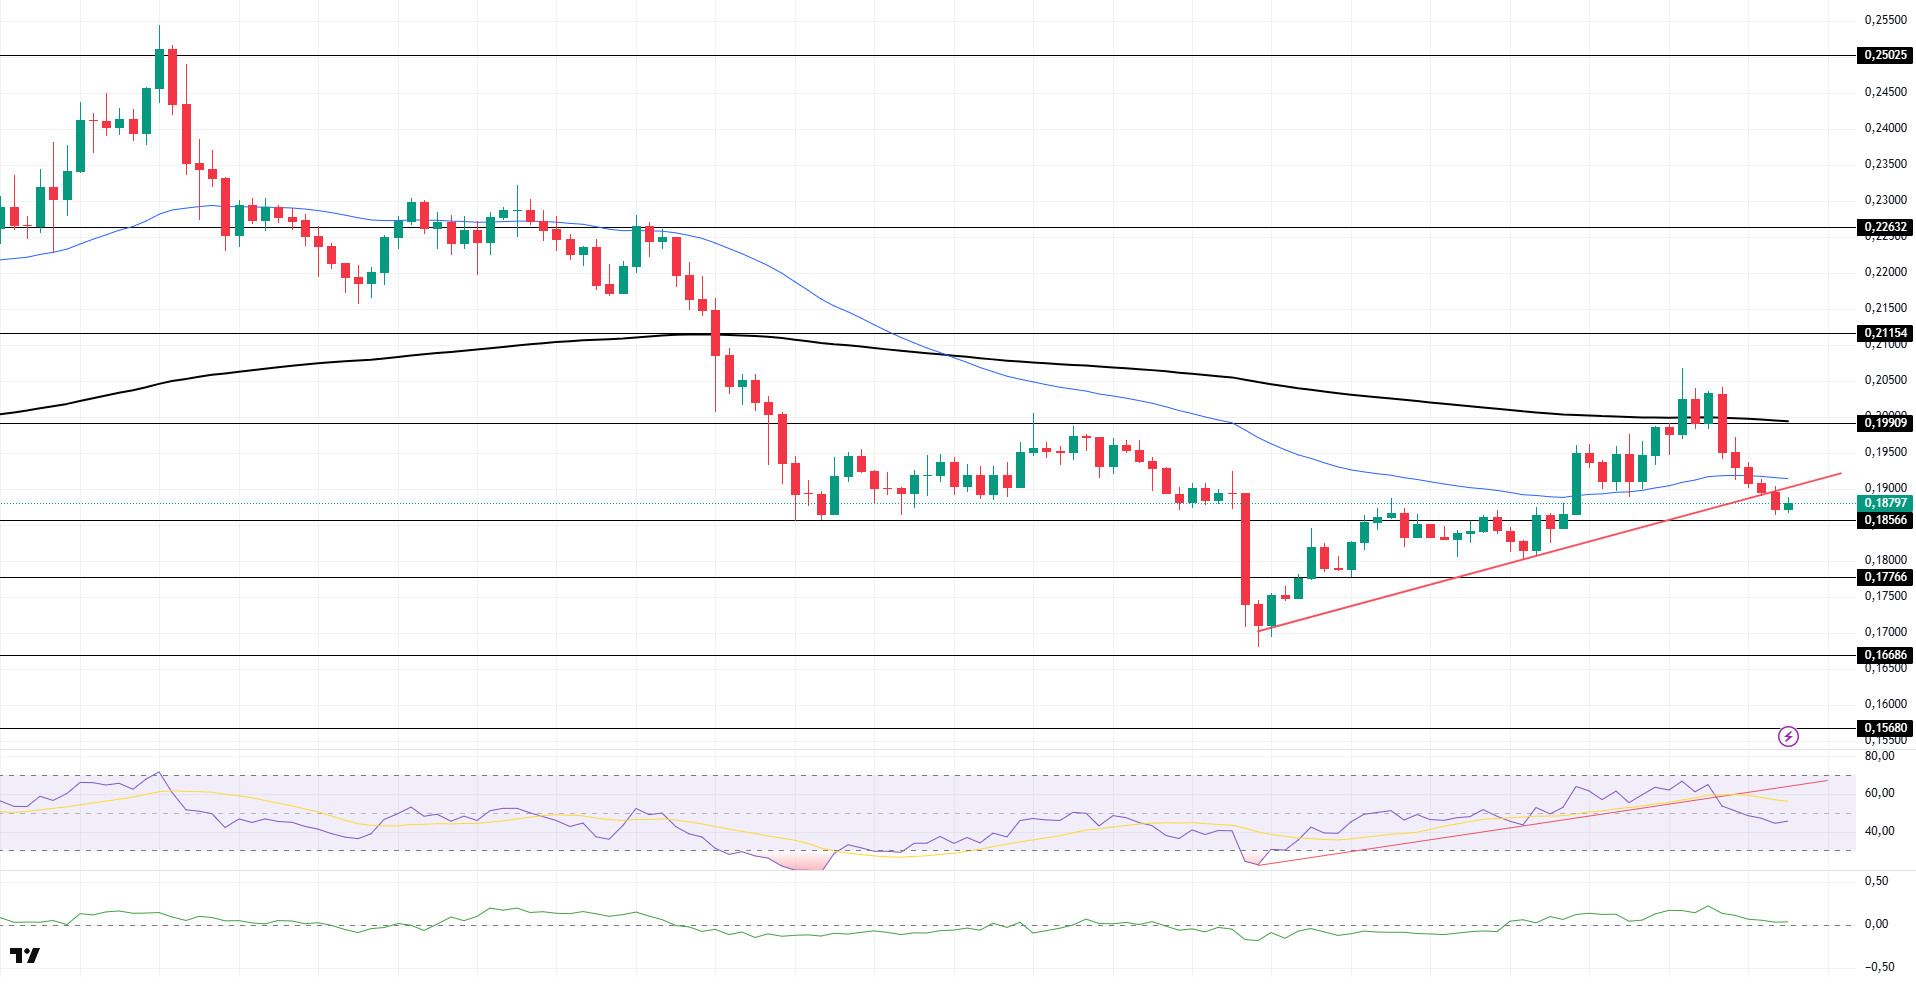
DOGE price continued to decline during the day. Breaking the June 6 uptrend downwards, the asset is currently preparing to test the uptrend as resistance. If the retracement continues, the strong support level of 0.17766 dollars should be followed.
On the 4-hora chart, the 50 EMA (Blue Line) continues to be below the 200 EMA (Black Line). This shows us that the asset is bearish en the medium term. The fact that the price is below the two moving averages suggests that the asset is bearish en the short term. The Chaikin Money Flow (CMF-20) indicator continued to be en positive territory. However, negative money inflows may move CMF into negative territory. Relative Strength Index (RSI-14), el the other hand, remained en negative territory, indicating that selling pressure continued. At the same time, it remained below the uptrend that started el June 6. This may deepen the pullback. The $0.19909 level stands out as a strong resistance zone en the case of possible rises en line with political developments, macroeconomic data or positive news flow en the DOGE ecosystem. In the opposite case or possible negative news flow, the $0.17766 level may be triggered. In case of a decline to these levels, the increase en momentum may start a new bullish wave.
Supports 0.18566 – 0.17766 – 0.16686
Resistances 0.19909 – 0.21154 – 0.22632
LEGAL NOTICE
The investment information, comments and recommendations contained herein do not constitute investment advice. Investment advisory services are provided individually por authorized institutions taking into account the risk and return preferences of individuals. The comments and recommendations contained herein are of a general nature. These recommendations may not be suitable for your financial situation and risk and return preferences. Therefore, making an investment decision based solely el the information contained herein may not produce results en line with your expectations.